Embed Size (px)
Citation preview

Sound System Design Reference Manual
Also, local acoustical conditions may existwhich are not taken into account by statistical theoryand, therefore, not covered by the Peutz findings orany of the other equations we have studied. Suchlocalized dead spots or zones of interference maynot be discovered until the sound system is installed.In large reverberant spaces, sufficient flexibilityshould always be built into the sound system designto allow for such surprises.
The effect of masking by unwanted backgroundnoise has been touched on only briefly in thissection. Such unwanted noise may be produced bysound from the outside environment, by noisy airhandling equipment, by noisy backstage mechanicalequipment or by the audience itself. For goodlistening conditions, the level of ambient noise asmeasured on the “A” scale should be at least 10 dBbelow the desired signal. Since the optimum level forreproduced speech in the absence of strongbackground noise is 65 - 70 dB(A) this means thatbackground noise with a full audience should notexceed 55 dB(A). In auditoriums and concert halls,acoustical designers normally attempt to reducebackground noise in an empty house to a level notexceeding 25 dB(A). In a church or meeting hall, themaximum tolerable background noise for an emptyroom is about 40 dB(A).
A sound reinforcement system cannot beturned up indefinitely. In many situations it is difficultenough to achieve a useful operating level of 60 - 65dB(A) without feedback. It is easy to see, therefore,that the presence of excessive background noise canrender an otherwise good sound reinforcementsystem unsatisfactory.
As an example of how the Peutz analysis candictate the type of sound system to be used, let usconsider a reinforcement system to be used in a largereverberant church. Details are shown in Figure 6-14.
Let us assume that the reverberation time is 4seconds at mid-frequencies and that the designer’sfirst choice is a single-point loudspeaker array to beplaced high above the chancel. Coveragerequirements pretty much dictate the directionalcharacteristics of the array, and let us assume thatthe array will consist of two JBL Bi-Radial horns: 20°by 40° for far coverage, and 90° by 40° for nearcoverage. What we wish to calculate is the direct-to-reverberant ratio at selected points in the audiencearea to determine if the Peutz criteria for acceptableintelligibility can be met. The most direct way of doingthis is to calculate the total reverberant level in theroom for a given power input to each horn andcompare it with the direct sound coverage providedby each horn over its coverage angle.
Figure 6-13. Probable intelligibility as a function of reverberation timeand direct-to-reverberant sound ratio
6-13

Sound System Design Reference Manual
The analysis shown in Figure 6-14 indicatesthat when each of the two horns is powered by onewatt, the reverberant field in the room (read directlyfrom Figure 5-21) is 94 dB-SPL. The direct field levelprovided by each horn over its coverage angle isabout 85 dB-SPL. This produces a direct-to-reverberant ratio of -9 dB, and an inspection ofFigure 6-13 tells us that the system will havemarginal intelligibility. Note that for 4 seconds ofreverberation time, the direct-to-reverberant ratioshould be no less than about -7 dB if acceptableintelligibility is to be expected. This simple analysishas told us that, on paper, we have designed asound system which will likely fail to satisfy thecustomer.
Had the system consisted of a single horn,knowledge of its on-axis DI and Q could have ledquickly to a determination of critical distance, and thedirect-to-reverberant ratio could have been scaledfrom D
C. However, for the composite array analyzed
here, there is no single value of DI or Q which can beused, and a direct calculation of the overallreverberant level, using what we know about theefficiency of the transducers, and making acomparison with the direct field, based on thesensitivities of the transducers, is the quickest way tosolve the problem.
But the question remains: What kind of systemwill work in this large resonant room? Clearly, adistributed system is called for. In such a system, anumber of lower-powered loudspeakers are placedon columns on each side of the church, eachloudspeaker covering a distance of perhaps no morethan 5 or 6 meters. In this way, the direct-to-reverberant ratio can be kept high. If such a systemis further zoned into appropriate time delays, theeffect will be quite natural, with subjective sourcelocalization remaining toward the front of the listeningspace. Details of this are shown in Figure 6-15.
Again, we calculate the total reverberant leveland compare it with the longest throw eachloudspeaker will be called upon to handle. There are14 loudspeakers, 7 on each side. Let us assume thatthe efficiency of these loudspeakers is 1.2% and thattheir sensitivity is 95 dB, 1 watt at 1 meter. Feedingone watt into each loudspeaker results in a totalacoustical power of 14 x .012, or 0.17 watt. Againusing Figure 5-21, we observe that the reverberantlevel will be 92 dB-SPL. The longest throw eachloudspeaker has to cover is, say, 4 meters. Since the1-watt, 1-meter sensitivity is 95 dB, the direct field foreach loudspeaker will be 12 dB lower, or 83 dB.
Figure 6-14. Analysis of intelligibility criteria
6-14

Sound System Design Reference Manual
Thus, the direct-to-reverberant ratio will be83-92, or -9 dB. This is still not good enough, but wemust remember that more than half the listeners willbe closer to a loudspeaker than 4 meters. Anothervery important point we have not yet considered isthe fact that the distributed loudspeakers are aimedalmost totally into the audience, with its absorptioncoefficient considerably greater than α of .12. This isthe appropriate time to use R’ instead of R in ourcalculations.
Calculating R’ based upon an α’ of .95 for theaudience area in the 1 kHz band:
R’ = Sα/(1 - α’) = 375/.05 = 7500 m2.
Recalculating the reverberant level from Figure5-21, we get 80 dB-SPL. The new direct-to-reverberant ratio is 83 - 80, or +3 dB, and the systemwill be quite workable.
Will the reverberant level really be only 80 dB?In actuality, we might observe something a littlehigher than 80 dB, but not enough to alter ouranalysis significantly.
We can also ask the question of whether ouranalysis using R’ would have materially affected theperformance of the central array system. A rigorousanalysis would be a little tedious, but we can make asimplifying assumption. Let us assume that half ofthe direct sound from the central array was incidenton the audience with its .95 absorption coefficient.Let us round this off and call it 1.0 instead, resultingin no sound at all being reflected from the audience.This would only lower the reverberant level in theroom by 3 dB, hardly enough to make the direct-to-reverberant ratio workable.
More than any other we have carried out in thischapter, this analysis points up the multi-dimensionalcomplexity of sound system design. Again, we statethat there are no easy solutions or simple equations.Instead, there is only informed rational analysis andthoughtful balancing of many factors.
Figure 6-15. A distributed system in a large church
6-15

Sound System Design Reference Manual
The Role of Time Delay in SoundReinforcement
The preceding example mentioned time delayas a means of preserving naturalness in a distributedsystem. This comes about by way of the Haas (orprecedence) effect (5), which is illustrated in Figure6-16. If two loudspeakers are fed the same signal, alistener mid-way between them will localize thesource of sound directly ahead (A). At B, we haveintroduced a delay in one of the otherwise identicalchannels, and the listener will clearly localize towardthe earlier loudspeaker. At C. the leading signal hasbeen reduced in level, resulting in an effect of equalloudness at both loudspeakers. This has theapproximate effect of restoring the apparentlocalization to the center. While this tradeoff is not anexact one, the values shown in the graph at Dindicate the approximate trading value between leveland delay for equal loudness at both loudspeakers.
Figure 6-16E shows how delay is typicallyimplemented in sound reinforcement. Here, thatportion of the audience seated under the balconydoes not get adequate coverage from the centralarray. Small loudspeakers placed in the balcony soffitcan provide proper coverage only if they are delayedso that the sound arrives at the listeners in step withthat from the central array. In this way, the listenertends to localize the source of sound at the centralarray — not at the soffit loudspeakers. If the soffitloudspeakers are not delayed, listeners under thebalcony would localize sound directly overhead, andthose listeners just in front of the balcony would bedisturbed by the undelayed sound. In practice, thedelay is usually set for an additional 20 msec in orderto minimize comb filtering in the overlap zonebetween direct and delayed sound fields.
The ready availability of solid state digital delayunits has made time delay an indispensable elementin sound system design.
6-16
Fugure 6-16. The Haas, or precedence, effect

Sound System Design Reference Manual
System Equalization and PowerResponse of Loudspeakers
It is customary to equalize all professionalsound reinforcement systems for two reasons:overall response shaping and control of feedback.The overall response may be made smoother for amore natural effect through the use of broadbandequalization and through the proper choice of drivecomponents themselves. Where high system gain isrequired, narrow-band notch filters may successfullyremove the tendency of the system to “ring” atcertain frequencies. We will examine therequirements of broad-band equalization first.
6-17
A sound system is equalized by feeding pinknoise (equal power per octave) into the system andadjusting the system’s response to fit a preferredcontour at some point in the middle of the house. Thisprocedure is shown in Figure 6-17A. The responsecontour most often used today is shown at B.
At the point in the house where themeasurement is made, the reverberant fieldpredominates, and what we are shaping with theequalizer is actually the power response of theloudspeaker as influenced by boundary absorption inthe room. If the loudspeaker’s power response issmooth to begin with, then all is well. However, if, asin some older designs, the system’s power responseis irregular, then equalization will usually make thingsworse, as shown in Figure 6-18.
Figure 6-17. Sound system equalization procedure
Figure6-18. System equalization
Sound System Design Reference Manual
6-18
At A, we see the on-axis (solid curve) andpower (dotted curve) response of a 2-way systemmaking use of a ported LF horn unit and an oldertype HF radial horn. When such a system isequalized for smooth power response, as in the caseof the standard mid-house equalization procedure,then the on-axis, or direct field response of thesystem will have a couple of “bumps” in its response.This will have the effect of making both speech andmusic sound unnatural.
Now let us examine the case at B. Here, the LFpart of the system consists of a single 380 mm (15”)LF driver in a ported enclosure, and the HF horn is aJBL 2360 Bi-Radial. Note that the power responseand on-axis response very nearly lie over each other.Thus, the adjustment of the system out in the housewill result in both reverberant field response (powerresponse) and direct field response (on-axisresponse) tracking each other closely. Such a systemcan often be broad-band-equalized merely throughthe proper choice of components, dividing networkand transducer drive levels, requiring little, if any,added electronic equalization.
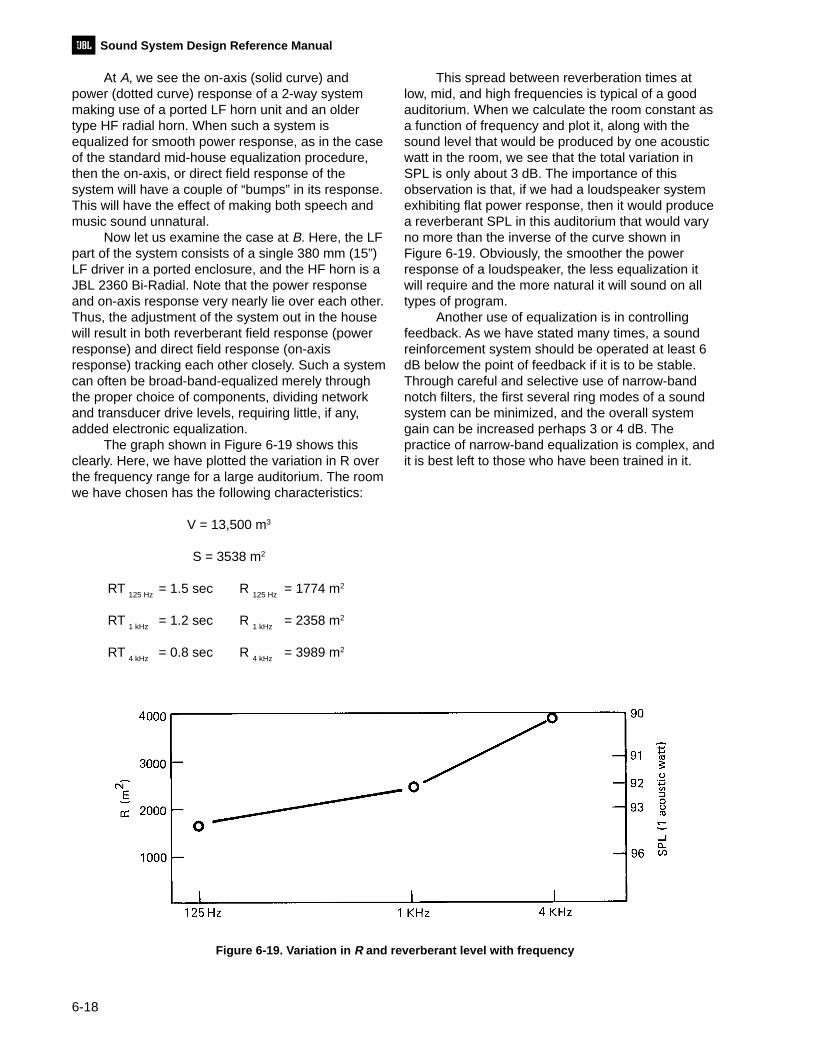
The graph shown in Figure 6-19 shows thisclearly. Here, we have plotted the variation in R overthe frequency range for a large auditorium. The roomwe have chosen has the following characteristics:
V = 13,500 m3
S = 3538 m2
RT 125 Hz
= 1.5 sec R 125 Hz
= 1774 m2
RT 1 kHz
= 1.2 sec R 1 kHz
= 2358 m2
RT 4 kHz
= 0.8 sec R 4 kHz
= 3989 m2
This spread between reverberation times atlow, mid, and high frequencies is typical of a goodauditorium. When we calculate the room constant asa function of frequency and plot it, along with thesound level that would be produced by one acousticwatt in the room, we see that the total variation inSPL is only about 3 dB. The importance of thisobservation is that, if we had a loudspeaker systemexhibiting flat power response, then it would producea reverberant SPL in this auditorium that would varyno more than the inverse of the curve shown inFigure 6-19. Obviously, the smoother the powerresponse of a loudspeaker, the less equalization itwill require and the more natural it will sound on alltypes of program.
Another use of equalization is in controllingfeedback. As we have stated many times, a soundreinforcement system should be operated at least 6dB below the point of feedback if it is to be stable.Through careful and selective use of narrow-bandnotch filters, the first several ring modes of a soundsystem can be minimized, and the overall systemgain can be increased perhaps 3 or 4 dB. Thepractice of narrow-band equalization is complex, andit is best left to those who have been trained in it.
Figure 6-19. Variation in R and reverberant level with frequency

Sound System Design Reference Manual
6-19
System Design Overview
There is a rational approach to indoor soundreinforcement system design, and it can be brokendown into the following steps:
1. Lay out the coverage requirements, generallystarting with a central array. Determine the driverequirements for each element in the array.
2. Calculate both direct field and reverberantfield levels at various parts of the audience area, andthen determine if their ratios, in combination with thereverberation time of the room, will result in adequateintelligibility. These calculations are most important inthe 1 kHz range, but they should also be made in the125 Hz and 4 kHz ranges as well. Determine therequirements for adequate gain, noting the value ofD
S that will be required in normal operation.
3. If the intelligibility criteria are met, then thesystem can be completed. If the intelligibility criteriaindicate an inadequate direct-to-reverberant ratio,consider the possibility of increasing R through theaddition of acoustical absorption in the room. Inexisting rooms, this may not be possible; however,for rooms still in the design phase, it may be possibleto increase the amount of absorption.
4. If a recalculation of the room parametersindicates that a central array will work, then thedesign can be completed. If not, the next step is todetermine the nature of a distributed system that willsatisfy the requirements of intelligibility. A centralarray can often be designed to cover just the frontpart of a room, with delayed loudspeakers coveringthe rear of the room. In marginal cases, this is likelyto be more satisfactory than an all-out distributedsystem.
The entire process described above has beenreduced to the flow chart shown in Figure 6-20.
Figure 6-20. Flow diagram for system design

Sound System Design Reference Manual

Sound System Design Reference Manual
7-1
Chapter 7: System Architecture and Layout
Introduction
Just as the building architect interprets a set ofrequirements into flexible and efficient living orworking spaces, the designer of a soundreinforcement system similarly interprets a set ofrequirements, laying out all aspects of the system inan orderly fashion. A full sound system specificationwill detail almost everything, including all equipmentchoices and alternatives, rack space requirements,wire gauges and markings, and nominal signaloperating levels. In addition, the electroacousticalaspects of the system will have been worked out wellahead of time so that there will be few surpriseswhen the system is turned on for the first time.
The consultant or design engineer lays out thebroad system parameters, but it is the soundcontractor who is responsible for all componentlayout and orderly completion of the system, alongwith documentation for usage as well asmaintenance. System architecture also addressessignal flow and nominal operating levels, consistentwith the requirements of the system. The bestdesigns are usually the simplest and moststraightforward ones.
In this chapter we will cover several designprojects, beginning with basic design goals andfundamental performance specifications. We will thenmove on to system descriptions and layout,suggesting ways that the specification can be met.We will concentrate on the electroacousticalproblems that are fundamental to each case study.By way of review, we will first discuss a few basicaudio engineering subjects, beginning with anabbreviated signal flow diagram for a relativelysimple speech reinforcement system.
Typical Signal Flow Diagram
Assume that we have the followingrequirements:
1. Up to ten microphones may be needed atdifferent locations.
2. The system is to be used primarily forspeech reinforcement.
3. The system shall be able to produce peaklevels up to 85 dB-SPL in all parts of the house underall speech input conditions, including weak talkers.The room noise level is about 25 dB(A).
The most basic interpretation of theserequirements tells us the following:
1. A small Soundcraft or Spirit console shouldsuffice for all input configurations and routing control.
2. A single central array is the preferred systemtype, based on the desire for most natural speechreproduction. The array may be specified usingindividual HF and LF components; alternatively, anappropriate full-range system with integral riggingcapability may be specified, as we will show here.
3. Both biamplification and system responseequalization are recommended, and this suggeststhat a digital loudspeaker controller be used forfrequency division, time alignment, and systemresponse equalization.
Note that there are many points in the systemwhere we can set or change gain. There is alwaysconsiderable gain overlap in the electronic devicesused in sound system work. The purpose of this is toallow for a great variety of input conditions as well asto allow the equipment to be configured in differentways, as required. It is critical that the designerspecify a nominal setting of each gain control,locking off, when possible, those controls that will not— or should not — be altered during normal systemuse. This important setting of gain relationshipsshould be based on the absolute requirement thatthe input noise floor of the system should not bedegraded later in the chain, and that no early stageof amplification should overload before the outputpower amplifier overloads. In our exercise here, we
Sound System Design Reference Manual
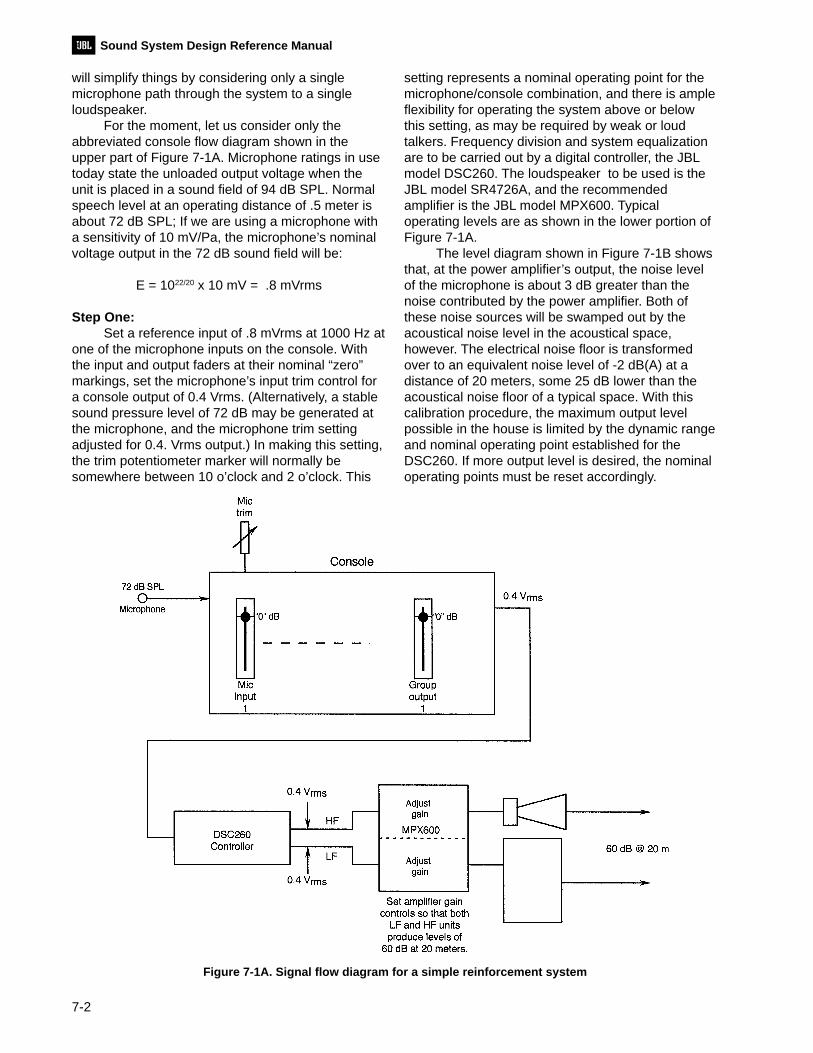
will simplify things by considering only a singlemicrophone path through the system to a singleloudspeaker.
For the moment, let us consider only theabbreviated console flow diagram shown in theupper part of Figure 7-1A. Microphone ratings in usetoday state the unloaded output voltage when theunit is placed in a sound field of 94 dB SPL. Normalspeech level at an operating distance of .5 meter isabout 72 dB SPL; If we are using a microphone witha sensitivity of 10 mV/Pa, the microphone’s nominalvoltage output in the 72 dB sound field will be:
E = 1022/20 x 10 mV = .8 mVrms
Step One:Set a reference input of .8 mVrms at 1000 Hz at
one of the microphone inputs on the console. Withthe input and output faders at their nominal “zero”markings, set the microphone’s input trim control fora console output of 0.4 Vrms. (Alternatively, a stablesound pressure level of 72 dB may be generated atthe microphone, and the microphone trim settingadjusted for 0.4. Vrms output.) In making this setting,the trim potentiometer marker will normally besomewhere between 10 o’clock and 2 o’clock. This
setting represents a nominal operating point for themicrophone/console combination, and there is ampleflexibility for operating the system above or belowthis setting, as may be required by weak or loudtalkers. Frequency division and system equalizationare to be carried out by a digital controller, the JBLmodel DSC260. The loudspeaker to be used is theJBL model SR4726A, and the recommendedamplifier is the JBL model MPX600. Typicaloperating levels are as shown in the lower portion ofFigure 7-1A.
The level diagram shown in Figure 7-1B showsthat, at the power amplifier’s output, the noise levelof the microphone is about 3 dB greater than thenoise contributed by the power amplifier. Both ofthese noise sources will be swamped out by theacoustical noise level in the acoustical space,however. The electrical noise floor is transformedover to an equivalent noise level of -2 dB(A) at adistance of 20 meters, some 25 dB lower than theacoustical noise floor of a typical space. With thiscalibration procedure, the maximum output levelpossible in the house is limited by the dynamic rangeand nominal operating point established for theDSC260. If more output level is desired, the nominaloperating points must be reset accordingly.
Figure 7-1A. Signal flow diagram for a simple reinforcement system
7-2

Sound System Design Reference Manual
7-3
Figure 7-1B. detailed level diagram showing noise levels, nominal operating levels,and maximum output levels of each device

Sound System Design Reference Manual
Step Two:We now have to determine what the nominal
operating level of the system should be for thefarthest listeners, which we will assume are some 20meters away from the loudspeaker. Let us furtherassume that the reverberation time in the room is nogreater than 1.5 seconds in the range from 250 Hz to2 kHz and that the average noise level room is in therange of 25 dB(A). Referring to Figure 7-2, we can
see that for an ambient noise level in the 25 dB(A)range, the EAD for a lowered voice would be about2 meters, or a speech level of about 60 dB SPL.
For a direct field level of 60 dB at a distance of20 meters, the LF section of the loudspeaker willrequire a signal input of 0.1 watts (into 8 ohms). Inthe biamplification mode the HF section will requireconsiderably less than 0.1 watt input in order toreach the desired level at a distance of 20 meters.
7-4
Figure 7-2. EAD versus A-weighted noise levels
Sound System Design Reference Manual
Step Three:For a simulated microphone input of 72 dB
SPL, adjust the HF and LF outputs of the DSC260for nominal levels of 0.4 Vrms. Then, advance theLF gain control on the MPX600 amplifier until areference level of 60 dB SPL has been reached at adistance of 20 meters. Following this, increase thelevel of the HF section to reach the same value.Details here are shown in Figure 7-1.
Set up in this manner, there will be adequateheadroom, in the console, controller, and poweramplifier to handle nominal speech levels as well aslevels up to 25 dB higher, should this ever bedeemed necessary.
Amplifier and Loudspeaker PowerRatings
A persistent question is: what amplifier powerrating do I choose for use with a loudspeaker of agiven power rating? The detailed answer isaddressed in JBL’s Technical Note Volume 1,Number 16A; here, we will only summarize thoserecommendations:
1. For systems that will be stressed with fullamplifier output for long periods of time, werecommend that the amplifier’s continuous outputrating be chosen to be equal to the loudspeaker’sinput power rating. Situations of this sort occurprimarily in music reinforcement, where a constant,wide-band signal predominates.
2. For applications, such as speechreinforcement, where there is an operator whocontrols levels carefully, we can confidentlyrecommend an amplifier with output capability that istwice (3 dB greater) than the loudspeaker’scontinuous rating. The rational here is that peakpower requirements, often slightly in excess of theloudspeaker’s continuous rating, can be handledwith no problem, and it makes sense to provideamplification accordingly.
3. For certain critical monitoring applications,as in recording studios or film postproductionenvironments, amplifiers may be chosen that candeliver four-times (6 dB greater) power than theloudspeaker can withstand on a long-termcontinuous basis. The rational here is that theloudspeakers can ordinarily handle midrange andhigh frequency peaks of short duration that are muchhigher in instantaneous power than the long-termcontinuous rating of the loudspeaker.
In most speech reinforcement applications,condition 2 above will apply. Note however that thereis no absolute necessity to use the larger amplifierunless high acoustical peak levels are anticipated.
Wire Gauges and Line Losses
In modern sound system engineering it isstandard practice to locate power amplifiers as closeto the loudspeaker loads as is possible so that linelosses become negligible. However, in someapplications this is not possible, and the designermust consider line losses, choosing wire gauges thatwill keep to an acceptable minimum.
Figure 7-3 shows the fundamental calculations.Note that there are actually two sources of loss: theloss in the wire itself and the loss due to theimpedance mismatch that the long wire run cancause. For example, let us assume an input signal of8 volts into a nominal load of 8 ohms. With no linelosses the power dissipated in the load would be 8watts (E2/R
L).
Let us assume that the wire run is 80 metersand that AWG #10 wire is used. Using the table, wecan see that the wire resistance in one leg will be:
R = 80/300 = 2.6 ohms
and the total round trip resistance in the wire run willbe twice that value.
The voltage across the 8-ohm load will then be:
EL = 8/[8 + (2 x .26)] x 8 = 7.5 volts,
and the power dissipated in the load will be:
PL = (7.5)2/8 = 7 watts
The power loss is then:
Loss (dB) = 10 log (7/8) = 0.58 dB
The general equation for the loss in dB is:
Loss dB = 20 logR
R + 2RL
L 1
where Rl is the resistance in each of the two wire
legs, and RL is the resistance of the load.
As given here, the loss consists of two terms:the actual loss generated in the wire run and theadded loss incurred due to the impedance mismatchbetween the intended load and the actual load.
Good engineering practice dictates that lossesat the load be held to 0.5 dB or less.
7-5

Sound System Design Reference Manual
Constant Voltage Distribution Systems(70-volt lines)
Many distribution systems in the United Statesmake use of the 70-volt line for powering multi-loudspeaker paging systems. In Europe the 100-voltline is common. In either system, the full outputpower of the driving amplifier is available at a linevoltage of 70 Vrms or 100 Vrms, respectively.
In placing loads across the line, the designengineer simply keeps a running count of the numberof watts of power drawn from the line. There is noneed to calculate the aggregate load impedance atany point in the process. When the total number ofwatts drawn from the line is equal to the power ratingof the amplifier, then the line is fully loaded andproperly matched.
Figure 7-4 shows details of a 70-volt distributionsystem. The maximum load on the amplifier istransformed so that the applied voltage will be 70Vrms. This then will correspond to a total transformedload impedance, Z
L, equal to 5000/P
O, where P
O is
the maximum power output of the amplifier.Individual loads are placed across the amplifier
in parallel using line-to-loudspeaker distributiontransformers that have a 70-volt primary and atapped secondary designated in watts. The system
designer (or installer) merely has to keep a runningtally of watts drawn from the line, and when thenumber of watts equals the continuous output powerrating of the amplifier, then the system is fully loaded.Ordinarily, no additional loads will be placed acrossthe line, but there is some leeway here.
The alternative to 70-volt distribution is tolaboriously keep track of combined load impedancesin parallel, a big task. Details of a 70-volt transformerare shown in Figure 7-5.
In Europe, a 100-volt transmission system,derived in a similar manner, is used.
Low Frequency Augmentation —Subwoofers
Whether in the cinema or in open spaces, LFaugmentation systems are becoming popular forspecial effects. For indoor applications manyacoustical engineers calculate the reverberant soundpressure level that can be produced by a transducer,or group of transducers, operating continuously overan assigned low frequency band, normally from 25Hz to about 80 Hz. The equation for determining thereverberant level is:
7-6
Figure 7-3. Calculation of resistance in wire runs

Sound System Design Reference Manual
LREV
= 126 + 10 log WA - 10 log R,
where WA is the continuous acoustical power outputfrom the transducer and R is the room constant in m2.
In using this equation, we assume that thespace is fairly reverberant at very low frequenciesand that the value of absorption coefficient at 125 Hz(the lowest value normally stated for materials) willbe adequate for our purposes.
Some design engineers prefer to make actualdirect field calculations for one or more subwooferunits at a distance, say, of two-thirds the length of theenclosed space. In large motion picture spaces, bothsets of assumptions yield results that are usuallywithin 5 dB of each other.
The phenomenon of mutual coupling alwayscomes to our aid in increasing the power output ofcombined subwoofer units. Figure 7-6A shows the
7-7
Figure 7-4. Details of a 70-volt transmission system
Figure 7-5. Details of a typical 70-volt distribution transformer
Sound System Design Reference Manual
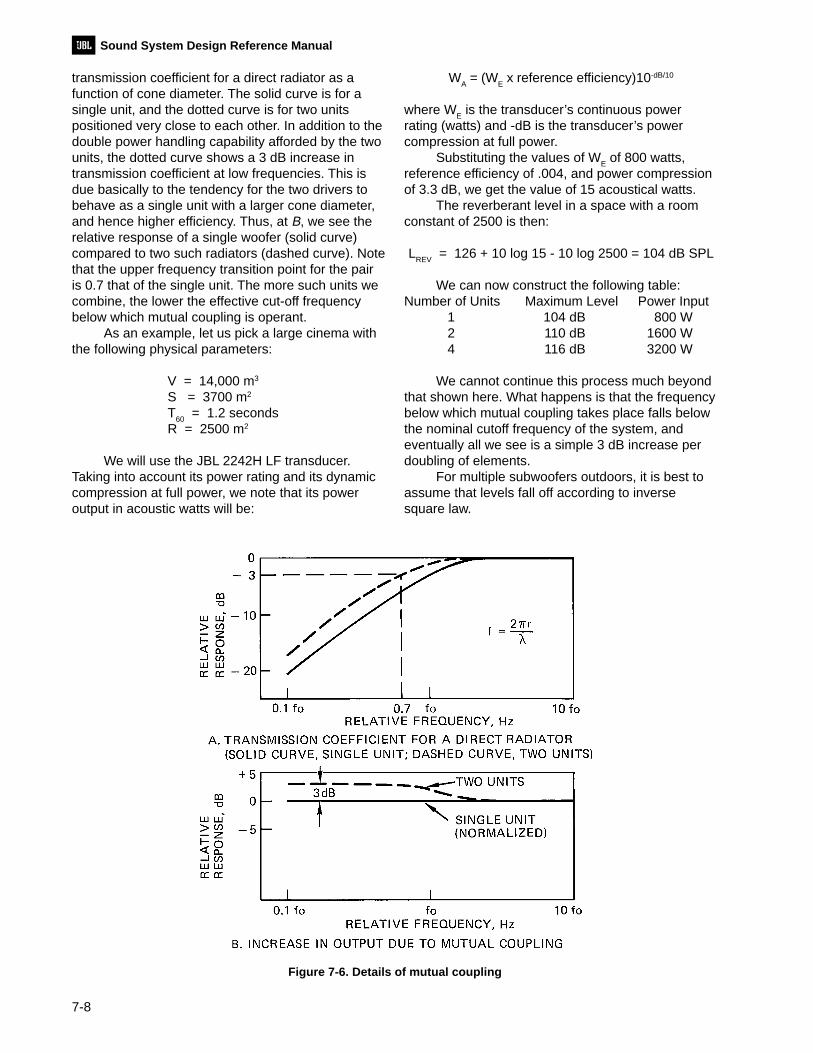
transmission coefficient for a direct radiator as afunction of cone diameter. The solid curve is for asingle unit, and the dotted curve is for two unitspositioned very close to each other. In addition to thedouble power handling capability afforded by the twounits, the dotted curve shows a 3 dB increase intransmission coefficient at low frequencies. This isdue basically to the tendency for the two drivers tobehave as a single unit with a larger cone diameter,and hence higher efficiency. Thus, at B, we see therelative response of a single woofer (solid curve)compared to two such radiators (dashed curve). Notethat the upper frequency transition point for the pairis 0.7 that of the single unit. The more such units wecombine, the lower the effective cut-off frequencybelow which mutual coupling is operant.
As an example, let us pick a large cinema withthe following physical parameters:
V = 14,000 m3
S = 3700 m2
T60
= 1.2 secondsR = 2500 m2
We will use the JBL 2242H LF transducer.Taking into account its power rating and its dynamiccompression at full power, we note that its poweroutput in acoustic watts will be:
WA = (W
E x reference efficiency)10-dB/10
where WE is the transducer’s continuous power
rating (watts) and -dB is the transducer’s powercompression at full power.
Substituting the values of WE of 800 watts,
reference efficiency of .004, and power compressionof 3.3 dB, we get the value of 15 acoustical watts.
The reverberant level in a space with a roomconstant of 2500 is then:
LREV
= 126 + 10 log 15 - 10 log 2500 = 104 dB SPL
We can now construct the following table:Number of Units Maximum Level Power Input
1 104 dB 800 W2 110 dB 1600 W4 116 dB 3200 W
We cannot continue this process much beyondthat shown here. What happens is that the frequencybelow which mutual coupling takes place falls belowthe nominal cutoff frequency of the system, andeventually all we see is a simple 3 dB increase perdoubling of elements.
For multiple subwoofers outdoors, it is best toassume that levels fall off according to inversesquare law.
7-8
Figure 7-6. Details of mutual coupling

Sound System Design Reference Manual
Case Study A: A Speech and MusicSystem for a Large Evangelical Church:
1. Basic Description and Specifications:The fan shaped architectural design shown in
Figure 7-7 is common for modern evangelicalchurches in that it accommodates many people, allseating positions with good sightlines. The majoracoustical problem is likely to be the curved front
fascia of the balcony and the curved back wall itself.If not properly treated, these surfaces can causesevere reflections back to the platform. In manycases, such spaces are designed with anoverabundance of absorbing material, making theroom quite dead. There is then a need for a veryrobust speech-music reinforcement system toprovide a feeling of ambience and acousticalenvelopment.
7-9
Figure 7-7. Evangelical church, plan and sections views

Sound System Design Reference Manual
The system consists of a central array of left,center, and right stereophonic music channels;speech will be reinforced over the center channelonly. Delayed coverage for the balcony area will beprovided by a ring of seven flown loudspeakers, andunder-balcony coverage will be augmented by a ringof fifteen soffit mounted loudspeakers. The mainarray over the platform should be designed fornominal horizontal coverage in excess of 120degrees. If a CADP2 analysis shows they areneeded, side and front fill loudspeakers may beadded to increase coverage in those areas of themain floor.
The main stereo array is intended to coverprimarily the main floor and first few rows under thebalcony. Coverage of the balcony area will beessentially monophonic, with the same signal fed toall of those loudspeakers.
The main stereo loudspeaker systems shouldbe capable of extended bandwidth at both low andhigh frequencies. Music levels of 105 dB areexpected on the main floor.
2. Exercises:2.1 Main Arrays:
1. Specify the elements in each of the threemain arrays and determine the power needed.2.2 First Delay Ring:
1. Specify the elements needed, powerrequired, and distribution method.2.3 Second Delay Ring:
1. Specify the elements needed, powerrequired, and distribution method.
3. Suggested Answers to Exercises:3.1 Main Arrays.
There are two basic approaches in designingthe main arrays. A completely custom system may beassembled with individually fabricated low and mid-frequency enclosures. The benefit in this approach isthat the HF components can be kept tightly clusteredtogether with a minimum of interference amongthem. However, the attendant costs of rigging maymake this approach unreasonably expensive.
7-10
Figure 7-8. Electrical diagram of the main array

Sound System Design Reference Manual
The other approach is to use pre-existingbuilding blocks, such as the SP225-9 system.Specifically, four of these systems can be arrayedwith sufficient space between them for good stereopresentation and splayed to produce an includedcoverage angle of 135°. Rigging is integral in the SPSeries, so that problem is solved. A center pair ofSP225-9 units should be located side by side andsplayed along their common back angle to give 120°coverage. This channel is primarily for speech, butmay be used as well as a stereo center channel formusic. The remaining two SP225-9 units will be usedfor left and right stereo presentation.
All units will have a nominal downwardelevation angle of about 60°, and the average throwto the main floor is 10 meters. Level calculations areas follows:
Level Power Distance100 dB 1 W 1 meter131 dB 1200 W 1 m111 dB 1200 W 10 m
In this case, we are powering the two LF unitsin each SP225-9 as a parallel (4 ohm) load to bedriven by one section of a MPX1200 amplifier.
7-11
Figure 7-9. Electrical diagram of delayed systems

Sound System Design Reference Manual
The three HF sections in each main arrayshould be powered by one section of an MPX600amplifier (200 watts into 16 ohms).
Each one of the four main arrays should alsohave an SP128S subwoofer module. These wouldbe powered the same way as the LF sections of theSP128S units. Level calculations are given:
Level Power Distance102 dB 1 W 1 meter133 dB 1200 W 1 m113 dB 1200 W 10 m
The electrical diagram for the main array isshown in Figure 7-8.
3.2 Delay Rings:The first delay ring of loudspeakers should be
composed of fairly robust loudspeakers, such as the8340A. Each one of these eight loudspeakers has afar throw range of about 6 meters and canaccommodate 150 watts input. We can calculate thelevel output of each one as follows:
Level Power Distance96 dB 1 W 1 meter
118 dB 150 W 1 m102 dB 150 W 6 m
As an ensemble, these eight loudspeakers willprovide added high frequency coverage of thebalcony seats, ensuring good articulation.
The under balcony soffit system consists of 16transducers located 2 meters above the seatedlistener’s ear height. The model 2142 has asensitivity of 97 dB and a power rating of 90 watts.A seated listener directly under one of thesetransducers, if it is powered by 1 watt, will hear alevel of 91 dB. A listener mid-way between a pair ofthem will hear a level of about 90 dB. The 90-wattper transducer rating means that peak levels ofabout 110 dB can be developed under the balcony.
Case Study B: A Distributed SpeechReinforcement System for a LargeLiturgical Church
1. General Information and Basic Performancespecifications:
The system to be studied here is typical of whatmay be found in just about every large religiousedifice in Europe and in many large cities in the U. S.The plan and front section views are shown in Figure7-10. The building under consideration here has aninternal volume of 12,000 cubic meters and surfacearea of 4000 square meters. A mid-band emptyhouse reverberation time of 2.5 seconds indicates avalue of 800 square meters of absorption units (Sα),as extrapolated in Figure 5-10.
Our major concerns with a system in such aspace as this are the net speech direct-to-reverberant ratio and the reverberation time itself.Each loudspeaker will contribute to the overallreverberant level behind the amplified speech, andour first step is to determine the number ofloudspeakers that will be required to cover the entireseating area. Studying the plan view of the building,we can see that 8 loudspeakers will cover thetransept seating, while 10 systems will cover thenave seating.
2. Analysis:The longest “throw” that will be required of any
single loudspeaker is to cover a listener seated atthe center aisle, a distance of about 7 meters. Letus now specify a JBL Control 28 and power it toproduce a level of 85 dB at a distance on-axis of 7meters.
We can do this directly by setting up the familiarlevel/power/distance chart as follows:
Level Power Distance92 dB 1 W 1 meter75 dB 1 W 7 m85 dB 10 W 7 m
We now want to make an estimate of thereverberant level that will exist in the room when thedirect sound from a single loudspeaker at the listeneris 85 dB. To do this, we must determine the efficiencyof the loudspeaker. Taking data from the Control 28specification sheet, and averaging the DI over the200 to 2000 Hz range, we now use the followingequation:
Sensitivity (1 W @ 1 m) = 109 + DI + 10 log Efficiency.
7-12

Sound System Design Reference Manual
7-13
Figure 7-11. Side elevation view of large liturgical church
Figure 7-10. Plan and front elevation views of large liturgical church

Sound System Design Reference Manual
Entering values and rearranging:
10 log Efficiency = 92 -109 - 5 = -22
The efficiency is then 10-22/10 = 10-2.2 = .63%
The total contribution to the reverberant fieldwill be from all 18 loudspeakers working at once. Wecan then calculate the radiated acoustical power as:18 x 10 x 0.0063 = 1.134 acoustical watts. Here, 18is the number of individual loudspeakers, 10 W is theelectrical power applied to each of them, and 0.0063is the efficiency.
For the next step in the analysis we need todetermine the resulting reverberant level in the room.
Lrev
= 126 + 10 log WA - 10 log R
In relatively live spaces, Sα and R are virtuallyidentical; therefore,
Lrev
= 126 - 0.6 - 29 = 96 dB SPL.
We have now reached a point in our analysiswhere we can estimate the overall systemperformance regarding speech intelligibility. We knowthe following:
7-14
Figure 7-12. Electrical diagram of delay zoning system

Sound System Design Reference Manual
1. That when a single loudspeaker produces alevel of 85 dB SPL at the farthest listener, theresulting reverberant level is 96 dB SPL.
2. That the mid-band reverberation time in theroom is 2.5 seconds.
As our final step in the analysis, we can checkthe probable system speech intelligibilityperformance, according to Peutz’ Articulation loss ofconsonants (Al
cons) by means of the chart shown in
Figure 6-13.Locating a direct-to-reverberant ratio of -11 dB
along the bottom axis, and then moving up to thehorizontal line corresponding to a reverberation timeof 2.5 seconds, we see that the system’sperformance is slightly above the borderline of 15%Al
cons. This indicates that we have barely succeeded
in our design goal of acceptable performance. Inother words, our analysis has shown that we havemarginal acceptability in terms of speech intelligibility.
In reality, there are three factors that will work inour favor:
1. The Peutz criteria are based on acousticalrelationships at 2 kHz. With mid-band (500 Hz)reverberation at 2.5 seconds we can reasonablyassume that reverberation time at 2 kHz will be about2.2 seconds due to excess air attenuation, as can beread from Figure 5-13.
2. We have not yet considered that the surfacearea (as opposed to the average absorptioncoefficient) on which most of the initial acousticalpower is aimed is more absorptive than the averageabsorption coefficient would indicate. At 2 kHz, theaudience area will have an absorption coefficientconservatively estimated at about 0.5, and thisindicates that the actual reverberant level generatedby the reinforcement system could be a good 3 dBless than our calculations indicate. This would easilymove our data point in the graph of Figure 6-13 veryclose to the “GOOD” zone. Of course we must takeinto account the actual number of persons present inthe audience area before this assumption can bemade. On any given Sunday, if all the attendees at aservice can be coaxed into the front pews, theloudspeakers behind them are unnecessary and canbe turned off, further reducing the level of thereverberant field.
3. The final factor working in our favor would bethe reduction of reverberation time in the space dueto the presence of the congregation. Remember thatthe reverberation time of 2.5 seconds is for theempty room.
3. Delay Zoning:Suggested delay settings are:
Zone 1. Loudspeakers 2, 3, 6, and 7 10 msecZone 2. Loudspeakers 1, 4, 5, and 8 22 msecZone 3. Loudspeakers 9 and 10 40 msecZone 4. Loudspeakers 11 and 12 55 msecZone 5. Loudspeakers 13 and 14 70 msecZone 6. Loudspeakers 15 and 16 85 msecZone 7. Loudspeakers 17 and 18 100 msec
4. General comments:The system described in this section
emphasizes the complex inter-relations betweenacoustics and electroacoustics that are inherent inbasic sound reinforcement design in large, livespaces. We strongly urge that all of the basicrelationships presented here be carefully studied andunderstood. The fundamental principles we wouldlike to stress are:
1. Whenever possible, use distributedloudspeakers that cover the intended seating area,but that have rapid cutoff beyond their nominalcoverage angles; in other words, keep the on-axis DIas high as possible consistent with requiredcoverage.
2. Try to minimize the longest throw distancewithin a given loudspeaker zone. Loudspeakers havebeen placed in overhead chandeliers in the attemptto do this. Pewback systems take this approach tothe limit.
3. Seat the congregation toward the front of theroom and turn off unnecessary loudspeakers.
4. Many large spaces were designed during atime when few people cared about speechintelligibility, and many liturgical spaces are simplytoo live for modern requirements. A carefulassessment should be made here, and no liveliturgical space should be altered acoustically withoutthe advice and counsel of an experienced acousticalconsultant.
7-15

Sound System Design Reference Manual
Case Study C: Specifications for aDistributed Sound System Comprising aBallroom, Small Meeting Space, andSocial/Bar Area.
1. General Information and Basic PerformanceSpecifications:
1.1 Ballroom Description: The size of the spaceis 33 meters long, 22 meters wide, and 8 metershigh. A stage is located at the center of one shortside, and the room may be used for banquets,displays, and social events such as dancing.
A distributed (ceiling) system will be used forgeneral speech/music purposes, as well asamplification of stage events. For this purpose thesystem should be zoned for delay. Reinforced levelsup to 100 dB SPL will be expected, and coverageshould be uniform within 1.5 dB up to a frequency of2 kHz. The space is normally carpeted, except fordancing. Reverberation time is minimal.
1.2 Meeting Space Description: This space istypical of many that will be found in convention andmeeting areas. The size is 8 meters by 5 meters and3 meters high. A distributed ceiling system is to bedesigned, uniform within 1.5 dB up to 2 kHz. Normalmaximum levels are expected to be 85 dB SPL.
1.3 Social Area: This space is of irregularshape, as shown in the diagram. A foreground stereomusic system is to be specified for this space; nopaging will be required. The system should becapable of producing levels of 85 dB SPL. There isalso a disco/dance floor area, and a four-loudspeaker installation should provide levels of105 dB at the center of the dance floor.
2. Exercises:Study the attached figures that detail the layout
of distributed systems in general, and pick either thesquare or hexagonal layout.
2.1 Ballroom System:1. Determine quantity and placement of ceiling
loudspeakers that will meet the specification.2. Determine the power allocation for each
loudspeaker and describe the power distributionsystem (70-volt or low-Z).
3. Determine the minimum number of workablezones for signal delay for stage events.
2.2 Meeting Space System:1. Determine the model loudspeaker required
and the spacing density in the ceiling.
7-16
Figure 7-13. Ballroom layout. Plan view (A); side section view (B).

Sound System Design Reference Manual
2. Determine the power allocation for eachloudspeaker.
2.3 Social Area System:1. Suggest a stereo layout of loudspeakers that
will provide all patrons with satisfactory sound.2. Determine power requirements and
distribution method.3. Specify disco components that will produce a
level of 115 SPL dB in the middle of the dance floor.
3. Answers to Exercises:
3.1 Ballroom System:1. Use the square array, with center-to-center
overlap. Reasons: results in easier zoningrequirements and fits the rectilinear design of theroom better. Designing for seated ear height (1meter) results in 12 loudspeakers.
2. Use JBL 2155 coaxial loudspeakers. Withsensitivity of 102 dB and power rating of 150 watts, a
7-17
Figure 7-14. Ballroom system, signal flow diagram.

Sound System Design Reference Manual
7-18
Figure 7-15. Meeting space layout. Plan view (A); side section view (B)
Figure 7-16. Meeting space system, signal flow diagram.
Sound System Design Reference Manual
single loudspeaker will, at a distance of 7 meters,produce a level of 105 dB. The added contribution ofthe eight neighboring loudspeakers will increase thisby 3 dB, making a maximum level capability of 108dB. Level variations will be 1.4 dB.
Because of the wide-band capability of theloudspeakers and relatively high power required, alow impedance distribution system should be used.Each 8-ohm loudspeaker should be driven from asection of a JBL MPX 300 amplifier, making a total of6 amplifiers. This will provide 200 watt capability intoeach loudspeaker, which will more than exceed thespecification.
JBL Professional provides a program fordetermining layout density for distributed ceilingloudspeakers. It is called Distributed System Design,version 1.1, and runs on Windows 95 and isavailable from JBL Professional.
3. Zoning requirements: Measure the averagedistance from center stage to a center listeningposition directly under each zone. Subtract from thatthe value of 7 meters. For each meter difference,calculate 3 milliseconds of delay:
Zone Difference Delay1 negligible 0 msec2 12 meters 36 msec3 20 meters 60 msec4 26 meters 78 msec
In normal cases, the calculated delay valueswill have to be adjusted slightly on-site for bestoverall sound quality.
3.2 Meeting Room System:1. Use the hexagonal array, with center-to
center overlap, for best coverage. Twelveloudspeakers will be required, and the JBL Control26C/CT will be specified because of its nominalcoverage angle of 110°. With a sensitivity of 89 dB,one watt input will produce a level of 83 dB at adistance of 2 meters (ear height). With one watt fedto the six nearest neighboring loudspeakers, thelevel will increase to 87 dB, which is 2 dB higher thanthe design requirement.
It is obvious that normal usage will require onlyabout one watt per loudspeaker. However, we shouldprovide the system with a nominal 10 dB headroomfactor for undetermined applications. The total powerin this case would be 120 watts, and a single sectionof a JBL MPX300 amplifier, operating in series-parallel, would more than meet this requirement. Theresulting load impedance of 12 ohms could easilyaccept 120 watts from one section of the MPX300amplifier.
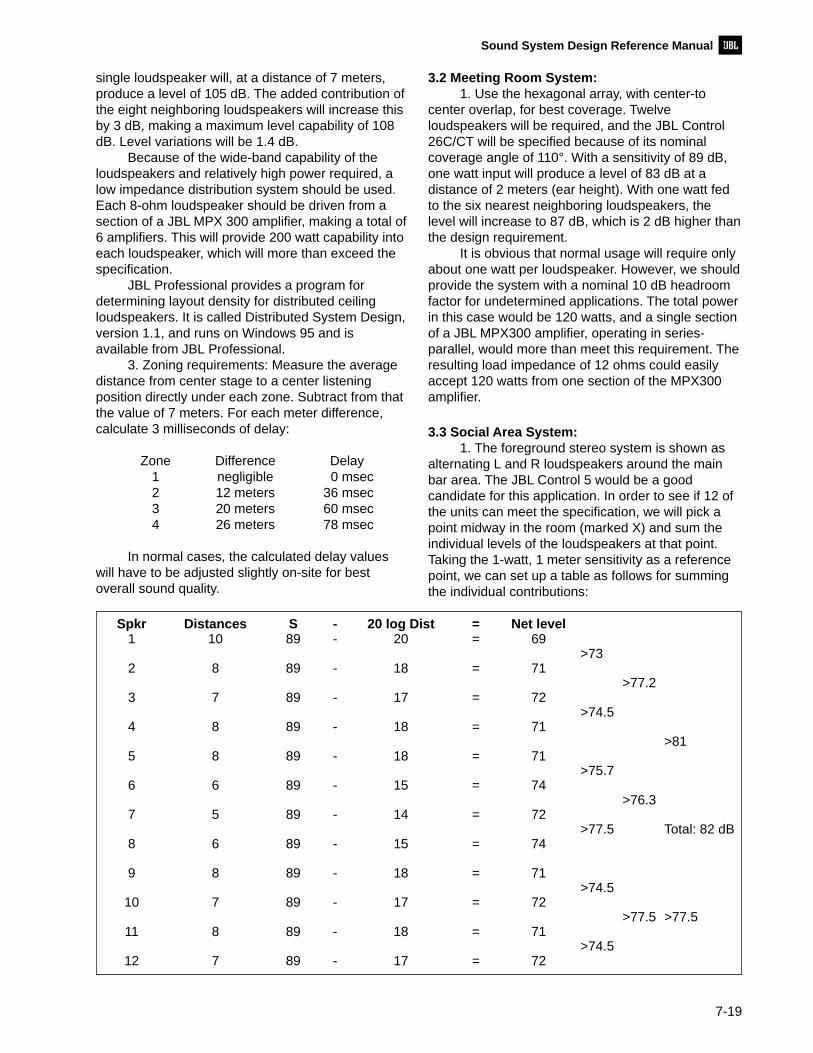
3.3 Social Area System:1. The foreground stereo system is shown as
alternating L and R loudspeakers around the mainbar area. The JBL Control 5 would be a goodcandidate for this application. In order to see if 12 ofthe units can meet the specification, we will pick apoint midway in the room (marked X) and sum theindividual levels of the loudspeakers at that point.Taking the 1-watt, 1 meter sensitivity as a referencepoint, we can set up a table as follows for summingthe individual contributions:
7-19
Spkr Distances S - 20 log Dist = Net level1 10 89 - 20 = 69
>732 8 89 - 18 = 71
>77.23 7 89 - 17 = 72
>74.54 8 89 - 18 = 71
>815 8 89 - 18 = 71
>75.76 6 89 - 15 = 74
>76.37 5 89 - 14 = 72
>77.5 Total: 82 dB8 6 89 - 15 = 74
9 8 89 - 18 = 71>74.5
10 7 89 - 17 = 72>77.5 >77.5
11 8 89 - 18 = 71>74.5
12 7 89 - 17 = 72

Sound System Design Reference Manual
7-20
Figure 7-17. Plan view of social area and disco area.
The total level at the test position is thus 82 dBwhen all 12 loudspeakers are powered with 1 watt, or85 dB with 2 watts per loudspeaker. With 20 wattsper loudspeaker, we would have a comfortable 10 dBmargin over our target value of 85 dB SPL. Thesystem will be “coasting” most of the time, and asingle stereo amplifier, with loads wired in series-parallel, will suffice.
2. Disco system. There are a number ofpossibilities here. A very high-end approach would beto specify two JBL 4892 Array Series systems ateach corner. They should be mounted near theceiling and angled down so that the horns pointtoward the center of the dance floor.
The 4892 is a biamplified system, and itsoverall sensitivity of 98 dB is limited by its LF section.The LF power rating is 600 watts. The distance from
each corner to the center of the dance floor is 7meters:
Level Power Distance98 dB 1 W 1 meter
126 dB 600 W 1 m109 dB 600 W 7 m
A total of 8 4892 systems would increase theoutput by 9 dB, producing level capability of 118 dBat the center of the dance floor. The amplifierrequirement would be 4 MPX600 units and 4MPX300 units. Note carefully that the MPX600 has amaximum output capability of 400 watts into 8 ohms.This is approximately 2 dB less than 600 watts, andwe would have to derate the system’s overall outputcapability by that amount.

Sound System Design Reference Manual
7-21
For a stereo system, we would need oneDSC260 digital controller for frequency division andother signal processing.
Subwoofer requirements can be met with four(one in each corner) JBL 4645B systems. Driverequirements would be two MPX1200 amplifiers andone section of a DSC260 controller. The amplifierscan deliver 800 watts continuous power per channelinto 8 ohms. With their half-space referenceefficiency of 2.1%, the four subwoofer systems canproduce a total power of 60 acoustic watts.
Figure 7-18. Social area system, signal flow diagram.

Sound System Design Reference Manual
Figure 7-19. Disco system, signal flow diagram.
7-22

Sound System Design Reference Manual
Recommended Reading:
Books and Anthologies:
1. D. and C. Davis, Sound System Engineering, second edition, Howard F. Sams, Indianapolis, 1987.
2. J. Eargle, Electroacoustical Reference Data, Van Nostrand Reinhold, New York, 1994.
3. Various, Sound Reinforcement, an anthology of articles on sound reinforcement from the Journal of theAudio Engineering Society, volumes 1 through 26. (Available from the AES)
Papers:
4. C. P. and R. E. Boner, “The Gain of a Sound System,” J. Audio Engineering Society, volume 17, number 2(1969).
5. H. Haas, “The Influence of a Single Echo on the Audibility of Speech,” J. Audio Engineering Society,volume 20, number 2 (1972).
6. H. F. Hopkins and N. R. Stryker, “A Proposed Loudness-Efficienty Rating for Loudspeakers and theDetermination of System Power Requirements for Enclosures,” Proceedings of the IRE, March 1948.
7. C. T. Molloy, “Calculation of the Directivity Index for Various Types of Radiators,” J. Acoustical Society ofAmerica, volume 20, pages 387-405 (1948).
8. V. M. A. Peutz, “Articulation Loss of Consonants as a Criterion for Speech Transmission in a Room,”J. Audio Engineering Society, volume 19, number 11 (1971).
9. V. M. A. Peutz, “Quasi-steady-state and Decaying Sound Fields,” Ingenieursblad, volume 42, number 18(1973, in Dutch).
10. Various, “Loudspeaker Arrays — Design and Performance,” J. Audio Engineering Society, volume 38,number 4 (1990).