Embed Size (px)
Citation preview
General rights Copyright and moral rights for the publications made accessible in the public portal are retained by the authors and/or other copyright owners and it is a condition of accessing publications that users recognise and abide by the legal requirements associated with these rights.
Users may download and print one copy of any publication from the public portal for the purpose of private study or research.
You may not further distribute the material or use it for any profit-making activity or commercial gain
You may freely distribute the URL identifying the publication in the public portal If you believe that this document breaches copyright please contact us providing details, and we will remove access to the work immediately and investigate your claim.
Downloaded from orbit.dtu.dk on: Jan 09, 2020
Sound source localization with varying amount of visual information in virtual reality
Ahrens, Axel; Lund, Kasper Duemose; Marschall, Marton; Dau, Torsten
Published in:PLOS ONE
Link to article, DOI:10.1371/journal.pone.0214603
Publication date:2019
Document VersionPublisher's PDF, also known as Version of record
Link back to DTU Orbit
Citation (APA):Ahrens, A., Lund, K. D., Marschall, M., & Dau, T. (2019). Sound source localization with varying amount of visualinformation in virtual reality. PLOS ONE, 14(3), [e0214603]. https://doi.org/10.1371/journal.pone.0214603

RESEARCH ARTICLE
Sound source localization with varying
amount of visual information in virtual reality
Axel AhrensID*, Kasper Duemose Lund, Marton Marschall, Torsten Dau
Hearing Systems Section, Department of Health Technology, Technical University of Denmark, Kgs. Lyngby,
Denmark
Abstract
To achieve accurate spatial auditory perception, subjects typically require personal head-
related transfer functions (HRTFs) and the freedom for head movements. Loudspeaker-
based virtual sound environments allow for realism without individualized measurements.
To study audio-visual perception in realistic environments, the combination of spatially
tracked head mounted displays (HMDs), also known as virtual reality glasses, and virtual
sound environments may be valuable. However, HMDs were recently shown to affect the
subjects’ HRTFs and thus might influence sound localization performance. Furthermore,
due to limitations of the reproduction of visual information on the HMD, audio-visual percep-
tion might be influenced. Here, a sound localization experiment was conducted both with
and without an HMD and with a varying amount of visual information provided to the sub-
jects. Furthermore, interaural time and level difference errors (ITDs and ILDs) as well as
spectral perturbations induced by the HMD were analyzed and compared to the perceptual
localization data. The results showed a reduction of the localization accuracy when the sub-
jects were wearing an HMD and when they were blindfolded. The HMD-induced error in azi-
muth localization was found to be larger in the left than in the right hemisphere. When visual
information of the limited set of source locations was provided, the localization error induced
by the HMD was found to be negligible. Presenting visual information of hand-location and
room dimensions showed better sound localization performance compared to the condition
with no visual information. The addition of possible source locations further improved the
localization accuracy. Also adding pointing feedback in form of a virtual laser pointer
improved the accuracy of elevation perception but not of azimuth perception.
Introduction
Virtual environments (VE) and virtual reality (VR) systems enable the study of audio-visual
perception in the laboratory with a higher degree of immersion than obtained with typical lab-
oratory-based setups. Head-mounted displays (HMDs) may allow the realistic simulation of
visual environments, and loudspeaker-based virtual sound environments can reproduce realis-
tic acoustic environments while maintaining the subjects’ own head-related transfer functions
PLOS ONE | https://doi.org/10.1371/journal.pone.0214603 March 29, 2019 1 / 19
a1111111111
a1111111111
a1111111111
a1111111111
a1111111111
OPEN ACCESS
Citation: Ahrens A, Lund KD, Marschall M, Dau T
(2019) Sound source localization with varying
amount of visual information in virtual reality. PLoS
ONE 14(3): e0214603. https://doi.org/10.1371/
journal.pone.0214603
Editor: Manuel S. Malmierca, Universidad de
Salamanca, SPAIN
Received: November 26, 2018
Accepted: March 17, 2019
Published: March 29, 2019
Copyright: © 2019 Ahrens et al. This is an open
access article distributed under the terms of the
Creative Commons Attribution License, which
permits unrestricted use, distribution, and
reproduction in any medium, provided the original
author and source are credited.
Data Availability Statement: All data are available
from the zenodo database. The perceptual data can
be found here: doi.org/10.5281/zenodo.1293059
and the impulse response data can be found here:
doi.org/10.5281/zenodo.1185335.
Funding: The authors AA and KDL were funded by
the Oticon Centre of Excellence for Hearing and
Speech Sciences. MM was funded by the Centre
for Applied Hearing Research. The funders had no
role in study design, data collection and analysis,
decision to publish, or preparation of the
manuscript.

(HRTFs). Combining HMDs and loudspeaker-based virtual sound environments could, there-
fore, be valuable for investigating perception in realistic scenarios.
To localize a sound source in the horizontal plane (azimuth) as well as in the vertical plane
(elevation; see [1] for a review), three major cues are crucial: interaural time differences
(ITDs), interaural level differences (ILDs), and monaural spectral cues generated by reflections
from the body and the pinnae. An alteration of these cues can lead to a reduced localization
accuracy (e.g. [2,3,4]). Wearing an HMD alters the sound localization cues [5,6], as well as the
perceived spatial quality [5] and might also reduce the sound source localization accuracy.
Another factor that can affect people’s sound source localization ability is visual informa-
tion. The ventriloquism effect describes the capture of an acoustic stimulus by a visual stimulus
[7,8], altering the perceived location of the acoustic stimulus. Maddox et al. [9] showed that
the eye gaze modulates the localization accuracy of acoustic stimuli. They found an enhanced
ITD and ILD discrimination performance when the eye gaze was directed towards the source.
Since HMDs have a reduced field-of-view relative to the human visual system, sound source
localization abilities might also be affected due to reduced visual information. Furthermore,
when having the room and the hand-location visible, the localization error has been shown to
be lower than when subjects are blind-folded [10].
Modern proprietary VR systems have been shown to reproduce immersive visual environ-
ments and to provide reliable spatial tracking accuracy, both for the reproduction of virtual
visual scenes as well as for headset- and controller-tracking [11,12]. However, Niehorster et al.
[12] showed that when the tracking system of the HMD is lost, for example due to the user
blocking the path between the tracking system and the HMD with their hands, the VR system
fails to maintain the correct spatial location. Consequently, the calibrated location of the HMD
within the room can be offset, i.e. a certain direction in VR does not correspond to the corre-
sponding direction in the real-world. Such offsets can be difficult to track in proprietary VR
systems. To overcome this issue, a real-world to virtual-world calibration is proposed.
The aim of the present study was to clarify how sound source localization ability is affected
by a VR system, and in particular, how HMD-induced changes of the binaural cues and virtual
visual information alter sound localization accuracy. In order to address this, a sound localiza-
tion experiment was conducted in a loudspeaker environment with and without an HMD. For
the localization task, a hand-pointing method was employed utilizing commercially available
hand-held VR controllers. To evaluate the accuracy of the pointing method, a visual localiza-
tion experiment was conducted, where the subjects’ task was to point to specific locations.
Since previous studies showed that sound localization accuracy can be influenced by visual
information [10,13], the amount of visual information provided to the subjects was varied in
the VR environment. One condition included no visual information (blind-folded); another
provided visual cues regarding the room dimensions and the hand-location; in a third condi-
tion, the subjects saw the loudspeaker locations and were additionally provided with a laser
pointer for pointing on the perceived sound location. It was hypothesized that effects as
observed in previous audio-visual localization experiments in real environments, may also be
reflected in VR.
Methods
Subjects
Ten subjects (three female, seven male) with an average age of 24 years participated in the
study. None of the subjects had seen the experimental room before. The subjects were blind-
folded when they were guided into the room. They had normal audiometric thresholds equal
to or below 20 dB hearing loss at the octave-band frequencies between 250 Hz and 8 kHz and
Sound localization with varying visual information in virtual reality
PLOS ONE | https://doi.org/10.1371/journal.pone.0214603 March 29, 2019 2 / 19
Competing interests: The authors have declared
that no competing interests exist.

self-reported normal or corrected vision. Nine of the ten subjects were right handed and were
instructed to use their main hand to hold the controller. The data of the left-handed subject
were mirrored on the median plane. For each subject, the interpupillary distance was mea-
sured and the HMD was adjusted accordingly to ensure a clear binocular image and to mini-
mize eye strain. All subjects provided informed consent and all experiments were approved by
the Science-Ethics Committee for the Capital Region of Denmark (reference H-16036391).
Acoustic reproduction method
The acoustic reproduction system consisted of 64 loudspeakers (KEF LS50, KEF, Maidstone,
United Kingdom) housed in an anechoic chamber. The loudspeakers were arranged in a full
sphere, at a distance of 2.4 m to the listening position, and driven by sonible d:24 (sonible
GmbH, Graz, Austria) amplifiers. Twenty-seven of the loudspeakers in the frontal hemisphere
were used in the present study. The loudspeakers were placed at three heights, at 0˚ (ear level)
and ±28˚ elevation. Thirteen of the loudspeakers were at ear-level, distributed between -90˚
and +90˚ azimuth, with 15˚ separation. Seven loudspeakers were elevated by +28˚, and seven
by -28˚, distributed between ±90˚ azimuth with 30˚ separation. All loudspeakers were equal-
ized in level, delay and magnitude response as measured at the listening position. The loud-
speakers were labelled using color coding (yellow, red and blue) to indicate elevation and
numbers for azimuth locations (see Fig 1). The numbers ranged from one to thirteen, starting
at -90˚ (left). The elevated loudspeakers at ±28˚ used only odd numbers, such that equal
numerals were used for loudspeakers with the same azimuth angle.
Visual reproduction method
The real environment (RE), shown in Fig 1 (left panel), was replicated to ensure comparable
visual information with and without the HMD (Fig 1, right panel). To present the VE, the
HTC Vive system (HTC Corporation, New Taipei City, Taiwan) was used. This system con-
sists of an HMD and two handheld controllers to interact with the VE. Three additional Vive
Trackers (HTC Corporation, New Taipei City, Taiwan) were used for VE-to-RE calibration
(see details below). The spatial position and rotation of all devices were tracked with the infra-
red ray-tracking system. Blender (Blender Foundation, Amsterdam, The Netherlands) and
Unity3D (Unity Technologies, San Francisco, CA) with the SteamVR plugin (Valve Corpora-
tion, Bellevue, WA) were used to replicate and present the VE, respectively.
Fig 1. Photography (left) and screenshot (right) of the acoustic reproduction system in the real and in the virtual environment
(RE and VE). The loudspeakers are numbered in azimuth and color coded in elevation.
https://doi.org/10.1371/journal.pone.0214603.g001
Sound localization with varying visual information in virtual reality
PLOS ONE | https://doi.org/10.1371/journal.pone.0214603 March 29, 2019 3 / 19
When the aim is to replicate a real scenario in VR, while maintaining the interaction with
real objects, it is crucial to ensure spatial alignment between the real and the virtual world. To
calibrate the virtual world to the real world, the three Vive Trackers were positioned on top of
the ear-level loudspeakers at 0˚ and ±45˚ azimuth. Discrepancies in the positions of the track-
ers in the RE and the VE were accounted for as follows:
1. The normal of the plane spanned by the three points corresponding to the positions of the
trackers was calculated for the RE and for the VE and the difference in rotation between
them was applied to the VE. This ensured the correct orientation of the VE.
2. To correctly position the VE, the difference between one tracker and the respective refer-
ence point in the VE was calculated and the VE was shifted accordingly. This resulted in an
alignment of the RE and the VE at the chosen reference point.
3. The final rotation offset around the normal vector was corrected by calculating the angle
difference of the vectors from the aligned reference point to an unaligned reference point in
the VE and RE, i.e. to the known location of one of the other trackers and its virtual
position.
After this procedure, the VE was aligned in both position and rotation relative to the RE.
This method continuously accommodated for potential spatial discrepancies that might have
occurred from tracking losses, as described by Niehorster et al. (2017). The system was recali-
brated when either the tracker position error relative to the true position exceeded 2 cm or
when the HMD lost tracking. The maximum allowed positional offset of the reference points
resulted in a worst-case rotation error of 3.2˚.
Acoustic stimuli
The acoustic stimulus consisted of a pink noise burst with a duration of 240 ms and 20 ms
tapered cosine ramps at the onset and offset. The noise burst was created in MATLAB (The
Mathworks, Natick, MA) using a sampling frequency of 48 kHz. For each stimulus presenta-
tion, a new noise burst was created. The stimulus was presented at a sound pressure level
(SPL) of 65 dB, and roved by values between ±3 dB, drawn from a uniform distribution. The
short duration limits effect of head movements during the stimulus presentation [14] and the
roving minimizes a spatial cue provided by directional loudness differences [15,16]. The sub-
jects were asked to re-center their viewing direction before each stimulus representation, i.e.,
to face the 0˚ on-axis loudspeaker at ear level. The HMD rotation was logged in a subset of the
conditions and for a subset of the subjects to evaluate if, on average, the viewing direction was
centered at the time of the acoustic stimulus exposure. An initial azimuth rotation of the HMD
of -1˚±3˚ standard deviation was found.
Experimental conditions
Table 1 shows an overview of the eight experimental conditions considered in this study. The
column ‘visual information’ shows the visual environment that was presented to the subjects.
The stimulus refers to the localization task, which was either visual localization (visual search)
or sound localization. The last column indicates whether the HMD was worn or not. Each con-
dition and each of the 27 source locations (see section Acoustic reproduction method) was
presented five times to each of the subjects. Thus, each condition consisted of 135 stimuli
which were presented in fully random order.
The four blocks shown in Table 1 were presented in a fixed-order from Block I to Block IV
to control for the exposure to the loudspeaker locations. The conditions were randomized
Sound localization with varying visual information in virtual reality
PLOS ONE | https://doi.org/10.1371/journal.pone.0214603 March 29, 2019 4 / 19

within the blocks. No pre-experimental training was conducted to avoid any bias of the sub-
jects with respect to a specific condition or regarding visual information.
The two blind-folded conditions in Block I were used to examine whether, or to what
extent, simply wearing the HMD has an influence on sound source localization. The reference
localization accuracy was measured using the acoustic stimuli described above, while subjects
were blind-folded with a sleeping mask. To assess the effect of the HMD frame on sound
source localization, subjects wore the HMD on top of the sleeping mask.
The visual localization conditions in Block III were employed to investigate the baseline
accuracy of the pointing method using the hand-held VR controller in the RE and the VE (Fig
1). The subjects were instructed to point at a loudspeaker location shown either on an iPad Air
2 (Apple Inc., Cupertino, CA) in the real environment or on a simulated screen within the VE.
To investigate the influence of the HMD on sound localization when visual information
regarding the loudspeaker positions is available, the sound localization accuracy was evaluated
in the real and in the virtual loudspeaker environments (Block III). The subjects were
informed that sounds could also come from positions in-between loudspeakers. While the
visual information regarding the loudspeaker positions was available in both conditions, the
VE provided reduced visual information. The field-of-view of the HTC Vive is about 110˚
while the visual field of the human visual system is larger. Furthermore, in the VE only the
hand-held controller was simulated but not the arm, which was inherently visible in the RE.
In addition to evaluating the pointing accuracy and the HMD-induced localization error,
the effect of varying the amount of visual information on sound localization in the VE was
investigated. In Block II, the experimental room (anechoic chamber) without the loudspeakers
was rendered on the HMD and the subjects were asked to localize the acoustic stimuli as
described for the previous conditions. The experiment thus included conditions with various
degrees of visual information available to the subjects in the VR: no visual information, a
depiction of the empty room including hand-location, and a depiction of the complete room
including the locations of the sound sources.
To assess the role of visual feedback of the pointer location, in Block IV, a simulated laser
pointer emerging from the hand-held controller was shown while the subjects completed the
localization task in the VE with the room and the loudspeaker setup visible.
Pointing method
The controller of the VR system was used as a pointing device. The subjects were instructed to
indicate the perceived stimulus location by stretching their arm with the wrist straight while
holding the controller, in an attempt to minimize intra- and inter-subject variability in
Table 1. Overview over the conditions considered and grouped into blocks. Conditions were randomized within
blocks. The conditions varied in available visual information, target stimulus and if the head-mounted display was
worn.
Block Visual information Stimulus HMD
I Blind-folded Acoustic No
Blind-folded Acoustic Yes
II Virtual env., no loudspeaker (LS) Acoustic Yes
III Virtual env., LS Visual Yes
Real env. Visual No
Real env. Acoustic No
Virtual env., LS Acoustic Yes
IV Virtual env., LS, laser pointer Acoustic Yes
https://doi.org/10.1371/journal.pone.0214603.t001
Sound localization with varying visual information in virtual reality
PLOS ONE | https://doi.org/10.1371/journal.pone.0214603 March 29, 2019 5 / 19

pointing. The pointing direction was defined by the intersection point of an invisible virtual
ray originating at the tip of the controller extending the base of the device and an invisible vir-
tual sphere with the origin at the listeners head position and the same radius as the loudspeak-
ers (r = 2.4m). The perceived position of the source was indicated with a button press using
the index finger.
On each trigger button press, the PC running the VR system transmitted an Open Sound
Control (OSC) message via User Datagram Protocol (UDP) over an Ethernet network to the
audio processing PC. The audio processing PC subsequently presented the next acoustic or
visual stimulus, with a delay of three seconds to allow the subject to re-center the viewing
direction. With a responding OSC message, the audio processing PC permitted the reporting
of the perceived location after the playback completed.
A virtual model of the controller was rendered in all conditions containing visual informa-
tion in the HMD. Thus, the visual feedback of the controller position in Blocks II and III was
similar, independent of whether the HMD was worn or not. To standardize the pointing
method for all audio-visual conditions, a direction marker, functioning as a visual pointing
aid, was not provided in this study, except in the last condition (Block IV, Table 1), since a suf-
ficiently comparable method was unfeasible in the real environment. Thus, the pointing
method in Blocks II and III was similar to free-hand pointing.
Physical analysis
The effect of the HMD on the acoustic ear signals was analyzed from B&K Head and Torso
Simulator (HATS; Type 4128-C; Bruel & Kjær A/S, Nærum, Denmark) measurements with
and without the HTC Vive HMD. Binaural impulse responses were recorded from all 64 loud-
speakers with a 22-s long exponential sweep [17] in a frequency range from 60 Hz to 24 kHz
and truncated to 128 samples (2.7 ms) to remove reflections from other loudspeakers and
objects in the room. The dataset of the measurements can be found in a repository (zenodo.
org/record/1185335). Acoustic perturbations of the HMD on the frequency spectrum were
analyzed for the same set of loudspeakers as employed in the perceptual experiment by calcu-
lating the power in auditory filters between 200 Hz and 16 kHz with equivalent rectangular
bandwidths [18] using the Auditory Modeling Toolbox [19]. The power in the auditory filters
was averaged in three frequency regions from 200 Hz to 1 kHz, 1 to 5 kHz and 5 to 16 kHz.
Spectral differences (SD) were calculated as the mean absolute power differences of the
three frequency regions, measured with and without the HMD. Interaural level differences
(ILD) were determined in the same frequency region as the SD using the power differences at
the output of the auditory filters between the left- and the right-ear signals. Interaural time dif-
ferences (ITD) were calculated as the delay between the left- and right-ear signals. The delay of
each impulse response was defined as the lag of the peak of the cross-correlation between the
impulse response and its minimum-phase version [20].
Pointing bias
It was hypothesized that subjects might have a bias in pointing direction due to the shape of
the hand-held controller, and because they had no knowledge on where the ‘invisible ray’ was
emerging from the controller. A bias for each subject was therefore calculated in azimuth and
elevation as the mean of all source locations in the two visual localization conditions (real and
virtual). Individual responses were then corrected by the calculated azimuth and elevation
biases for all conditions except the condition with visual feedback of the pointer location (laser
pointer condition).
Sound localization with varying visual information in virtual reality
PLOS ONE | https://doi.org/10.1371/journal.pone.0214603 March 29, 2019 6 / 19

Analysis of behavioral responses
Statistical analyses on the subject response errors were performed by fitting mixed-effects lin-
ear models to the azimuth and elevation errors. The subject responses were corrected by a bias
estimation due to the pointing method, as described above. Responses that were localized far-
ther than 45˚ from the target location in either azimuth or elevation were treated as outliers.
Of the 10800 subject responses, 0.29% were treated as outliers and discarded from the analysis.
Only the sources in the horizontal plane were considered in the statistical analyses of the
azimuth localization errors. The azimuth stimulus location and the experimental condition
(see Table 1) as well as their interaction were treated as fixed effects. Regarding the elevation
error, the stimulus location in both azimuth (only azimuth directions that occurred in all ele-
vation directions) and elevation, the experimental condition, as well as their interactions were
treated as fixed effects. The influence of the subjects, the repetitions and their interaction were
considered as random effects. The p-values were calculated based on likelihood-ratio tests for
the random effects and on F-tests for the fixed effects [21]. Post-hoc analyses of within factor
comparisons were performed using estimated marginal means calculated from the mixed-
effects linear models and using Bonferroni p-value adjustments [22].
Results
Pointing Bias
Fig 2 shows the pointing bias in azimuth (squares) and elevation (circles) for each subject cal-
culated from the visual localization experiments. Regarding the azimuth bias, the subjects
tended to point slightly too far to the left (-3.5˚ to -0.1˚), except for subject S07, who had a
slight positive (right) azimuthal bias of 1.3˚. Overall, the average bias across subjects in azi-
muth was -1.6˚ (left). The only left-handed subject (S08) showed a similar bias as the other
subjects. The bias in elevation angle (circle) was found to be higher than the azimuth bias for
all subjects, with an average value of 19.0˚. The subjects generally tended to point too high.
The variance across subjects was between 12.8˚ and 28.6˚ and is likely to be related to the
shape of the hand-held controller and the internal reference of each subject of where the
“invisible ray” emerges from the controller. The responses of the subjects were corrected by
the pointing bias for all conditions except the laser pointer condition.
Fig 2. Pointing bias in azimuth (squares) and elevation (circles) for each subject. The bias was calculated as the
mean error over all source locations in the two visual localization conditions. Negative angles indicate biases to the left
and downwards for azimuth and elevation, respectively.
https://doi.org/10.1371/journal.pone.0214603.g002
Sound localization with varying visual information in virtual reality
PLOS ONE | https://doi.org/10.1371/journal.pone.0214603 March 29, 2019 7 / 19

Spectral differences and interaural errors
Fig 3 shows the spectral difference (SD) of the left-ear signals obtained with and without the
HMD on the B&K HATS for the azimuth source locations between -90˚ and +90˚ and for the
elevation angles of -28˚ (downward triangles), 0˚ (diamonds) and 28˚ (upward triangles). For
ipsilateral sources (negative azimuth angles), the SD was low for all frequency regions and all
elevation angles. In the low-frequency region between 200 Hz and 1 kHz (dashed lines), the
SD was also below 1 dB for contralateral sources (positive azimuth angles), independent of the
elevation angle. The SD in the mid-frequency (dashed-dotted lines) and high-frequency (solid
lines) regions was found to be up to 6.3 dB for elevation angles at and above the horizontal
plane (0˚, 28˚). For these elevations, the error was higher in the high-frequency region than in
the mid frequency region, except at 60˚. For mid- and high-frequency sources below the hori-
zontal plane (i.e. an elevation angle of -28˚), the SD was lower than for the other two elevation
angles.
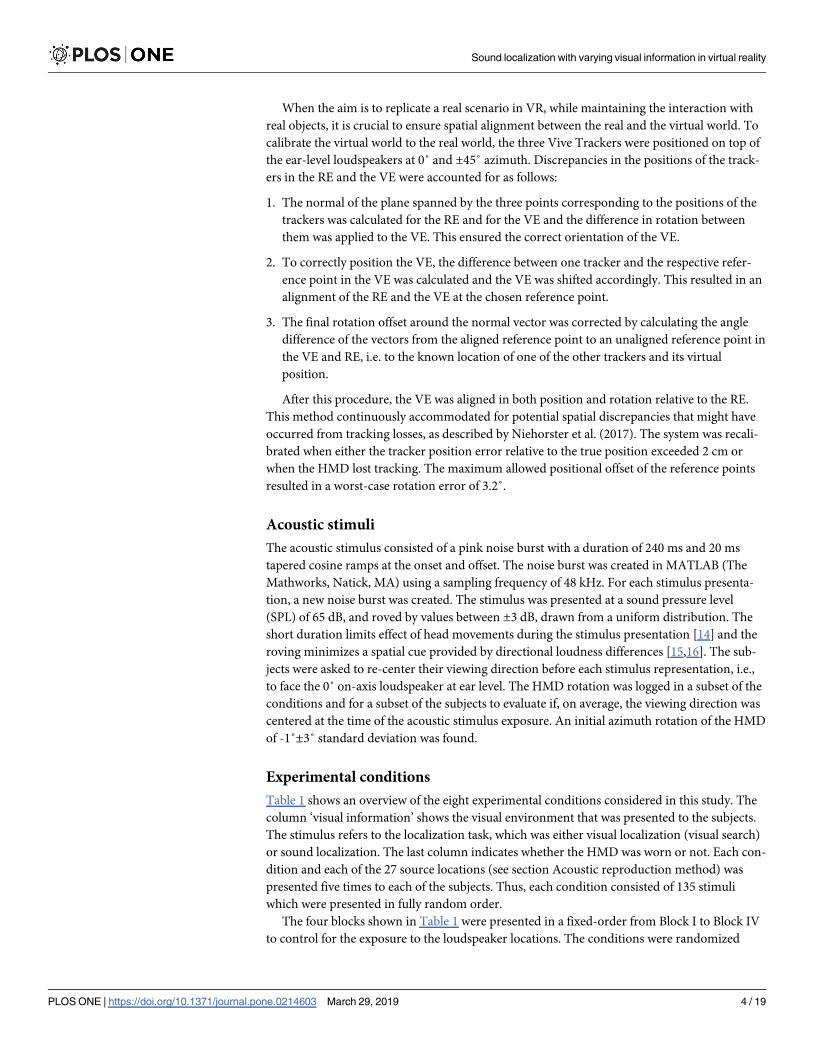
Fig 4 shows the signed errors in ILD (left panel) and ITD (right panel) induced by the
HMD measured in the horizontal plane as a function of source azimuth angle. The ILD error
in the low-frequency (dashed line) region was below 2 dB. In the mid- and high- frequency
regions (dashed-dotted line and solid line), the error was lowest at the frontal source location
(0˚ azimuth) and at 90. The largest error was about 6 dB at source angles of 60˚ and 30˚, for
the mid and high frequency regions, respectively. The ITD error was below 1 sample (21 μs)
for source angles between 0˚ and 30˚ and increased to 62.5 μs for the source angle of 75˚. The
ITD error was 0 μs at 90˚ azimuth angle.
Pointing accuracy with VR controllers
Fig 5 shows the responses of the subjects in the two visual localization experiments in the RE
and the VE. In both conditions, the subjects’ task was to point to the center of the loudspeaker
indicated on a screen. The filled black squares represent the 27 source locations. The small col-
ored symbols represent the individual responses of the subjects and the large open black sym-
bols indicate the mean responses, averaged across subjects and repetitions. The connecting
lines between the target location and the mean responses indicate the localization error. The
subjects generally pointed close to the correct loudspeaker, whereby the precision of the
responses was generally higher for azimuth than for elevation localization.
Fig 3. Spectral difference (SD) measured at the left ear of the B&K HATS with and without the HTC Vive. The
angles in the legend represent the elevation angles considered in the current study. The SD was calculated in auditory
bands and averaged over three frequency regions at low-, mid- and high frequencies as shown in the legend.
https://doi.org/10.1371/journal.pone.0214603.g003
Sound localization with varying visual information in virtual reality
PLOS ONE | https://doi.org/10.1371/journal.pone.0214603 March 29, 2019 8 / 19
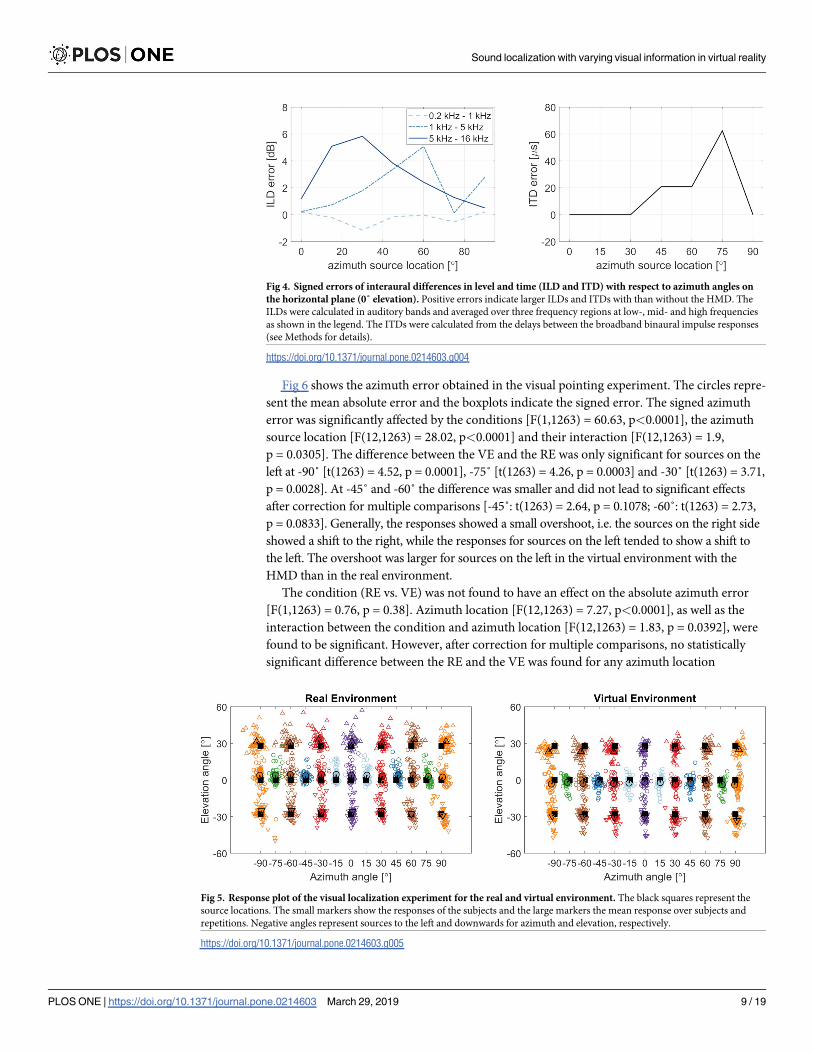
Fig 6 shows the azimuth error obtained in the visual pointing experiment. The circles repre-
sent the mean absolute error and the boxplots indicate the signed error. The signed azimuth
error was significantly affected by the conditions [F(1,1263) = 60.63, p<0.0001], the azimuth
source location [F(12,1263) = 28.02, p<0.0001] and their interaction [F(12,1263) = 1.9,
p = 0.0305]. The difference between the VE and the RE was only significant for sources on the
left at -90˚ [t(1263) = 4.52, p = 0.0001], -75˚ [t(1263) = 4.26, p = 0.0003] and -30˚ [t(1263) = 3.71,
p = 0.0028]. At -45˚ and -60˚ the difference was smaller and did not lead to significant effects
after correction for multiple comparisons [-45˚: t(1263) = 2.64, p = 0.1078; -60˚: t(1263) = 2.73,
p = 0.0833]. Generally, the responses showed a small overshoot, i.e. the sources on the right side
showed a shift to the right, while the responses for sources on the left tended to show a shift to
the left. The overshoot was larger for sources on the left in the virtual environment with the
HMD than in the real environment.
The condition (RE vs. VE) was not found to have an effect on the absolute azimuth error
[F(1,1263) = 0.76, p = 0.38]. Azimuth location [F(12,1263) = 7.27, p<0.0001], as well as the
interaction between the condition and azimuth location [F(12,1263) = 1.83, p = 0.0392], were
found to be significant. However, after correction for multiple comparisons, no statistically
significant difference between the RE and the VE was found for any azimuth location
Fig 4. Signed errors of interaural differences in level and time (ILD and ITD) with respect to azimuth angles on
the horizontal plane (0˚ elevation). Positive errors indicate larger ILDs and ITDs with than without the HMD. The
ILDs were calculated in auditory bands and averaged over three frequency regions at low-, mid- and high frequencies
as shown in the legend. The ITDs were calculated from the delays between the broadband binaural impulse responses
(see Methods for details).
https://doi.org/10.1371/journal.pone.0214603.g004
Fig 5. Response plot of the visual localization experiment for the real and virtual environment. The black squares represent the
source locations. The small markers show the responses of the subjects and the large markers the mean response over subjects and
repetitions. Negative angles represent sources to the left and downwards for azimuth and elevation, respectively.
https://doi.org/10.1371/journal.pone.0214603.g005
Sound localization with varying visual information in virtual reality
PLOS ONE | https://doi.org/10.1371/journal.pone.0214603 March 29, 2019 9 / 19
[p>0.11]. The hemispheric difference, i.e. the difference between the left and the right side, of
the absolute azimuth error difference between the RE and the VE was not found to be signifi-
cant. However, the hemispheric difference was larger at the lateral source locations [±90˚: t
(1263) = -2.8, p = 0.0587; ±75˚: t(1263) = -2.25, p = 0.22] than at the source locations closer to
the median plane [p>0.43].
The analysis of the absolute elevation error showed that the conditions [F(1,2042) = 9.77,
p = 0.0018] and the three-way interaction of condition, azimuth location and elevation loca-
tion [F(12,1263) = 2.02, p = 0.0196] were significant. The two-way interaction of the condi-
tions with the source locations in azimuth [F(6,2042) = 2.21, p = 0.0398] was significant, but
not with the source locations in elevation [F(2,2042) = 2.29, p = 0.1]. The interaction between
the source locations in azimuth and elevation was not significant [F(12,2042) = 1.42, p = 0.15]
and also the source locations [Azimuth: F(6,2042) = 0.99, p = 0.43; Elevation: F(2,2042) = 1.02,
p = 0.36] did not reveal significant effects.
The analysis of the signed elevation error showed significant contributions of the conditions
[F(1,2069) = 609.11, p<0.0001], the source azimuth [F(6,2069) = 2.42, p = 0.0245], the source
elevation [F(2,2069) = 7.85, p = 0.0004] as well as the interactions between the source elevation
and the conditions [F(2,2069) = 9.51, p<0.0001] and both source locations [F(12,2069) = 2.7,
p = 0.0013]. The interaction between the source azimuth and the conditions [F(6,2069) = 0.75,
p = 0.61] and the three-way interaction [F(12,2069) = 0.51, p = 0.91] were not found to be sig-
nificant. The difference between the RE and the VE was significant at all three source elevations,
at 0˚ elevation [t(2069) = 15.48, p<0.0001], as well as below [t(2069) = 10.76, p<0.0001] and
above [t(2069) = 16.52, p<0.0001] the horizontal plane. The signed elevation error was positive
(upwards) in the RE and negative (downwards) in the VE, as indicated by the lines between the
target markers (black squares) and the response markers (colored squares) in Fig 5. On average,
the subjects pointed 6.5˚ higher in the RE than in the VE.
Influence of HMD on azimuth error
Fig 7 shows the absolute (circles) and the signed (boxplots) azimuth error as a function of the
azimuth source locations. Negative angles represent sources on the left and positive angles
Fig 6. Mean absolute (circles) and signed (boxplots) azimuth error for visual localization in the virtual (light blue)
and the real (dark blue) environment. The error is shown over the thirteen azimuth angles in the horizontal plane (0˚
elevation). The boxplots indicate the median (line) and the first and third quartile. The whiskers extend to 1.5 times the
interquartile range.
https://doi.org/10.1371/journal.pone.0214603.g006
Sound localization with varying visual information in virtual reality
PLOS ONE | https://doi.org/10.1371/journal.pone.0214603 March 29, 2019 10 / 19

indicate sources on the right of the subjects. The dark grey boxes and circles represent results
for the condition where the subjects were blind-folded and the light grey boxes and circles
show the results where the subjects were blind-folded and wore the HMD. The mean absolute
azimuth error was always found to be larger with the HMD except for 0˚. This difference was
larger on the left than on the right side. The analysis of the signed error, employing a linear
mixed effects model, showed that the effect of the conditions was not significant [F(1,1265) =
0.6, p = 0.44], while the source locations [F(12,1265) = 62.04, p<0.0001] and the interaction [F
(12,1265) = 3.04, p = 0.0003] were significant factors.
The median of the signed error showed that the sources were perceived further lateral with
the HMD than without. The post-hoc analysis for the sources on the left side showed that the
difference between the conditions reached significance only at a source angle of -60˚ [t(1265) =
3.3, p = 0.0059]. At -45˚ the p-value exceeded the 5% significance level after correction for mul-
tiple comparisons [t(1265) = 2.4, p = 0.0944]. On the right side, the difference was significant
only at 45˚ [t(1265) = -3.1, p = 0.0119]. The error induced by the HMD on the signed azimuth
error was larger on the left than on the right side at 45˚ [t(1265) = 3.9, p = 0.0014] and 60˚ [t
(1265) = 2.96, p = 0.0374].
Influence of visual information on azimuth error
Fig 8 shows the absolute (circles) and signed (boxplots) azimuth error as a function of the azi-
muth source locations for five conditions with varying visual information. The subjects were
either blind-folded with the HMD (light grey), were provided with information regarding the
room dimensions and the hand position information (white), could see the real room (dark
blue), were provided with the virtual version of the real room (light blue), or were provided
with a laser pointer in the virtual room (blue).
The analysis of the linear mixed-effects model of the absolute azimuth error showed that
both main effects of azimuth source location [F(12,3176) = 23.17, p<0.0001] and conditions
[F(4,3176) = 223.88, p<0.0001] as well as their interaction [F(48,3176) = 4.57, p<0.0001] had a
significant effect on the azimuth error. A post-hoc analysis was performed to investigate the
Fig 7. Mean absolute (circles) and signed (boxplots) azimuth error for acoustic localization of blind-folded
subjects with (light grey) and without (dark grey) the head mounted display (HMD). The error is shown over the
thirteen azimuth angles in the horizontal plane (0˚ elevation). The boxplots indicate the median (line) and the first and
third quartile. The whiskers extend to 1.5 times the interquartile range.
https://doi.org/10.1371/journal.pone.0214603.g007
Sound localization with varying visual information in virtual reality
PLOS ONE | https://doi.org/10.1371/journal.pone.0214603 March 29, 2019 11 / 19

effect of the room and hand position information, the loudspeaker locations, and the laser
pointer for aided pointing on the perceived sound source.
A significant decrease in error was found when comparing the blind-folded HMD condi-
tion (light grey) with the condition where the subjects had visual information of room and
hand position (white) at azimuth location between -15˚ and -75˚ [p<0.039]. No significant
change in error was found at -90˚ [t(3176) = 1.61, p = 1], at the right side of the subjects [p = 1]
nor for the frontal source [t(3176) = 2.34, p = 0.25].
When also visual information of the loudspeaker locations was provided (light blue), the
subjects generally pointed towards the correct loudspeaker. When the loudspeaker locations
were provided, the azimuth localization error decreased in comparison to the condition where
only room and hand-location information were given. The reduction in error was significant
for azimuth locations in the left hemifield between -15˚ and -60˚ [p<0.03] and in the right
hemifield between 30˚ and 75˚ [p<0.02]. The lateral sources on the left [p>0.34] and on the
right [p = 1], as well as sources close to the midline at 0˚ and 15˚ [p = 1] were not found signifi-
cantly different in the two conditions with and without visual representations of the
loudspeakers.
When the laser pointer was shown in the VE (blue), the absolute azimuth error was not
found to be different from the condition without the laser pointer (light blue) [p = 1], except
for the azimuth angle -75˚ [t(3176) = 3.42, p = 0.0084]. Comparing the VE without the laser
pointer (light blue) and the RE (dark blue) showed no significant difference of the azimuth
error at any of the source locations on the horizontal plane [p>0.28].
Influence of HMD on elevation error
Fig 9 shows the error in elevation as a function of the elevation target location. The results for
the blind-folded conditions are shown with the HMD (light grey) and without the HMD (dark
grey). The analysis of the linear mixed-effects model including the two conditions, azimuth
and elevation locations, revealed significant main effects of conditions [F(1,2049) = 35.29,
Fig 8. Mean absolute (circles) and signed (boxplots) azimuth error for acoustic localization with varying visual
information in the virtual environment and the real environment. In all conditions, except in the real
environment, subjects wore the head-mounted display (HMD). The conditions depicted with shades of blue color
include visual information of possible source locations. The error is shown over the thirteen azimuth angles in the
horizontal plane (0˚ elevation). The boxplots indicate the median (line) and the first and third quartile. The whiskers
extend to 1.5 times the interquartile range.
https://doi.org/10.1371/journal.pone.0214603.g008
Sound localization with varying visual information in virtual reality
PLOS ONE | https://doi.org/10.1371/journal.pone.0214603 March 29, 2019 12 / 19
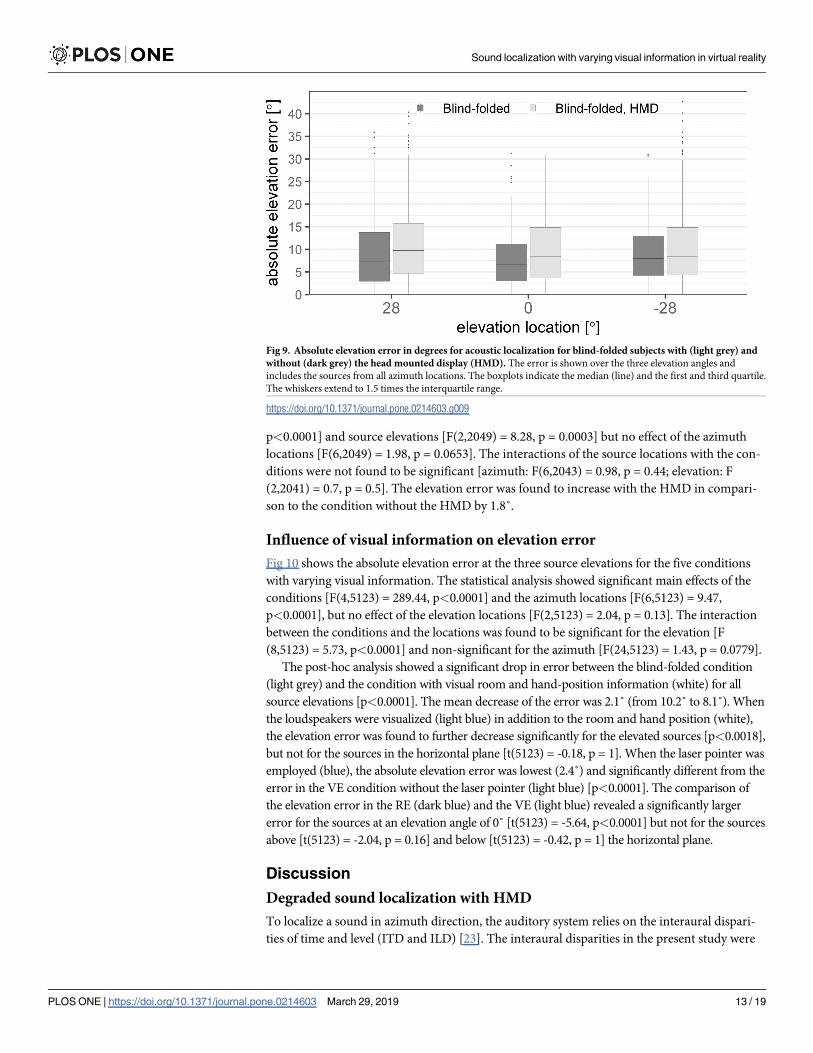
p<0.0001] and source elevations [F(2,2049) = 8.28, p = 0.0003] but no effect of the azimuth
locations [F(6,2049) = 1.98, p = 0.0653]. The interactions of the source locations with the con-
ditions were not found to be significant [azimuth: F(6,2043) = 0.98, p = 0.44; elevation: F
(2,2041) = 0.7, p = 0.5]. The elevation error was found to increase with the HMD in compari-
son to the condition without the HMD by 1.8˚.
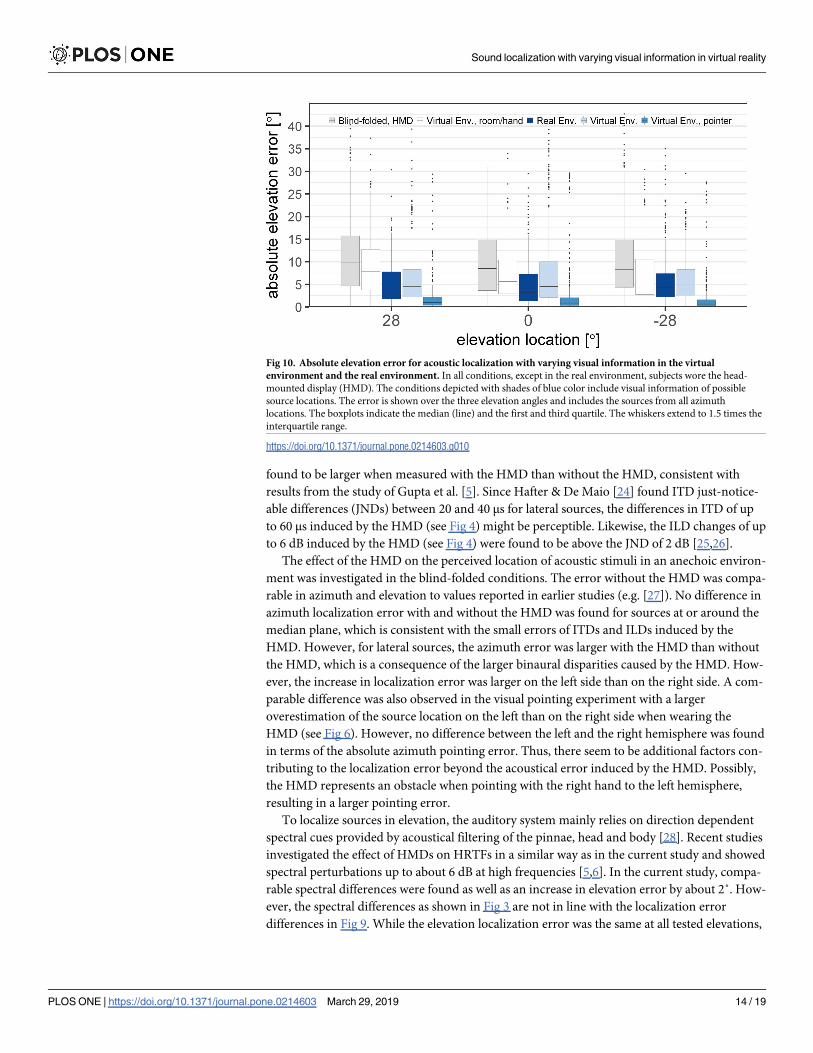
Influence of visual information on elevation error
Fig 10 shows the absolute elevation error at the three source elevations for the five conditions
with varying visual information. The statistical analysis showed significant main effects of the
conditions [F(4,5123) = 289.44, p<0.0001] and the azimuth locations [F(6,5123) = 9.47,
p<0.0001], but no effect of the elevation locations [F(2,5123) = 2.04, p = 0.13]. The interaction
between the conditions and the locations was found to be significant for the elevation [F
(8,5123) = 5.73, p<0.0001] and non-significant for the azimuth [F(24,5123) = 1.43, p = 0.0779].
The post-hoc analysis showed a significant drop in error between the blind-folded condition
(light grey) and the condition with visual room and hand-position information (white) for all
source elevations [p<0.0001]. The mean decrease of the error was 2.1˚ (from 10.2˚ to 8.1˚). When
the loudspeakers were visualized (light blue) in addition to the room and hand position (white),
the elevation error was found to further decrease significantly for the elevated sources [p<0.0018],
but not for the sources in the horizontal plane [t(5123) = -0.18, p = 1]. When the laser pointer was
employed (blue), the absolute elevation error was lowest (2.4˚) and significantly different from the
error in the VE condition without the laser pointer (light blue) [p<0.0001]. The comparison of
the elevation error in the RE (dark blue) and the VE (light blue) revealed a significantly larger
error for the sources at an elevation angle of 0˚ [t(5123) = -5.64, p<0.0001] but not for the sources
above [t(5123) = -2.04, p = 0.16] and below [t(5123) = -0.42, p = 1] the horizontal plane.
Discussion
Degraded sound localization with HMD
To localize a sound in azimuth direction, the auditory system relies on the interaural dispari-
ties of time and level (ITD and ILD) [23]. The interaural disparities in the present study were
Fig 9. Absolute elevation error in degrees for acoustic localization for blind-folded subjects with (light grey) and
without (dark grey) the head mounted display (HMD). The error is shown over the three elevation angles and
includes the sources from all azimuth locations. The boxplots indicate the median (line) and the first and third quartile.
The whiskers extend to 1.5 times the interquartile range.
https://doi.org/10.1371/journal.pone.0214603.g009
Sound localization with varying visual information in virtual reality
PLOS ONE | https://doi.org/10.1371/journal.pone.0214603 March 29, 2019 13 / 19
found to be larger when measured with the HMD than without the HMD, consistent with
results from the study of Gupta et al. [5]. Since Hafter & De Maio [24] found ITD just-notice-
able differences (JNDs) between 20 and 40 μs for lateral sources, the differences in ITD of up
to 60 μs induced by the HMD (see Fig 4) might be perceptible. Likewise, the ILD changes of up
to 6 dB induced by the HMD (see Fig 4) were found to be above the JND of 2 dB [25,26].
The effect of the HMD on the perceived location of acoustic stimuli in an anechoic environ-
ment was investigated in the blind-folded conditions. The error without the HMD was compa-
rable in azimuth and elevation to values reported in earlier studies (e.g. [27]). No difference in
azimuth localization error with and without the HMD was found for sources at or around the
median plane, which is consistent with the small errors of ITDs and ILDs induced by the
HMD. However, for lateral sources, the azimuth error was larger with the HMD than without
the HMD, which is a consequence of the larger binaural disparities caused by the HMD. How-
ever, the increase in localization error was larger on the left side than on the right side. A com-
parable difference was also observed in the visual pointing experiment with a larger
overestimation of the source location on the left than on the right side when wearing the
HMD (see Fig 6). However, no difference between the left and the right hemisphere was found
in terms of the absolute azimuth pointing error. Thus, there seem to be additional factors con-
tributing to the localization error beyond the acoustical error induced by the HMD. Possibly,
the HMD represents an obstacle when pointing with the right hand to the left hemisphere,
resulting in a larger pointing error.
To localize sources in elevation, the auditory system mainly relies on direction dependent
spectral cues provided by acoustical filtering of the pinnae, head and body [28]. Recent studies
investigated the effect of HMDs on HRTFs in a similar way as in the current study and showed
spectral perturbations up to about 6 dB at high frequencies [5,6]. In the current study, compa-
rable spectral differences were found as well as an increase in elevation error by about 2˚. How-
ever, the spectral differences as shown in Fig 3 are not in line with the localization error
differences in Fig 9. While the elevation localization error was the same at all tested elevations,
Fig 10. Absolute elevation error for acoustic localization with varying visual information in the virtual
environment and the real environment. In all conditions, except in the real environment, subjects wore the head-
mounted display (HMD). The conditions depicted with shades of blue color include visual information of possible
source locations. The error is shown over the three elevation angles and includes the sources from all azimuth
locations. The boxplots indicate the median (line) and the first and third quartile. The whiskers extend to 1.5 times the
interquartile range.
https://doi.org/10.1371/journal.pone.0214603.g010
Sound localization with varying visual information in virtual reality
PLOS ONE | https://doi.org/10.1371/journal.pone.0214603 March 29, 2019 14 / 19

the spectral differences varied with source elevation. Specifically, smaller spectral differences
were found for sources below the horizontal plane than at or above the horizontal plane. Thus,
the spectral difference is not a good predictor of the localization accuracy. In fact, it has been
shown that spectral differences do not correlate well with elevation localization errors [29] but
that elevation perception is based on multi-feature, template-based matching [30–32].
Visual information influences sound localization in VR
In the virtual condition representing the simulated anechoic room without loudspeakers, a ref-
erence frame was provided by the room and the subjects could see the pointer. The sound
localization error was found to be smaller with this visual information than in the blind-folded
condition with the HMD. The contributions of the visual information about the hand position
and about the room dimensions cannot be separated, since the current study was not designed
to distinguish between these two visual aspects. Tabry et al. [10] also observed lower errors of
both azimuth and elevation sound localization in conditions similar to those in the current
study whereby real visual information of the subjects’ body and of the room were presented
instead of virtual visual information. Thus, the amount of visual information provided in the
current study may be considered to resemble those provided in a real environment. However,
Tabry et al. [10] found substantially larger elevation errors than in the present study both in
the condition with and without visual information. The smaller elevation errors found in the
present study might be due to the limited set of elevation source locations (-28˚, 0˚, 28˚) as
compared to the study of Tabry et al. [10], where the range of elevations was between -37.5˚
and 67.5˚. Subjects might be able to learn possible source locations which can improve the
localization accuracy [33].
When the source locations were visible, the azimuth and elevation errors decreased by 3˚
and 1.5˚, respectively, consistent with results obtained in real environments [34]. No improve-
ment in localization accuracy was found in azimuth for frontal sources and in elevation for
sources in the horizontal plane, because the auditory localization accuracy, even without visi-
ble source locations, was already high compared to those that are away from the midline and
horizontal plane. However, there was likely a high visual bias towards the loudspeakers in this
condition. Thus, mainly pointing accuracy and not sound localization accuracy was measured.
The location priors have an even higher impact on the elevation than on the azimuth accuracy
since only three elevation locations were used.
The additional information provided by the visual feedback from the laser pointer had only
a negligible effect on the localization accuracy in azimuth, but a clear effect on the elevation
accuracy. The elevation error was larger when no laser pointer was visible which might be
partly due to the shape of the VR controller. The shape of the controller led to a biased point-
ing direction. The bias correction as described above (see Fig 2) was intended to reduce the
influence of the controller. However, even though the subjects were asked to always hold the
controller in the same way, the controller positioning might have varied leading to a larger
pointing error when no visual feedback of the laser pointer was provided. Even though the
effect of the laser pointer on the mean azimuth error was negligible, the variance of the sub-
jects’ responses decreased when the visual feedback of the pointing direction was available.
Thus, the responses with the laser pointer become more reliable.
Comparing the localization error in the real and the virtual environments showed no differ-
ences in terms of the azimuth error. The elevation error was significantly increased at 0˚ eleva-
tion and was found to be slightly, but not significantly, larger above the horizontal plane even
though not significantly. Below the horizontal plane no difference between RE and the VE was
found. Even though the provided visual information was supposed to be the same in the two
Sound localization with varying visual information in virtual reality
PLOS ONE | https://doi.org/10.1371/journal.pone.0214603 March 29, 2019 15 / 19

environments, some differences were unavoidable. In the real loudspeaker environment the
subjects could see their arms, but not in the VE, where only the controller was visible. How-
ever, Van Beers et al. [35] showed that the visual feedback of the arm does not seem to increase
visual object localization accuracy compared to the situation when only the finger is visible.
Nevertheless, for pointing to sources on and above the horizontal plane the arm might have
been helpful visual information for more accurate pointing, however, no such evidence was
found in the visual pointing experiment.
Potential training effects
The subjects did not receive training before starting the experiment, but were introduced to
the task and the controller. Previous studies indicated that training can improve sound locali-
zation accuracy [16,36,37]. Since the subjects could not be introduced to the visual loudspeaker
environment beforehand, no training was provided to avoid potential benefits in certain con-
ditions but not in others. It is possible that the localization performance of the subjects
improved throughout the course of the experiment. To minimize this effect, the conditions
were presented in a random order within the experimental blocks. The random-order presen-
tation avoided a bias within the blocks but could not exclude an inter-block bias. Such inter-
block bias was unavoidable because visual information needed to be revealed to the subjects
reflecting an increase of information content.
Implications for VR in hearing research
VR glasses in combination with audio reproduction techniques may allow for novel ways of
conducting research in simulated realistic environments. While previous research typically
involved simple audio-visual information, with VR, research can be conducted in ecologically
more valid environments while maintaining controllability and reproducibility of the experi-
ment. Even though the localization error increased with the HMD in the blind-folded condi-
tion, these errors may not be noticeable in realistic environments including visual information.
This might also be the case for hearing-impaired subjects for whom sound localization accuracy
is commonly reduced compared to normal-hearing subjects [38].
Even though only a single device, the HTC Vive, was investigated in the current study the
findings may generalize with regards to other commercial virtual reality glasses. It has been
shown that other HMDs, including the Oculus Rift (Oculus VR LLC, Menlo Park, CA) or the
Microsoft HoloLens (Microsoft, Redmond, WA), lead to comparable or even smaller acoustic
perturbations [5,6]. Thus, the sound localization error due to the HMD is likely to be compara-
ble or lower than that of the HTC Vive. Visual reproduction and tracking specifications seem
comparable between current commercial products.
Conclusions
VR systems and loudspeaker-based audio reproduction allow for full immersion into an
audio-visual scene. In the present study, sound source localization accuracy with an HMD pro-
viding a varying amount of visual information was investigated. A calibration system to align
the real world and the virtual world was developed. Hand-pointing accuracy to visual targets
was evaluated using commercially available controllers. The accuracy of the hand pointing to
visual targets was found to be high in the azimuth direction, whereas a large bias was found in
terms of elevation accuracy due to the shape of the controller. The sound localization experi-
ment demonstrated a small detrimental effect of the HMD on the sound localization accuracy.
While the azimuth error induced by wearing the HMD was negligible in the frontal area, it
was significant at more lateral sound source locations which is in line with changes in binaural
Sound localization with varying visual information in virtual reality
PLOS ONE | https://doi.org/10.1371/journal.pone.0214603 March 29, 2019 16 / 19

disparities. However, the error induced by the HMD was found to be larger on the left than on
the right side in the acoustic localization experiment. Similarly, in the visual pointing experi-
ment a larger overshoot was found with the HMD than without in the left but not in the right
hemisphere. Thus, the error might not be purely of acoustic nature but also due to the HMD
influencing the motion behavior. The elevation error was about 2˚ larger with the HMD for all
azimuth and elevation directions.
Generally, the sound localization accuracy was found to be higher when visual information
was available than in the conditions without visual information. The lowest accuracy was
found when the subjects were blind-folded and a significant improvement was found for both
azimuth and elevation when room and hand position information were provided. An addi-
tional laser pointer for pointing guidance did not lead to an improvement of azimuth localiza-
tion but an improved elevation localization.
Author Contributions
Conceptualization: Axel Ahrens.
Data curation: Axel Ahrens, Kasper Duemose Lund.
Formal analysis: Axel Ahrens.
Funding acquisition: Torsten Dau.
Investigation: Axel Ahrens, Kasper Duemose Lund.
Methodology: Axel Ahrens, Kasper Duemose Lund.
Project administration: Axel Ahrens, Torsten Dau.
Software: Axel Ahrens, Kasper Duemose Lund.
Supervision: Marton Marschall, Torsten Dau.
Visualization: Axel Ahrens.
Writing – Review & Editing: Torsten Dau.
Writing – original draft: Axel Ahrens.
Writing – review & editing: Axel Ahrens, Kasper Duemose Lund, Marton Marschall.
References1. Blauert J. Spatial hearing: the psychophysics of human sound localization. MIT Press; 1997.
2. Hofman PM, Van Riswick JGA, Van Opstal AJ. Relearning Sound Localization with New Ears. Nat Neu-
rosci. 1998; 1: 417–421. https://doi.org/10.1038/1633 PMID: 10196533
3. Shinn-Cunningham BG, Durlach NI, Held RM. Adapting to supernormal auditory localization cues. II.
Constraints on adaptation of mean response. J Acoust Soc Am. 1998; 103: 3667–3676. https://doi.org/
10.1121/1.423107 PMID: 9637048
4. Shinn-Cunningham BG, Durlach NI, Held RM. Adapting to supernormal auditory localization cues. I.
Bias and resolution. J Acoust Soc Am. 1998; 103: 3656–3666. https://doi.org/10.1121/1.423088 PMID:
9637047
5. Gupta R, Ranjan R, He J, Gan W-S. Investigation of effect of VR/AR headgear on Head related transfer
functions for natural listening. AES International Conference on Audio for Virtual and Augmented Real-
ity. Redmond; 2018. Available: http://www.aes.org/e-lib/browse.cfm?elib=19697
6. Genovese A, Zalles G, Reardon G, Roginska A. Acoustic perturbations in HRTFs measured on Mixed
Reality Headsets. AES International Conference on Audio for Virtual and Augmented Reality. Red-
mond; 2018.
7. Howard IP, Templeton WB. Human spatial orientation. Human spatial orientation. Oxford, England:
John Wiley & Sons; 1966.
Sound localization with varying visual information in virtual reality
PLOS ONE | https://doi.org/10.1371/journal.pone.0214603 March 29, 2019 17 / 19

8. Recanzone GH. Interactions of auditory and visual stimuli in space and time. Hear Res. 2009; 258: 89–
99. https://doi.org/10.1016/j.heares.2009.04.009 PMID: 19393306
9. Maddox RK, Pospisil DA, Stecker GC, Lee AKC. Directing Eye Gaze Enhances Auditory Spatial Cue
Discrimination. Curr Biol. Elsevier Ltd; 2014; 24: 748–752. https://doi.org/10.1016/j.cub.2014.02.021
PMID: 24631242
10. Tabry V, Zatorre RJ, Voss P. The influence of vision on sound localization abilities in both the horizontal
and vertical planes. Front Psychol. 2013; 4: 1–7. https://doi.org/10.3389/fpsyg.2013.00001
11. Borrego A, Latorre J, Alcañiz M, Llorens R. Comparison of Oculus Rift and HTC Vive: Feasibility for Vir-
tual Reality-Based Exploration, Navigation, Exergaming, and Rehabilitation. Games Health J. 2018; 7:
g4h.2017.0114. https://doi.org/10.1089/g4h.2017.0114 PMID: 29293369
12. Niehorster DC, Li L, Lappe M. The Accuracy and Precision of Position and Orientation Tracking in the
HTC Vive Virtual Reality System for Scientific Research. Iperception. 2017; 8: 204166951770820.
https://doi.org/10.1177/2041669517708205 PMID: 28567271
13. Dufour A, Despres O, Pebayle T. Visual and auditory facilitation in auditory spatial localization. Vis
cogn. 2002; 9: 741–753. https://doi.org/10.1080/13506280042000250
14. Perrett S, Noble W. The effect of head rotations on vertical plane sound localization. J Acoust Soc Am.
1997; 102: 2325–2332. https://doi.org/10.1121/1.419642 PMID: 9348691
15. Musicant AD, Butler RA. The influence of pinnae-based spectral cues on sound localization. J Acoust
Soc Am. 1984; 75: 1195–1200. https://doi.org/10.1121/1.390770 PMID: 6725769
16. Makous JC, Middlebrooks JC. Two-dimensional sound localization by human listeners. J Acoust Soc
Am. 1990; 87: 2188–2200. https://doi.org/10.1121/1.399186 PMID: 2348023
17. Muller S, Massarani P. Transfer-Function Measurement with Sweeps. J Audio Eng Soc. 2001; 49: 443–
471. Available: http://www.aes.org/e-lib/browse.cfm?elib=10189
18. Glasberg BR, Moore BC. Derivation of auditory filter shapes from notched-noise data. Hear Res. 1990;
47: 103–38. Available: http://www.ncbi.nlm.nih.gov/pubmed/2228789 PMID: 2228789
19. Soendergaard P, Majdak P. The Auditory Modeling Toolbox. In: Blauert J, editor. The Technology of
Binaural Listening. Berlin, Heidelberg: Springer; 2013. pp. 33–56.
20. Nam J, Abel J, Iii JS. A method for estimating interaural time difference for binaural synthesis. Audio
Eng Soc Conv 125. 2008; 0–6. Available: http://www.aes.org/e-lib/browse.cfm?elib=14763
21. Kuznetsova A, Christensen RHB, Bavay C, Brockhoff PB. Automated mixed ANOVA modeling of sen-
sory and consumer data. Food Qual Prefer. Elsevier Ltd; 2014; 40: 31–38. https://doi.org/10.1016/j.
foodqual.2014.08.004
22. Lenth R V. Least-Squares Means: The R Package lsmeans. J Stat Softw. 2016;69. https://doi.org/10.
18637/jss.v069.i01
23. Rayleigh Lord. On our Perception of Sound Direction. Philos Mag. 1907; 13: 214–232.
24. Hafter ER, De Maio J. Difference thresholds for interaural delay. J Acoust Soc Am. 1975; 57: 181–187.
https://doi.org/10.1121/1.380412 PMID: 1110279
25. Mills AW. Lateralization of High-Frequency Tones. J Acoust Soc Am. 1960; 32: 132–134. https://doi.
org/10.1121/1.1907864
26. Hafter ER, Dye RH, Neutzel JM, Aronow H. Difference thresholds for interaural intensity. J Acoust Soc
Am. 1977; 61: 829–834. https://doi.org/10.1121/1.381372 PMID: 853155
27. Oldfield SR, Parker SP a. Acuity of Sound Localization: A Topography of Auditory Space. I. Normal
Hearing Conditions. Perception. 1984; 13: 581–600. https://doi.org/10.1068/p130581 PMID: 6535983
28. Hebrank J, Wright D. Spectral cues used in the localization of sound sources on the median plane. J
Acoust Soc Am. 1974; 56: 1829–1834. https://doi.org/10.1121/1.1903520 PMID: 4443482
29. Middlebrooks JC. Virtual localization improved by scaling nonindividualized external-ear transfer func-
tions in frequency. J Acoust Soc Am. 1999; 106: 1493–1510. https://doi.org/10.1121/1.427147 PMID:
10489706
30. Macpherson EA, Sabin AT. Vertical-plane sound localization with distorted spectral cues. Hear Res.
Elsevier B.V.; 2013; 306: 76–92. https://doi.org/10.1016/j.heares.2013.09.007 PMID: 24076423
31. Van Opstal AJ, Vliegen J, Van Esch T. Reconstructing spectral cues for sound localization from
responses to rippled noise stimuli. PLoS One. 2017; 12: 1–29. https://doi.org/10.1371/journal.pone.
0174185 PMID: 28333967
32. Baumgartner R, Majdak P, Laback B. Modeling sound-source localization in sagittal planes for human
listeners. J Acoust Soc Am. 2014; 136: 791–802. https://doi.org/10.1121/1.4887447 PMID: 25096113
33. Ege R, Opstal AJ Van, Van Wanrooij MM. Accuracy-Precision Trade-off in Human Sound Localisation.
Sci Rep. Springer US; 2018; 8: 1–12. https://doi.org/10.1038/s41598-017-17765-5
Sound localization with varying visual information in virtual reality
PLOS ONE | https://doi.org/10.1371/journal.pone.0214603 March 29, 2019 18 / 19

34. Shelton BR, Searle CL. The influence of vision on the absolute identification of sound-source position.
Percept Psychophys. 1980; 28: 589–596. https://doi.org/10.3758/BF03198830 PMID: 7208275
35. Van Beers RJ, Sittig AC, Denier Van Der Gon JJ. Localization of a seen finger is based exclusively on
proprioception and on vision of the finger. Exp Brain Res. 1999; 125: 43–49. https://doi.org/10.1007/
s002210050656 PMID: 10100975
36. Carlile S, Leong P, Hyams S, Pralong D. The nature and distribution of errors in the localization of
sounds in humans [Internet]. Hearing Research. 1997. pp. 179–196. Available: http://www.ncbi.nlm.nih.
gov/pubmed/8988615%5Cnerrors_hr97.pdf
37. Majdak P, Goupell MJ, Laback B. 3-D localization of virtual sound sources: Effects of visual environ-
ment, pointing method, and training. Attention, Perception, Psychophys. 2010; 72: 454–469. https://doi.
org/10.3758/APP.72.2.454 PMID: 20139459
38. Dobreva MS, O’Neill WE, Paige GD. Influence of aging on human sound localization. J Neurophysiol.
2011; 105: 2471–2486. https://doi.org/10.1152/jn.00951.2010 PMID: 21368004
Sound localization with varying visual information in virtual reality
PLOS ONE | https://doi.org/10.1371/journal.pone.0214603 March 29, 2019 19 / 19

![Time-varying jump tails - Duke Universitypublic.econ.duke.edu/~boller/Published_Papers/joe_14.pdf · varying± ± ± ± ± − (+ −]) ± (+ − ±, =,..., −] = −, −] = −,),](https://img.pdfslide.us/doc/110x75/5f9eb1e298e27c43de4b3c12/time-varying-jump-tails-duke-bollerpublishedpapersjoe14pdf-varying-.jpg)