Embed Size (px)
Citation preview
Sound BarsRetail Products Platform ENERGY STAR Partners Meeting
Beth LittlehalesProgram Manager
October 2016
An alliance of utilities and energy efficiency organizations
Overview
• Goals of Market Transformation
• ENERGY STAR® Retail Products Platform (ESRPP)
• Sound Bar Energy Savings
• Lessons Learned
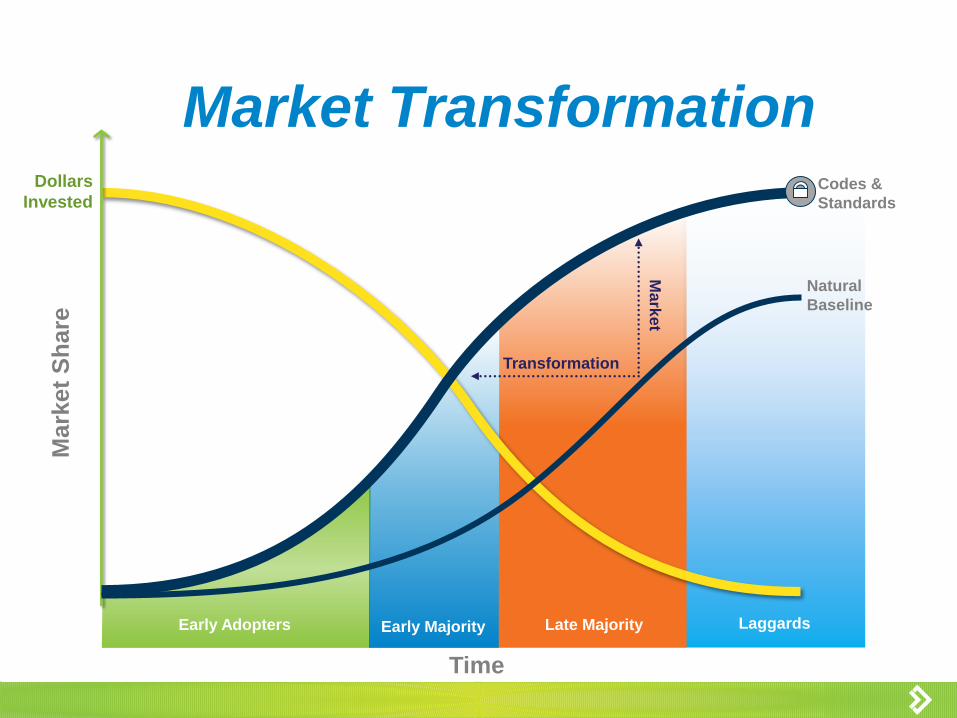
Market Transformation
Time
Dollars
Invested
Natural
Baseline
Codes &
Standards
Mark
et
Sh
are
Early Majority Late MajorityEarly Adopters Laggards
Transformation
Ma
rke
t
Retail Products Platform
• Midstream incentives
• Portfolio of products
• Seek to influence retailer buying and
assortment practices
• Ultimate goal: influence manufacturing
Collaborating with ENERGY STAR
• Market Transformation requires scale
• Play to your strengths
• Value of ENERGY STAR brand
• If not RPP, then what?
Current Portfolio
• Sound bars
• Air cleaners/purifiers
• Freezers
• Dryers
• Room AC
• Each product has two incentive tiers (except Room AC)
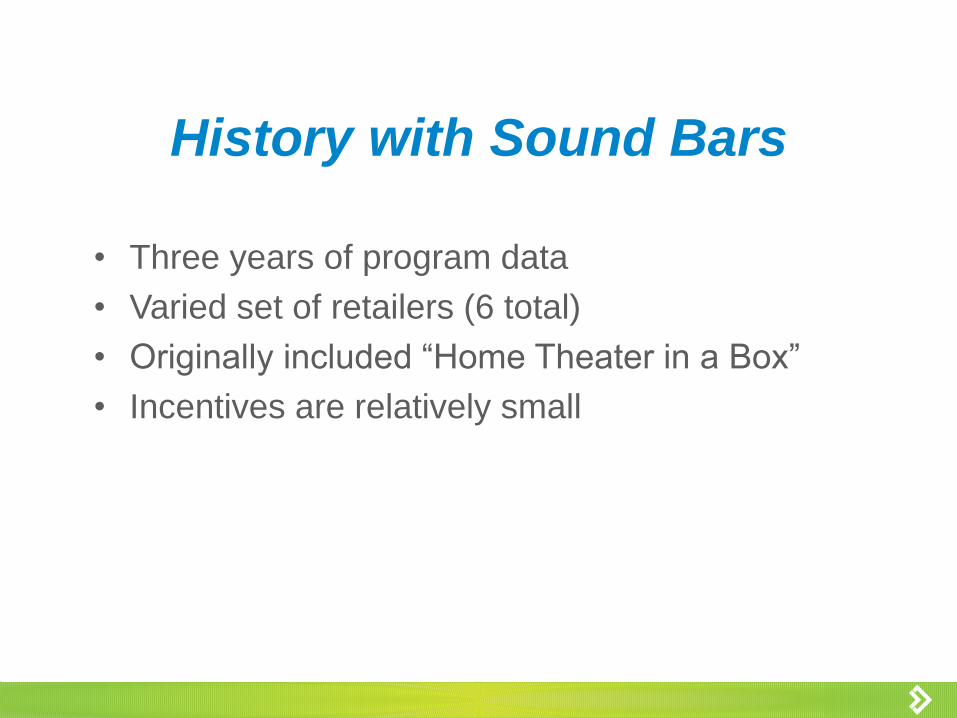
History with Sound Bars
• Three years of program data
• Varied set of retailers (6 total)
• Originally included “Home Theater in a Box”
• Incentives are relatively small
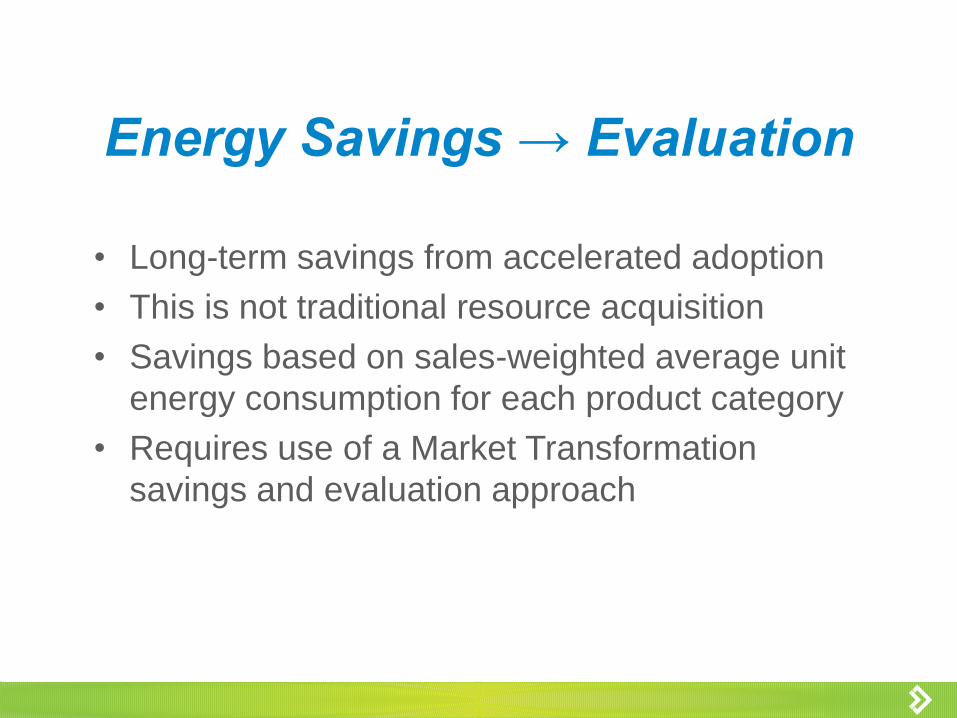
Energy Savings → Evaluation
• Long-term savings from accelerated adoption
• This is not traditional resource acquisition
• Savings based on sales-weighted average unit
energy consumption for each product category
• Requires use of a Market Transformation
savings and evaluation approach
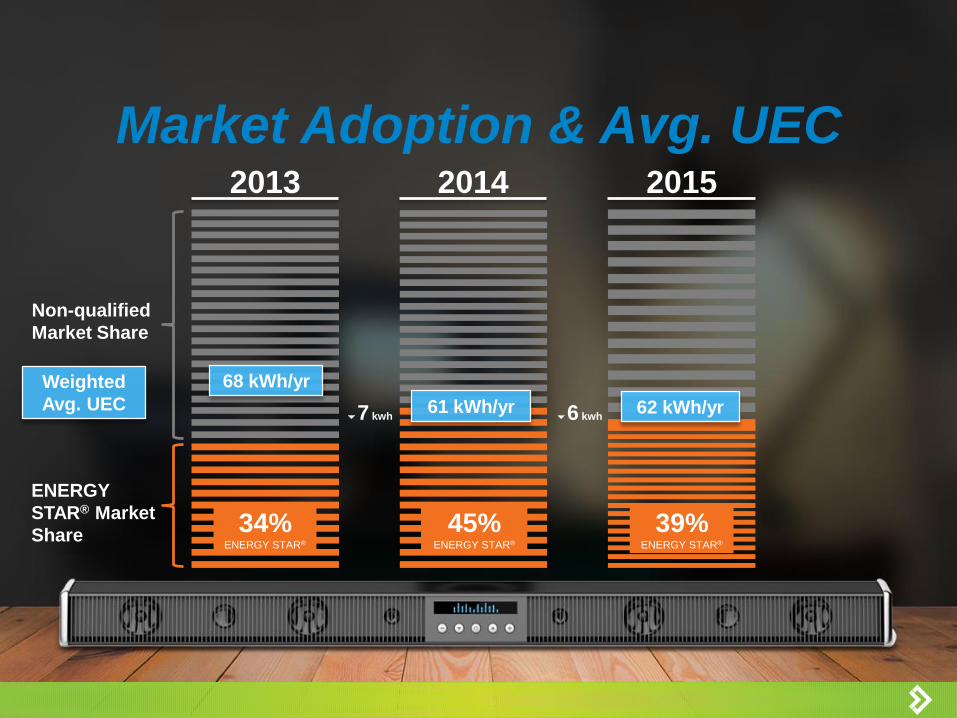
Market Adoption & Avg. UEC
61 kWh/yr
34%ENERGY STAR®
68 kWh/yr
62 kWh/yr
45%ENERGY STAR®
39%ENERGY STAR®
Non-qualified
Market Share
ENERGY
STAR® Market
Share
2013 2014 2015
67 kwh 66 kwh
Weighted
Avg. UEC
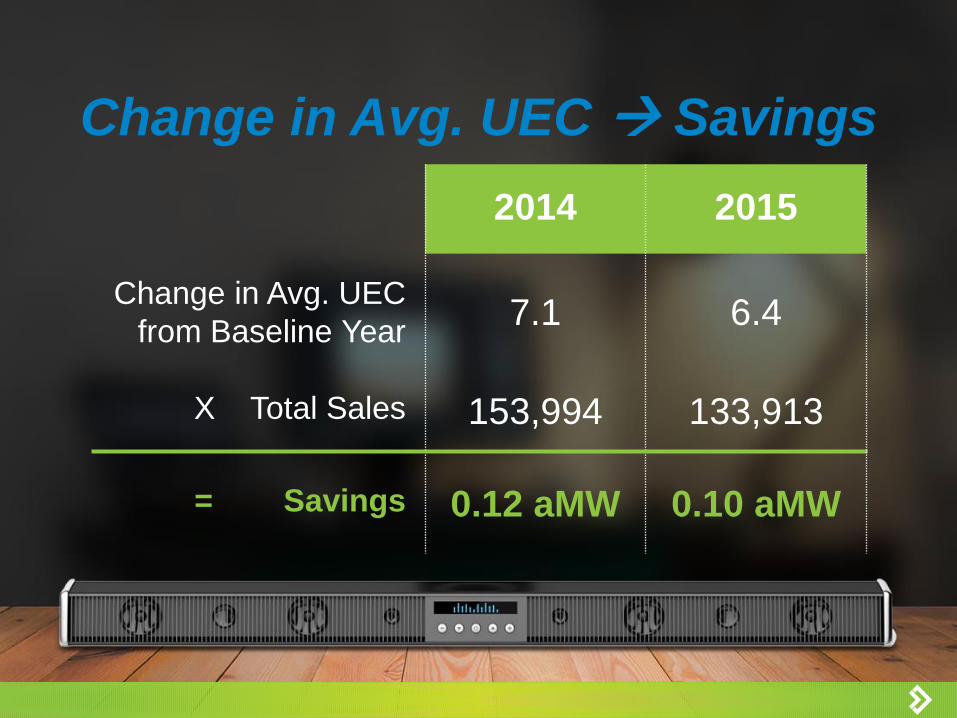
Change in Avg. UEC Savings
2014 2015
Change in Avg. UEC
from Baseline Year7.1 6.4
X Total Sales 153,994 133,913
= Savings 0.12 aMW 0.10 aMW
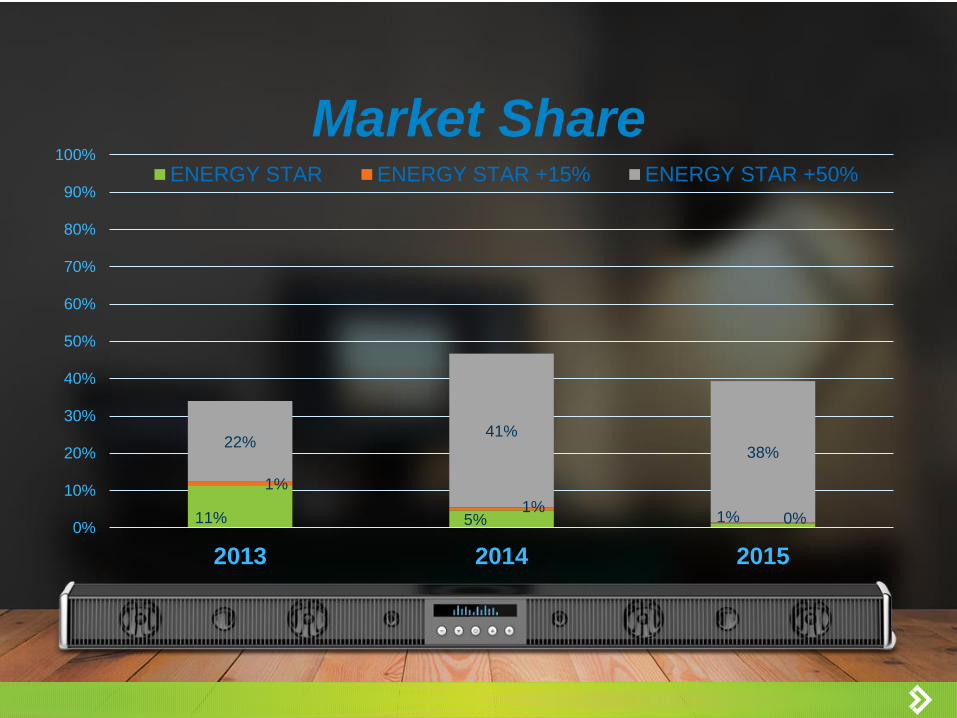
Market Share
11% 5% 1%
1%
1%0%
22%41%
38%
0%
10%
20%
30%
40%
50%
60%
70%
80%
90%
100%
2013 2014 2015
ENERGY STAR ENERGY STAR +15% ENERGY STAR +50%
Goal Setting → Forecasts
• Programmatic goals
• Portfolio goals
• Ultimate goal: Market Transformation
NEEA 20 Year Savings Forecast Range
76 – 202 aMW
Lessons Learned
• ENERGY STAR Audio/Video product spec
• Quickly moving technology
• Retailer mix is important
• Product models are clustered at a few levels of
efficiency
• Sound bars are very promising based on our
near-term savings forecasts
Thank You
Question and Answer Session


![[EN] [Bars] Tracklt, the new sound system for your](https://img.pdfslide.us/doc/110x75/5876f7af1a28abf3398b5ac5/en-bars-tracklt-the-new-sound-system-for-your.jpg)