Embed Size (px)
Citation preview
Soul of the CommunitySeptember 2009
Knight Communities Overall
Knight Communities Overall
2
Copyright Standards
Copyright © 2009 Gallup, Inc. All rights reserved.
This document contains proprietary research, copyrighted materials, and literary property of Gallup, Inc. It is for the guidance of your company only and is not to be copied, quoted, published, or divulged to others outside of your organization. Gallup®, Q12®, The Gallup Path®, The Gallup Poll®, CE11®, SF34®, Business Impact Analysis™, SRI® and Gallup Consulting® are trademarks of Gallup, Inc. All other trademarks are the property of their respective owners.
This document is of great value to both your organization and Gallup, Inc. Accordingly, international and domestic laws and penalties guaranteeing patent, copyright, trademark, and trade secret protection protect the ideas, concepts, and recommendations related within this document.
No changes may be made to this document without the express written permission of Gallup, Inc.
Knight Communities Overall Agenda
Community Attachment Overview Overall Measures of Biggest Problem and Life Evaluation The Drivers of Community Attachment Ratings on Domains of Community Attachment Domain Ratings by Comparison Groups Recommendations on Focus Areas and Groups CA by Demographic Groups Appendix (Survey Items, Community Lists, Key Terms)
3 Copyright © 2009 Gallup, Inc. All rights reserved.
Note: Speaking and discussion points are included in the notes section of many slides
Knight Communities Overall
4
Why Community Attachment?
The Soul of the Community project is a three-year study by Gallup funded by Knight Foundation that explores what community qualities influence residents’ loyalty and passion for where they live and how those feelings relate to indicators of community well-being such as local economic growth and vitality in 26 U.S. communities.
By pinpointing what drives residents’ loyalty and passion for where they live, this study helps local leaders influence residents’ feelings about their community — and potentially its well-being.
This project does not serve as a replacement for national economic policy, but it does make the case that residents’ attachment to where they live matters to community vitality. As the country emerges from the economic crisis, this project highlights what draws residents to their communities and that this emotional connection may help local economic growth.
Copyright © 2009 Gallup, Inc. All rights reserved.
Knight Communities Overall
5
Methodology
U.S. Census geography — Core-Based-Statistical Areas
– Larger communities were generally Metropolitan Statistical Areas (MSAs) or Metropolitan Districts (MDs); smaller areas were Micropolitan Statistical Areas (µSAs)
– Long Beach, CA was defined by ZIP codes as the City of Long Beach
Random Digit Dialing (RDD) sample of households in each of the 26 Knight Foundation Communities
Telephone interview with about 400 randomly identified adults aged 18+
– Oversample of 1,500 interviews in Detroit, Charlotte, and Akron
Interviewing dates February 17 through April 25, 2009 About 400 completed interviews per community Data were weighted in each community to reflect the adult population by age, gender,
race, and ethnicity. Communities were put into their correct proportion based on total U.S. adult population.
Due to variances in the question scales, most data were rescaled to a 3-point scale for comparability (low, medium, high). A description of the specific items and the rescaled values can be found in the Appendix.
Copyright © 2009 Gallup, Inc. All rights reserved.
Knight Communities Overall
6
Community Attachment
AttitudinalCA = Loyalty + Passion
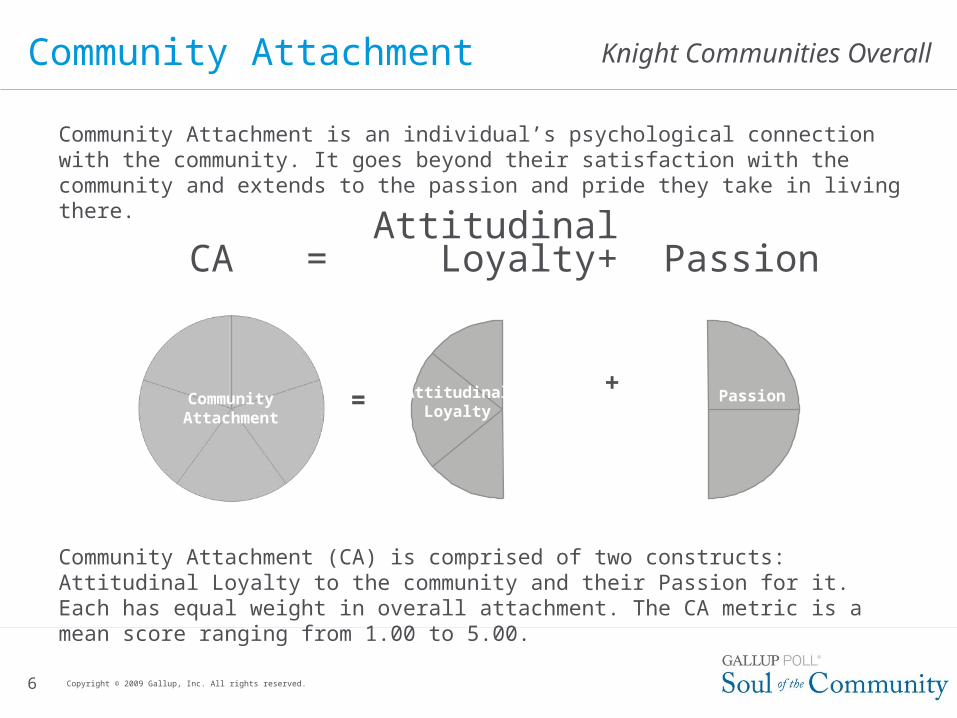
Community Attachment (CA) is comprised of two constructs: Attitudinal Loyalty to the community and their Passion for it. Each has equal weight in overall attachment. The CA metric is a mean score ranging from 1.00 to 5.00.
Community Attachment is an individual’s psychological connection with the community. It goes beyond their satisfaction with the community and extends to the passion and pride they take in living there.
Copyright © 2009 Gallup, Inc. All rights reserved.
+=Community
Attachment
Attitudinal Loyalty
Passion
Knight Communities Overall
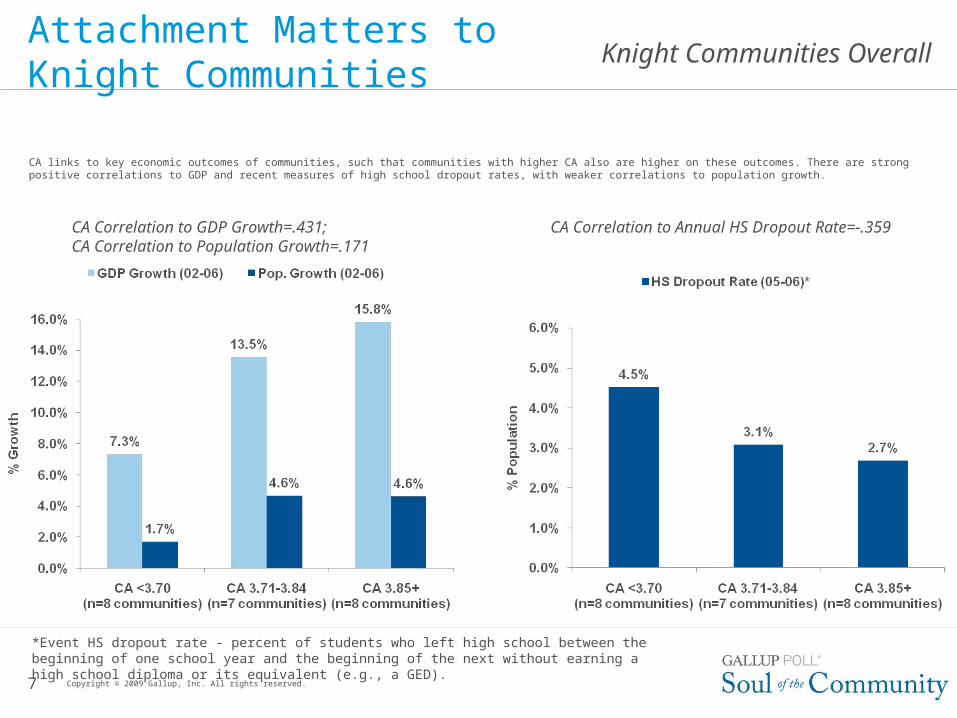
CA links to key economic outcomes of communities, such that communities with higher CA also are higher on these outcomes. There are strong positive correlations to GDP and recent measures of high school dropout rates, with weaker correlations to population growth.
7
Attachment Matters to Knight Communities
CA Correlation to GDP Growth=.431; CA Correlation to Annual HS Dropout Rate=-.359CA Correlation to Population Growth=.171
Copyright © 2009 Gallup, Inc. All rights reserved.
*Event HS dropout rate - percent of students who left high school between the beginning of one school year and the beginning of the next without earning a high school diploma or its equivalent (e.g., a GED).
Knight Communities Overall
8
Community Attachment Groups
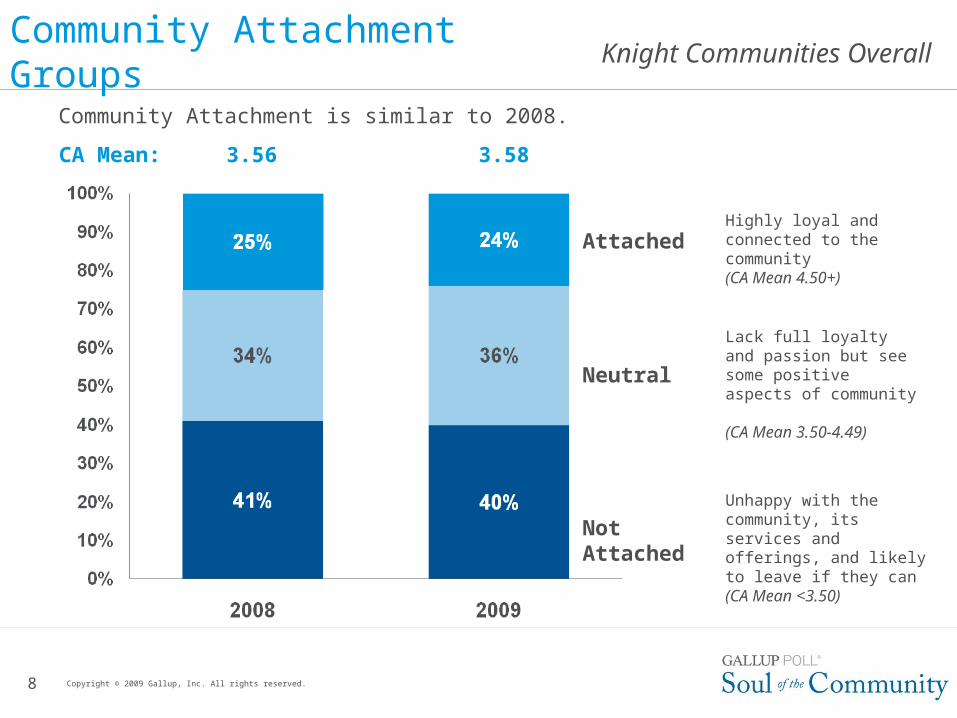
Highly loyal and connected to the community (CA Mean 4.50+)
Lack full loyalty and passion but see some positive aspects of community (CA Mean 3.50-4.49)
Unhappy with the community, its services and offerings, and likely to leave if they can (CA Mean <3.50)
CA Mean: 3.56 3.58
Attached
Neutral
Not Attached
Copyright © 2009 Gallup, Inc. All rights reserved.
Community Attachment is similar to 2008.
Knight Communities Overall
9
Community Attachment by Knight Community
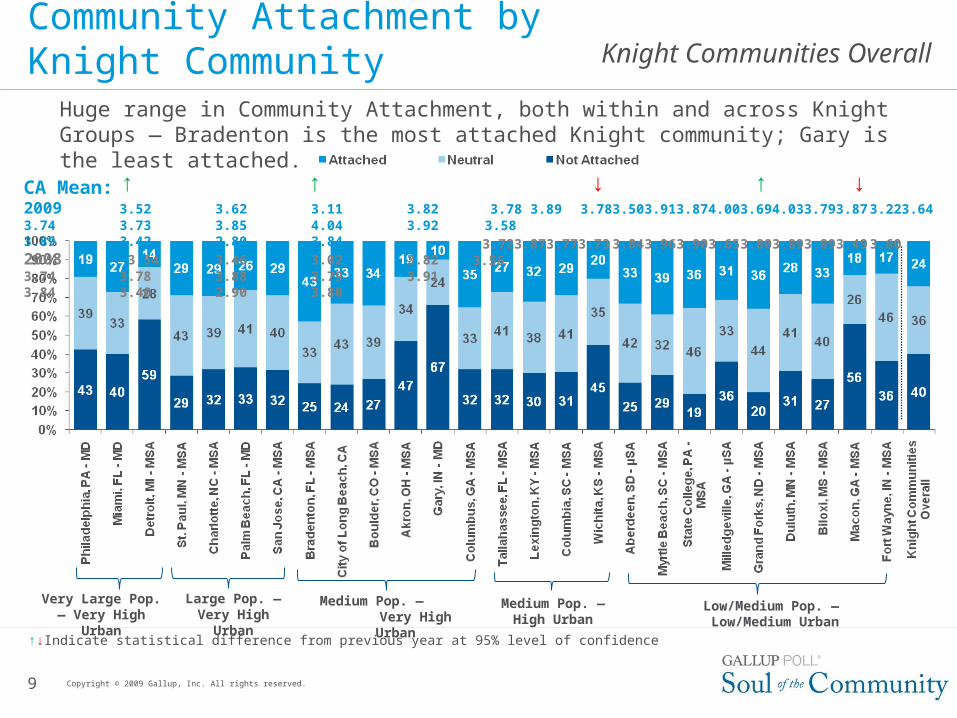
Huge range in Community Attachment, both within and across Knight Groups — Bradenton is the most attached Knight community; Gary is the least attached.
Very Large Pop. — Very High Urban
Large Pop. — Very High Urban
Medium Pop. — Very High Urban
Medium Pop. — High Urban
Low/Medium Pop. — Low/Medium Urban
CA Mean:2009 3.52 3.62 3.11 3.82 3.74 3.73 3.85 4.04 3.92 3.89 3.42 2.80 3.84
2008 3.54 3.46 3.02 3.823.74 3.78 3.88 3.79 3.913.84 3.40 2.90 3.80
3.78 3.89 3.78 3.50 3.91 3.87 4.00 3.69 4.03 3.79 3.87 3.22 3.64 3.58
3.72 3.87 3.77 3.73 3.84 3.96 3.90 3.65 3.80 3.89 3.89 3.49 3.60 3.56
Copyright © 2009 Gallup, Inc. All rights reserved.
↑↓Indicate statistical difference from previous year at 95% level of confidence
↑ ↑ ↑ ↓↓
Knight Communities Overall
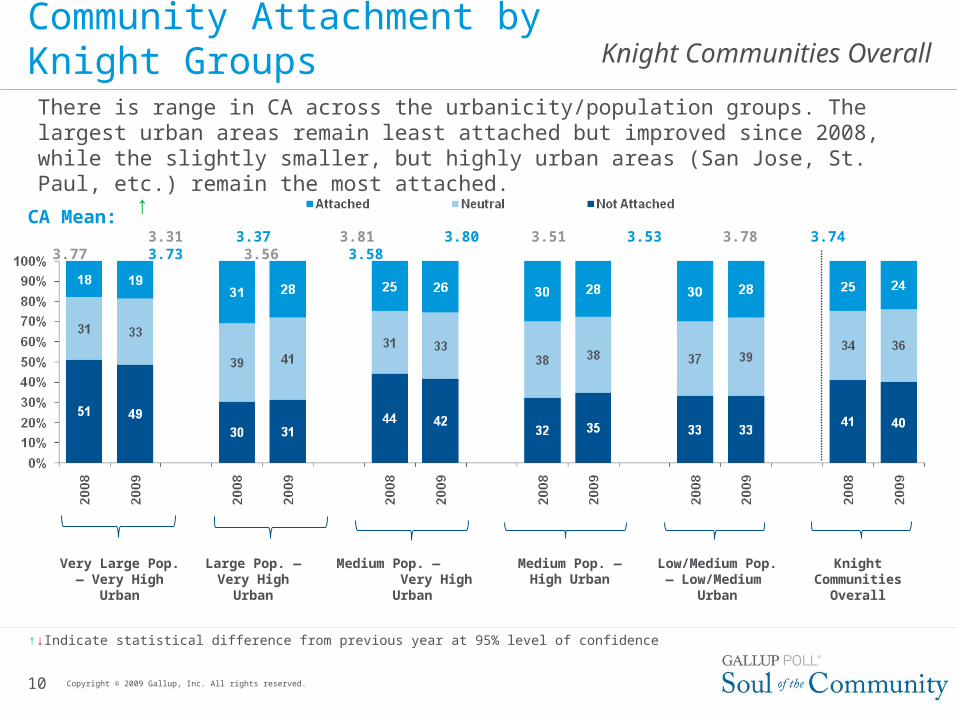
CA Mean: 3.31 3.37 3.81 3.80 3.51 3.53 3.78 3.74 3.77 3.73
3.56 3.58
10
Community Attachment by Knight GroupsThere is range in CA across the urbanicity/population groups. The largest urban areas remain least attached but improved since 2008, while the slightly smaller, but highly urban areas (San Jose, St. Paul, etc.) remain the most attached.
Very Large Pop. — Very High Urban
Large Pop. — Very High Urban
Medium Pop. — Very High Urban
Medium Pop. —High Urban
Low/Medium Pop. — Low/Medium
Urban
Copyright © 2009 Gallup, Inc. All rights reserved.
Knight Communities
Overall
↑↓Indicate statistical difference from previous year at 95% level of confidence
↑
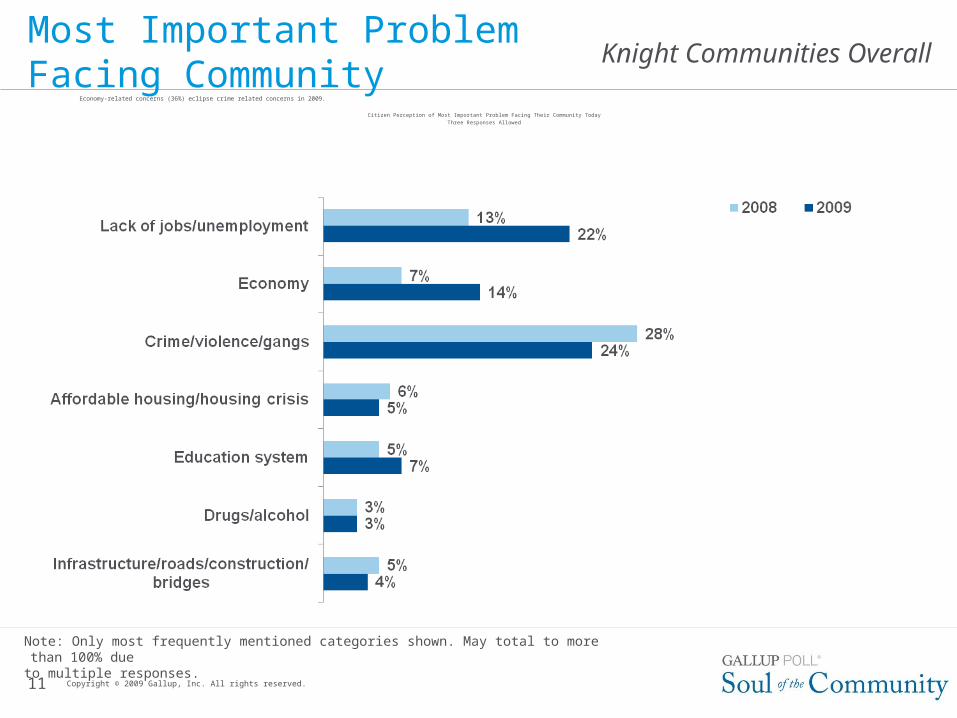
Knight Communities Overall Economy-related concerns (36%) eclipse crime related concerns in 2009.
Citizen Perception of Most Important Problem Facing Their Community Today
Three Responses Allowed
11
Most Important Problem Facing Community
Note: Only most frequently mentioned categories shown. May total to more than 100% due to multiple responses.
Copyright © 2009 Gallup, Inc. All rights reserved.
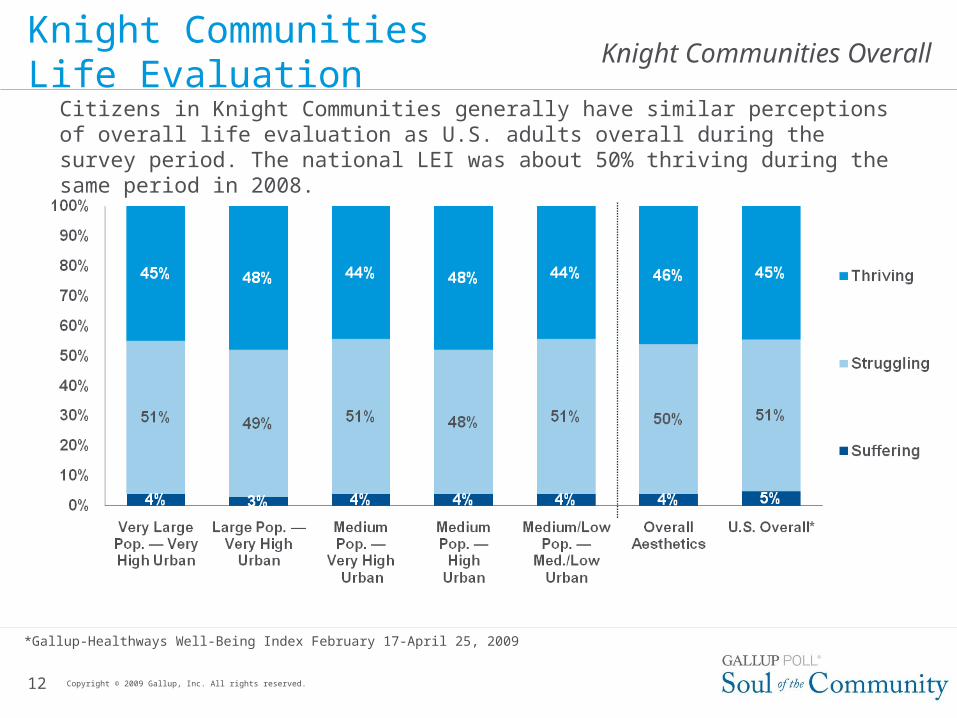
Knight Communities Overall Knight Communities Life Evaluation
12
Citizens in Knight Communities generally have similar perceptions of overall life evaluation as U.S. adults overall during the survey period. The national LEI was about 50% thriving during the same period in 2008.
Copyright © 2009 Gallup, Inc. All rights reserved.
*Gallup-Healthways Well-Being Index February 17-April 25, 2009
Knight Communities Overall
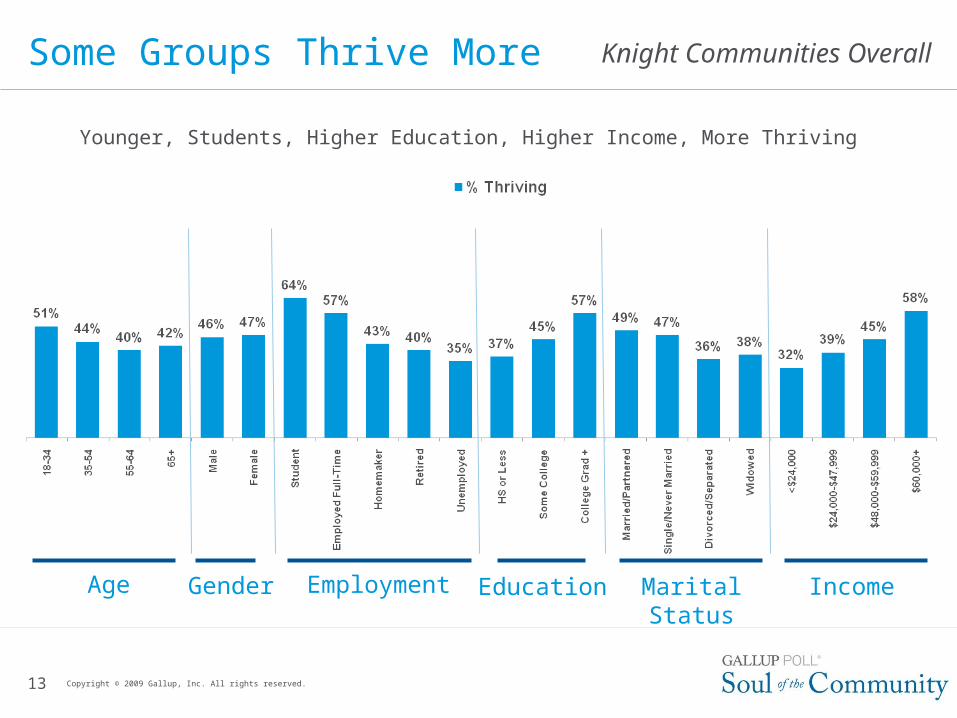
Younger, Students, Higher Education, Higher Income, More Thriving
13
Some Groups Thrive More
Age EmploymentGender
Copyright © 2009 Gallup, Inc. All rights reserved.
Education MaritalStatus
Income
Knight Communities Overall
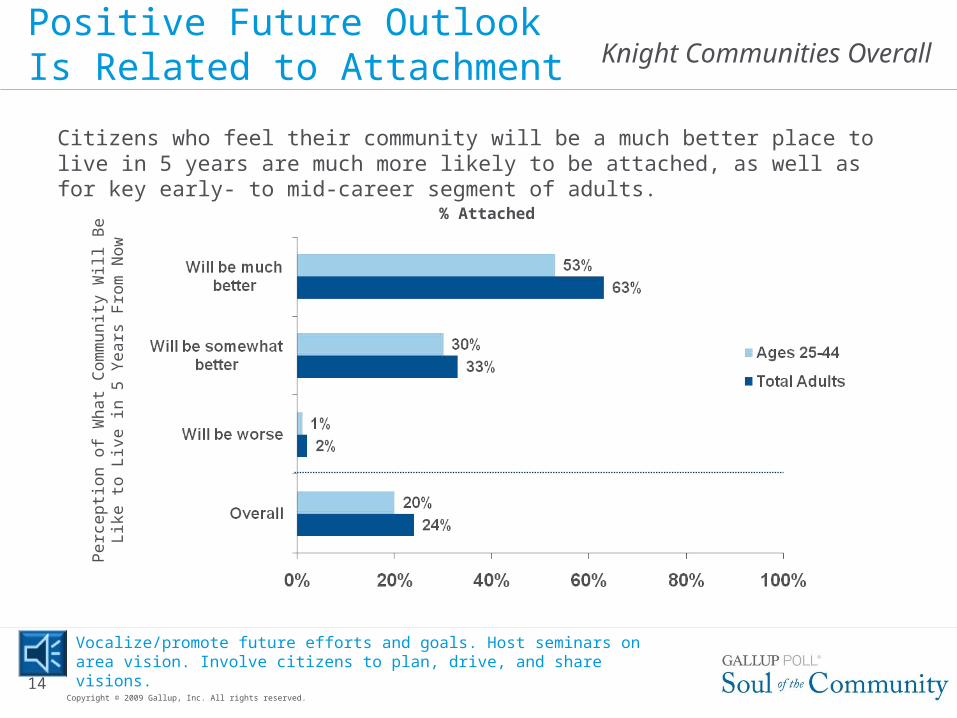
Vocalize/promote future efforts and goals. Host seminars on area vision. Involve citizens to plan, drive, and share visions.
Positive Future Outlook Is Related to Attachment
Citizens who feel their community will be a much better place to live in 5 years are much more likely to be attached, as well as for key early- to mid-career segment of adults.
% Attached
Pe
rce
ptio
n o
f W
ha
t C
om
mu
nity
Will
Be
Lik
e t
o L
ive
in
5 Y
ea
rs F
rom
No
w
Copyright © 2009 Gallup, Inc. All rights reserved.
14
Knight Communities Overall
15
SATISFACTION
OUTLOOK
RECOMMEND
PRIDE
PERFECT PLACE
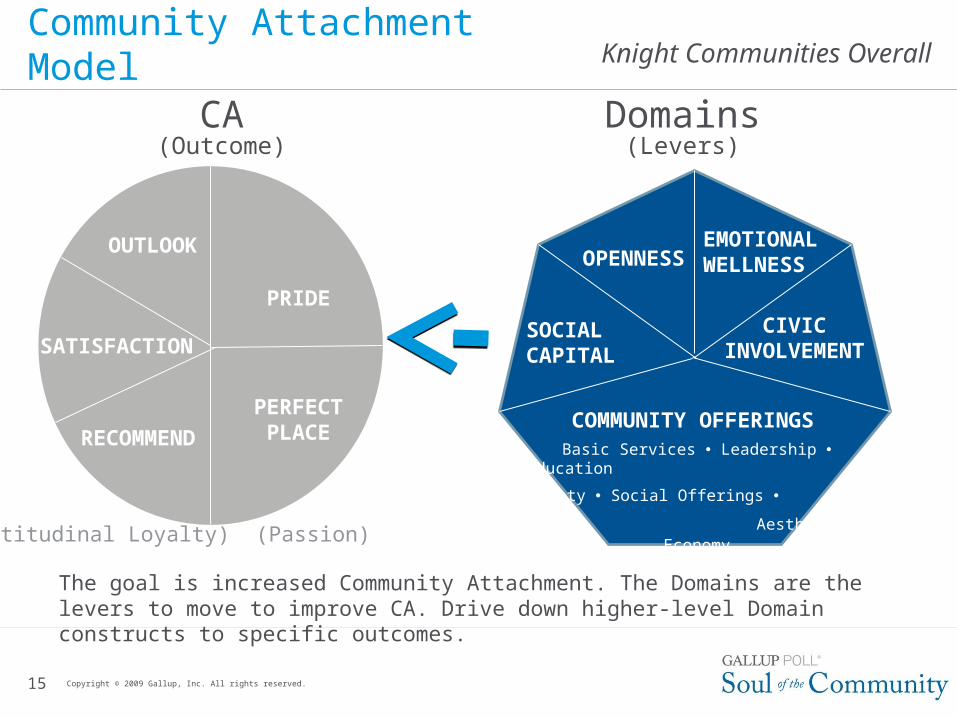
Community Attachment Model
The goal is increased Community Attachment. The Domains are the levers to move to improve CA. Drive down higher-level Domain constructs to specific outcomes.
CA Domains(Outcome) (Levers)
(Attitudinal Loyalty) (Passion)
Copyright © 2009 Gallup, Inc. All rights reserved.
COMMUNITY OFFERINGSBasic Services Leadership Education
Safety Social Offerings Aesthetics Economy
SOCIAL CAPITAL
CIVICINVOLVEMENT
EMOTIONALWELLNESSOPENNESS
Knight Communities Overall
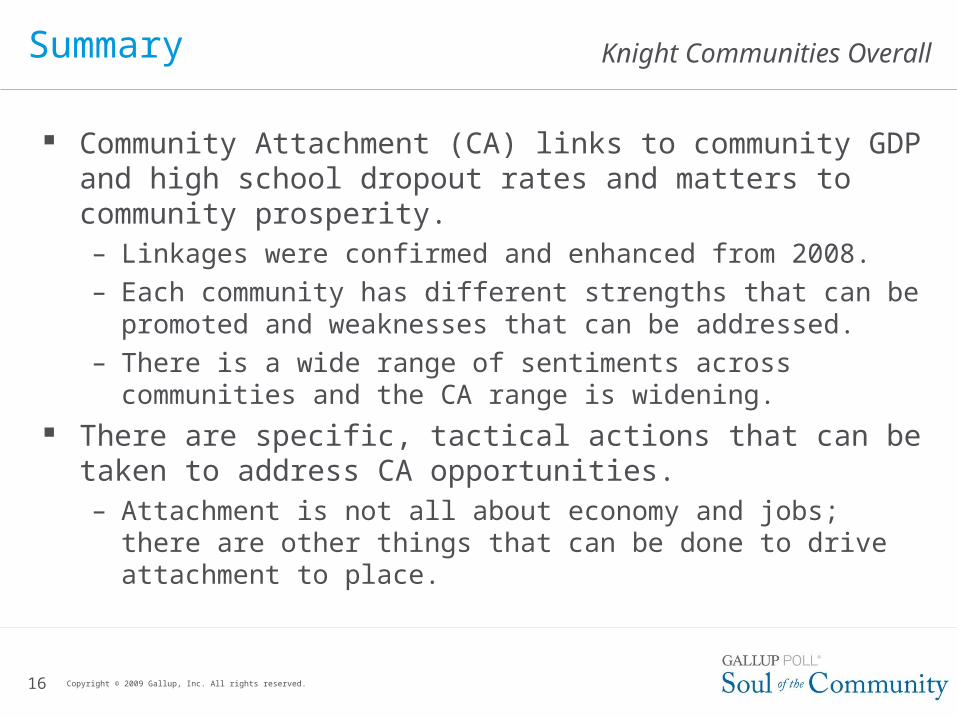
Community Attachment (CA) links to community GDP and high school dropout rates and matters to community prosperity.– Linkages were confirmed and enhanced from 2008.– Each community has different strengths that can be promoted and
weaknesses that can be addressed.– There is a wide range of sentiments across communities and the
CA range is widening. There are specific, tactical actions that can be taken to address
CA opportunities.– Attachment is not all about economy and jobs; there are other
things that can be done to drive attachment to place.
Summary
16 Copyright © 2009 Gallup, Inc. All rights reserved.
Knight Communities Overall
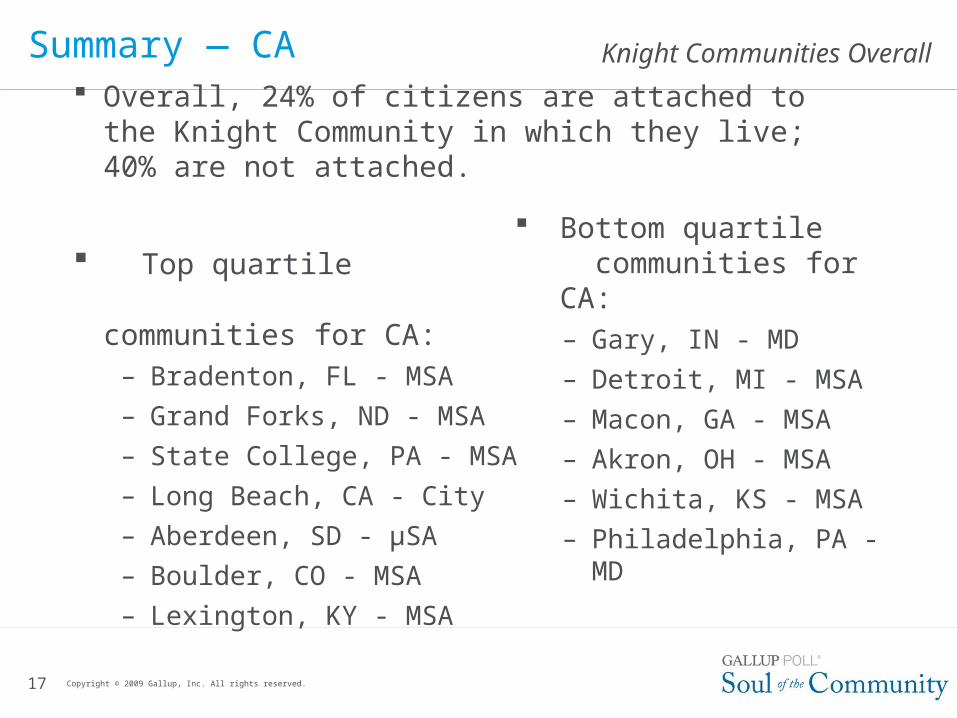
Overall, 24% of citizens are attached to the Knight Community in which they live; 40% are not attached.
Top quartile communities for CA:
– Bradenton, FL - MSA
– Grand Forks, ND - MSA
– State College, PA - MSA
– Long Beach, CA - City
– Aberdeen, SD - µSA
– Boulder, CO - MSA
– Lexington, KY - MSA
Summary — CA
17
Bottom quartile communities for CA:– Gary, IN - MD
– Detroit, MI - MSA
– Macon, GA - MSA
– Akron, OH - MSA
– Wichita, KS - MSA
– Philadelphia, PA - MD
Copyright © 2009 Gallup, Inc. All rights reserved.
Knight Communities Overall Example Key Focus Areas and Potential Actions
18
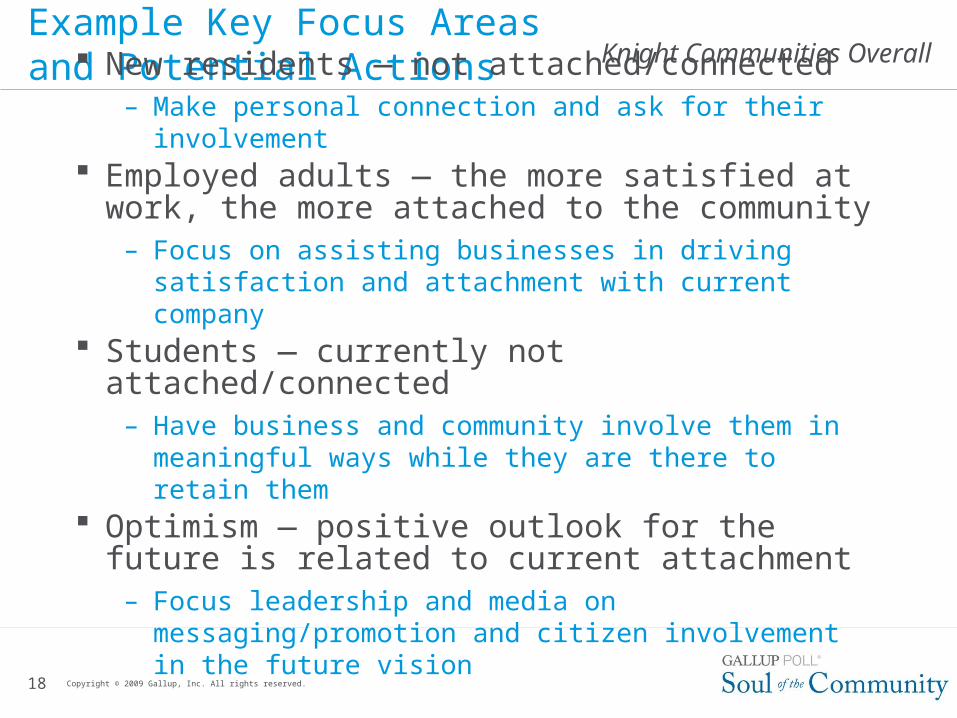
New residents — not attached/connected– Make personal connection and ask for their involvement
Employed adults — the more satisfied at work, the more attached to the community
– Focus on assisting businesses in driving satisfaction and attachment with current company
Students — currently not attached/connected– Have business and community involve them in meaningful
ways while they are there to retain them Optimism — positive outlook for the future is related to
current attachment– Focus leadership and media on messaging/promotion and
citizen involvement in the future vision
Copyright © 2009 Gallup, Inc. All rights reserved.
Knight Communities Overall
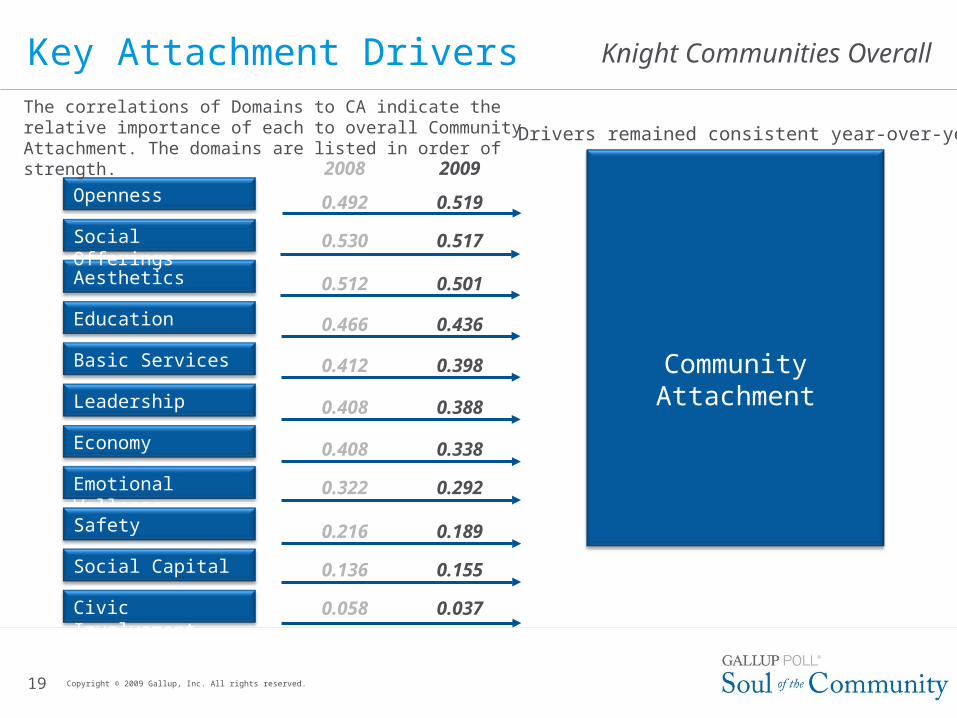
2008 2009
0.492 0.519
0.530 0.517
0.512 0.501
0.466 0.436
0.412 0.398
0.408 0.388
0.408 0.338
0.322 0.292
0.216 0.189
0.136 0.155
0.058 0.037
19
Key Attachment Drivers
Economy
Openness
Emotional Wellness
Aesthetics
Civic Involvement
Community Attachment
Social Capital
Education
Safety
Leadership
Basic Services
Copyright © 2009 Gallup, Inc. All rights reserved.
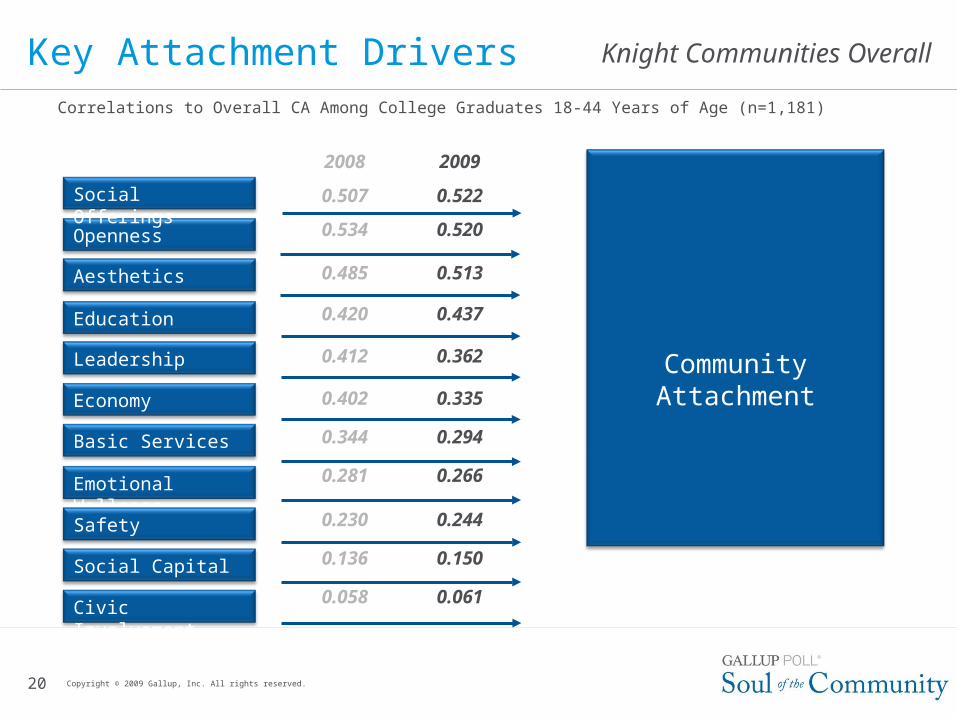
Drivers remained consistent year-over-year.
Social Offerings
The correlations of Domains to CA indicate the relative importance of each to overall Community Attachment. The domains are listed in order of strength.
Knight Communities Overall
2008 2009
0.507 0.522
0.534 0.520
0.485 0.513
0.420 0.437
0.412 0.362
0.402 0.335
0.344 0.294
0.281 0.266
0.230 0.244
0.136 0.150
0.058 0.061
Correlations to Overall CA Among College Graduates 18-44 Years of Age (n=1,181)
20 Copyright © 2009 Gallup, Inc. All rights reserved.
Key Attachment Drivers
Community AttachmentEconomy
Openness
Emotional Wellness
Aesthetics
Civic Involvement
Social Capital
Education
Safety
Leadership
Basic Services
Social Offerings
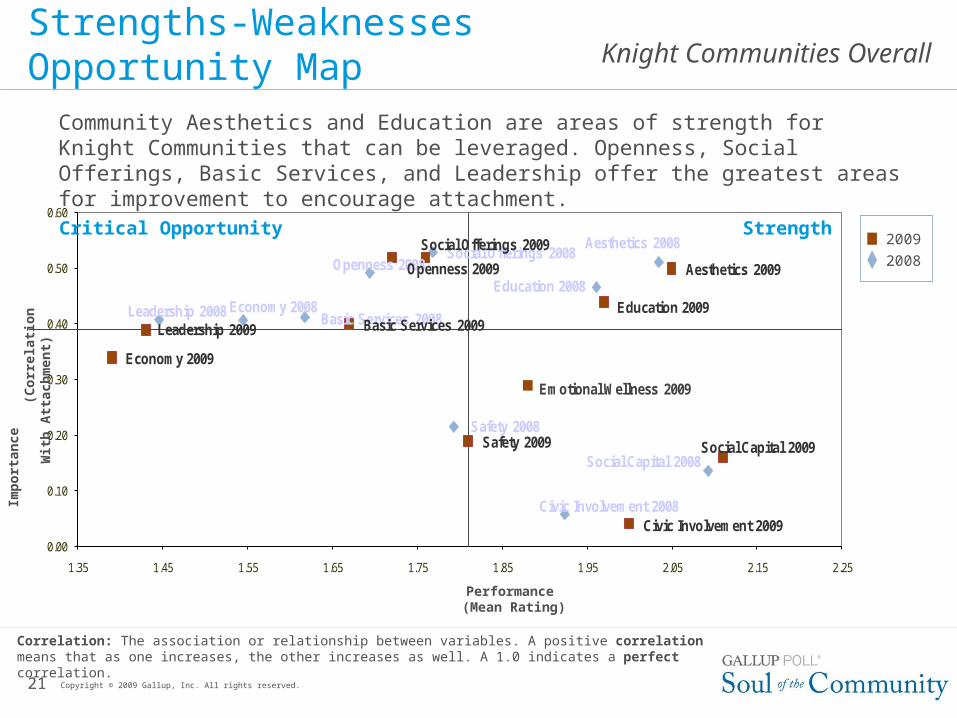
Knight Communities Overall Strengths-Weaknesses Opportunity Map
21
Community Aesthetics and Education are areas of strength for Knight Communities that can be leveraged. Openness, Social Offerings, Basic Services, and Leadership offer the greatest areas for improvement to encourage attachment.
Copyright © 2009 Gallup, Inc. All rights reserved.
Correlation: The association or relationship between variables. A positive correlation means that as one increases, the other increases as well. A 1.0 indicates a perfect correlation.
Aesthetics 2008
Basic Services 2008Economy 2008
Education 2008
Civic Involvement 2008
Leadership 2008
Openness 2008
Safety 2008
Social Capital 2008
Social Offerings 2008Aesthetics 2009
Basic Services 2009
Economy 2009
Education 2009
Civic Involvement 2009
Leadership 2009
Openness 2009
Safety 2009 Social Capital 2009
Social Offerings 2009
Emotional Wellness 2009
0.00
0.10
0.20
0.30
0.40
0.50
0.60
1.35 1.45 1.55 1.65 1.75 1.85 1.95 2.05 2.15 2.25
StrengthCritical Opportunity
Performance (Mean Rating)
Imp
ort
ance
(Co
rrel
atio
n W
ith
Att
ach
men
t)
2009
2008
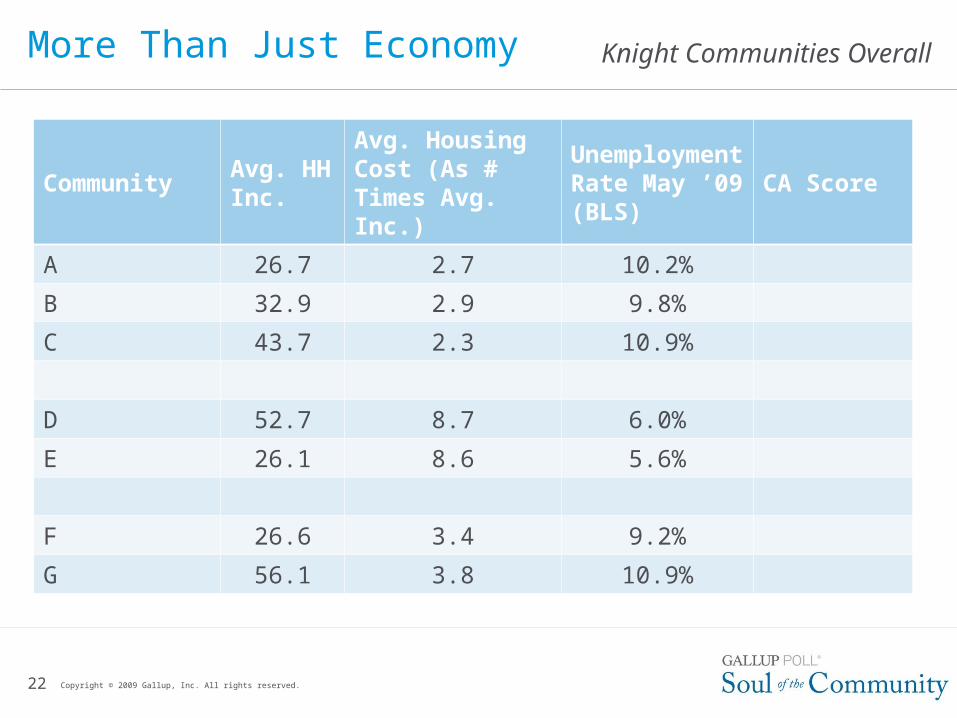
Knight Communities Overall More Than Just Economy
22
CommunityAvg. HH Inc.
Avg. Housing Cost (As # Times Avg. Inc.)
Unemployment Rate May ’09 (BLS)
CA Score
A 26.7 2.7 10.2%
B 32.9 2.9 9.8%
C 43.7 2.3 10.9%
D 52.7 8.7 6.0%
E 26.1 8.6 5.6%
F 26.6 3.4 9.2%
G 56.1 3.8 10.9%
Copyright © 2009 Gallup, Inc. All rights reserved.
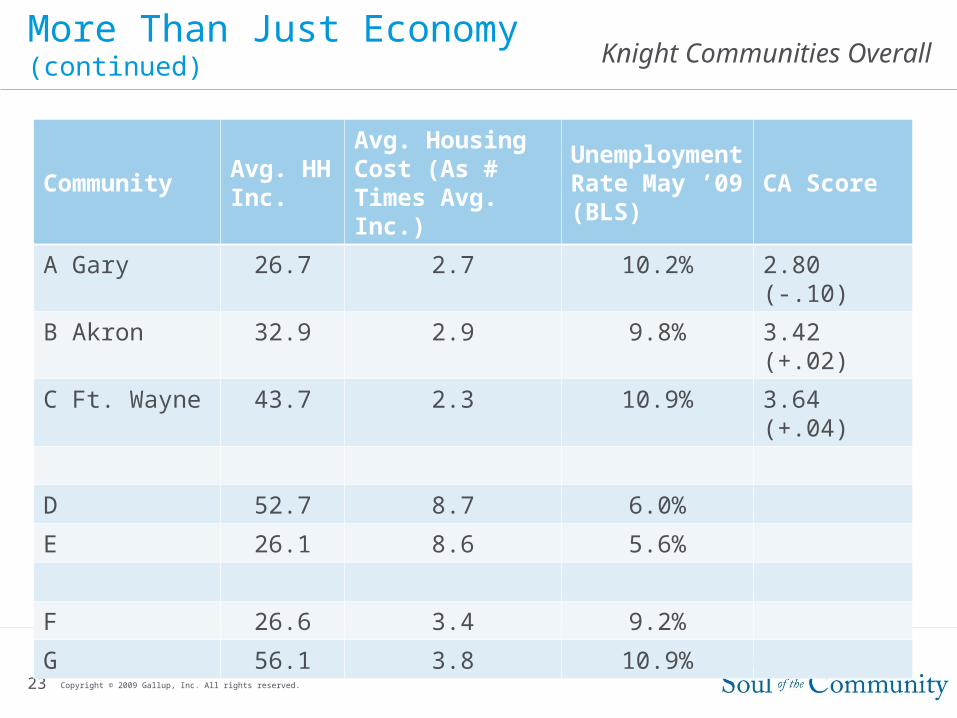
Knight Communities Overall More Than Just Economy (continued)
23
CommunityAvg. HH Inc.
Avg. Housing Cost (As # Times Avg. Inc.)
Unemployment Rate May ’09 (BLS)
CA Score
A Gary 26.7 2.7 10.2% 2.80 (-.10)
B Akron 32.9 2.9 9.8% 3.42 (+.02)
C Ft. Wayne 43.7 2.3 10.9% 3.64 (+.04)
D 52.7 8.7 6.0%
E 26.1 8.6 5.6%
F 26.6 3.4 9.2%
G 56.1 3.8 10.9%
Copyright © 2009 Gallup, Inc. All rights reserved.
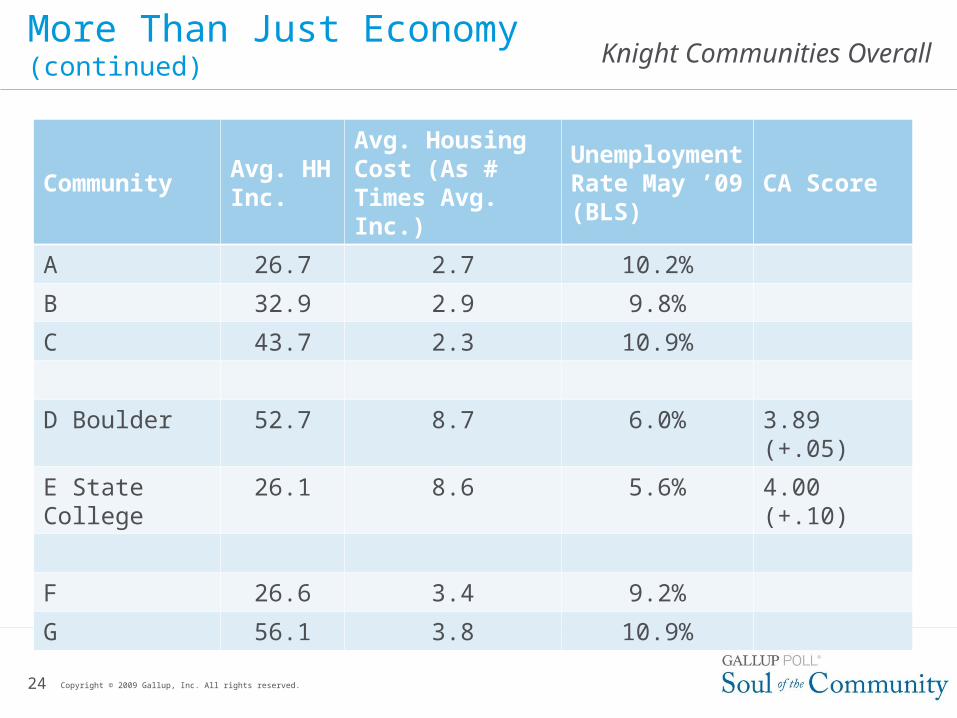
Knight Communities Overall More Than Just Economy (continued)
24
CommunityAvg. HH Inc.
Avg. Housing Cost (As # Times Avg. Inc.)
Unemployment Rate May ’09 (BLS)
CA Score
A 26.7 2.7 10.2%
B 32.9 2.9 9.8%
C 43.7 2.3 10.9%
D Boulder 52.7 8.7 6.0% 3.89 (+.05)
E State College 26.1 8.6 5.6% 4.00 (+.10)
F 26.6 3.4 9.2%
G 56.1 3.8 10.9%
Copyright © 2009 Gallup, Inc. All rights reserved.
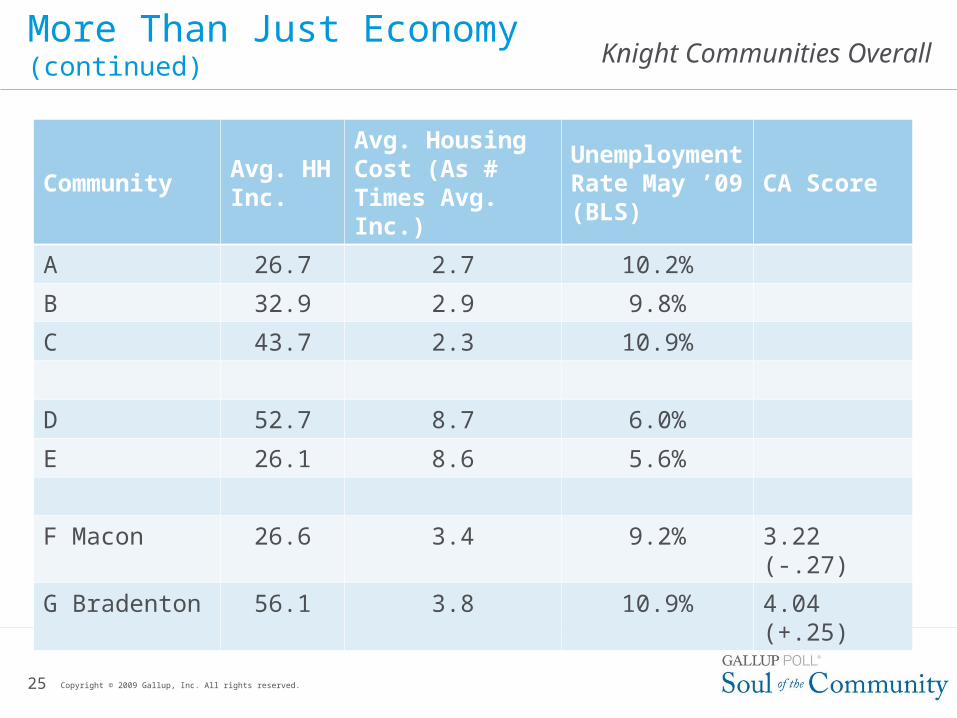
Knight Communities Overall More Than Just Economy (continued)
25
CommunityAvg. HH Inc.
Avg. Housing Cost (As # Times Avg. Inc.)
Unemployment Rate May ’09 (BLS)
CA Score
A 26.7 2.7 10.2%
B 32.9 2.9 9.8%
C 43.7 2.3 10.9%
D 52.7 8.7 6.0%
E 26.1 8.6 5.6%
F Macon 26.6 3.4 9.2% 3.22 (-.27)
G Bradenton 56.1 3.8 10.9% 4.04 (+.25)
Copyright © 2009 Gallup, Inc. All rights reserved.
Knight Communities Overall
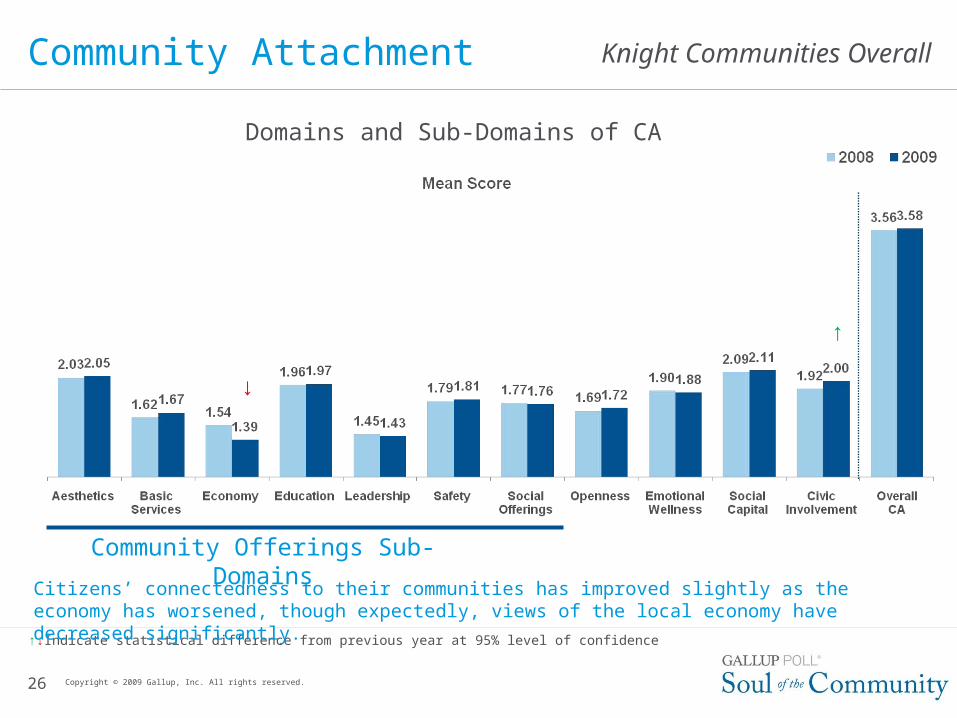
26
Community Attachment
Community Offerings Sub-Domains
Copyright © 2009 Gallup, Inc. All rights reserved.
↑↓Indicate statistical difference from previous year at 95% level of confidence
↑
↓
Citizens’ connectedness to their communities has improved slightly as the economy has worsened, though expectedly, views of the local economy have decreased significantly.
Domains and Sub-Domains of CA
Knight Communities Overall
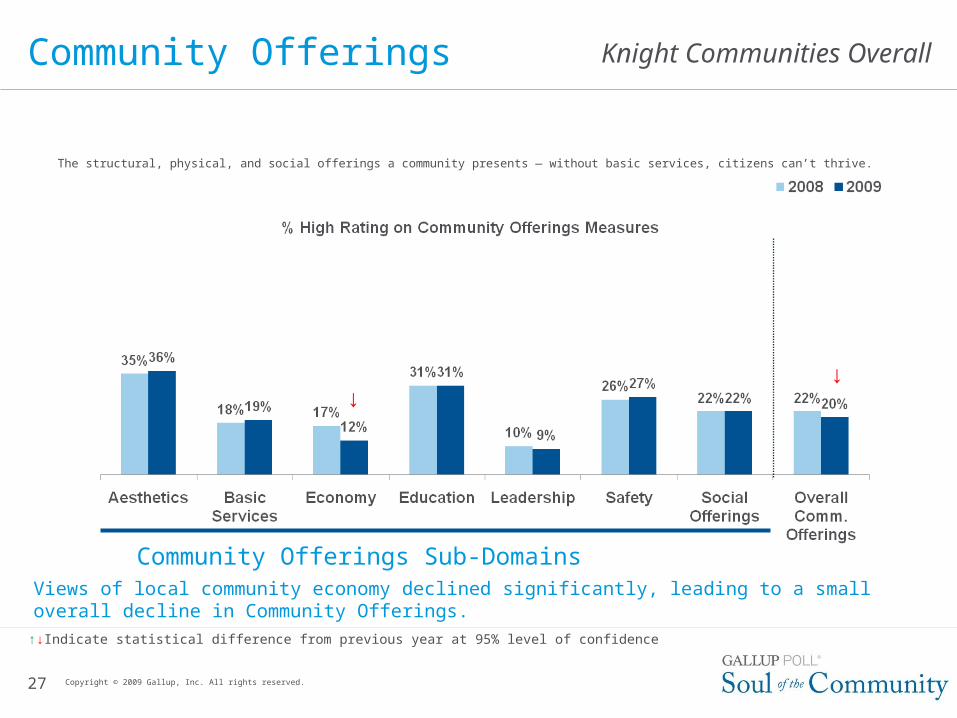
The structural, physical, and social offerings a community presents — without basic services, citizens can’t thrive.
27
Community Offerings
Community Offerings Sub-Domains
Copyright © 2009 Gallup, Inc. All rights reserved.
↑↓Indicate statistical difference from previous year at 95% level of confidence
↓↓
Views of local community economy declined significantly, leading to a small overall decline in Community Offerings.
Knight Communities Overall
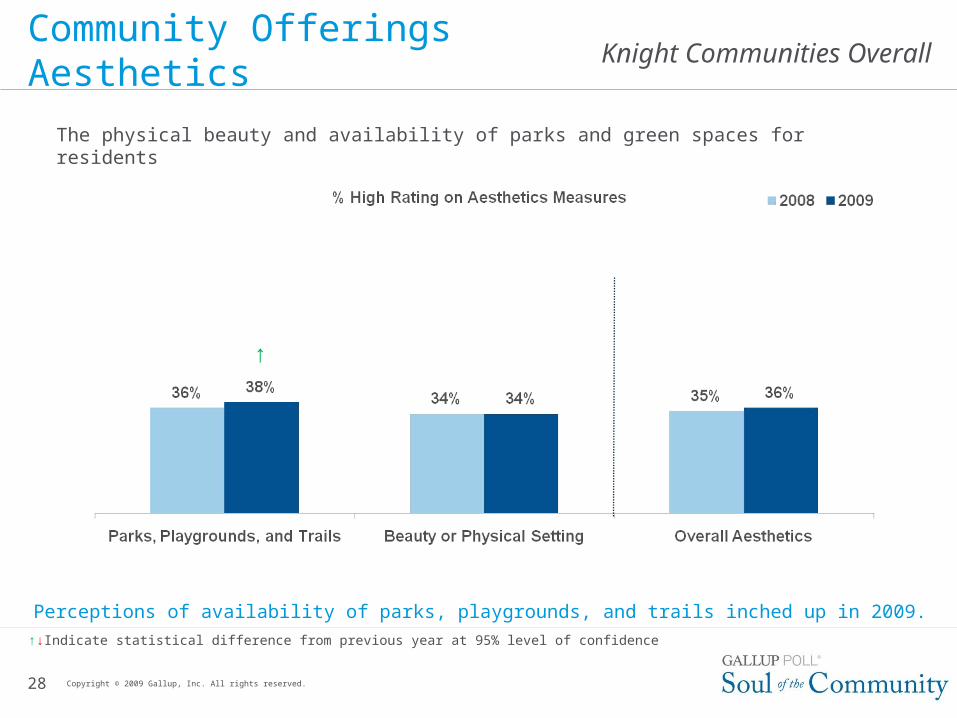
The physical beauty and availability of parks and green spaces for residents
28
Community Offerings Aesthetics
Copyright © 2009 Gallup, Inc. All rights reserved.
↑↓Indicate statistical difference from previous year at 95% level of confidence
↑
Perceptions of availability of parks, playgrounds, and trails inched up in 2009.
Knight Communities Overall
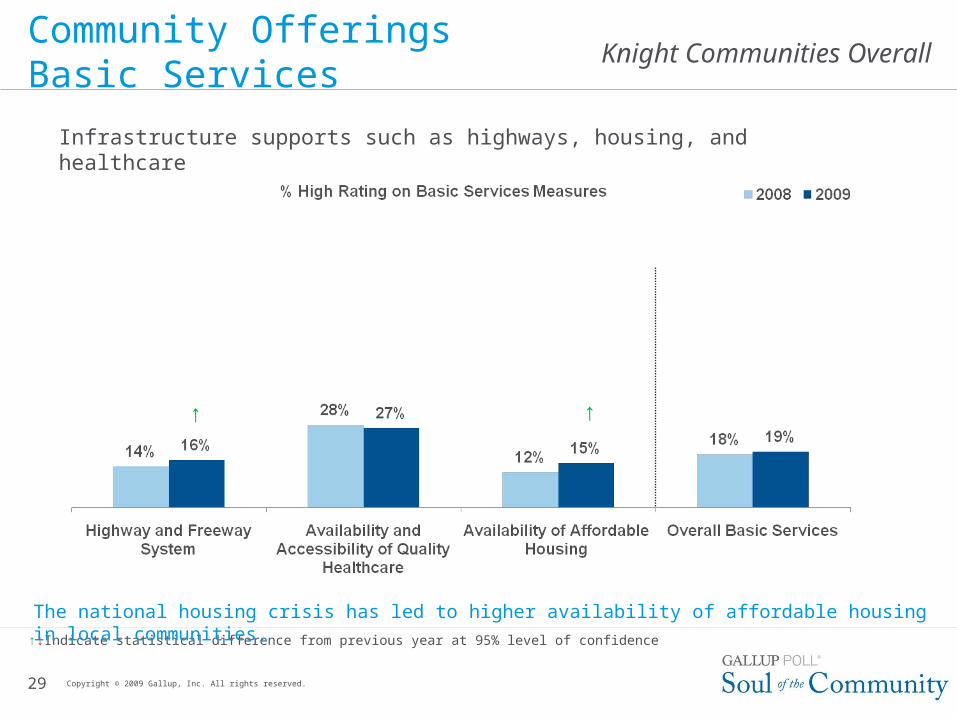
Infrastructure supports such as highways, housing, and healthcare
29
Community Offerings Basic Services
Copyright © 2009 Gallup, Inc. All rights reserved.
↑↓Indicate statistical difference from previous year at 95% level of confidence
↑ ↑
The national housing crisis has led to higher availability of affordable housing in local communities.
Knight Communities Overall
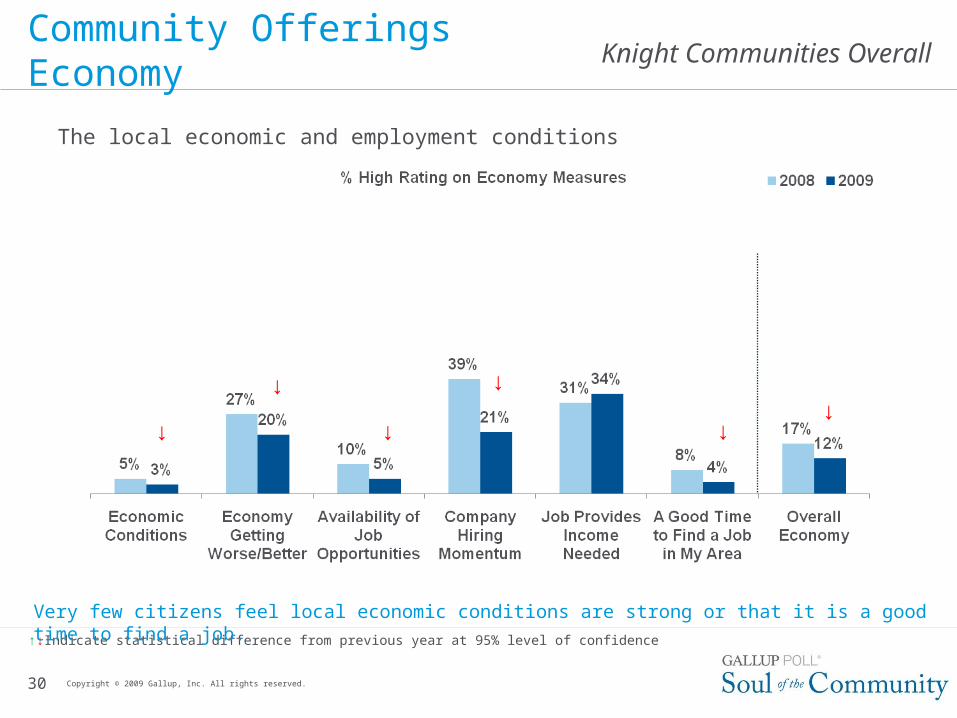
The local economic and employment conditions
30
Community Offerings Economy
Copyright © 2009 Gallup, Inc. All rights reserved.
↑↓Indicate statistical difference from previous year at 95% level of confidence
↓
↓
↓
↓
↓↓
Very few citizens feel local economic conditions are strong or that it is a good time to find a job.
Knight Communities Overall
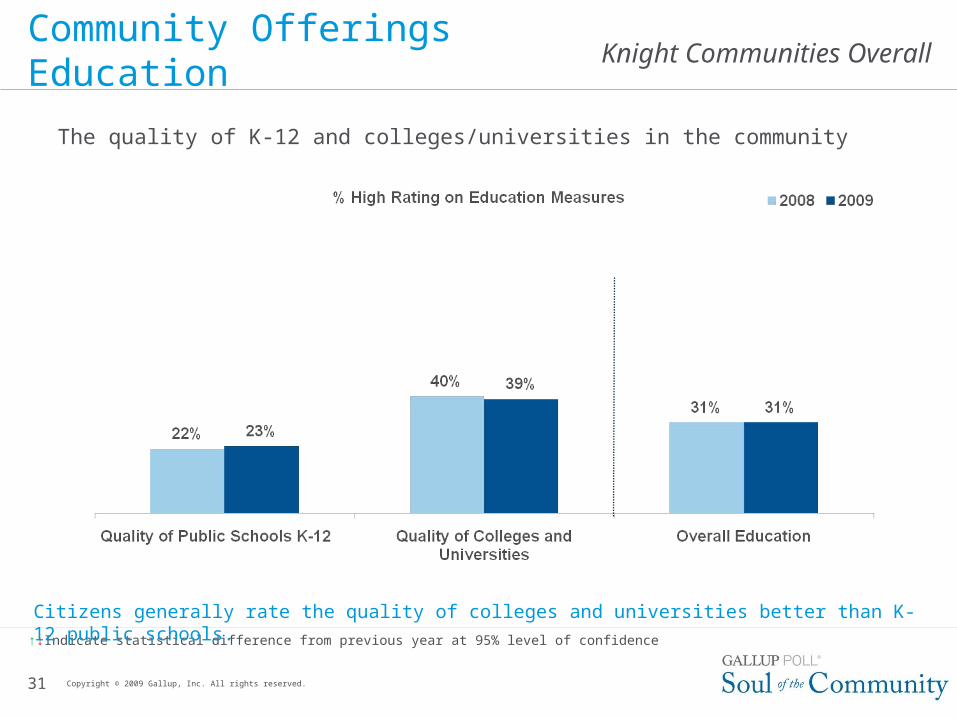
The quality of K-12 and colleges/universities in the community
31
Community OfferingsEducation
Copyright © 2009 Gallup, Inc. All rights reserved.
↑↓Indicate statistical difference from previous year at 95% level of confidence
Citizens generally rate the quality of colleges and universities better than K-12 public schools.
Knight Communities Overall
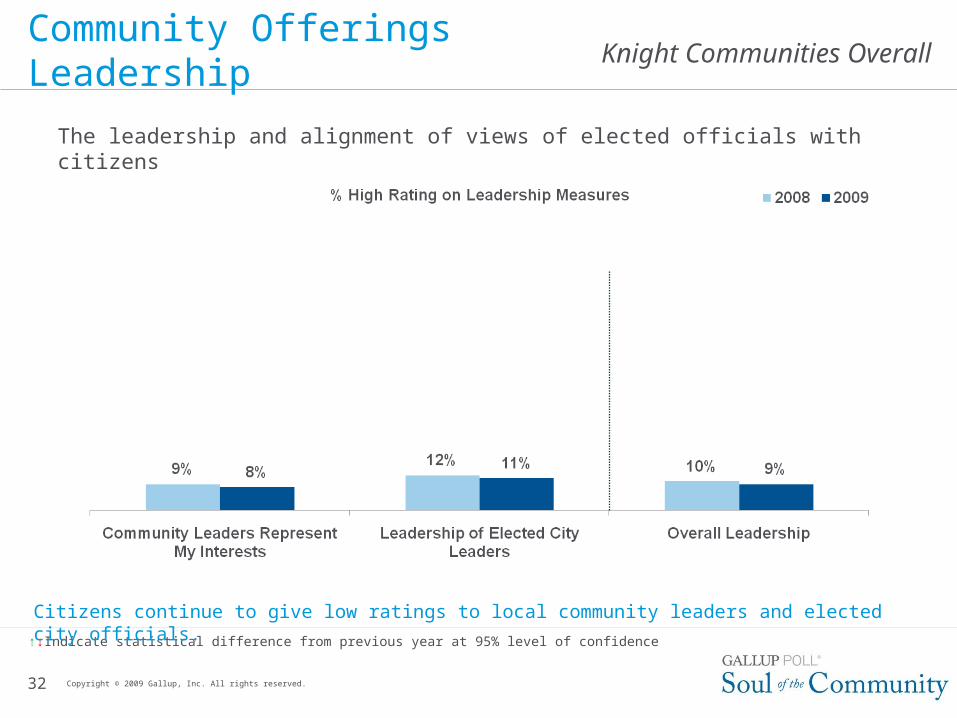
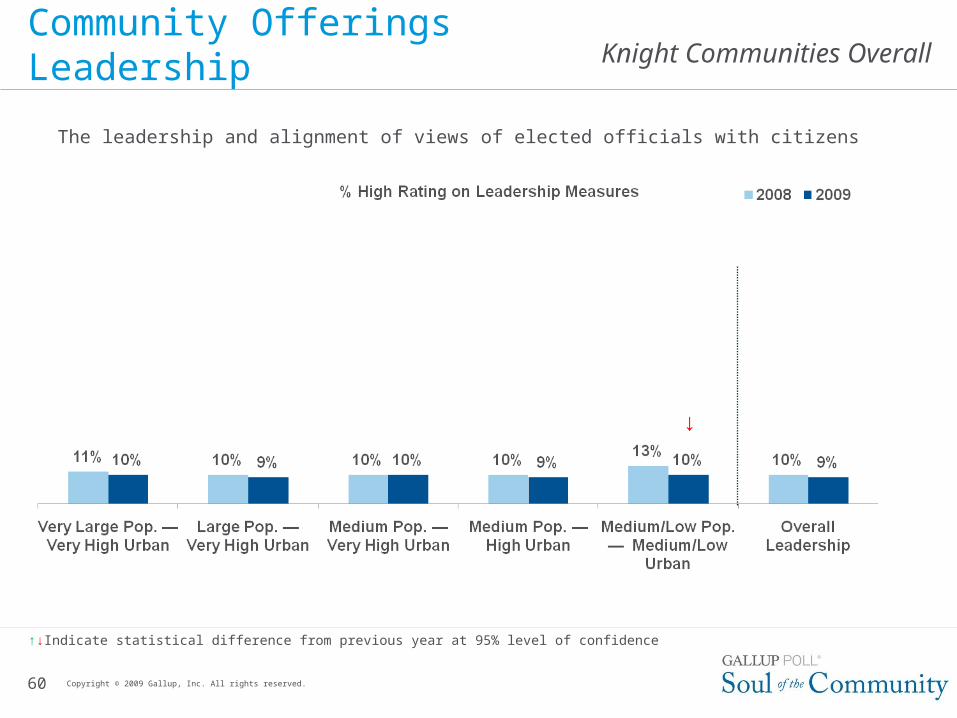
The leadership and alignment of views of elected officials with citizens
32
Community Offerings Leadership
Copyright © 2009 Gallup, Inc. All rights reserved.
↑↓Indicate statistical difference from previous year at 95% level of confidence
Citizens continue to give low ratings to local community leaders and elected city officials.
Knight Communities Overall
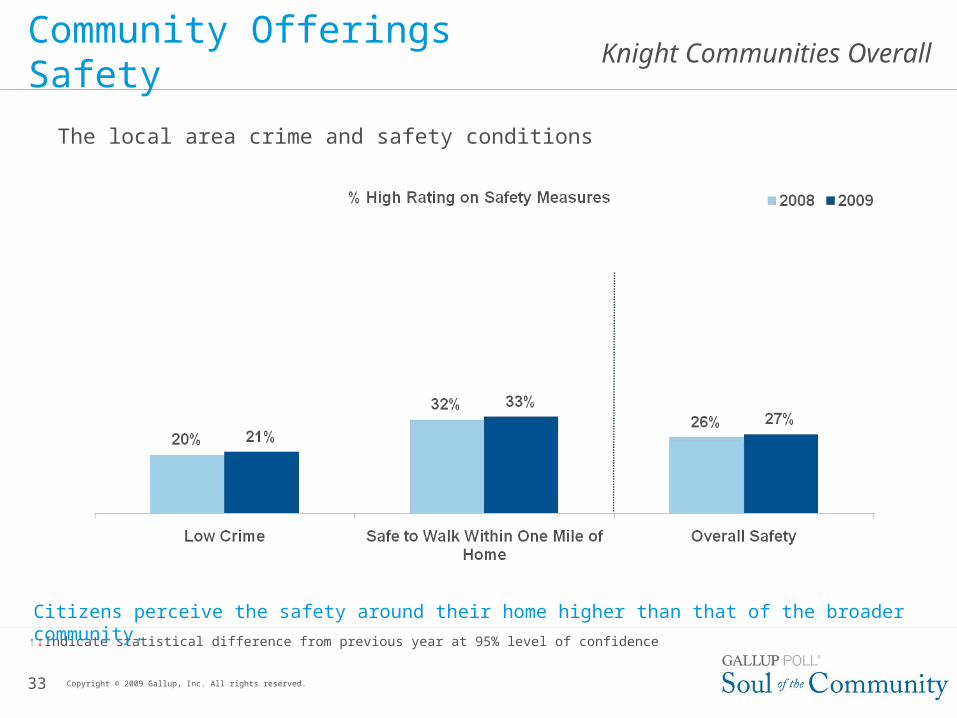
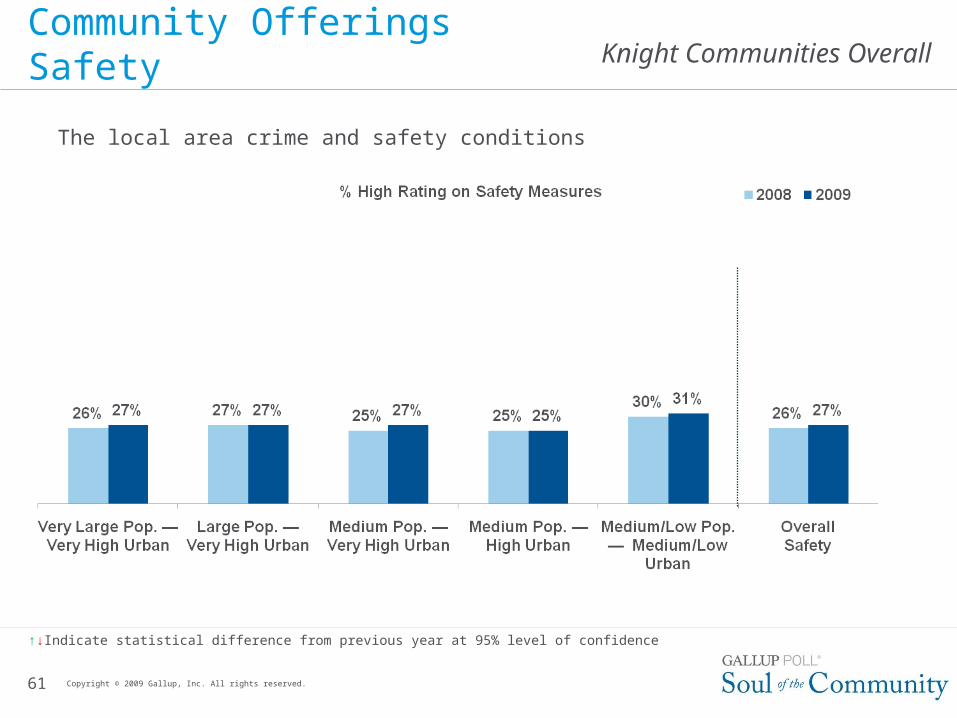
The local area crime and safety conditions
33
Community OfferingsSafety
Copyright © 2009 Gallup, Inc. All rights reserved.
↑↓Indicate statistical difference from previous year at 95% level of confidence
Citizens perceive the safety around their home higher than that of the broader community.
Knight Communities Overall
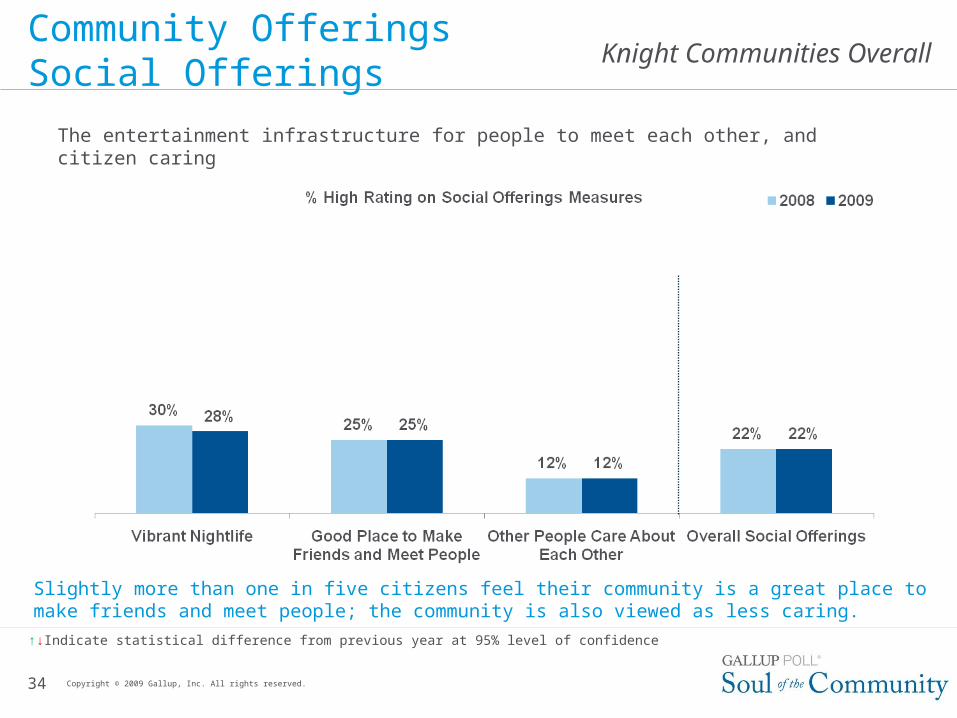
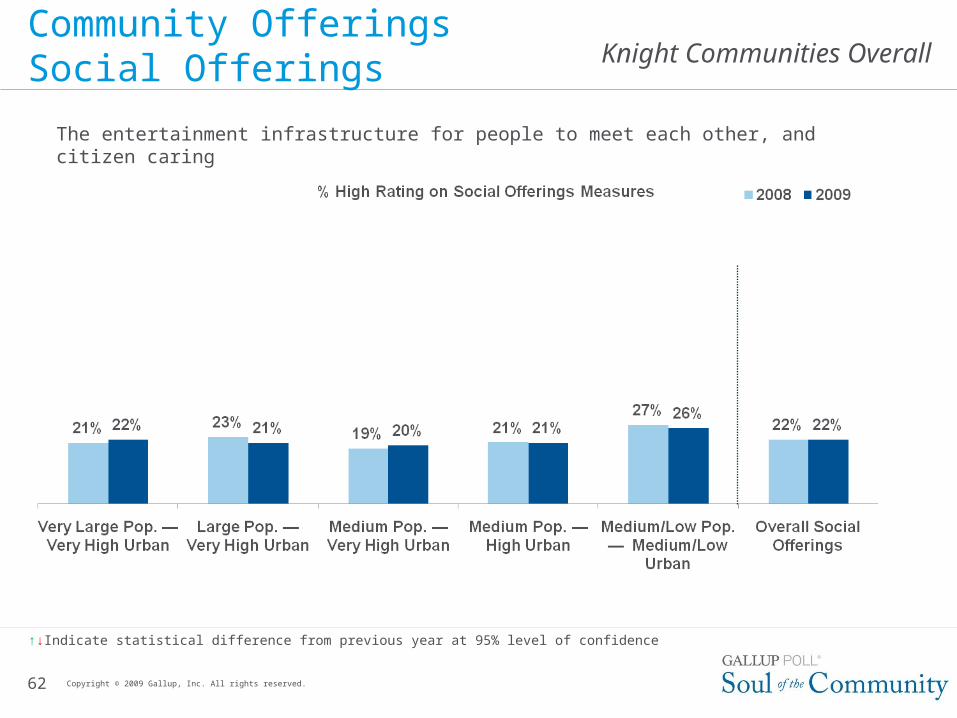
The entertainment infrastructure for people to meet each other, and citizen caring
34
Community Offerings Social Offerings
Copyright © 2009 Gallup, Inc. All rights reserved.
↑↓Indicate statistical difference from previous year at 95% level of confidence
Slightly more than one in five citizens feel their community is a great place to make friends and meet people; the community is also viewed as less caring.
Knight Communities Overall
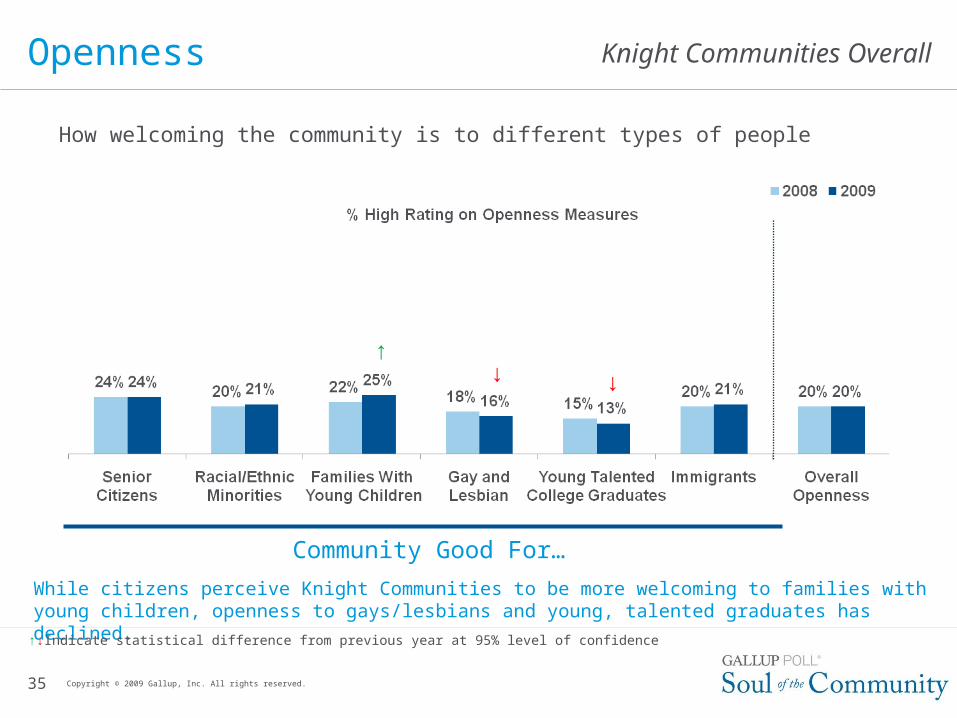
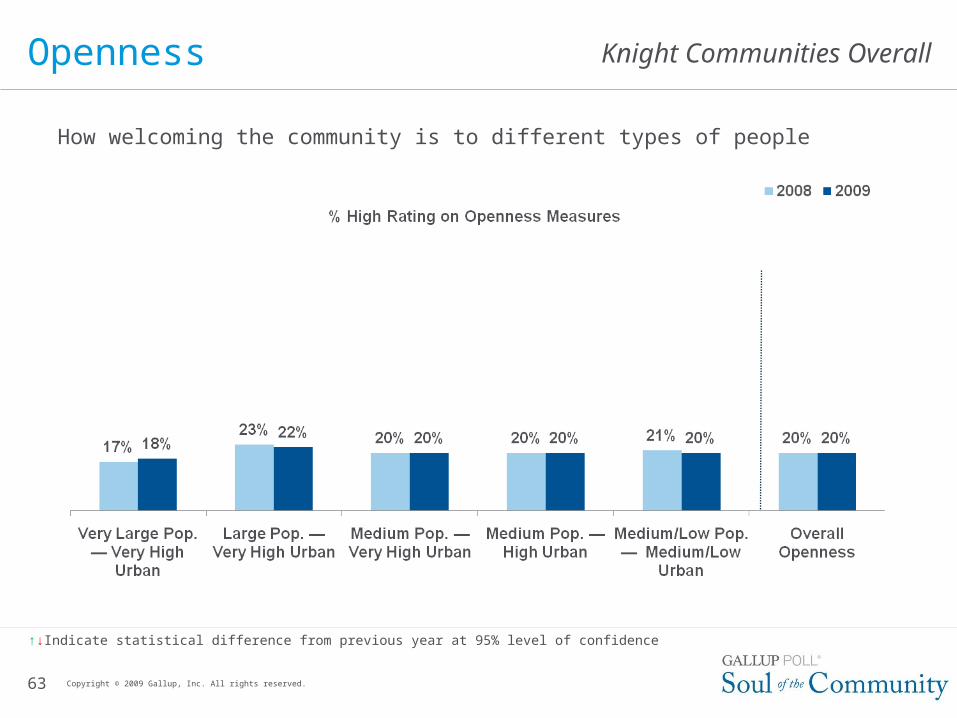
While citizens perceive Knight Communities to be more welcoming to families with young children, openness to gays/lesbians and young, talented graduates has declined.
How welcoming the community is to different types of people
35
Openness
Community Good For…
Copyright © 2009 Gallup, Inc. All rights reserved.
↑↓Indicate statistical difference from previous year at 95% level of confidence
↓ ↓↑
Knight Communities Overall Emotional Wellness
36 Copyright © 2009 Gallup, Inc. All rights reserved.
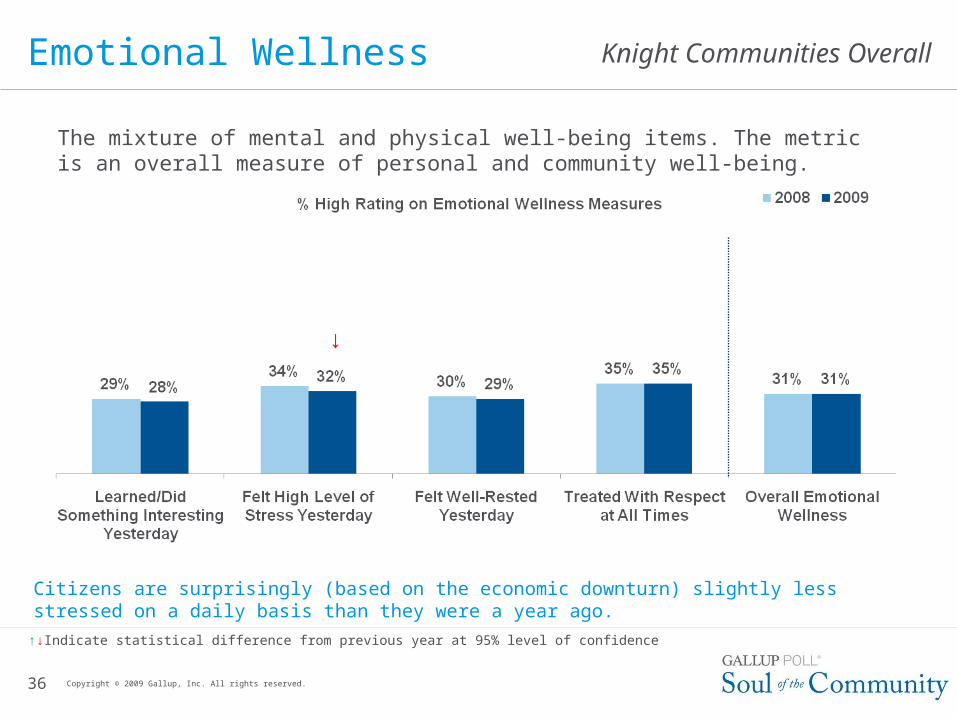
The mixture of mental and physical well-being items. The metric is an overall measure of personal and community well-being.
↑↓Indicate statistical difference from previous year at 95% level of confidence
↓
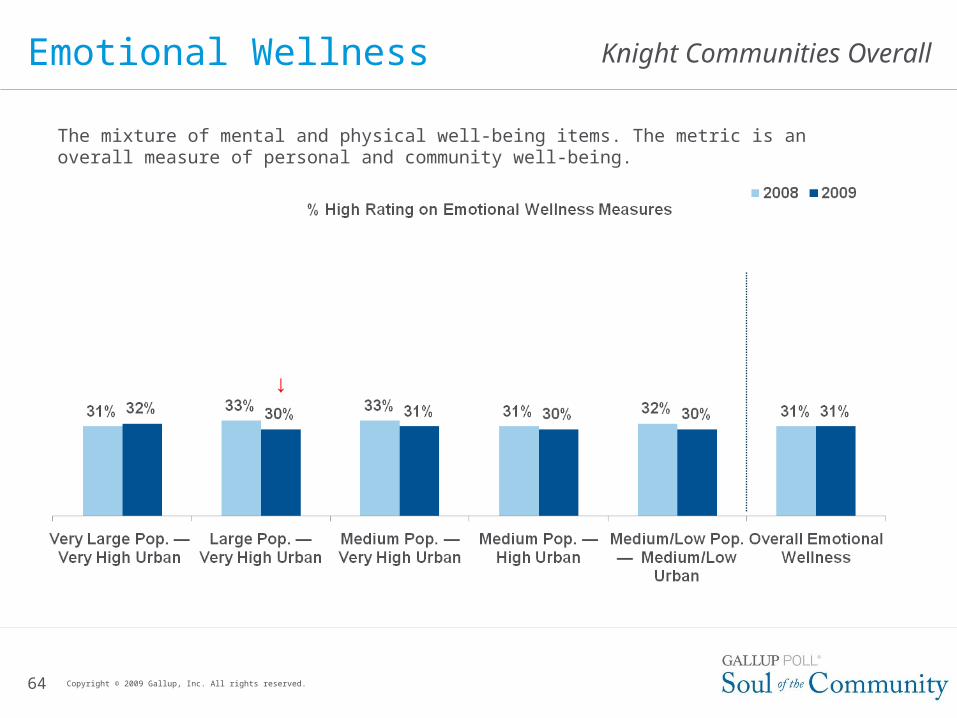
Citizens are surprisingly (based on the economic downturn) slightly less stressed on a daily basis than they were a year ago.
Knight Communities Overall
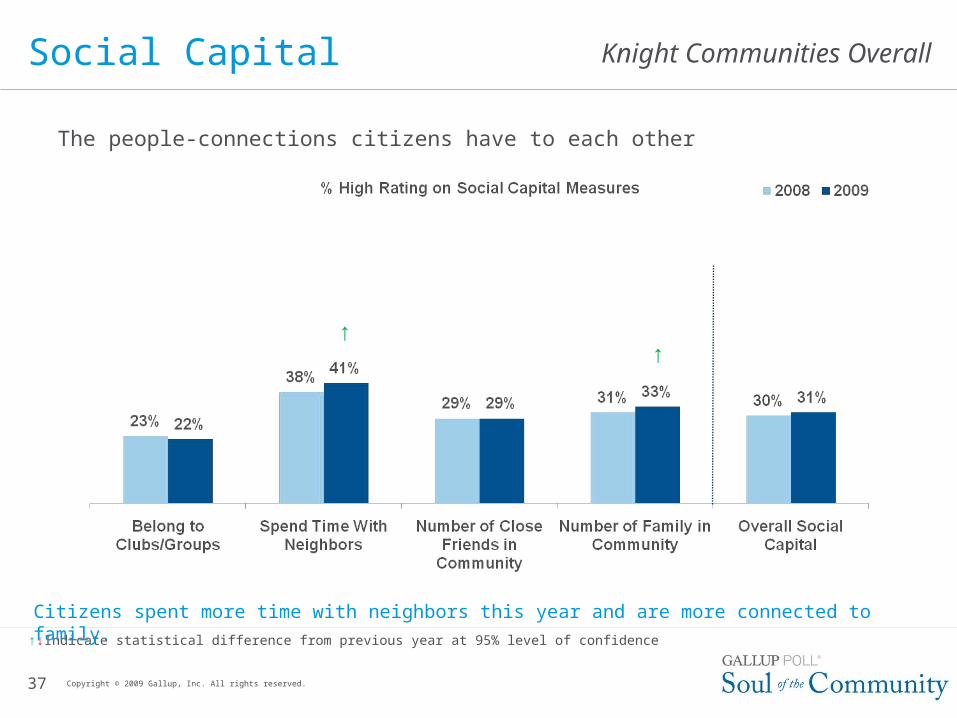
The people-connections citizens have to each other
37
Social Capital
Copyright © 2009 Gallup, Inc. All rights reserved.
↑↓Indicate statistical difference from previous year at 95% level of confidence
↑↑
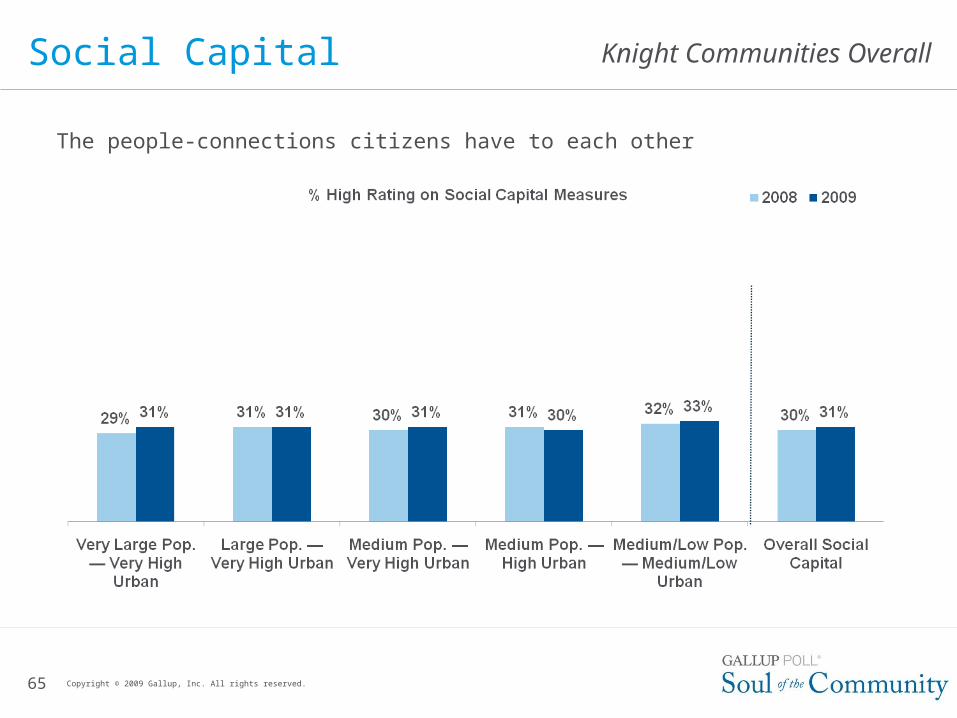
Citizens spent more time with neighbors this year and are more connected to family.
Knight Communities Overall
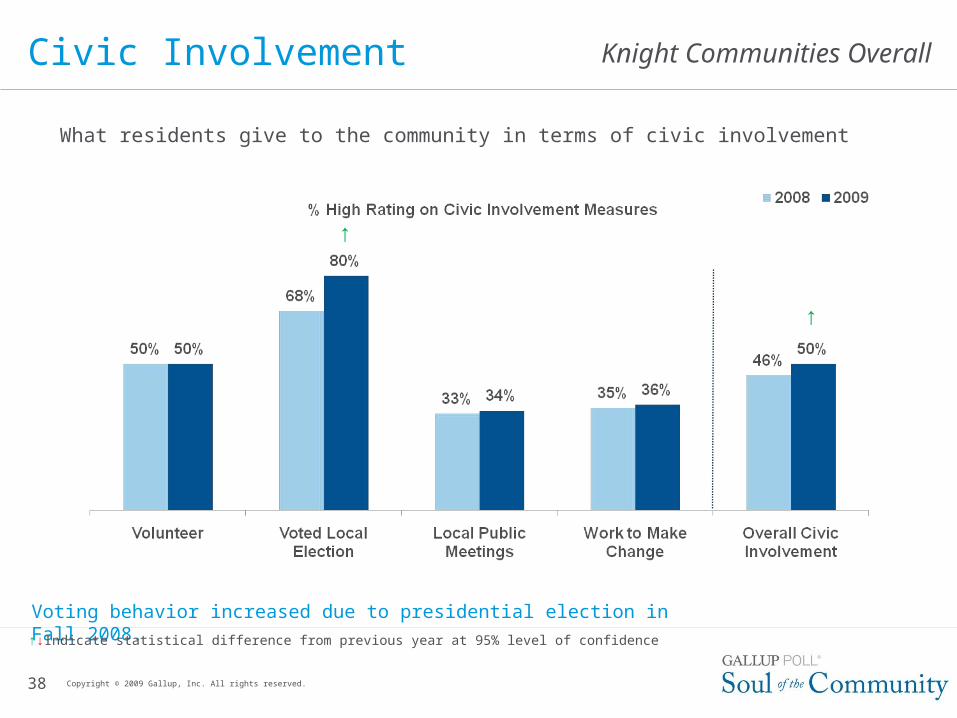
What residents give to the community in terms of civic involvement
38
Civic Involvement
Copyright © 2009 Gallup, Inc. All rights reserved.
Voting behavior increased due to presidential election in Fall 2008.
↑↓Indicate statistical difference from previous year at 95% level of confidence
↑
↑
39
Q: So What Can Community Leaders Do to Drive Community Attachment?
A: Focus on Key Sub-Groups
Several Examples of Sub-Groups Where Actions Could Be Focused
Copyright © 2009 Gallup, Inc. All rights reserved.
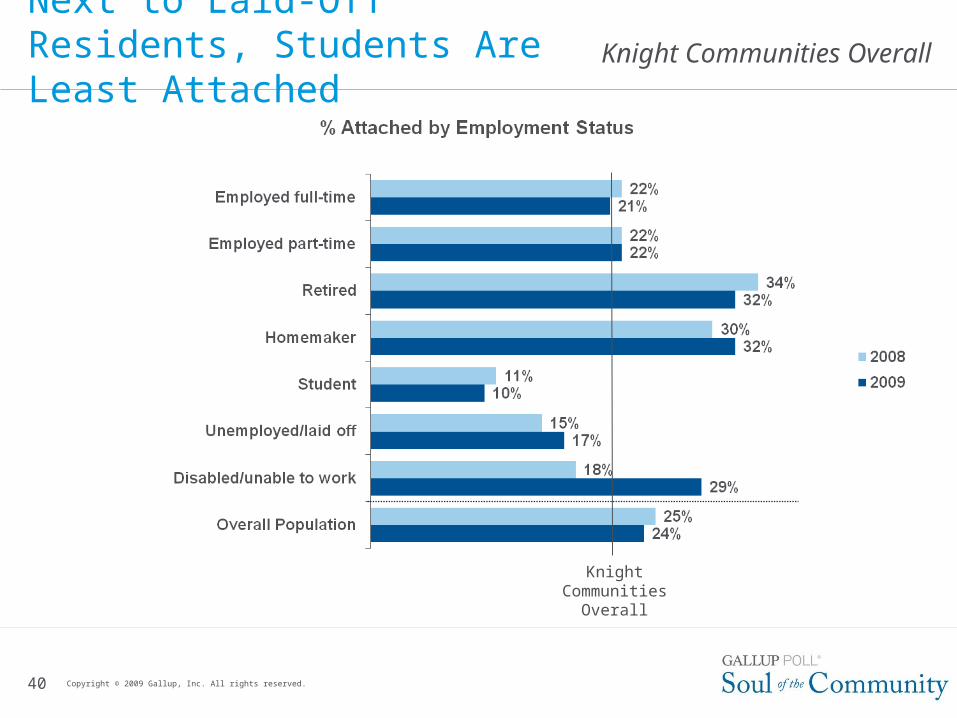
Knight Communities Overall Next to Laid-Off Residents, Students Are Least Attached
40 Copyright © 2009 Gallup, Inc. All rights reserved.
KnightCommunities
Overall
Knight Communities Overall
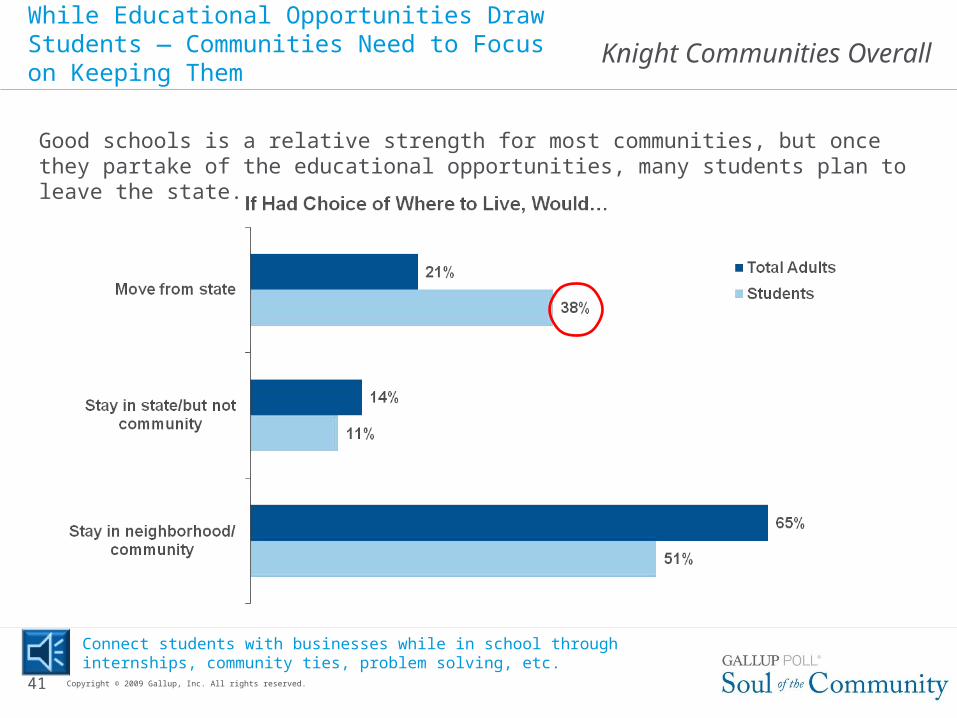
Connect students with businesses while in school through internships, community ties, problem solving, etc.
41
Good schools is a relative strength for most communities, but once they partake of the educational opportunities, many students plan to leave the state.
Copyright © 2009 Gallup, Inc. All rights reserved.
While Educational Opportunities Draw Students — Communities Need to Focus on Keeping Them
Knight Communities Overall
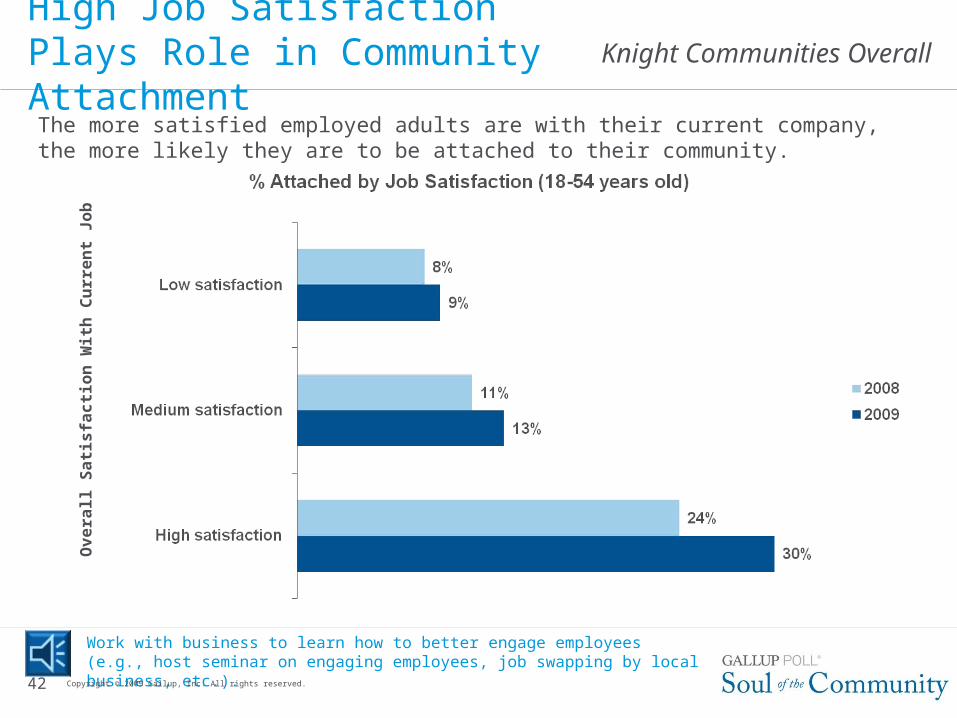
High Job Satisfaction Plays Role in Community Attachment
Work with business to learn how to better engage employees (e.g., host seminar on engaging employees, job swapping by local business, etc.).
Ov
era
ll S
ati
sfa
cti
on
Wit
h C
urr
en
t J
ob
42
The more satisfied employed adults are with their current company, the more likely they are to be attached to their community.
Copyright © 2009 Gallup, Inc. All rights reserved.
Knight Communities Overall
43
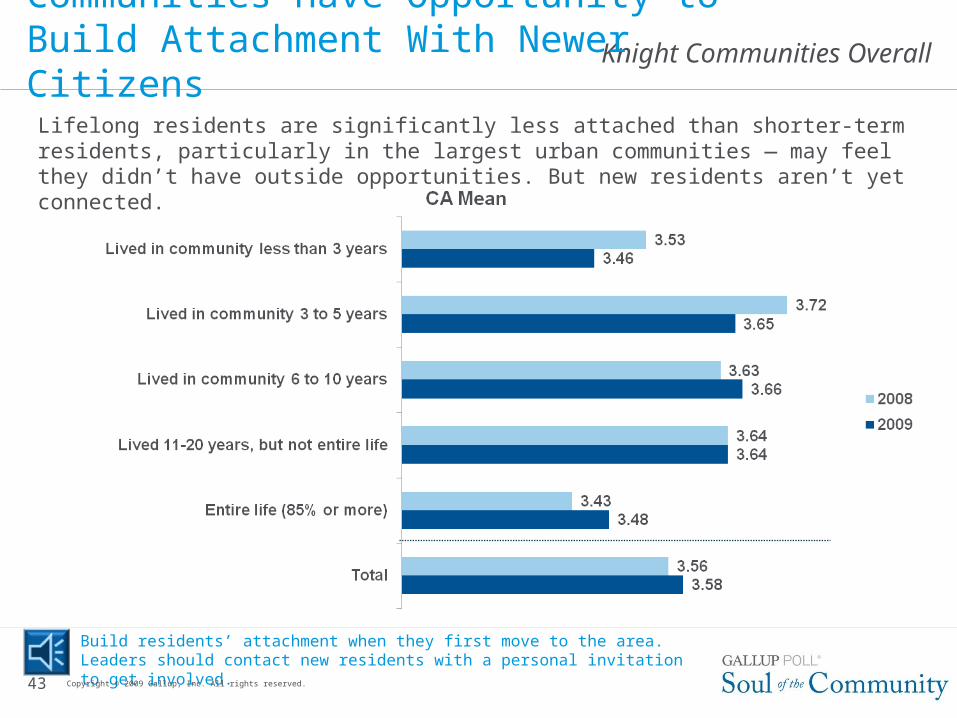
Communities Have Opportunity to Build Attachment With Newer Citizens
Lifelong residents are significantly less attached than shorter-term residents, particularly in the largest urban communities — may feel they didn’t have outside opportunities. But new residents aren’t yet connected.
Build residents’ attachment when they first move to the area. Leaders should contact new residents with a personal invitation to get involved.
Copyright © 2009 Gallup, Inc. All rights reserved.
Knight Communities Overall
44
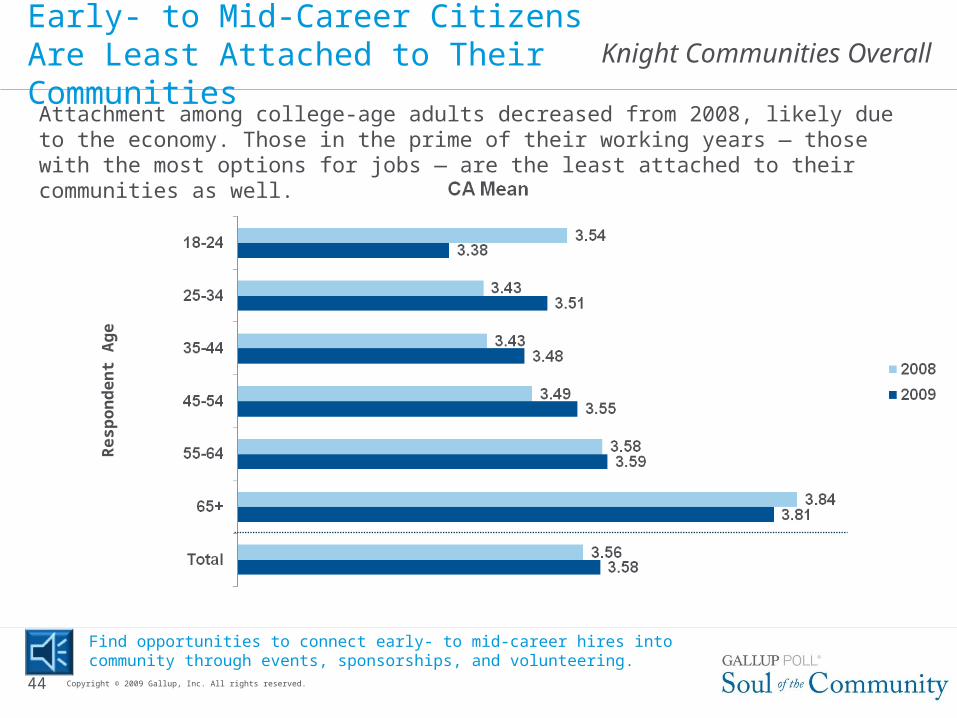
Early- to Mid-Career Citizens Are Least Attached to Their Communities
Re
sp
on
de
nt
Ag
e
Find opportunities to connect early- to mid-career hires into community through events, sponsorships, and volunteering.
Attachment among college-age adults decreased from 2008, likely due to the economy. Those in the prime of their working years — those with the most options for jobs — are the least attached to their communities as well.
Copyright © 2009 Gallup, Inc. All rights reserved.
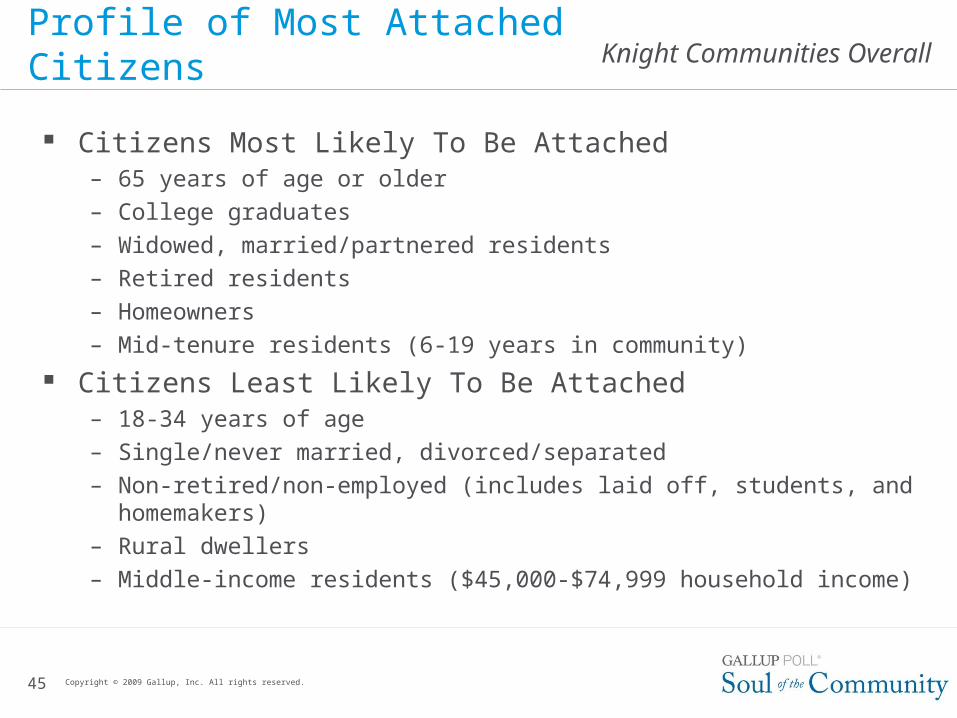
Knight Communities Overall Profile of Most Attached Citizens
Citizens Most Likely To Be Attached– 65 years of age or older
– College graduates
– Widowed, married/partnered residents
– Retired residents
– Homeowners
– Mid-tenure residents (6-19 years in community)
Citizens Least Likely To Be Attached– 18-34 years of age
– Single/never married, divorced/separated
– Non-retired/non-employed (includes laid off, students, and homemakers)
– Rural dwellers
– Middle-income residents ($45,000-$74,999 household income)
45 Copyright © 2009 Gallup, Inc. All rights reserved.
Knight Communities Overall
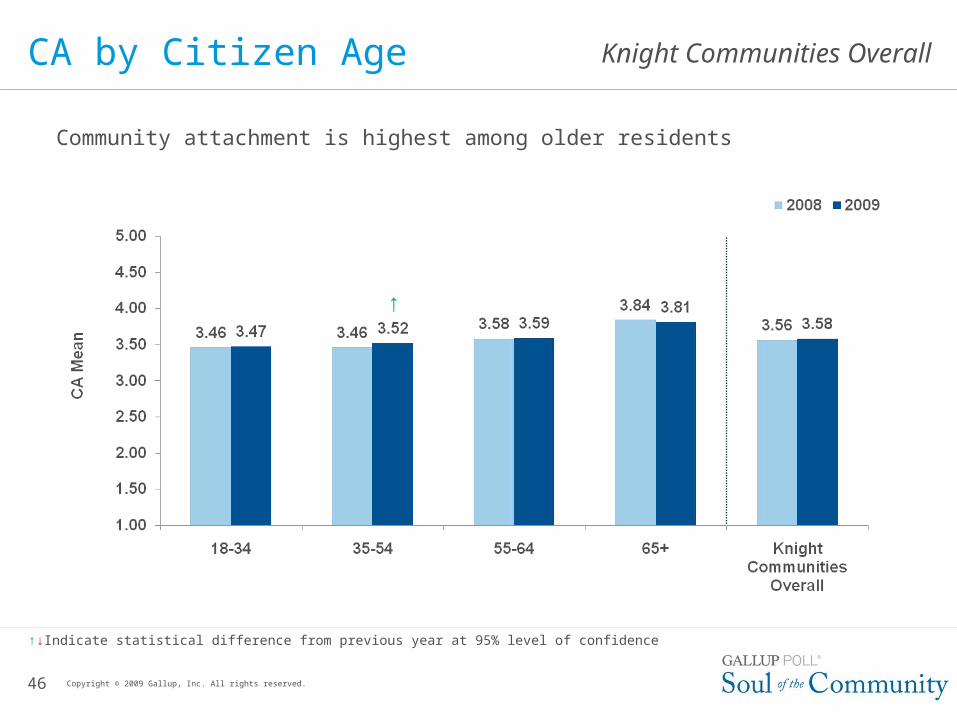
Community attachment is highest among older residents
46
CA by Citizen Age
Copyright © 2009 Gallup, Inc. All rights reserved.
↑↓Indicate statistical difference from previous year at 95% level of confidence
↑
Knight Communities Overall
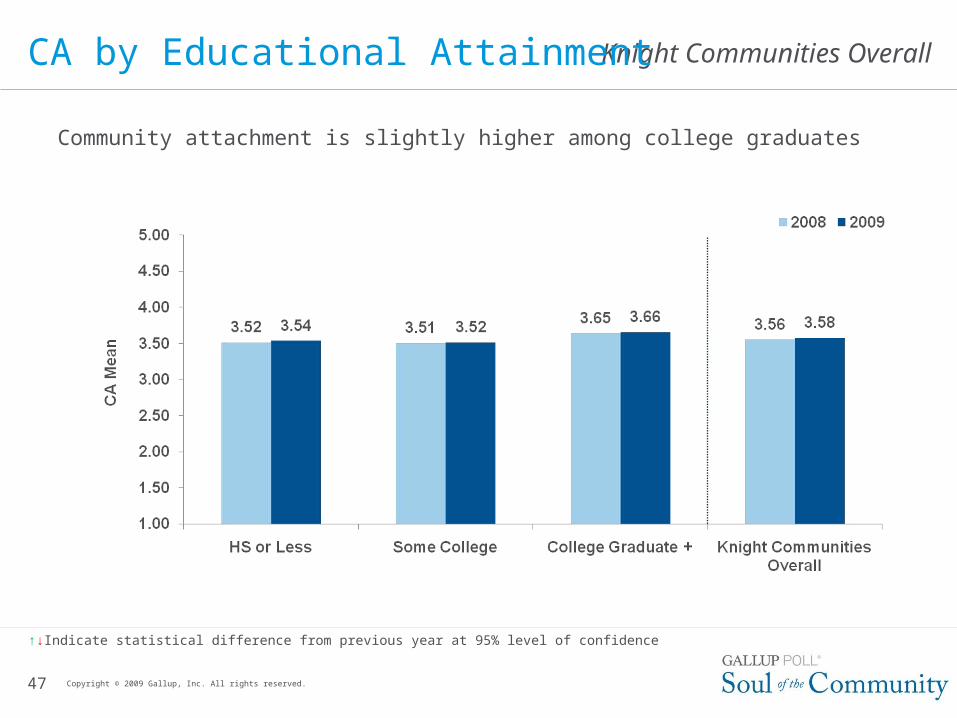
Community attachment is slightly higher among college graduates
47
CA by Educational Attainment
Copyright © 2009 Gallup, Inc. All rights reserved.
↑↓Indicate statistical difference from previous year at 95% level of confidence
Knight Communities Overall
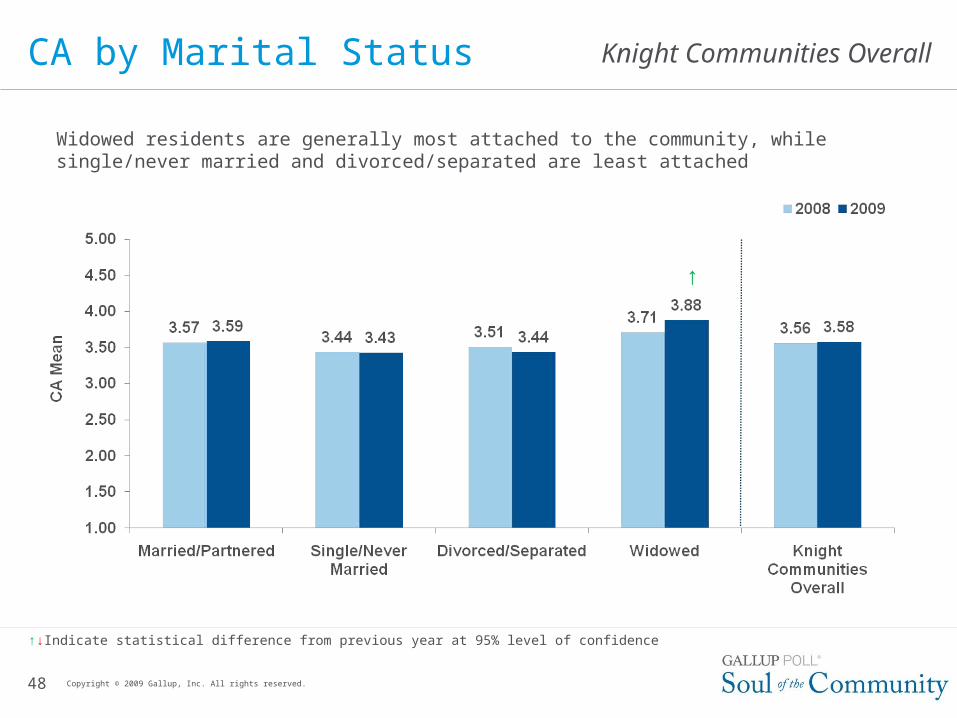
Widowed residents are generally most attached to the community, while single/never married and divorced/separated are least attached
48
CA by Marital Status
Copyright © 2009 Gallup, Inc. All rights reserved.
↑↓Indicate statistical difference from previous year at 95% level of confidence
↑
Knight Communities Overall
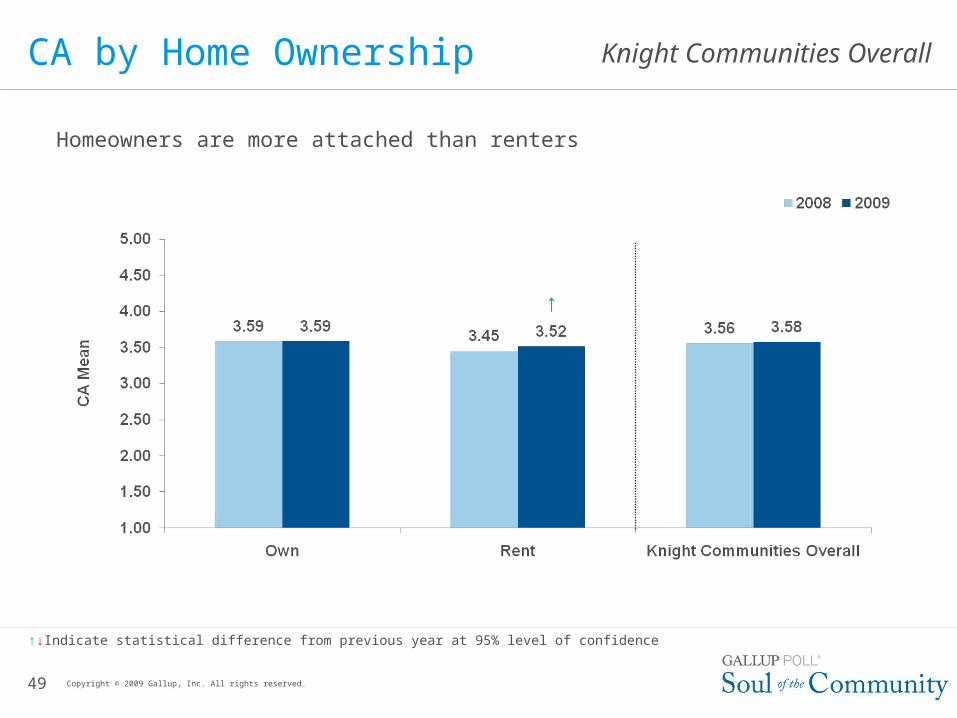
Homeowners are more attached than renters
49
CA by Home Ownership
Copyright © 2009 Gallup, Inc. All rights reserved.
↑↓Indicate statistical difference from previous year at 95% level of confidence
↑
Knight Communities Overall
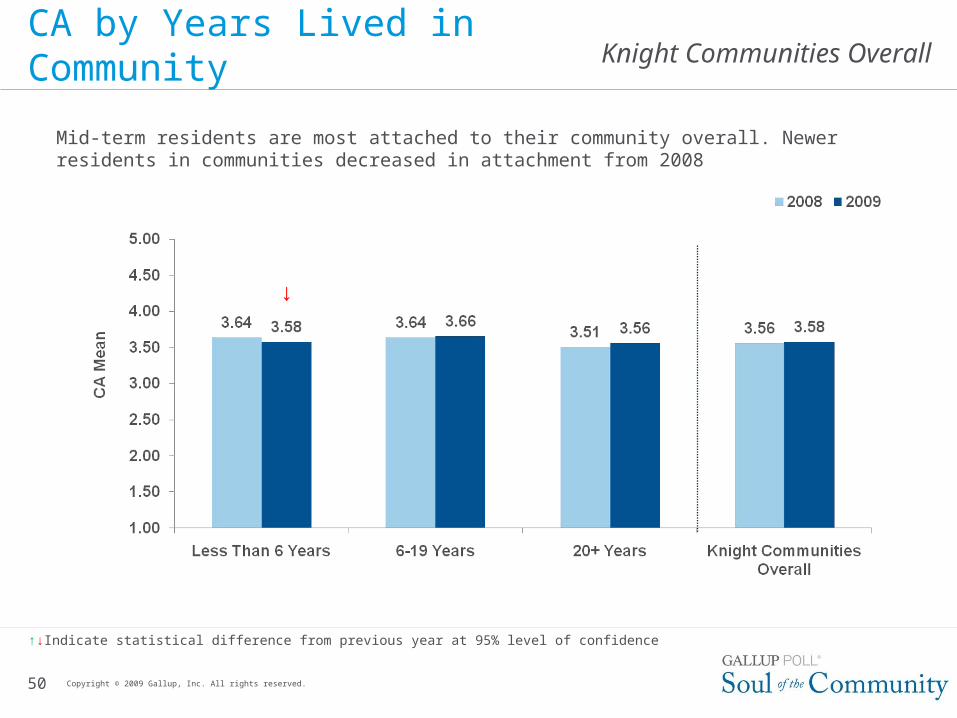
Mid-term residents are most attached to their community overall. Newer residents in communities decreased in attachment from 2008
50
CA by Years Lived in Community
Copyright © 2009 Gallup, Inc. All rights reserved.
↑↓Indicate statistical difference from previous year at 95% level of confidence
↑
Knight Communities Overall
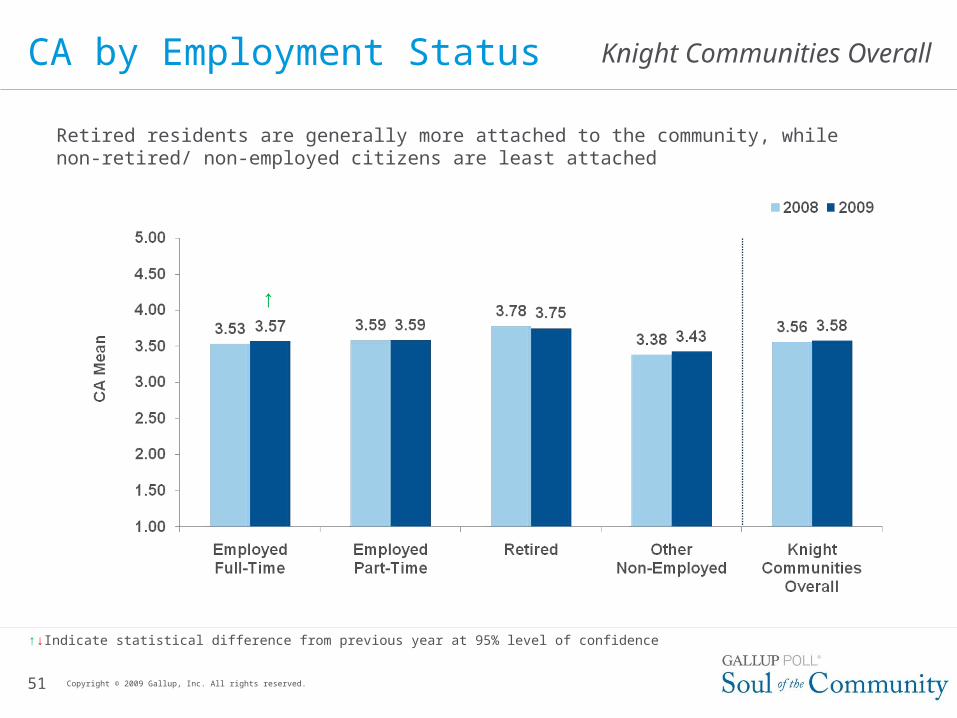
Retired residents are generally more attached to the community, while non-retired/ non-employed citizens are least attached
51
CA by Employment Status
Copyright © 2009 Gallup, Inc. All rights reserved.
↑↓Indicate statistical difference from previous year at 95% level of confidence
↑
Knight Communities Overall
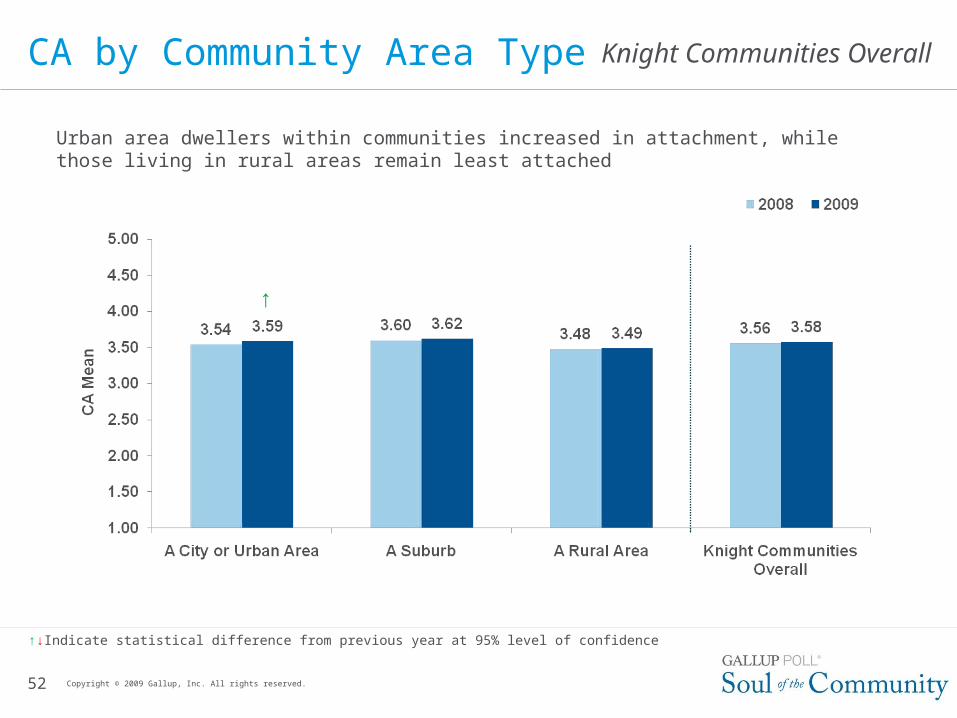
Urban area dwellers within communities increased in attachment, while those living in rural areas remain least attached
52
CA by Community Area Type
Copyright © 2009 Gallup, Inc. All rights reserved.
↑↓Indicate statistical difference from previous year at 95% level of confidence
↑
Knight Communities Overall
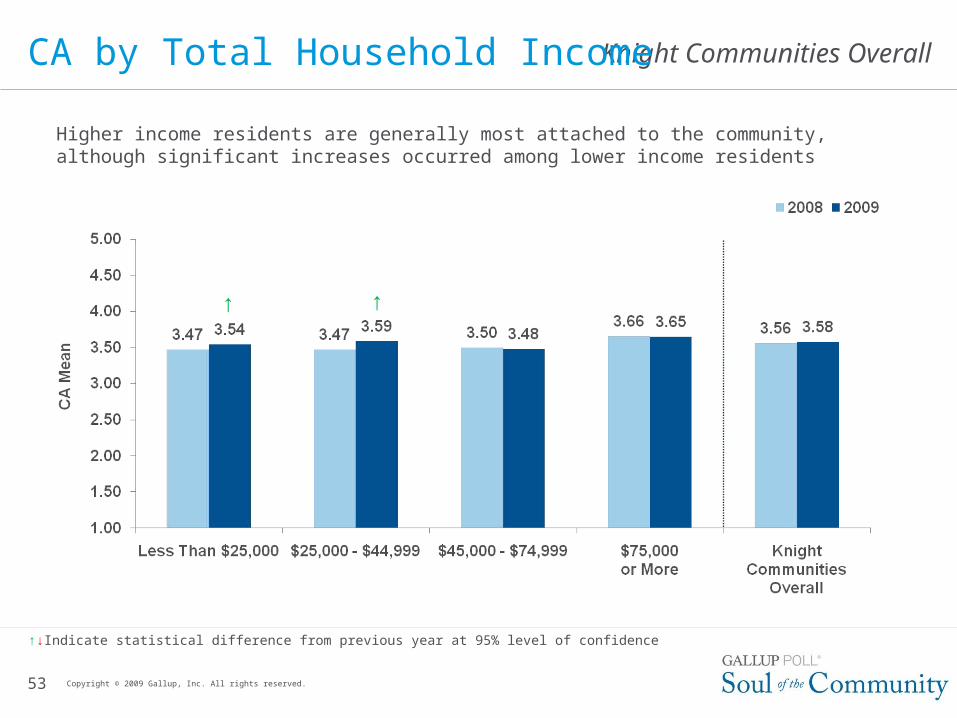
Higher income residents are generally most attached to the community, although significant increases occurred among lower income residents
53
CA by Total Household Income
Copyright © 2009 Gallup, Inc. All rights reserved.
↑↓Indicate statistical difference from previous year at 95% level of confidence
↑↑
Knight Communities Overall
Domain Comparisons by Urbanicity Groups
54 Copyright © 2009 Gallup, Inc. All rights reserved.
Knight Communities Overall
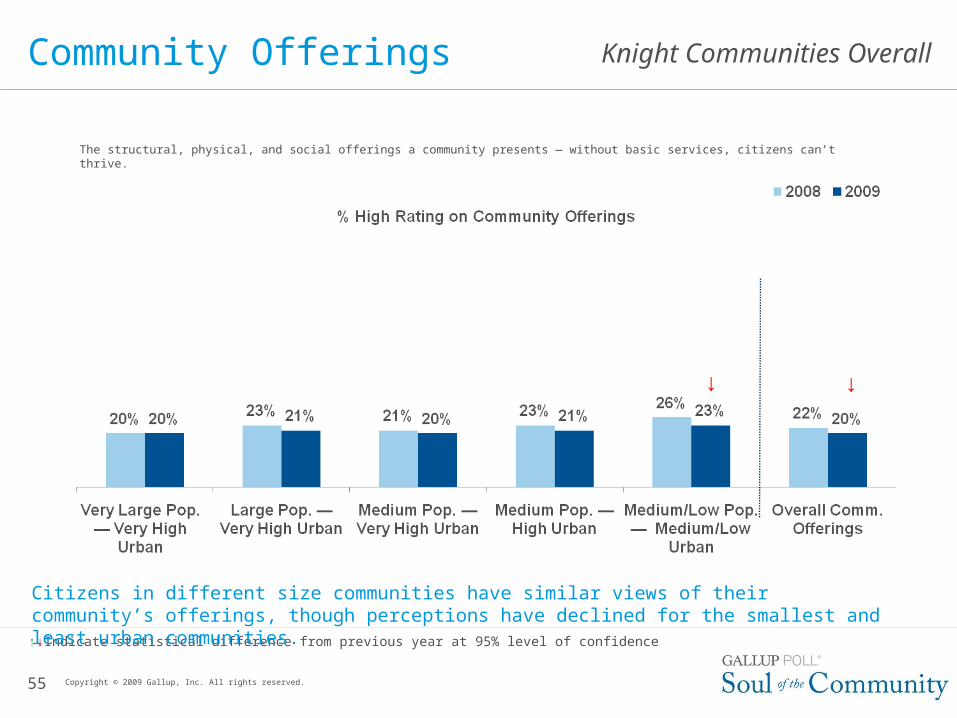
The structural, physical, and social offerings a community presents — without basic services, citizens can’t thrive.
55
Community Offerings
Copyright © 2009 Gallup, Inc. All rights reserved.
↑↓Indicate statistical difference from previous year at 95% level of confidence
Citizens in different size communities have similar views of their community’s offerings, though perceptions have declined for the smallest and least urban communities.
↓ ↓
Knight Communities Overall
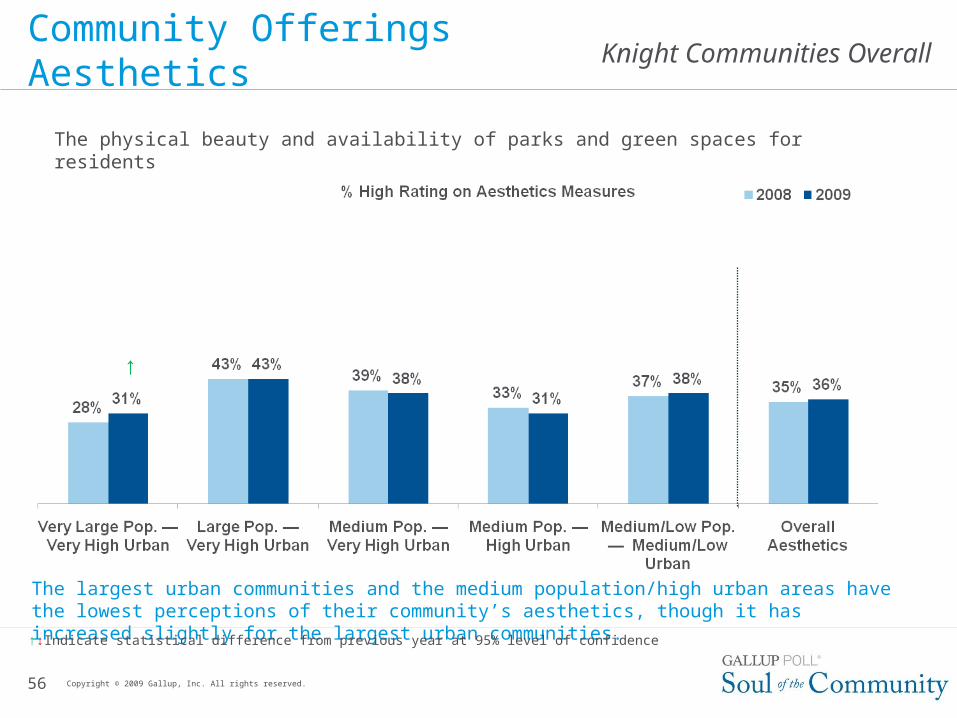
The physical beauty and availability of parks and green spaces for residents
56
Community Offerings Aesthetics
Copyright © 2009 Gallup, Inc. All rights reserved.
The largest urban communities and the medium population/high urban areas have the lowest perceptions of their community’s aesthetics, though it has increased slightly for the largest urban communities.↑↓Indicate statistical difference from previous year at 95% level of confidence
↑
Knight Communities Overall
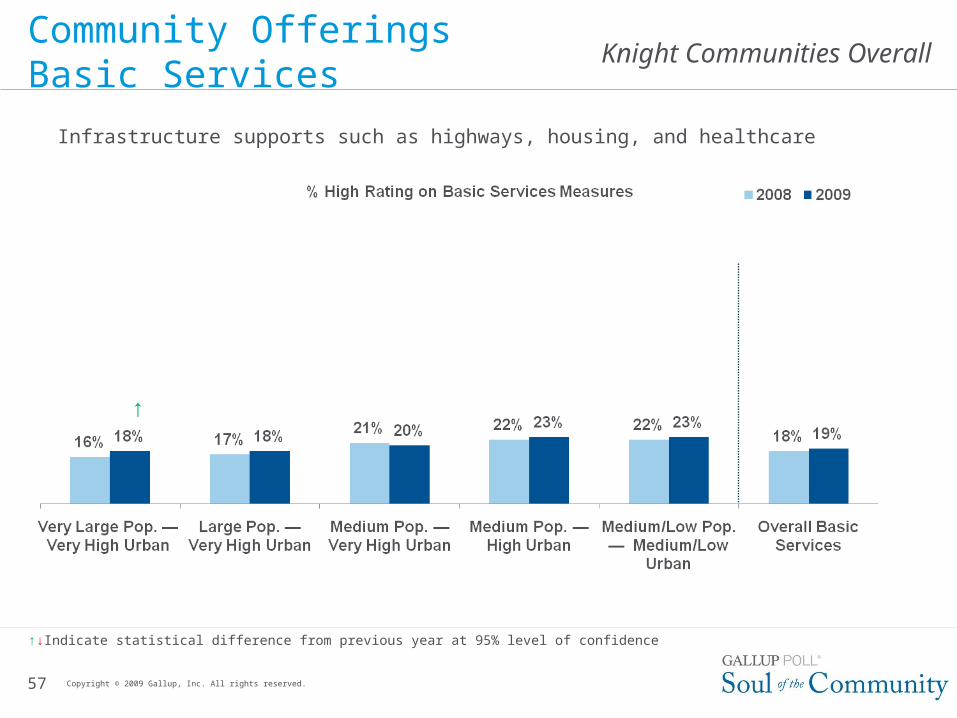
Infrastructure supports such as highways, housing, and healthcare
57
Community Offerings Basic Services
Copyright © 2009 Gallup, Inc. All rights reserved.
↑↓Indicate statistical difference from previous year at 95% level of confidence
↑
Knight Communities Overall
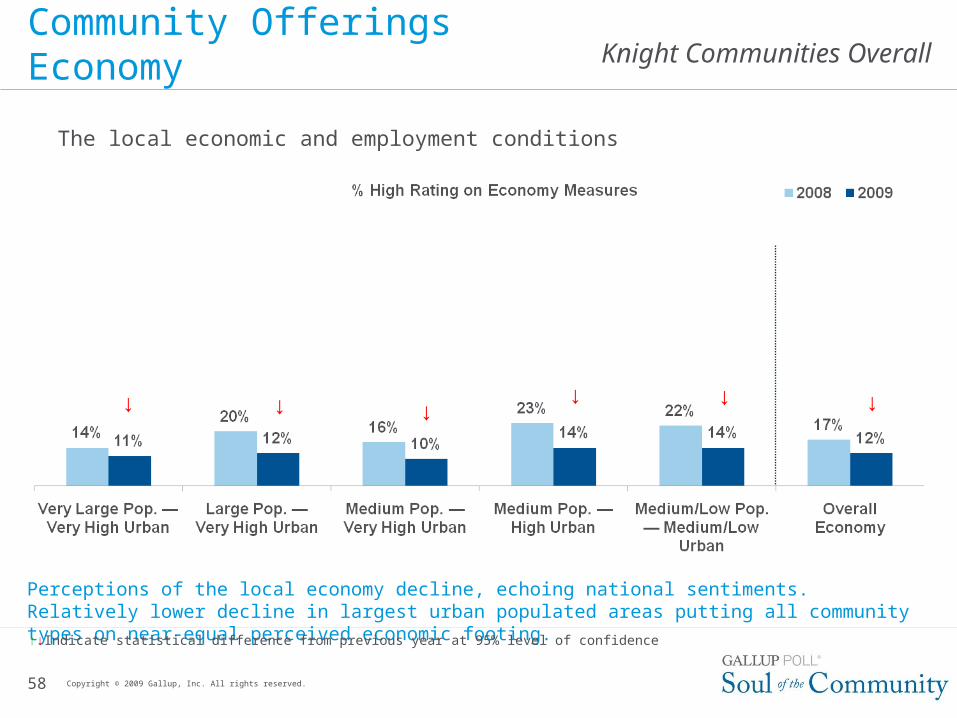
The local economic and employment conditions
58 Copyright © 2009 Gallup, Inc. All rights reserved.
Perceptions of the local economy decline, echoing national sentiments. Relatively lower decline in largest urban populated areas putting all community types on near-equal perceived economic footing.
Community Offerings Economy
↑↓Indicate statistical difference from previous year at 95% level of confidence
↓ ↓ ↓↓ ↓ ↓
Knight Communities Overall
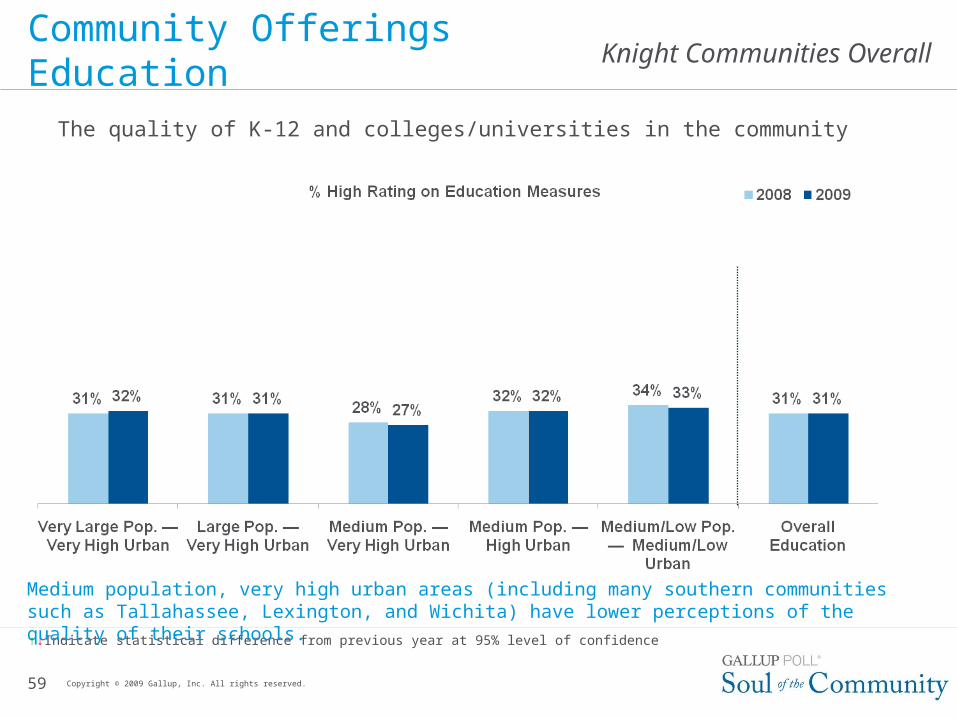
The quality of K-12 and colleges/universities in the community
59
Community Offerings Education
Copyright © 2009 Gallup, Inc. All rights reserved.
↑↓Indicate statistical difference from previous year at 95% level of confidence
Medium population, very high urban areas (including many southern communities such as Tallahassee, Lexington, and Wichita) have lower perceptions of the quality of their schools.
Knight Communities Overall
The leadership and alignment of views of elected officials with citizens
60
Community OfferingsLeadership
Copyright © 2009 Gallup, Inc. All rights reserved.
↑↓Indicate statistical difference from previous year at 95% level of confidence
↓
Knight Communities Overall
The local area crime and safety conditions
61
Community Offerings Safety
Copyright © 2009 Gallup, Inc. All rights reserved.
↑↓Indicate statistical difference from previous year at 95% level of confidence
Knight Communities Overall
The entertainment infrastructure for people to meet each other, and citizen caring
62
Community OfferingsSocial Offerings
Copyright © 2009 Gallup, Inc. All rights reserved.
↑↓Indicate statistical difference from previous year at 95% level of confidence
Knight Communities Overall
How welcoming the community is to different types of people
63
Openness
Copyright © 2009 Gallup, Inc. All rights reserved.
↑↓Indicate statistical difference from previous year at 95% level of confidence
Knight Communities Overall
The mixture of mental and physical well-being items. The metric is an overall measure of personal and community well-being.
64
Emotional Wellness
Copyright © 2009 Gallup, Inc. All rights reserved.
↓
Knight Communities Overall
The people-connections citizens have to each other
65
Social Capital
Copyright © 2009 Gallup, Inc. All rights reserved.
Knight Communities Overall
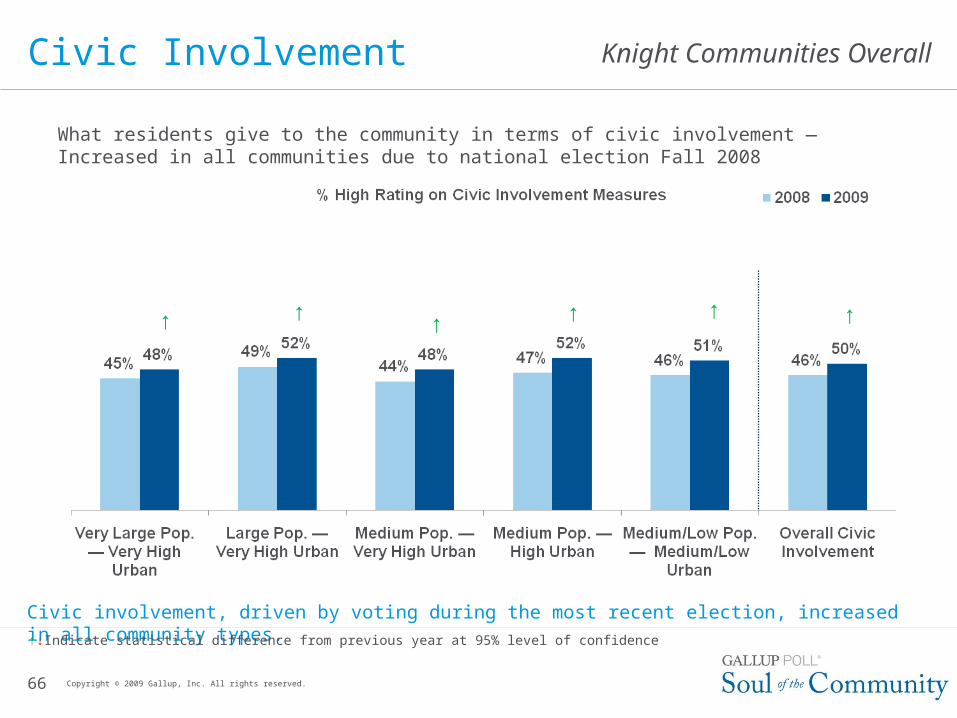
What residents give to the community in terms of civic involvement — Increased in all communities due to national election Fall 2008
66
Civic Involvement
Copyright © 2009 Gallup, Inc. All rights reserved.
↑ ↑ ↑ ↑ ↑ ↑
Civic involvement, driven by voting during the most recent election, increased in all community types.
↑↓Indicate statistical difference from previous year at 95% level of confidence
Knight Communities Overall
Appendix
67 Copyright © 2009 Gallup, Inc. All rights reserved.
Knight Communities Overall
68
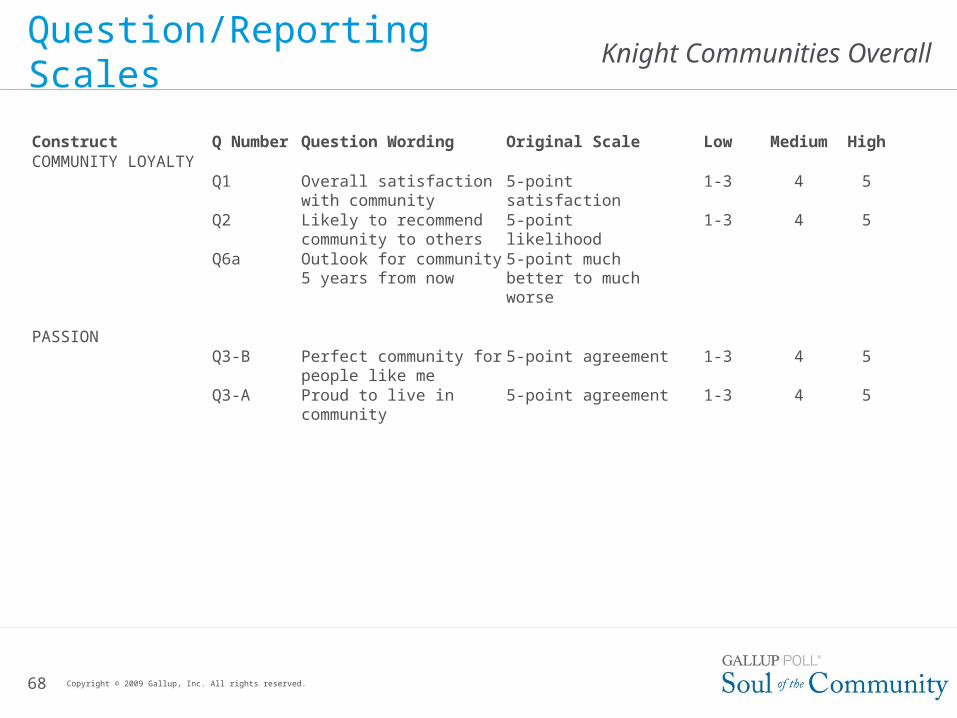
Question/Reporting Scales
Construct Q Number Question Wording Original Scale Low Medium HighCOMMUNITY LOYALTY
Q1 Overall satisfaction with community
5-point satisfaction 1-3 4 5
Q2 Likely to recommend community to others
5-point likelihood 1-3 4 5
Q6a Outlook for community 5 years from now
5-point much better to much worse
PASSIONQ3-B Perfect community for
people like me5-point agreement 1-3 4 5
Q3-A Proud to live in community 5-point agreement 1-3 4 5
Copyright © 2009 Gallup, Inc. All rights reserved.
Knight Communities Overall Question/Reporting Scales(continued)
69 Copyright © 2009 Gallup, Inc. All rights reserved.
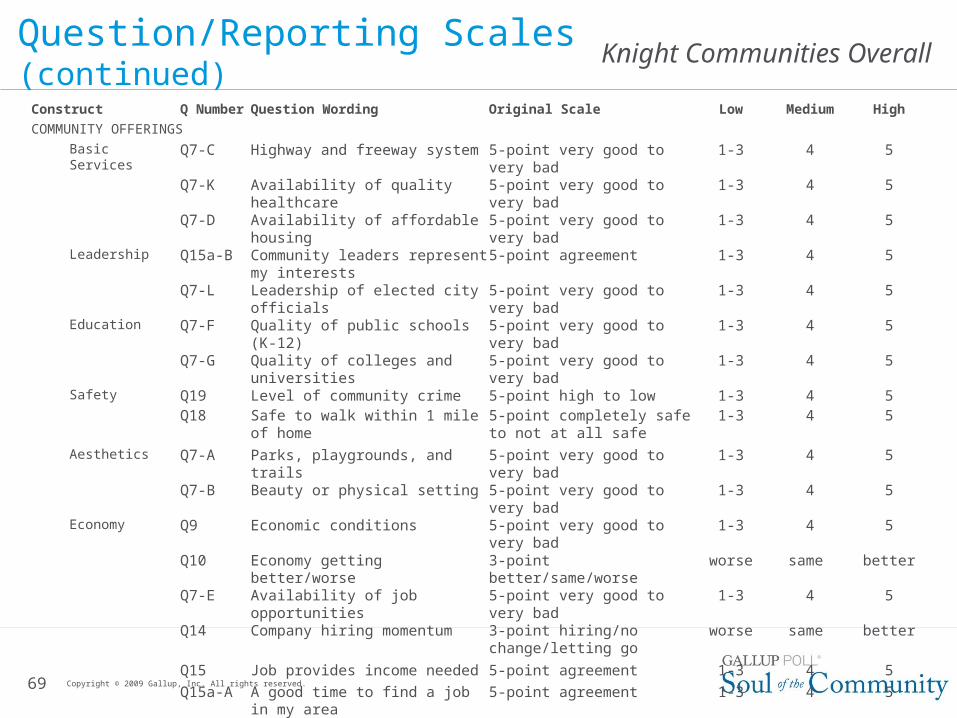
Construct Q Number Question Wording Original Scale Low Medium High
COMMUNITY OFFERINGS
Basic Services Q7-C Highway and freeway system 5-point very good to very bad 1-3 4 5Q7-K Availability of quality healthcare 5-point very good to very bad 1-3 4 5
Q7-D Availability of affordable housing 5-point very good to very bad 1-3 4 5Leadership Q15a-B Community leaders represent my
interests5-point agreement 1-3 4 5
Q7-L Leadership of elected city officials 5-point very good to very bad 1-3 4 5
Education Q7-F Quality of public schools (K-12) 5-point very good to very bad 1-3 4 5Q7-G Quality of colleges and universities 5-point very good to very bad 1-3 4 5
Safety Q19 Level of community crime 5-point high to low 1-3 4 5Q18 Safe to walk within 1 mile of home 5-point completely safe to not
at all safe1-3 4 5
Aesthetics Q7-A Parks, playgrounds, and trails 5-point very good to very bad 1-3 4 5Q7-B Beauty or physical setting 5-point very good to very bad 1-3 4 5
Economy Q9 Economic conditions 5-point very good to very bad 1-3 4 5Q10 Economy getting better/worse 3-point better/same/worse worse same better
Q7-E Availability of job opportunities 5-point very good to very bad 1-3 4 5
Q14 Company hiring momentum 3-point hiring/no change/letting go
worse same better
Q15 Job provides income needed 5-point agreement 1-3 4 5
Q15a-A A good time to find a job in my area 5-point agreement 1-3 4 5Social Offerings Q7-H Vibrant nightlife 5-point very good to very bad 1-3 4 5
Q7-I Good place to meet people and make friends
5-point very good to very bad 1-3 4 5
Q7-M Other people care about each other 5-point very good to very bad 1-3 4 5
Knight Communities Overall
70
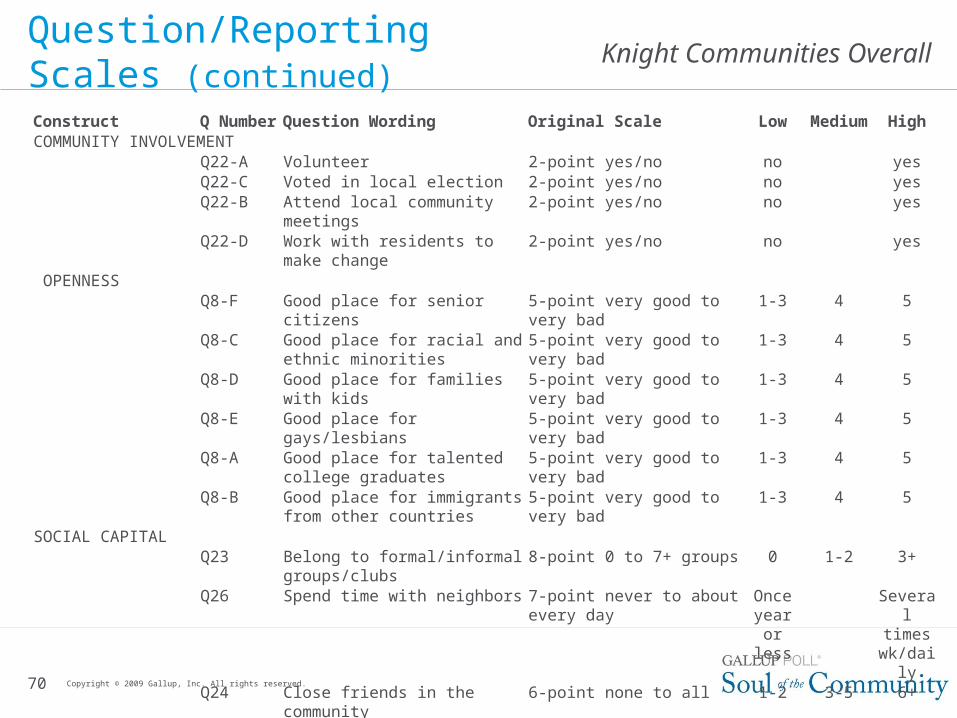
Question/Reporting Scales (continued)Construct Q Number Question Wording Original Scale Low Medium HighCOMMUNITY INVOLVEMENT
Q22-A Volunteer 2-point yes/no no yesQ22-C Voted in local election 2-point yes/no no yesQ22-B Attend local community meetings 2-point yes/no no yesQ22-D Work with residents to make
change2-point yes/no no yes
OPENNESSQ8-F Good place for senior citizens 5-point very good to very bad 1-3 4 5Q8-C Good place for racial and ethnic
minorities5-point very good to very bad 1-3 4 5
Q8-D Good place for families with kids 5-point very good to very bad 1-3 4 5Q8-E Good place for gays/lesbians 5-point very good to very bad 1-3 4 5Q8-A Good place for talented college
graduates5-point very good to very bad 1-3 4 5
Q8-B Good place for immigrants from other countries
5-point very good to very bad 1-3 4 5
SOCIAL CAPITALQ23 Belong to formal/informal
groups/clubs8-point 0 to 7+ groups 0 1-2 3+
Q26 Spend time with neighbors 7-point never to about every day
Once year or
less
Several times
wk/dailyQ24 Close friends in the community 6-point none to all 1-2 3-5 6+Q25 Family in area 6-point none to all 1-2 3-5 6+
Copyright © 2009 Gallup, Inc. All rights reserved.
Knight Communities Overall
71
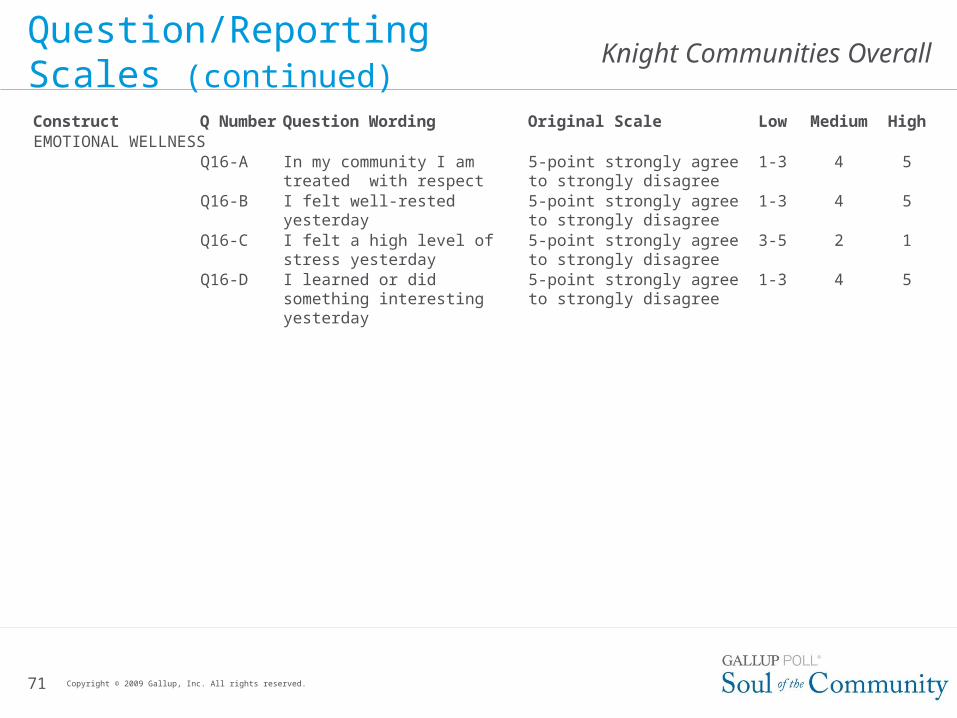
Question/Reporting Scales (continued)Construct Q Number Question Wording Original Scale Low Medium HighEMOTIONAL WELLNESS
Q16-A In my community I am treated with respect
5-point strongly agree to strongly disagree
1-3 4 5
Q16-B I felt well-rested yesterday 5-point strongly agree to strongly disagree
1-3 4 5
Q16-C I felt a high level of stress yesterday
5-point strongly agree to strongly disagree
3-5 2 1
Q16-D I learned or did something interesting yesterday
5-point strongly agree to strongly disagree
1-3 4 5
Copyright © 2009 Gallup, Inc. All rights reserved.
Knight Communities Overall
72
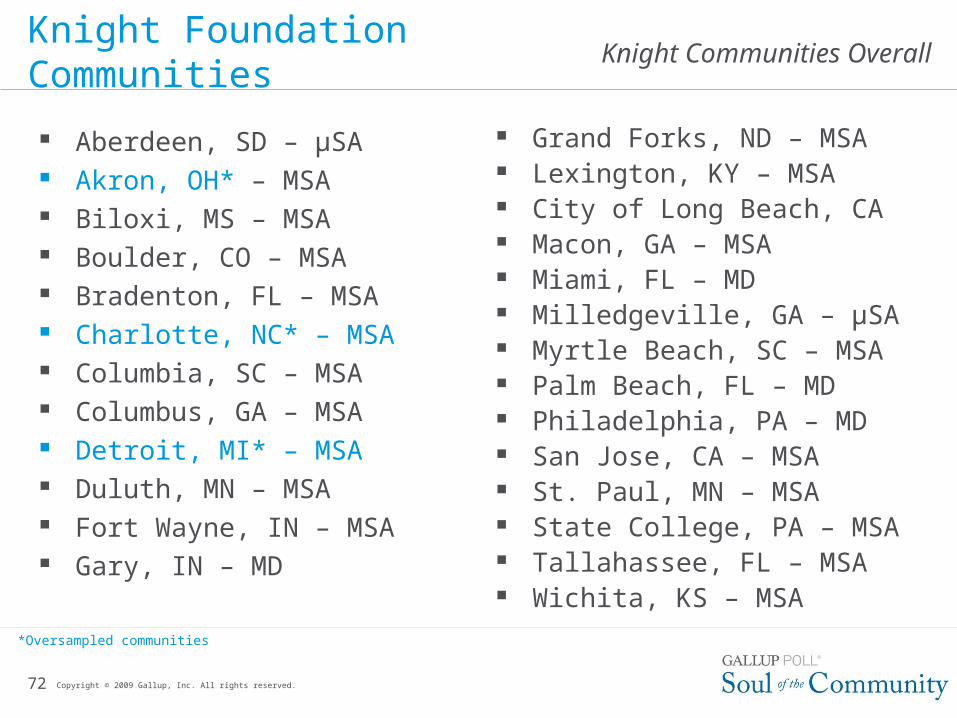
Knight Foundation Communities
*Oversampled communities
Copyright © 2009 Gallup, Inc. All rights reserved.
Aberdeen, SD – µSA Akron, OH* – MSA Biloxi, MS – MSA Boulder, CO – MSA Bradenton, FL – MSA Charlotte, NC* – MSA Columbia, SC – MSA Columbus, GA – MSA Detroit, MI* – MSA Duluth, MN – MSA Fort Wayne, IN – MSA Gary, IN – MD
Grand Forks, ND – MSA Lexington, KY – MSA City of Long Beach, CA Macon, GA – MSA Miami, FL – MD Milledgeville, GA – µSA Myrtle Beach, SC – MSA Palm Beach, FL – MD Philadelphia, PA – MD San Jose, CA – MSA St. Paul, MN – MSA State College, PA – MSA Tallahassee, FL – MSA Wichita, KS – MSA
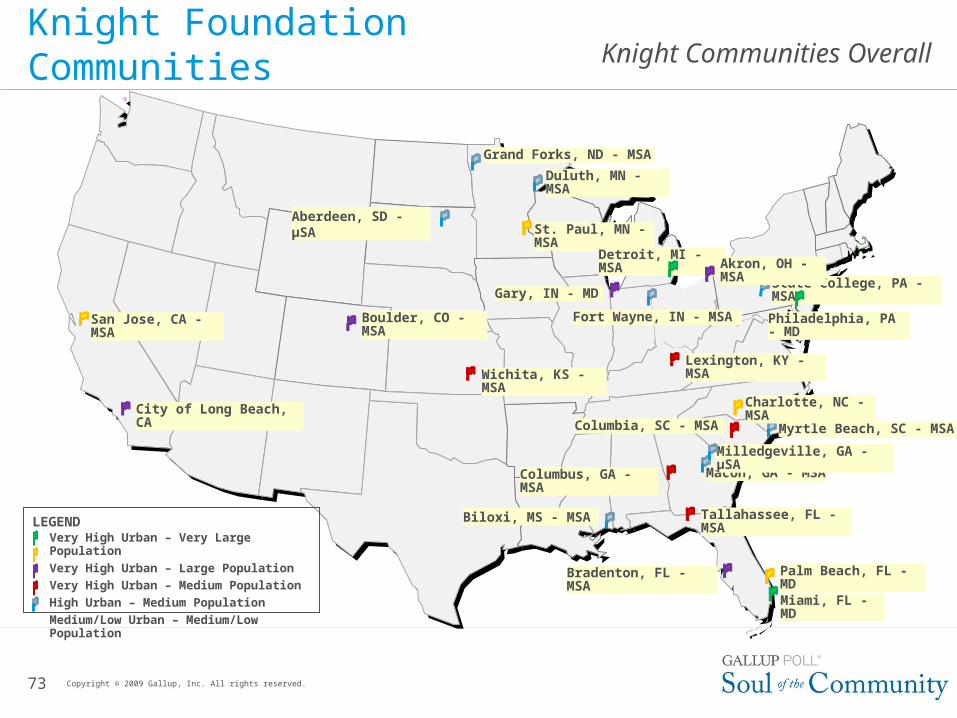
Knight Communities Overall Knight Foundation Communities
73
Bradenton, FL - MSA
Fort Wayne, IN - MSA
Aberdeen, SD - µSA
Biloxi, MS - MSA
Duluth, MN - MSA
St. Paul, MN - MSA
Macon, GA - MSA
Milledgeville, GA - µSA
Myrtle Beach, SC - MSA Columbia, SC - MSA
State College, PA - MSA
Philadelphia, PA - MD
Lexington, KY - MSAWichita, KS - MSA
Miami, FL - MD
Palm Beach, FL - MD
Charlotte, NC - MSA
San Jose, CA - MSA
Detroit, MI - MSA
Gary, IN - MD
City of Long Beach, CA
Akron, OH - MSA
Boulder, CO - MSA
Very High Urban – Very Large Population
Very High Urban – Large Population
Very High Urban – Medium Population
High Urban – Medium Population
Medium/Low Urban – Medium/Low Population
LEGEND Tallahassee, FL - MSA
Columbus, GA - MSA
Grand Forks, ND - MSA
Copyright © 2009 Gallup, Inc. All rights reserved.
Knight Communities Overall
74
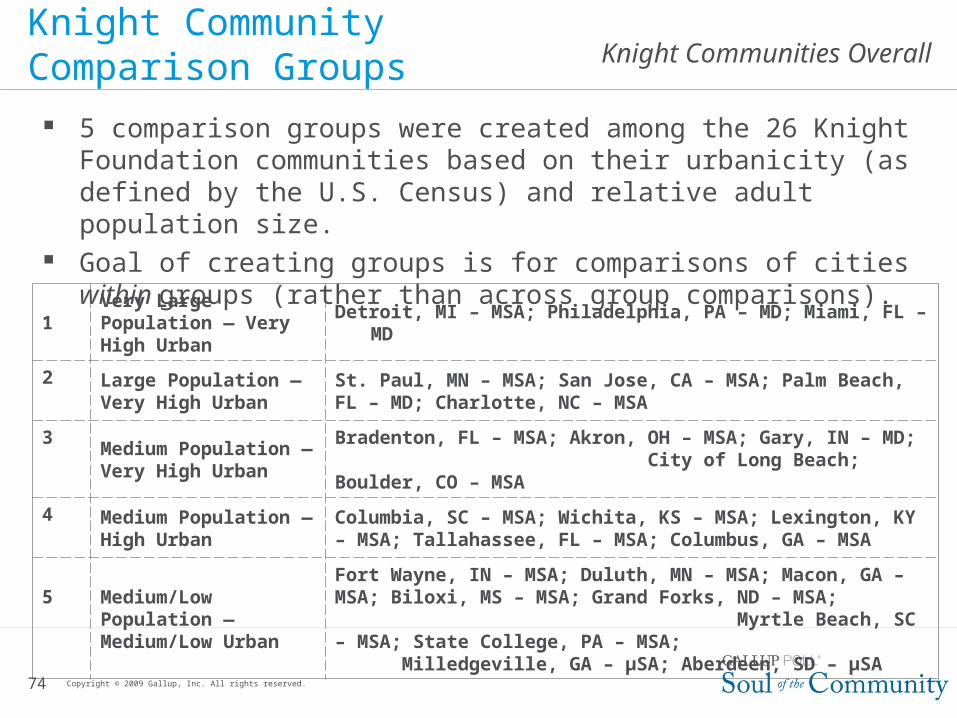
Knight Community Comparison Groups
5 comparison groups were created among the 26 Knight Foundation communities based on their urbanicity (as defined by the U.S. Census) and relative adult population size.
Goal of creating groups is for comparisons of cities within groups (rather than across group comparisons).
Copyright © 2009 Gallup, Inc. All rights reserved.
1Very Large Population — Very High Urban
Detroit, MI – MSA; Philadelphia, PA – MD; Miami, FL – MD
2 Large Population — Very High Urban
St. Paul, MN – MSA; San Jose, CA – MSA; Palm Beach, FL – MD; Charlotte, NC – MSA
3 Medium Population —Very High Urban
Bradenton, FL – MSA; Akron, OH – MSA; Gary, IN – MD; City of Long Beach; Boulder, CO – MSA
4 Medium Population —High Urban
Columbia, SC – MSA; Wichita, KS – MSA; Lexington, KY – MSA; Tallahassee, FL – MSA; Columbus, GA – MSA
5 Medium/Low Population — Medium/Low Urban
Fort Wayne, IN – MSA; Duluth, MN – MSA; Macon, GA – MSA; Biloxi, MS – MSA; Grand Forks, ND – MSA; Myrtle Beach, SC – MSA; State College, PA – MSA; Milledgeville, GA – µSA; Aberdeen, SD – µSA
Knight Communities Overall
75
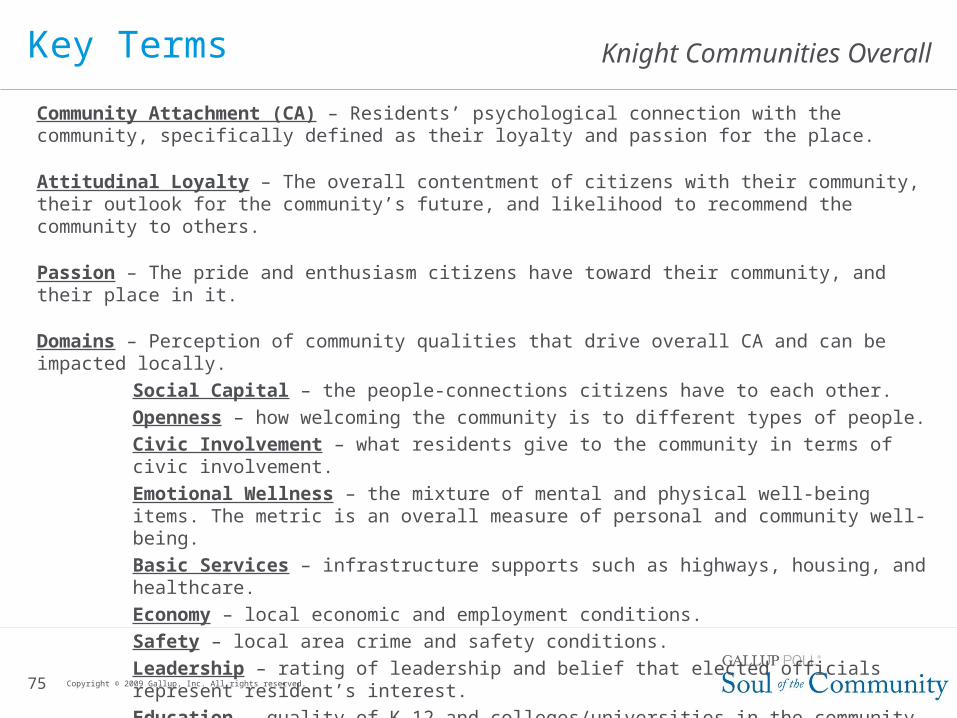
Key Terms
Community Attachment (CA) – Residents’ psychological connection with the community, specifically defined as their loyalty and passion for the place.
Attitudinal Loyalty – The overall contentment of citizens with their community, their outlook for the community’s future, and likelihood to recommend the community to others.
Passion – The pride and enthusiasm citizens have toward their community, and their place in it.
Domains – Perception of community qualities that drive overall CA and can be impacted locally.
Social Capital – the people-connections citizens have to each other.
Openness – how welcoming the community is to different types of people.
Civic Involvement – what residents give to the community in terms of civic involvement.
Emotional Wellness – the mixture of mental and physical well-being items. The metric is an overall measure of personal and community well-being.
Basic Services – infrastructure supports such as highways, housing, and healthcare.
Economy – local economic and employment conditions.
Safety – local area crime and safety conditions.
Leadership – rating of leadership and belief that elected officials represent resident’s interest.
Education – quality of K-12 and colleges/universities in the community.
Aesthetics – physical beauty and availability of parks and green spaces for residents.
Social Offerings – entertainment infrastructure for people to meet each other, and citizen caring.
Copyright © 2009 Gallup, Inc. All rights reserved.
Knight Communities Overall
76
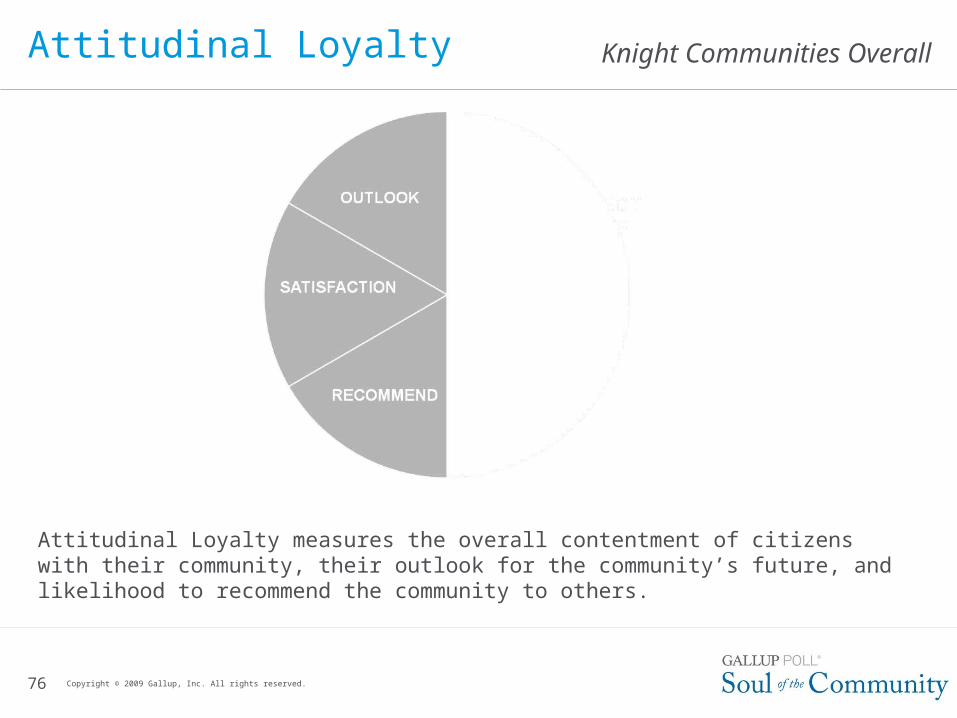
Attitudinal Loyalty
Attitudinal Loyalty measures the overall contentment of citizens with their community, their outlook for the community’s future, and likelihood to recommend the community to others.
Copyright © 2009 Gallup, Inc. All rights reserved.
Knight Communities Overall
77
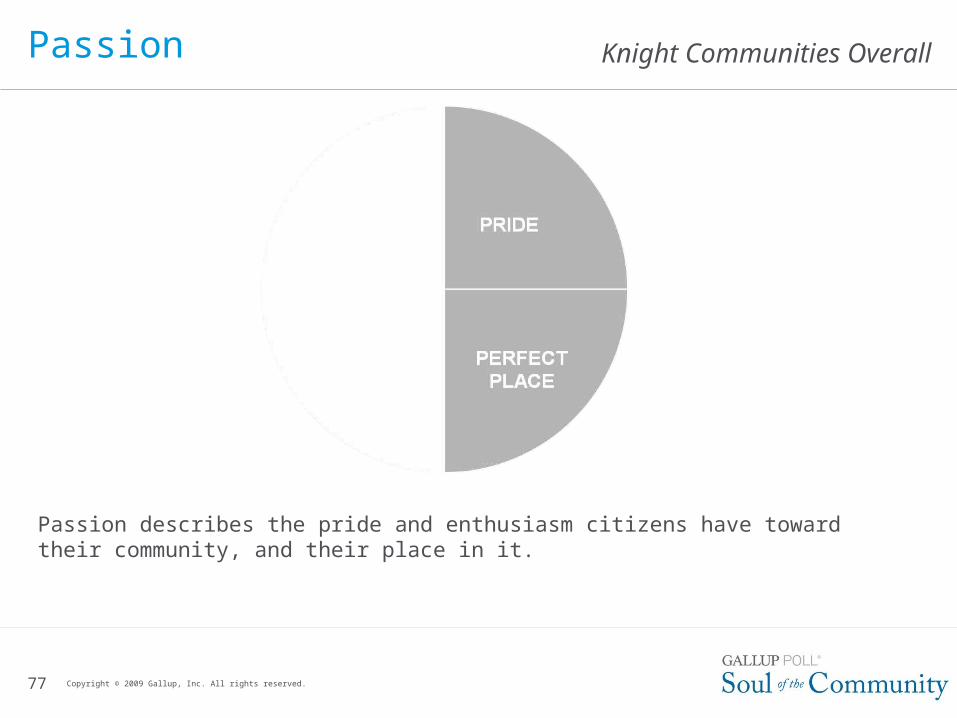
Passion
Passion describes the pride and enthusiasm citizens have toward their community, and their place in it.
Copyright © 2009 Gallup, Inc. All rights reserved.
Knight Communities Overall
78
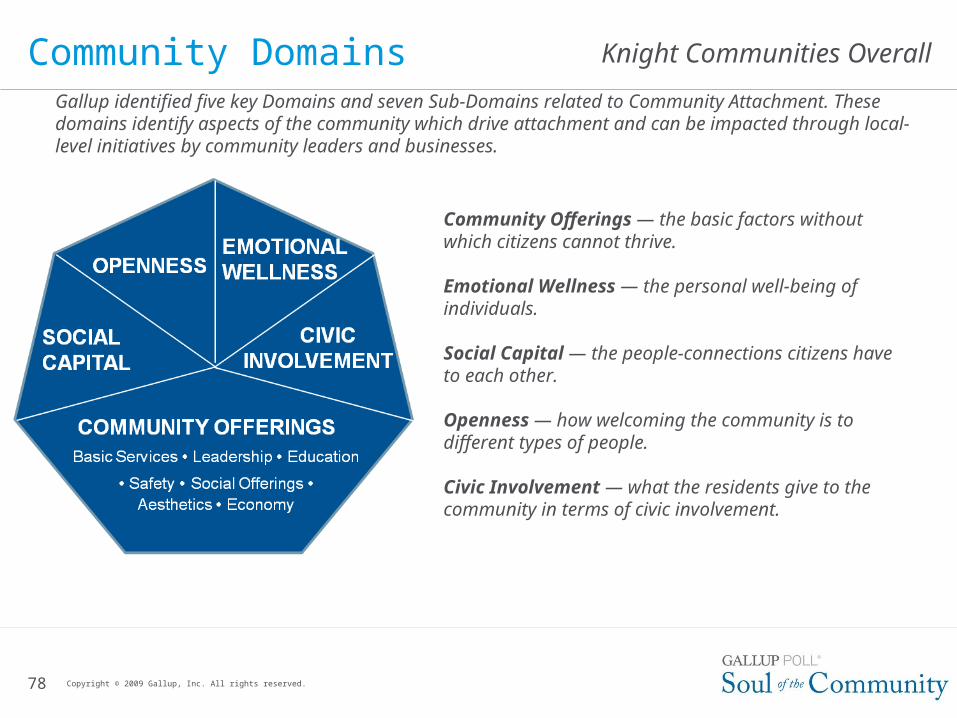
Community DomainsGallup identified five key Domains and seven Sub-Domains related to Community Attachment. These domains identify aspects of the community which drive attachment and can be impacted through local-level initiatives by community leaders and businesses.
Copyright © 2009 Gallup, Inc. All rights reserved.
Community Offerings — the basic factors without which citizens cannot thrive.
Emotional Wellness — the personal well-being of individuals.
Social Capital — the people-connections citizens have to each other.
Openness — how welcoming the community is to different types of people.
Civic Involvement — what the residents give to the community in terms of civic involvement.
Knight Communities Overall
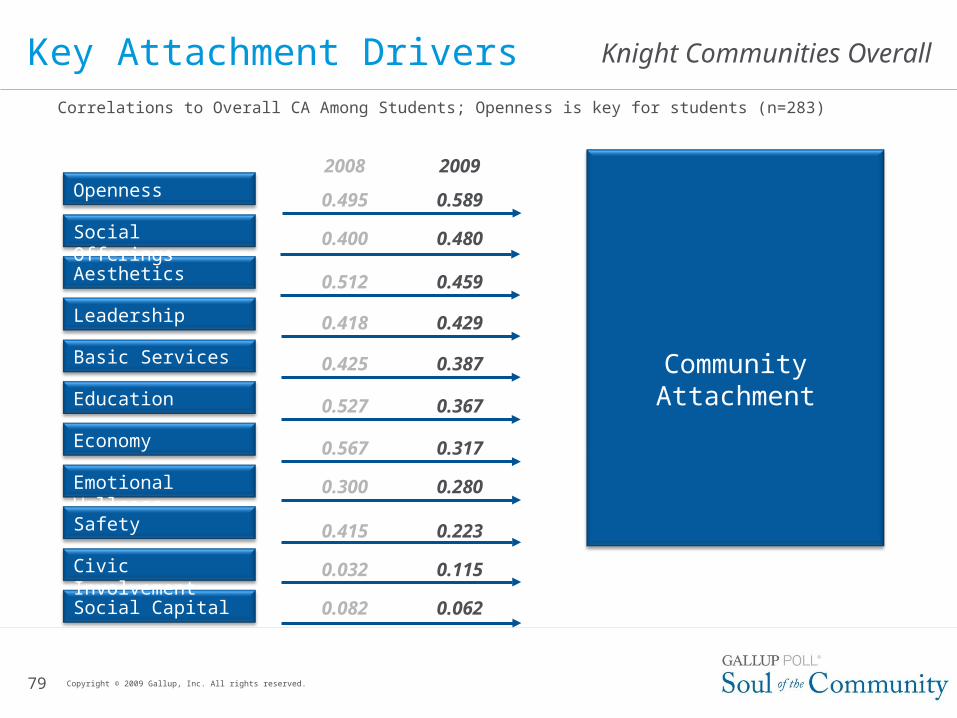
2008 2009
0.495 0.589
0.400 0.480
0.512 0.459
0.418 0.429
0.425 0.387
0.527 0.367
0.567 0.317
0.300 0.280
0.415 0.223
0.032 0.115
0.082 0.062
Correlations to Overall CA Among Students; Openness is key for students (n=283)
79 Copyright © 2009 Gallup, Inc. All rights reserved.
Key Attachment Drivers
Community Attachment
Economy
Openness
Emotional Wellness
Aesthetics
Social Capital
Civic Involvement
Leadership
Safety
Education
Basic Services
Social Offerings
Knight Communities Overall
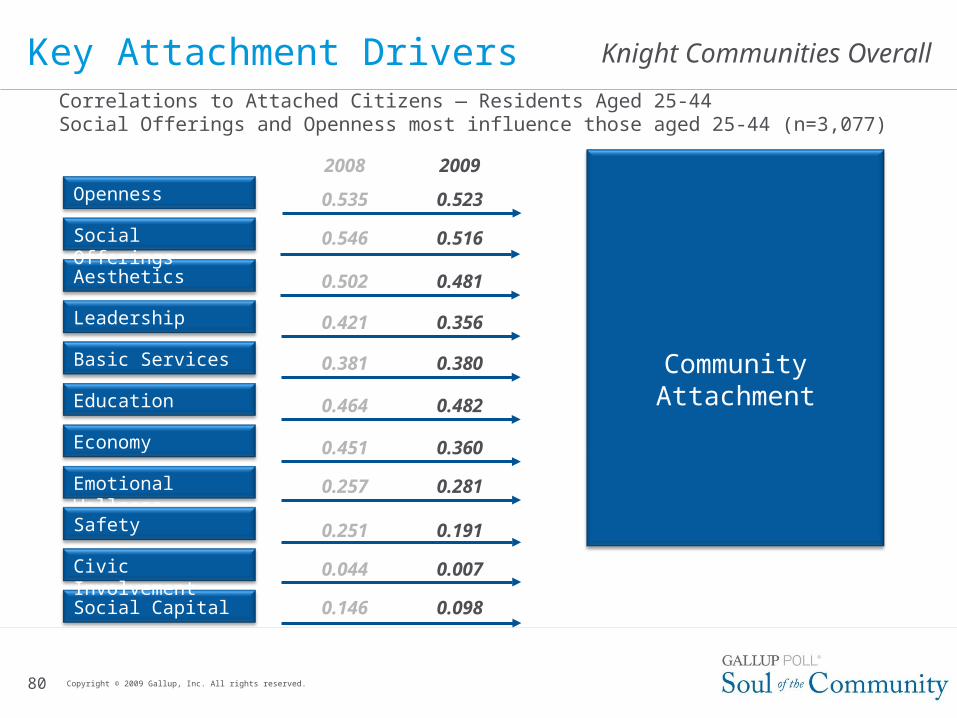
2008 2009
0.535 0.523
0.546 0.516
0.502 0.481
0.421 0.356
0.381 0.380
0.464 0.482
0.451 0.360
0.257 0.281
0.251 0.191
0.044 0.007
0.146 0.098
Correlations to Attached Citizens — Residents Aged 25-44Social Offerings and Openness most influence those aged 25-44 (n=3,077)
80 Copyright © 2009 Gallup, Inc. All rights reserved.
Key Attachment Drivers
Community Attachment
Economy
Openness
Emotional Wellness
Aesthetics
Social Capital
Civic Involvement
Leadership
Safety
Education
Basic Services
Social Offerings


![Shock Wave Boundary Layer Interactions in High Mach … Critical Survey of Current Numerical Prediction Capabilities Doyle D. Knight ... heat transfer [16]. Overall, therefore, the](https://img.pdfslide.us/doc/110x75/5adcb92b7f8b9a213e8be3a6/shock-wave-boundary-layer-interactions-in-high-mach-critical-survey-of-current.jpg)