Embed Size (px)
Citation preview

www.landesbioscience.com Autophagy 1327
Autophagy 10:7, 1327–1334; July 2014; © 2014 Landes Bioscience
ProtocoL ProtocoL
We detail here a protocol using tandem-tagged mCherry-EGFP-
LC3 (C-G-LC3) to quantify autophagic flux in single cells by ratiometric flow cytometry and to isolate subpopula-tions of cells based on their relative lev-els of autophagic flux. This robust and sensitive method measures autophagic flux rather than autophagosome num-ber and is an important addition to the autophagy researcher’s array of tools for measuring autophagy. Two crucial steps in this protocol are i) generate cells con-stitutively expressing C-G-LC3 with low to medium fluorescence and low fluo-rescence variability, and ii) correctly set up gates and voltage/gain on a properly equipped flow cytometer. We have used this method to measure autophagic flux in a variety of cell types and experimental systems using many different autophagy stimuli. On a sorting flow cytometer, this technique can be used to isolate cells with different levels of basal autophagic flux, or cells with variable induction of flux in response to a given stimulus for further analysis or experimentation. We have also combined quantification of autophagic flux with methods to mea-sure apoptosis and cell surface proteins, demonstrating the usefulness of this protocol in combination with other flow cytometry labels and markers.
1. Introduction
Measuring autophagy is difficult.1,2 The inadequacy of current methods for measuring autophagy is a stumbling block to advancement of the field and has been
a source of debate and lamentation by many authors.1-4 All available methods for measuring autophagy have caveats, are rarely quantitative, and are some-times subjective or susceptible to bias. Furthermore, the mechanistic complexity of the autophagic process presents mul-tiple stages, structures, and proteins that can be used to interrogate the pathway.5-7 Perhaps the most important distinction is the difference between measurement of autophagosome formation (autophagy induction) and autophagic flux—the fusion autophagosomes with lysosomes and subsequent degradation of cargo. This distinction is not trivial as the number of autophagosomes in a cell can increase, either because their formation has been stimulated or because their degradation has been inhibited. Likewise, measure-ments of autophagosome formation do not provide information about whether auto-phagy has been induced or flux has been inhibited. It is therefore critical to assess the flux through the autophagic pathway before conclusions about autophagy’s role in a particular process can be made.
Autophagic flux is most frequently assessed using MAP1LC3B/LC3 and SQSTM1/p62 western blotting with and without lysosomal protease inhibitors to block autophagic degradation. In fact, the most popular method to measure autophagy, measurement of LC3 protein lipidation by western blot, is so frequently misused that a guide to interpretation of LC3 westerns was published in this jour-nal several years ago.8 Other methods, such as visualization of LC3 puncta by microscopy and the “gold standard” of autophagosome visualization by electron
Soting cells for basal and induced autophagic flux by quantitative ratiometric flow cytometry
Jacob M Gump and Andrew Thorburn*Department of Pharmacology; University of Colorado Anschutz Medical Campus; Aurora, CO USA
Keywords: autophagy, flow cytometry, autophagic flux, GFP-LC3, cell sorting, quantification
Abbreviations: APC, allophycocyanin; C-G-LC3, mCherry-EGFP-LC3; GFP, green fluorescent protein; LC3, MAP1LC3B; SQSTM1, sequestosome-1, p62
Submitted: 01/24/2014
Revised: 05/23/2014
Accepted: 05/28/2014
Published Online: 06/05/2014
http://dx.doi.org/10.4161/auto.29394
*Correspondence to: Andrew Thorburn; Email: [email protected]

1328 Autophagy Volume 10 Issue 7
microscopy are also widely used to mea-sure autophagy.1 However, none of these methods are amenable to straightforward measurement of autophagy in individual cells and none of them can directly mea-sure flux of autophagic cargo through the autophagy pathway.9 An excellent method to measure flux is by using tandem-labeled mCherry-EGFP-LC3 (C-G-LC3) microscopy to count the number of auto-phagosomes and autolysosomes.10,11 The best techniques for high throughput, single-cell analysis of autophagy rely on microscopy and are therefore laborious and/or data intensive. The development of new, high-throughput methods for measuring autophagy is important if we are going to answer critical questions that cannot be addressed using available meth-ods. We provide here a detailed protocol for our recently published method using mCherry-EGFP-LC3 to quantify auto-phagic flux by flow cytometry and to sort subpopulations of cells based on their rela-tive levels of autophagic flux.12
Flow cytometry is a powerful tool for quantitative, single-cell analysis and can be used for ultra-high-throughput analy-sis and sorting for multiple markers of interest. Several methods have been put forth for the measurement of autophagy by flow cytometry using lysosomotropic dyes, or fluorescent LC3 or SQSTM1.13-16 However, these methods have not gained traction primarily due to low dynamic range, low sensitivity and/or low specific-ity. Of these, the method with the high-est dynamic range uses the detergent saponin to extract soluble cytoplasmic (nonlipidated) GFP-LC3, leaving behind the lipidated autophagosome-associated GFP-LC3 thereby quantifying the num-ber of autophagosomes.17 However, the saponin extraction step is not amenable to other flow cytometric methods or stain-ing protocols because it disrupts the integ-rity of the cell membrane. Furthermore, while this is a good method to measure the quantity of autophagosomes in a cell, it does not measure autophagic flux through the pathway and therefore suffers the same difficulties with interpretation that plague LC3 western blotting. We have therefore developed a method to mea-sure autophagic flux by flow cytometry and have used it to successfully sort cells
based on their relative levels of autophagic flux.12
We have adapted C-G-LC3, which is used as a reporter for autophagic flux by microscopy, for use as a ratiomet-ric flow cytometry reporter (Fig. 1A).14 The basis for the utility of C-G-LC3 as a reporter for autophagic flux lies in the higher sensitivity of EGFP fluorescence to the acidic environment of the auto-lysosome relative to mCherry:10 cells with higher flux are less green due to fusion of autophagosomes with lysosomes, which increases the mCherry/EGFP ratio in the cell. Using ratiometric flow cytometry to calculate the flux in each cell based on this ratio, we are able to not only quantify flux in individual cells but to sort cells based on their relative autophagic flux (Fig. 1B). This method has been extensively vali-dated; it reliably and accurately quantifies autophagic flux induced by multiple stim-uli and blocked by chemical and genetic inhibition of autophagy.12 This protocol provides in-depth, detailed steps to gener-ate and validate reporter cells to measure autophagic flux, identify and properly set up an adequately equipped flow cytom-eter, and use it to quantify and sort cells based on their relative levels of autophagic flux (Fig. 1B).
2. Materials
2.1 CellsMost mammalian cell lines or types
should be suitable to measure flux; many of the cells we have used in our lab are listed in Table 1. Cells should be cultured in their normal growth medium. GP2-293 cells (Clontech, 631505) are used to generate C-G-LC3 retrovirus and should be maintained in DMEM (Mediatech, 10-013-CV), supplemented with 10% fetal bovine serum (Sigma, F6178).
2.2 PlasmidsThe reporter we have used with the
greatest success is mCherry-EGFP-LC3. The order of the 2 fluorophores is likely not critical but LC3 must be at the C terminus of the fusion protein so that it can be cleaved by ATG4, lipidated, and incorporated into the phagophore mem-brane. Any protein fused to the N termi-nus of LC3 will be cleaved off by ATG4 in
order to activate LC3 for lipidation. It is also important that the green fluorescent protein be EGFP (another fluorescent pro-tein should work as long as it has a pK
a
≥ 6.0). The red fluorescent protein choice is not crucial; other RFPs should work as long as they have limited spectral over-lap with GFP and a pK
a ≤ 4.5.18 We tried
using ECFP-EGFP-LC3 to measure flux but were not successful. This is perhaps due to the higher pK
a of ECFP relative to
mCherry, lower fluorescence when excited with a 405 nm laser and/or spectral over-lap between ECFP and EGFP.
The protocol described here uses pBabe-mCherry-GFP-LC3 (Addgene, 22418) to generate C-G-LC3 retrovirus to mediate expression of the reporter. To generate C-G-LC3 retrovirus, any plas-mid expressing VSV-G envelope protein off of a CMV promoter may be used (e.g., pCMV-VSV-G, pMD2.G; Addgene, 12259).
2.3 Equipment2.3.1 Flow cytometerMeasuring autophagy flux by flow
requires a flow cytometer that can detect both EGFP and mCherry fluorescence. This requires both a blue (488 nm) laser and a yellow (~560 nm) laser. The laser lines do not necessarily need to be on separate channels, they can be co-linear as long as proper filter sets are used to sepa-rate the green and red channels.
We have successfully used several flow cytometers for measurement of auto-phagic flux including a MoFlo XDP-70 (Beckman Coulter) with a 552-nm laser for mCherry excitation on a separate laser line, a MoFlo XDP-100 (Beckman Coulter) with a 561-nm laser for mCherry excitation on a separate laser line, a Gallios (Beckman Coulter) with a co-linear 561-nm laser for mCherry excitation and an LSR-II (BD Biosciences) fitted with a 532-nm laser for mCherry excitation (all of these machines use a 488-nm laser to excite GFP). The 2 MoFlo sorters have been used extensively and successfully to sort cells with differential autophagic flux.
2.3.2 Flow cytometry softwareWhen measuring flux by flow cytom-
etry it is highly advisable to have software either during the acquisition of flow data or in the subsequent analysis that is capa-ble of handling a ratiometric calculation as

www.landesbioscience.com Autophagy 1329
a derived parameter. Namely, the quotient of the 2 fluorescence channels:
where Af is autophagic flux, F
mCherry is
mCherry fluorescence and FGFP
is GFP fluorescence. For cell sorting based on relative autophagic flux, the acquisition
software must be able to calculate Af and
sort on that derived parameter. If the sorter the user would like to use cannot sort on ratiometric parameters, other methods can be used (such as creating diagonal gates in an mCherry and GFP dot plot) to work around this limitation, but they are not optimal and may not prove useful.
The 4 machines we have used to mea-sure and sort cells on flux use software that can use a ratio of 2 parameters as a
derived parameter. The 2 XDP machines use Summit software for acquisition, the Gallios uses Kaluza and the LSR-II uses FACSDiva. We have found that on Summit it works better to use a ratio of the linear fluorescent parameters while the other 2 software platforms use log ratios.
2.3.3 Other equipmentTissue culture incubators, hoods, and
other associated apparati are necessary to culture and maintain the reporter cells.
Figure 1. mcherry-GFP-Lc3 reporter cells enable flow cytometric quantification and sorting of cells based on autophagic flux. (A) Quantification of autophagic flux by flow cytometry using reporter cells stably expressing mcherry-GFP-Lc3. Using the ratio of mcherry to GFP, autophagic flux can be easily and consistently measured in individual cells. (B) overview of protocol for sorting cells by autophagic flux. First, cells must be generated which stably express mcherry-GFP-Lc3 (c-G-Lc3). Second, individual clones (or flow sorted pools) must be characterized based on their expression of mcherry and GFP and ability to induce flux in response to an autophagic stimulus. third, cells treated with a given stimulus can be flow sorted based on their relative ratios of mcherry and GFP fluorescence into populations of high and low autophagic flux.

1330 Autophagy Volume 10 Issue 7
not all cell lines and types work equally well, primarily due to variability in the size of the cells and therefore the fluorescence. While using tandem tagged C-G-LC3 provides an internal control for the overall fluorescence of the cell, large differences in size increase the cell-to-cell variabil-ity in autophagic flux thereby decreas-ing the sensitivity and reproducibility of the assay. The best cells we have found for measuring and sorting cells for auto-phagic flux are lymphocytes, while the least sensitivity is found with MEFs and other primary cells. However, the suitabil-ity of individual cell lines and types to this method must be determined empirically. Generating several reporter cell lines that suit the needs of the particular experi-mental system could save time in the long run. We have also found that for experi-ments where the researcher wishes to see the effect of overexpression or knockdown of a gene of interest, it is crucial to make the reporter cells first, then manipulate the gene of interest rather than making several different C-G-LC3 reporter cell lines from pre-existing stable clones. The variability in expression of C-G-LC3 from clone to clone will make it difficult—or impossible—to quantitatively determine differences in flux using this method.
3.1.3 Making C-G-LC3 retrovirusGP2-293 cells are maintained in
growth medium at 37 °C in 5% CO2 at
30–80% confluence. For transfection, cells are plated in a 10-cm dish overnight such that they will be at approximately 50% to 70% confluent at the time of transfection. Cells are then transfected with Trans-IT 293 reagent according to the manufacturer’s protocol using a 1:1 ratio of pBabe-C-G-LC3 and pCMV-VSV-G. Sixteen hours following trans-fection, fresh growth medium is added to cells. Virus-containing medium is subse-quently harvested at ~24 and 48 h thereaf-ter. C-G-LC3 virus is aliquoted and stored at −80 °C. We do not filter or centrifuge the viral media as this can reduce viral titer considerably; freezing the viral media kills any remaining 293 cells, with nomi-nal reduction in titer.
3.1.4 Transduction of cell lines with C-G-LC3 retrovirus
Cells to transduce should be main-tained in growth medium and plated at
In addition, general lab equipment for the purification of plasmid DNA and other general lab reagents are also necessary. In addition, if the cells being analyzed or sorted are biohazardous, then appropriate protections should be used and any other users should be informed that dangerous materials are being used on the machine.
2.4 ChemicalsTrans-IT LT1 (Mirus, MIR2300)Polybrene (Sigma, 107689)PBS (Mediatech, 21-040-CV)ANXA5/annexinV-APC (BD
Biosciences, 550474)DAPI (Sigma, D8417)Earle’s Balanced Salt Solution (EBSS;
Sigma, E2888)
3. Methods
3.1 Generation of C-G-LC3 reporter cells (1–2 wk)
The first step of this protocol is the cre-ation of a reporter cell line stably express-ing C-G-LC3. The cells must be stably expressing C-G-LC3; transient trans-fection will yield highly variable expres-sion and will not produce usable data. Furthermore, for the highest sensitivity and consistency, stable, individual clones should be chosen, or pooled clones flow-sorted for similar expression levels and tested by flow cytometry for consistent
(low coefficient of variability) fluores-cence from cell-to-cell (Fig. 1B). Some consideration must be given to the cells to be used and how to mediate expression of the reporter. The reporter we prefer is mCherry-EGFP-LC3 expressed either off of a CMV promoter via a plasmid or off of the viral LTR in the pBABE retrovirus. Both plasmid- and retrovirus-mediated expression have given us good results, though the latter is our method of choice because the low variability in expression from retrovirus reduces the time needed to create and characterize the reporter cells.
The method to introduce the C-G-LC3 construct into your cells of interest should be determined by the researcher using the best method to mediate efficient stable gene expression in the experimental sys-tem being used. We have found retrovi-rus-mediated expression to be the fastest method for creation of stable clones and it produces the most consistent and long-last-ing expression. We have observed lost or diminished C-G-LC3 expression in many of our stable clones; the use of retrovirus to express C-G-LC3 minimizes this effect.
3.1.2 Choosing a cell lineSelection of the cells to be used as
reporters for autophagic flux is a criti-cal step in this procedure. We have suc-cessfully used many cell lines and types including HeLa, HEK293, BJAB, Jurkat, GL261, and U87MG (Table 1). However,
Table 1. cell lines used to measure autophagic flux by flow cytometry
Cells Type Expression Success
HeLa Human cervical cancer transfection ***
HEK293 Human embryonic kidney transfection **
BJAB Human B-cell lymphoma retrovirus ****
Jurkat Human t-cell leukemia retrovirus ****
GL261 Mouse glioma retrovirus *
U251 Human glioma retrovirus ***
McF10A Human mammary epithelium retrovirus ***
MEF Mouse embryonic fibroblast retrovirus *
McF7 Human breast cancer retrovirus ***
MDA-MB-231 Human breast cancer retrovirus ***
U87MG Human glioma retrovirus ***
Bt16 Human At/rt brain tumor retrovirus ***
794 Human At/rt brain tumor retrovirus **
DBtrG Human astrocytoma retrovirus **
NMc-G1 Human astrocytoma retrovirus *
AM-38 Human astrocytoma retrovirus ***

www.landesbioscience.com Autophagy 1331
~70–80% confluence in a 6-well plate. Viral media from 3.1.3 should be mixed with polybrene to obtain a final concen-tration on the cells of 8 ng/mL. After aspirating the growth medium from the cells, replace 1 mL of fresh growth medium and add 1 mL of C-G-LC3 viral medium. More or less viral medium may be used based on the viral titer and susceptibility of the cells to retroviral transduction and should be determined empirically. Cells can be treated from 2 h to overnight with C-G-LC3 retrovirus whereupon they should be fed and split accordingly.
3.2 Reporter cell characterization (1–2 wk)
3.2.1 Confirmation of C-G-LC3 expression
Following retroviral transduction, GFP and mCherry expression are tested by flu-orescence microscopy at 48 h post-trans-duction. Many cell lines will only express low levels of C-G-LC3 and the expression may be nearly undetectable via the naked eye on an epifluorescence microscope—this does not mean the cells are not going to work for measuring flux by flow cytometry; the most effective cell line and clone we have used has nearly undetect-able C-G-LC3 expression by the naked eye. If expression is hard to detect, a long exposure time on an epifluorescent cam-era setup or flow cytometry (using proper negative and positive controls—the same cells expressing GFP and mCherry sepa-rately and without any fluorescent protein expression) should be used to confirm expression. Cells should then be placed in selection media [growth medium + puro-mycin (~1 μg/mL, determined empiri-cally)] and selected for 48–72 h before sorting or dilutional cloning.
3.2.2 Sorting/clonal selectionFollowing selection, cells should either
be cloned by limiting dilution for single-positive clones or flow sorted for mCherry and GFP double-positive cells. These clones or sorted +/+ pools should then be grown up and tested for their ability to measure flux. Again, having the proper positive (EBSS-treated) and negative (untreated) controls is critical to validat-ing each clone or pool.
Limiting dilution clones can be plated one cell per well into a 96-well plate to
obtain single-cell clones. This method has proven successful in our lab, but we have found that many clones must be tested for their ability to measure flux in the dynamic range necessary to robustly dis-tinguish between signal and noise. Each clone must first be tested for expression of mCherry and GFP (by either microscopy or flow) then tested for proper response to autophagic stimuli by flow cytometry. If there is any question about the expres-sion of mCherry or GFP, positive control cells expressing each separately can be invaluable.
Flow sorting for pools of double-pos-itive cells has yielded excellent results and avoids potential problems with using clonal populations that may have other alterations introduced or perpetuated by the cloning and selection process. Following puromycin selection, we flow sort mCherry and GFP double-positive cells using small gates. Generally, we will sort out 2 populations, a high-expression population and a medium-expression population. Then each population is expanded and tested for autophagy flux quantification.
3.2.3 Validation of clones or sorted poolsAfter confirming expression of
mCherry and GFP in each clone they must then be tested for the ability to quan-tify flux induction. The stimulus used to induce flux depends on the experimental system, but in our experience, starvation is the most potent autophagy stimulus. After starving cells for a period of time (using several time points from 0.5–6 h is most informative) known to induce autophagy in the cells, they are transferred to a flow cytometry buffer and placed on ice for flow. We use regular growth media with serum (specific to the cells being used) as the flow buffer to avoid inducing flux, which can occur when using typical PBS-BSA flow buffers, but it should not matter if the cells are kept on ice. It should also be noted that removing adherent cells with trypsin and/or EDTA can cause changes in autophagic flux and should be done as quickly as possible; control and treated cells should be subjected to non-treatment buffers/media for the same period of time. Next, using a properly set up flow cytom-eter (3.3.1), treated cells are assessed for their ability to measure flux. A good clone
or pool will look like Figure 2A; untreated cells will show a tight peak by the mCherry/GFP ratiometric parameter with the peak spreading further to the right depending on the potency of the stimulus. The mCherry-GFP dot plot should show a downward shift in the GFP signal with little to no movement in the mCherry signal. The best performing clones (high dynamic range) are sometimes difficult to keep on scale at the time point with the greatest change in signal.
3.3 Quantification and sorting cells by autophagic flux (4–6 h)
As stated above, sorting for auto-phagic flux requires a flow cytometer with software capable of ratiometric cal-culation of derived parameters and the ability to sort on such a parameter. Post processing of data will allow the quanti-fication of flux from a cytometer without ratiometric capability but there are dif-ficulties with keeping the data on scale and if the voltages during acquisition are not set correctly (this is determined empirically) then data can be unusable unless the analysis software is capable of higher order mathematical parameters. Cells (preferably the same cell line) that express GFP and mCherry separately can greatly enhance your ability to trouble-shoot. These are especially important if the cytometer you are using has the GFP and mCherry channels on the same laser line so that compensation can be set up correctly. An important limitation of this technique (this is true of any flow cytom-etry technique) is that it provides only a relative measure of flux, i.e., induced flux vs. control. These differences cannot be standardized nor can they be compared between different cell lines or from differ-ent experiments. Another limitation of the method is that it does not accurately mea-sure reductions in flux below basal levels. It is very good for measuring induction of flux over basal and any inhibition of that induced flux can also be detected. Most cells have modest basal flux, and reduc-tions from there can only be detected by observing the long-term increase in both GFP and mCherry fluorescence. This method relies on the reduction in GFP fluorescence when there is an increase in flux; however, when flux is inhibited GFP only increases modestly.

1332 Autophagy Volume 10 Issue 7
Figure 2. For figure legend, see page 1333.
www.landesbioscience.com Autophagy 1333
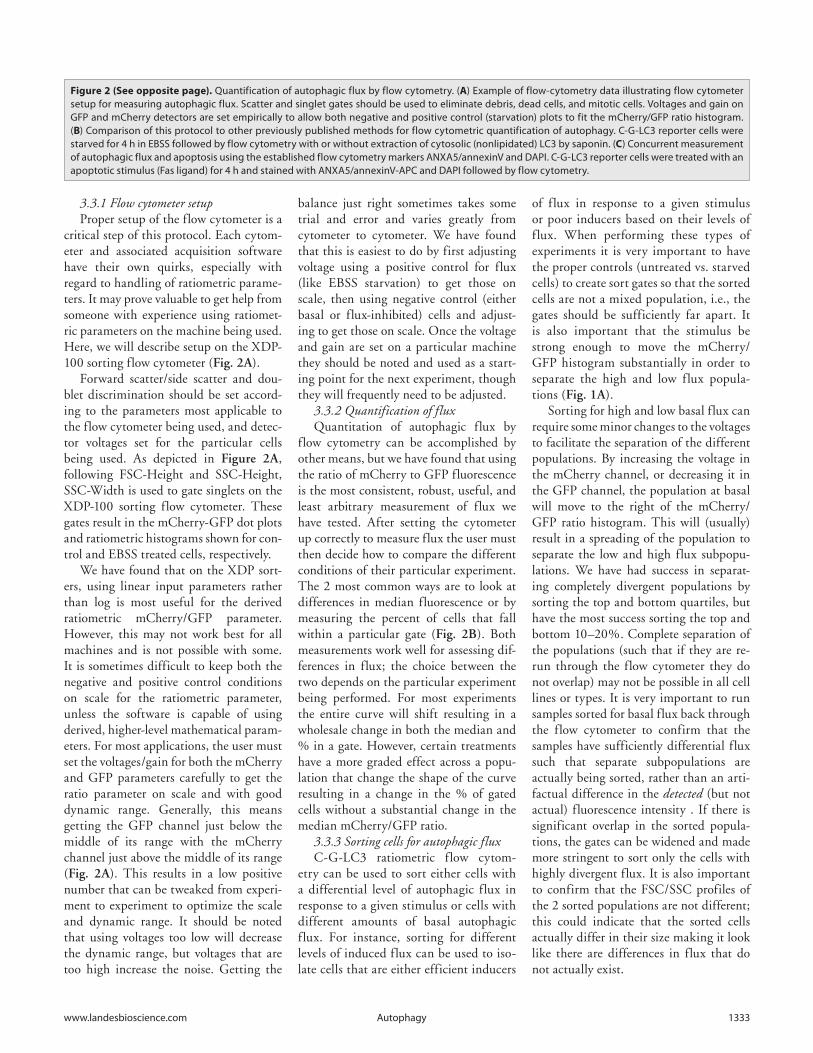
3.3.1 Flow cytometer setupProper setup of the flow cytometer is a
critical step of this protocol. Each cytom-eter and associated acquisition software have their own quirks, especially with regard to handling of ratiometric parame-ters. It may prove valuable to get help from someone with experience using ratiomet-ric parameters on the machine being used. Here, we will describe setup on the XDP-100 sorting flow cytometer (Fig. 2A).
Forward scatter/side scatter and dou-blet discrimination should be set accord-ing to the parameters most applicable to the flow cytometer being used, and detec-tor voltages set for the particular cells being used. As depicted in Figure 2A, following FSC-Height and SSC-Height, SSC-Width is used to gate singlets on the XDP-100 sorting flow cytometer. These gates result in the mCherry-GFP dot plots and ratiometric histograms shown for con-trol and EBSS treated cells, respectively.
We have found that on the XDP sort-ers, using linear input parameters rather than log is most useful for the derived ratiometric mCherry/GFP parameter. However, this may not work best for all machines and is not possible with some. It is sometimes difficult to keep both the negative and positive control conditions on scale for the ratiometric parameter, unless the software is capable of using derived, higher-level mathematical param-eters. For most applications, the user must set the voltages/gain for both the mCherry and GFP parameters carefully to get the ratio parameter on scale and with good dynamic range. Generally, this means getting the GFP channel just below the middle of its range with the mCherry channel just above the middle of its range (Fig. 2A). This results in a low positive number that can be tweaked from experi-ment to experiment to optimize the scale and dynamic range. It should be noted that using voltages too low will decrease the dynamic range, but voltages that are too high increase the noise. Getting the
balance just right sometimes takes some trial and error and varies greatly from cytometer to cytometer. We have found that this is easiest to do by first adjusting voltage using a positive control for flux (like EBSS starvation) to get those on scale, then using negative control (either basal or flux-inhibited) cells and adjust-ing to get those on scale. Once the voltage and gain are set on a particular machine they should be noted and used as a start-ing point for the next experiment, though they will frequently need to be adjusted.
3.3.2 Quantification of fluxQuantitation of autophagic flux by
flow cytometry can be accomplished by other means, but we have found that using the ratio of mCherry to GFP fluorescence is the most consistent, robust, useful, and least arbitrary measurement of flux we have tested. After setting the cytometer up correctly to measure flux the user must then decide how to compare the different conditions of their particular experiment. The 2 most common ways are to look at differences in median fluorescence or by measuring the percent of cells that fall within a particular gate (Fig. 2B). Both measurements work well for assessing dif-ferences in flux; the choice between the two depends on the particular experiment being performed. For most experiments the entire curve will shift resulting in a wholesale change in both the median and % in a gate. However, certain treatments have a more graded effect across a popu-lation that change the shape of the curve resulting in a change in the % of gated cells without a substantial change in the median mCherry/GFP ratio.
3.3.3 Sorting cells for autophagic fluxC-G-LC3 ratiometric f low cytom-
etry can be used to sort either cells with a differential level of autophagic flux in response to a given stimulus or cells with different amounts of basal autophagic flux. For instance, sorting for different levels of induced flux can be used to iso-late cells that are either efficient inducers
of f lux in response to a given stimulus or poor inducers based on their levels of f lux. When performing these types of experiments it is very important to have the proper controls (untreated vs. starved cells) to create sort gates so that the sorted cells are not a mixed population, i.e., the gates should be sufficiently far apart. It is also important that the stimulus be strong enough to move the mCherry/GFP histogram substantially in order to separate the high and low flux popula-tions (Fig. 1A).
Sorting for high and low basal flux can require some minor changes to the voltages to facilitate the separation of the different populations. By increasing the voltage in the mCherry channel, or decreasing it in the GFP channel, the population at basal will move to the right of the mCherry/GFP ratio histogram. This will (usually) result in a spreading of the population to separate the low and high flux subpopu-lations. We have had success in separat-ing completely divergent populations by sorting the top and bottom quartiles, but have the most success sorting the top and bottom 10–20%. Complete separation of the populations (such that if they are re-run through the flow cytometer they do not overlap) may not be possible in all cell lines or types. It is very important to run samples sorted for basal flux back through the flow cytometer to confirm that the samples have sufficiently differential flux such that separate subpopulations are actually being sorted, rather than an arti-factual difference in the detected (but not actual) fluorescence intensity . If there is significant overlap in the sorted popula-tions, the gates can be widened and made more stringent to sort only the cells with highly divergent flux. It is also important to confirm that the FSC/SSC profiles of the 2 sorted populations are not different; this could indicate that the sorted cells actually differ in their size making it look like there are differences in flux that do not actually exist.
Figure 2 (See opposite page). Quantification of autophagic flux by flow cytometry. (A) Example of flow-cytometry data illustrating flow cytometer setup for measuring autophagic flux. Scatter and singlet gates should be used to eliminate debris, dead cells, and mitotic cells. Voltages and gain on GFP and mcherry detectors are set empirically to allow both negative and positive control (starvation) plots to fit the mcherry/GFP ratio histogram. (B) comparison of this protocol to other previously published methods for flow cytometric quantification of autophagy. c-G-Lc3 reporter cells were starved for 4 h in EBSS followed by flow cytometry with or without extraction of cytosolic (nonlipidated) Lc3 by saponin. (C) concurrent measurement of autophagic flux and apoptosis using the established flow cytometry markers ANXA5/annexinV and DAPI. c-G-Lc3 reporter cells were treated with an apoptotic stimulus (Fas ligand) for 4 h and stained with ANXA5/annexinV-APc and DAPI followed by flow cytometry.

1334 Autophagy Volume 10 Issue 7
Sorted cells can then be used in what-ever experiments the user desires. It should be noted that differences in flux can change quickly (on the order of min-utes to hours) and the buffer used to sort the cells into should be chosen such that it does not alter the flux during the time the cells are being sorted or thereafter. Furthermore, there should be sufficient volume such that the sheath buffer from the cytometer does not dilute the sample substantially. We sort the cells into growth medium on ice, so that changes in flux are minimal while the cells are sorted, then quickly transfer them into the experimen-tal system.
4. Results and Discussion
The availability of an accurate and robust flow cytometry marker for auto-phagic flux represents a powerful tool for both the measurement and sorting of cells based on autophagy. While the use of a genetically encoded reporter limits the use of the method to engineered cell lines,
mCherry-GFP-LC3 is substantially better than other methods that we have tried to measure autophagy by flow cytometry. Our recent publication pioneered the quantification of autophagic flux by ratio-metric flow cytometry using mCherry-GFP-LC3 and exhaustively validated that the methodology can be used to not only measure autophagic flux but to sort cells based on differential basal autophagic flux12 and consequently to test if differ-ences in autophagy affect responses upon exposure to other agents—in our case high and low autophagic flux determined the likelihood of cells dying in response to activation of death receptor induced apoptosis. In addition, we successfully combined quantification of autophagic flux with previously established methods for measuring apoptosis in live cells (using ANXA5/annexin-V-APC and DAPI; Fig. 2C) and cell surface markers (anti-PTPN13/CD95-APC).12 The capability to sort cells based on both autophagic flux and other flow cytometry markers makes this method particularly adaptable to the study of autophagy in stem cell research.
Furthermore, quantification and sort-ing cells based on autophagic flux can be adapted for high-throughput functional genomics screening, drug screening, and other flow-cytometry based screen-ing platforms. So, until a flow cytom-etry reagent is devised that can quantify autophagic flux in cells without a genetic reporter, this may be the best method available.
Disclosure of Potential Conflicts of Interest
The authors report no potential con-flicts of interest.
Acknowledgments
We are grateful to K Helm, L Acosta and C Childs of the University of Colorado Cancer Center Flow Cytometry Core for their invaluable guidance and assistance. This work was supported by National Institutes of Health grants R01 CA111421 and CA150925 (AT) and Shared Resources supported by P30 CA46934. JMG was previously supported by 5T32 CA82086-10 (UCAMC Department of Pediatrics) and the American Cancer Society.
References1. Klionsky DJ, Abdalla FC, Abeliovich H, Abraham
RT, Acevedo-Arozena A, Adeli K, Agholme L, Agnello M, Agostinis P, Aguirre-Ghiso JA, et al. Guidelines for the use and interpretation of assays for monitoring autophagy. Autophagy 2012; 8:445-544; PMID:22966490; http://dx.doi.org/10.4161/auto.19496
2. Mizushima N, Yoshimori T, Levine B. Methods in mammalian autophagy research. Cell 2010; 140:313-26; PMID:20144757; http://dx.doi.org/10.1016/j.cell.2010.01.028
3. Thorburn A. I think autophagy controls the death of my cells: what do I do to get my paper published? Autophagy 2011; 7:455-6; PMID:21270514; http://dx.doi.org/10.4161/auto.7.5.14797
4. Rubinsztein DC, Cuervo AM, Ravikumar B, Sarkar S, Korolchuk V, Kaushik S, Klionsky DJ. In search of an “autophagomometer”. Autophagy 2009; 5:585-9; PMID:19411822; http://dx.doi.org/10.4161/auto.5.5.8823
5. Mizushima N, Levine B, Cuervo AM, Klionsky DJ. Autophagy fights disease through cellular self-diges-tion. Nature 2008; 451:1069-75; PMID:18305538; http://dx.doi.org/10.1038/nature06639
6. Mizushima N. Autophagy: process and function. Genes Dev 2007; 21:2861-73; PMID:18006683; http://dx.doi.org/10.1101/gad.1599207
7. Gump JM, Thorburn A. Autophagy and apop-tosis: what is the connection? Trends Cell Biol 2011; 21:387-92; PMID:21561772; http://dx.doi.org/10.1016/j.tcb.2011.03.007
8. Mizushima N, Yoshimori T. How to interpret LC3 immunoblotting. Autophagy 2007; 3:542-5; PMID:17611390
9. Farkas T, Høyer-Hansen M, Jäättelä M. Identification of novel autophagy regulators by a luciferase-based assay for the kinetics of autophagic f lux. Autophagy 2009; 5:1018-25; PMID:19652534; http://dx.doi.org/10.4161/auto.5.7.9443
10. Kimura S, Noda T, Yoshimori T. Dissection of the autophagosome maturation process by a novel reporter protein, tandem fluorescent-tagged LC3. Autophagy 2007; 3:452-60; PMID:17534139
11. Zhou C, Zhong W, Zhou J, Sheng F, Fang Z, Wei Y, Chen Y, Deng X, Xia B, Lin J. Monitoring autophagic f lux by an improved tandem fluorescent-tagged LC3 (mTagRFP-mWasabi-LC3) reveals that high-dose rapamycin impairs autophagic f lux in cancer cells. Autophagy 2012; 8:1215-26; PMID:22647982; http://dx.doi.org/10.4161/auto.20284
12. Gump JM, Staskiewicz L, Morgan MJ, Bamberg A, Riches DW, Thorburn A. Autophagy variation within a cell population determines cell fate through selec-tive degradation of Fap-1. Nat Cell Biol 2014; 16:47-54; PMID:24316673; http://dx.doi.org/10.1038/ncb2886
13. Larsen KB, Lamark T, Øvervatn A, Harneshaug I, Johansen T, Bjørkøy G. A reporter cell system to mon-itor autophagy based on p62/SQSTM1. Autophagy 2010; 6:784-93; PMID:20574168; http://dx.doi.org/10.4161/auto.6.6.12510
14. Hundeshagen P, Hamacher-Brady A, Eils R, Brady NR. Concurrent detection of autolysosome forma-tion and lysosomal degradation by flow cytometry in a high-content screen for inducers of autophagy. BMC Biol 2011; 9:38; PMID:21635740; http://dx.doi.org/10.1186/1741-7007-9-38
15. Shvets E, Elazar Z. Flow cytometric analysis of auto-phagy in living mammalian cells. Methods Enzymol 2009; 452:131-41; PMID:19200880; http://dx.doi.org/10.1016/S0076-6879(08)03609-4
16. Shvets E, Fass E, Elazar Z. Utilizing flow cytometry to monitor autophagy in living mammalian cells. Autophagy 2008; 4:621-8; PMID:18376137
17. Eng KE, Panas MD, Karlsson Hedestam GB, McInerney GM. A novel quantitative f low cytometry-based assay for autophagy. Autophagy 2010; 6:634-41; PMID:20458170; http://dx.doi.org/10.4161/auto.6.5.12112
18. Shaner NC, Steinbach PA, Tsien RY. A guide to choosing fluorescent proteins. Nat Methods 2005; 2:905-9; PMID:16299475; http://dx.doi.org/10.1038/nmeth819