Embed Size (px)
Citation preview

SOS NASHVILLE 1999MEASUREMENT PLAN
May 1999

1
TABLE OF CONTENTS
STUDY THEMES . . . . . . . . . . . . . . . . . . . . . . . . . . . . . . . . . . . . . 2
INSTRUMENTED AIRCRAFT . . . . . . . . . . . . . . . . . . . . . . . . . . . . . . . . . . 4
GROUND-BASED MEASUREMENT NETWORK . . . . . . . . . . . . . . . . . . 11

SOS 1999 Measurement Plan
2
STUDY THEMES
The field campaign planned for the summer of 1999 is intended to provide a betterunderstanding of the basic chemical, meteorological, and transport processes thatdetermine ozone and fine particle distributions and new information to assist policy-makers in devising optimal ozone and PM management strategies. These studies areencompassed in three broad themes.
Local vs. Regional Ð Regional Contrasts
The first area of investigation addresses whether ozone or fine particle pollution is aregional or a local problem. The range provided by the WP-3D and the G-1 allows thecomposition of the atmosphere in a particular location to be placed in a regionalperspective. Even though the concentration of ozone and fine particles can be elevatedover large areas, it is still an open question how much of either ozone or fine particles areproduced locally and how much are produced remotely and then transported to aparticular locale.
Although the study will be centered in the Nashville/Middle Tennessee area flights areplanned for the Upper Midwest where meteorological conditions and the mix of ozoneand PM-precursor emissions are expected to be significantly different than in theSoutheast. These measurements will build on previous NOAA studies in Colorado andthe Midwest and the recent BNL study in Phoenix.
Ozone and PM formation in Plumes
The second area of investigation relates to if and how ozone or fine particles observed ina particular location can be attributed to a particular source of precursor compoundslocated among a complex matrix of precursor sources. An ideal setting to address thisquestion is an isolated urban area set in a rural background with several large pointsources of pollution (e.g., fossil fuel burning power plants) imbedded at various distanceswith a wide range of pollutant emission. Under certain general flow conditions theplumes of the power plants merge with each other and/or the urban plume; in others theydonÕt. Hence, the synergism associated with the interaction of power plants plumes,urban plumes, and the regional background can be investigated under a variety ofconditions and in various combinations. As the dimensions of the urban complex growsthe magnitude of the problem becomes greater. A second aspect of interaction involvesthe relation of ozone pollution to fine particle pollution. To date, ozone pollution hasbeen largely treated as a local or sub-regional problem, while fine particle pollution hasbeen viewed as a local problem from the health-effects perspective and a regionalproblem from the visibility perspective. The co-variation of these pollutants has neverbeen extensively investigated, particularly on the regional scale.

SOS 1999 Measurement Plan
3
The study of the evolution of the pollutant mix in plumes is particularly useful in thedetermination of pollution formation kinetics. The advection of plumes into a reasonablyuniform background airmass provides a convenient ÒclockÓ allowing the quantification ofthe chemical rates that are critical to model development and evaluation.
Diurnal Cycle in Chemistry and Meteorology
In the overwhelming majority of cases, intensive field studies have targeted the study ofdaytime chemistry and dynamics. This interest is driven by a recognition of theimportant role that photochemistry plays in secondary pollutant formation and a concernfor the impacts associated with daytime pollution exposures for both humans and plants.The pollutant mix can be significantly affected by non-photochemical reactions thatoccur at night. The results of the 1995 SOS field study in Nashville highlighted theimportance of nighttime mixing processes in the redistribution of pollution throughoutthe region.
This field study offers the opportunity to document the entire diurnal cycle of chemistryand meteorology over one or more complete consecutive diurnal cycles using bothsurface-based and airborne observations. Information will be developed on processesthat are not well described in current models. The measurements will help us understandhow rural daytime chemistry, which establishes the residual convective mixed layerabove the nocturnal boundary layer, ultimately is coupled to the daytime urbanphotochemistry that establishes peak ozone and PM levels in urban areas. Similarly, wewill learn how daytime urban pollution affects rural air quality on the following day.
A comprehensive measurement program has been developed to address the scienceobjectives imbedded in the study themes described above. The final measurementprogram reflects the work of the various planning teams over the past year. What followsis a detailed description of the measurement assets that will be deployed along with adescription of the measurement strategy that is planned.

SOS 1999 Measurement Plan
4
INSTRUMENTED AIRCRAFT
The four heavily instrumented aircraft participating in the study will be used tocharacterize the three-dimensional distribution of pollutants and track the transformationand removal of these pollutants over time. The four aircraft have widely varyingcapabilities. Three of the aircraft (NOAA WP-3D, DOE G-1, and TVA Bell 205) willmake in situ measurements mainly in the atmospheric boundary layer; the fourth (NOAACASA 212) will make remote-sensing measurements from above the boundary layer.The NOAA WP-3D and the DOE G-1 have sufficient range and endurance to surveylarge areas. This provides the opportunity to contrast the pollutant mix and meteorologyin vicinity of Nashville to that of the Midwestern U.S. The TVA Bell 205 helicopter willbe used to obtain detailed chemistry measurements over the urban area and in powerplant plumes. The NOAA CASA 212 is equipped with instrumentation to remotelysense ozone, aerosols and surface temperature. The aircraft participating in the study arelisted below along with the affiliations of the groups providing the aircraft and adescription of the installed instrumentation.
CASA 212-200: Private vendor /NOAA Environmental Technology Laboratory
Endurance: 4.5 hrCeiling: 3.5 kmPayload: <2700 kgResearch Speed: 65-100 m/s
Table 1. Aircraft Instrument Package for the NOAA CASA 212-200
Parameter TimeResolution
VerticalResolution
Method Det. Limit
Ozone 3-8 s 90 m DIAL Lidar 4-10 ppbAerosol Backscatter 3-8 s 15 m DIAL Lidar 5 x 10⁻⁶ m-1sr-1
Surface Temp. 1 s NA IR Radiometer 0.2 oC

SOS 1999 Measurement Plan
5
Lockheed WP-3D Orion: NOAA Aircraft Operations Center / NOAA Aeronomy Laboratory
Endurance: 10 hrCeiling: 7.6 kmPayload: >2700 kgResearch Speed: 100-150 m/s
Table 2. Aircraft Instrument Package for the NOAA WP-3D Orion
Parameter Time Resolution Method Det. LimitOzone (O3) 10 s UV Absorption 1 ppbFast O3 (FO3) 1 s NO/O3 Chemiluminescence 0.2 ppbFast CO (FCO) 1 s VUV Resonance Fluorescence 25 ppbCarbon Dioxide (CO2) ≤ 1 s NDIR 0.2 ppmSulfur Dioxide (SO2) 2 s UV Pulsed Fluorescence 1 ppbNitric Oxide (NO) 1 s NO/O3 Chemiluminescence 30 pptNitrogen Dioxide (NO2) 3 s Photolysis, NO/O3 Chem. 100 pptTotal Nitrogen Oxides (NOy) 1 s Au Converter, NO/O3 Chem. 50 pptPAN 1 s / every 6 min Dir. Injection, GC/ECD < 5 pptPPN 1 s / every 6 min Dir. Injection, GC/ECD < 5 pptMPAN 1 s /every 6 min Dir. Injection, GC/ECD < 5 pptNitric Acid (HNO3) 1 s C I Mass Spectrometry 10 pptNH3 5 s C I Mass Spectrometry 50 pptIn-situ VOCs 1 min./every 15 min Cryo Collection, GC/FID < 10 pptCanister VOCs <1 min. Canister Sampling, GC/MS < 10 pptCH2O Liquid ChromatographyPeroxides (incl. H2O2) 1 min Dual Enzymatic / Fluorimeter 30 pptAerosol size distribution 1 s NMASS 5 - 90 nmAerosol size distribution 1 s ERAST 70 - 1000 nmTotal Radiation 1 s Eppley Pyranometers - Zenith & Nadir 0.28 Ð 2.8 µUV Radiation ~10 s Spectral Radiometer - Zenith & Nadir 295- 480 nmVisible Radiation Visible Absorption Spectrometer 420 Ð 700 nmWater Vapor (H2O) 1 s Lyman Alpha AbsorptionAir Temperature 1 s Platinum ThermistorDewpoint/Frostpoint ≤ 3 s Chilled MirrorWind Speed 1 s Derived from INEWind Direction 1 s Derived from INEAltitude 1 s BarometricPosition 1 s GPS, INEAir Speed 1 s BarometricBiometer 3-wavelength IR AbsorptionAtmospheric Reflectivity C & X Band Radars

SOS 1999 Measurement Plan
6
Grumman G1: DOE Pacific Northwest National Laboratory
Endurance: 6 hrsCeiling: 3.5 kmPayload: 1300 kgResearch Speed: 100 m/s
Table 3. Aircraft Instrument Package for the DOE Grumman G-1
Parameter Time Resolution Method Det. Limit
Ozone (O3) 10 s UV Absorption 25 ppbCarbon Monoxide (CO) 20 s NDIR 20-25 ppbFast CO (FCO) 5 s VUV Resonance Fluorescence 5 ppbSulfur Dioxide (SO2) 2 s UV Pulsed Fluorescence 200-300 pptNitric Oxide (NO) <10 s NO/O3 Chemiluminescence 20 pptNitrogen Dioxide (NO2) <10 s Photolysis NO/O3 Chem. 50 pptNitrogen Dioxide (optional) <10 s Luminol Chemiluminescence 0.015 ppbvTotal Nitrogen Oxides (NOy) <10 s Mo Converter. NO/O3 Chem. 300-400 pptPAN 1 sample/7 min Cyrogenic GC 15 pptCH2O (optional) Continuous (1min delay) Fluorescence 100 pptPAN 4 s Tandem Mass Spectrometry 400 pptHNO2 4 s Tandem Mass Spectrometry 400 pptHNO3 4 s Tandem Mass Spectrometry 400 pptNH3 (optional) 4 s Tandem Mass Spectrometry ~2 ppbFormic/Acid acids (optional) 4 s Tandem Mass Spectrometry 100 pptCanister VOCs Canister Sampling, GC/FID 0.1 ppbvbscat 1 s Nephelometer 0-103/MmAerosol size distribution 1 s PCASP (0.17 - 3µm)Aerosol size distribution 1 s FSSP (2 Ð 47 µm)Particle Number 1 s CNC (two) (>7 nm, >3 nm)UV Radiation 1 s Eppley Pyranometer (295-385 nm)Short-wave Irradiance 1 s Eppley PSP (285-2800 nm)Long-wave Irradiance 1 s Eppley PIR (4-50 microns)Water Vapor (H2O) 1 s Lyman Alpha Absorption ±0.1 g m-3(est.)Air Temperature 1 s Platinum Resistance ±0.5 oCDewpoint/Frostpoint 1 s Chilled Mirror D.P. ±0.2 oC, F.P. ±0.4 oC
Wind Components (u-,v-,w-) 1 s Gust Probe <0.5 m s-1
Altitude 1 s Barometric <1mbPosition 1 s GPS <3mAir Speed 0.1 s Barometric <20 cm s-1

SOS 1999 Measurement Plan
7
Bell 205 Helicopter: TVA Environmental Research Center
Endurance: 2 hrCeiling: 2.5 kmPayload: 500 kgResearch Speed: 40-50 m/s
Table 4. Aircraft Instrument Package for the TVA Bell 205 helicopter
Parameter Time Resolution Method Det. LimitOzone (O3) 1 s NO Chemiluminescence 2 ppbCarbon Monoxide (CO) NDIR or HgO reductionSulfur Dioxide (SO2) 5 s UV Pulsed Fluorescence 0.5 ppbNitric Oxide (NO) 1 s NO/O3 Chemiluminescence 1 ppbNitrogen Dioxide (NO2) 5 s Photolysis, NO/O3 Chem. 1 ppbTotal Nitrogen Oxides (NOy) 1 s Au Converter, NO/O3 Chem. 1 ppbNOy* 1 s NOy detection + Nylasorb Filter 1 ppbCanister VOCs 1 min Canister Sampling, GC/FIDbscat 5 s Nephelometer <10-6 m-1
Aerosol Size Distribution 1 s PCASP (0.17 - 3µm)Particle Composition variable Filter Pack, IC analysisParticle Composition by Size variable Anderson Cascade ImpactorAir Temperature 5 s Platinum ThermistorDewpoint 5 s Capacitance SensorAltitude 5 s BarometricPosition 5 s GPSAir Speed 5 s Pitot- Static Pressure 2 m/sHeading 5 s Flux Gate Compass 0.5 deg.
The use of these aircraft will be carefully coordinated to take the maximum advantage oftheir diverse capabilities and the flight time available. The planned flights fall into thefollowing categories:
Intercomparison Flights
The use of four aircraft and the diversity of the instrumentation flown on these platformsmake a thorough intercomparison of the various instruments/measurements mandatory.These intercomparisons are especially important since the aircraft resources will be usedin a complementary manner. We envision staggered deployment of some platforms(either on the same day and/or by flying alternating platforms on consecutive days) inorder to extend the time coverage of the measurements. The planned intercomparisons

SOS 1999 Measurement Plan
8
will enhance the value of the accumulated data sets and assure the compatibility of thedata collected on the various platforms.
The intercomparison flights will be held as early as possible during the study aspossible bearing in mind that the NOAA WP3 may be delayed. The intercomparisonbetween the WP3 and DOE G1 will be held as soon as the WP3 arrives in Nashville. Theintercomparison of instruments will follow the protocol that has been determined by theintercomparison committee for each of the measurement families (i.e., NOy species,NMHCs, aerosols, etc.). The investigators are requested to report the data for theirinstruments within 48 hours following these flights. The data will be put into a commonformat and correlation plots made. The principle investigators will be shown this data.The results of the preliminary data evaluation will be reported to a Science Meeting to beheld the following day (72 hours after the intercomparison flight). This meeting willdiscuss the quality of the agreement, determine if additional intercomparisons are neededand discuss when and how the additional comparison flights are to be carried out.
In discussing the intercomparisons, it was noted that for the most part,intercomparison with the ground site would be the purview of the helicopter. Theoverlap between the fixed wing aircraft and the ground would not be sufficientconstrained to be useful. There were three exceptions noted to this:• The comparison between ozone and aerosol measurements and those made by the
ground based NOAA ETL lidar would be very valuable in testing the lidarmeasurements.
• The comparison between ozone and aerosol measurements made by the airborneNOAA ETL lidar and the measurements made at the surface by the NOAA ground-based lidar and the in-situ instruments would be very valuable in testing the airbornelidar measurements.
• The comparison between the DOAS measurement of NO2, O3, SO2, and HONO withthe simultaneous aircraft measurements and the ground-based measurements of thosequantities would be extremely helpful.
Regional Flights
Flights are planned for the NOAA WP3 into the Upper Midwest and the Gulf Coast. Themeasurements performed on these flights will provide a significant contrast to thoseperformed in the Nashville/Middle Tennessee area. In particular, the lower biogenicVOC emissions and higher sulfur emissions that characterize the Midwestern U.S.provide a departure from conditions in Tennessee with anticipated impacts on ozone andPM formation.
The CASA lidar aircraft will perform a number of flights to document variability in thedepth of the mixed layer and its relationship to land use.

SOS 1999 Measurement Plan
9
Urban Studies
With the development of a comprehensive suite of measurements at the Cornelia Fortground site to investigate the photochemical processes responsible for the formation ofozone and fine particles, the use of aircraft to augment these ground measurements wasdiscussed. The TVA helicopter and the NOAA Casa 212 were identified as particularlyvaluable additions to the ground studies. Profiles for the helicopter and transect flightplans for the Casa have been developed. The helicopter would be particularly used inproviding data to characterize the rise of the PBL through the morning. The limitation offlight hours for the helicopter is a problem.
Diurnal Plume Studies
It is recognized that improved understanding of atmospheric processes requiressignificant new information concerning the chemistry and transport that influence ozoneand fine-particle precursors throughout the diurnal cycle. The DOE G1 has beencommitted to investigating plume processing during the night. The NOAA WP3 andCASA 212 will compliment the G1 measurements in the following ways. The WP3 willfocus its flights principally during the day. However, some of the flights will commencein the late after noon and follow the plumes into the night. In addition, a limited numberof WP3 flights will commence in the early morning during the breakup of the nocturnalboundary layer in order to investigate the transition from night to day. The CASA willundertake to identify the location of the plumes during the late afternoon andoccasionally at night to allow the other aircraft to find the plumes more readily. Theplanning group felt that the point-source plumes from power plants would be most easilyfound and tracked for a significant fraction of the diurnal cycle. By contrast, urbanplumes may prove to be too dispersed to follow successfully during the nighttime hours.
Weather forecasts will be provided by the University of Northern Alabama. These willgive indication of the meteorological condition most conducive for the plumeinvestigations. In addition, was-casts will be made by UNA from the profiler networkdata and provided to the aircraft to allow aircraft to more easily predict the plume pathbetween transects.
Table 5. Planned allocation of aircraft flight time.
Aircraft Total hrs. Intercomparison Diurnal Urban RegionalCASA 64 4 20* 26 14WP-3 100 4 37 20** 39G-1 50 3 35 12 0Bell 205 40 2 29* 9 0*Primarily power plant plume studies** Includes midday flights in Nashville and measurements in the Atlanta plume

SOS 1999 Measurement Plan
10
Flight Planning
The nominal schedule for the aircraft follows a pattern of flights every other day. Basedon this pattern flight planning is done on the following schedule.
1. No-fly daysA meeting of the principle investigators for each flight will be held at 8:00AM CDT onthe no-fly days. The principle objectives of the meetings on no-fly days is to review thefinding from the preceding flight and initial planning of next flights. The scienceobjectives of the next flights and the possible coordination of aircraft will be determinedbased on long-range forecasts and measurement needs as identified at this meeting.Instrument and/or aircraft problems that may impact the upcoming missions will bediscussed.
Flight plans for flights must be filled with the FAA in Nashville before 4:00PM CDT onthe day preceding a planned flight.
2. Flight daysA meeting of the principle investigators for each flight will be held at 7:00AM CDT onflight days. The principle objectives of the meetings on no-fly days are to review theflight plans determined on the preceding day. The science objectives of the flights andthe possible coordination of aircraft will be finalized based on now-casts andinstrument/aircraft readiness.
SOS 1999 Measurement Plan
11
GROUND-BASED MEASUREMENT NETWORK
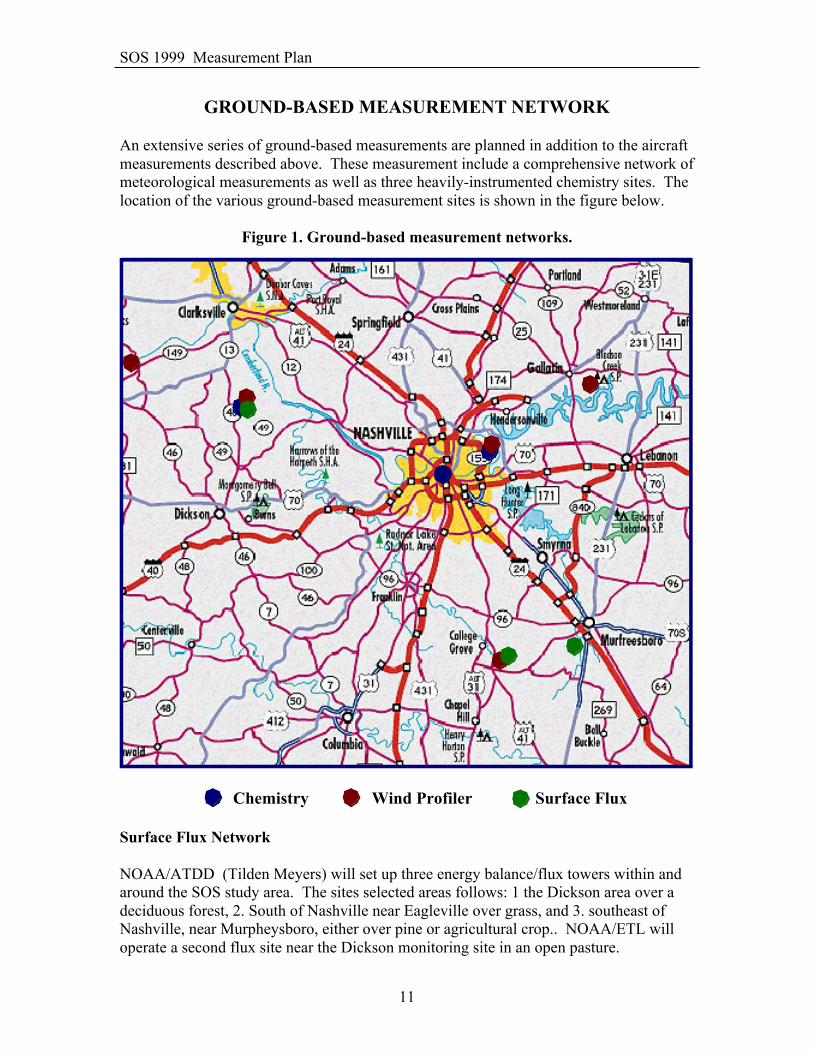
An extensive series of ground-based measurements are planned in addition to the aircraftmeasurements described above. These measurement include a comprehensive network ofmeteorological measurements as well as three heavily-instrumented chemistry sites. Thelocation of the various ground-based measurement sites is shown in the figure below.
Figure 1. Ground-based measurement networks.
Surface Flux Network
NOAA/ATDD (Tilden Meyers) will set up three energy balance/flux towers within andaround the SOS study area. The sites selected areas follows: 1 the Dickson area over adeciduous forest, 2. South of Nashville near Eagleville over grass, and 3. southeast ofNashville, near Murpheysboro, either over pine or agricultural crop.. NOAA/ETL willoperate a second flux site near the Dickson monitoring site in an open pasture.
Chemistry Wind Profiler Surface Flux

SOS 1999 Measurement Plan
12
The eddy covariance method will be employed to measure turbulent fluxes ofmomentum, sensible and latent heat fluxes, the components of turbulent kinetic energy(uÕ2, vÕ2, wÕ2), and the mean wind vector. The vertical turbulent fluxes of O3 and CO2
will also be determined. Mean state variables will include net and global radiation,incoming and reflected visible radiation, the ground heat flux, soil moisture at two levels(10 cm and 30 cm zones), soil temperature at seven levels (0,2,4,8,16,32 and 64 cm),precipitation, surface wetness, air temperature and relative humidity, surface or ÔskinÕtemperature, and barometric pressure. The systems will be in continuous operation fromthe beginning of June until the end of the experimental period (mid July). The initialaveraging period will be 30 minutes for both the turbulent quantities and the mean statevariables. The data acquisition system will be cell-phone linked to Oak Ridge, andprocessed data for the previous day ending at midnight will be made available to SOSScience team members by 9 am LST the next morning via FTP or e-mail standardprotocols. This near real-time processing allows for detection of equipment failure andimmediate repair if necessary. Instantaneous data (fast response, 10 Hz) may be loggedperiodically or on a routine basis, if needed. Measurements of the leaf area index (LAI),plant height, and stomatal conductance will be obtained at least on a weekly basis duringthe experimental period.
Wind Profiler Network
The profiler network will consist of five profilers: AL (Angevine) will deploy one at theCornelia Fort Air Park chemistry site for several months before, during, and after thecampaign. ETL will deploy three in a roughly equilateral triangle surrounding Nashville.One of the ETL profilers will be at Dickson, the second at TVAÕs Gallatin power plant,and the third at Eagleville. The UAH profiler will be located at TVAÕs Cunberlandpower plant. Several of these sites will also have laser ceilometers.
The profilers will operate at 60 m resolution in space and approximately 30 s resolutionin time. Vertical beam measurements will be emphasized, with a vertical beam everythird measurement (every 90 s). RASS will be run for 5 minutes every half hour. Theprofilers will operate in the same mode at all times around the clock, unless some sitesrequire that RASS not be run at night.
The Cornelia Fort profiler is primarily intended to provide meteorological measurementsin support of the extensive set of chemistry measurements being made at that site. It willbe aided in that role by a the presence of SODAR array, a S-band radar, and a dopplerlidar (mini-MOPA) operated by NOAA/ETL at that site. The three ETL profilers will beemployed in a mesoscale flux experiment, using the network as a coupled array. Thelocations of the Cumberland (UAH) and Dickson (NOAA/ETL) profilers will allow co-spectra to be calculated between the two profilers. This co-spectra is important indefining the mesoscale energy that is important in sustaining plume growth rates. Thisnetwork of profilers will allow the investigation of variations in mixed layer heights inthe region where many of the aircraft flights will be conducted. The profiler observations

SOS 1999 Measurement Plan
13
will also be used in conjunction with coupled boundary layer Lagrangian particle modelsto predict plume transport and dispersion as an aid in flight planning.
Chemistry Measurements
In addition to the monitoring networks that are already in place in the Middle Tennesseestudy region, three additional sites have been selected for the 1999 field intensive studyperiod that will have more extensive measurement capabilities. In keeping with previousnomenclature, these sites will be designated as either Level II (two locations) or Level III(or ÒSuper ChemistryÓ; one location. A detailed description of each site follows.
Polk Building:The James K. Polk building is located in the center of downtown Nashville. Sampling isperformed from a 5-meter tower attached to the roof of the building. The sampling inletis 110 meters above street level. This site recorded the highest ozone concentration (138ppb, 1-hr) of any ground site during the 1994/1995 study. This is intended primarily as ameans of documenting the urban source signature for the Nashville urban area. However,as is evidenced by the 1995 experience, significant photochemical activity can also occurin the vicinity of this site, especially under stagnation conditions.
Table 6. Chemical and meteorological measurements at the Polk building site.
Parameter Frequency InvestigatorO3 1-min., 24 hr TVA (Olszyna)NO, NO2, NOy 1-min., 24 hr TVA (Olszyna)CO, SO2 1-min., 24 hr TVA (Olszyna)VOCs 5min (8/day) ANL (Doskey)CH2O 1-min., 24 hr EPA (McClenny), BNL (Kleinman)wind speed, wind dir. 1-min., 24 hr TVA (Olszyna)temp., RH, solar rad 1-min., 24 hr TVA (Olszyna)
Site Manager Ð Ken Olszyna, TVA

SOS 1999 Measurement Plan
14
Dickson:This site is located in an area of mixed deciduous forest and pastureland approximately53 km WNW of the center of Nashville. This site serves as an upwind/rural site. Thesummertime synoptic flow in this part of the country is predominately from thesouthwest. Therefore, this site is only rarely impacted by the Nashville urban plume.The site is occasionally impacted by the plumes from TVAÕs Cumberland andJohnsonville power plants located to the northwest and southwest respectively. Themajor emphasis of the measurements conducted at this site will be the study of ruralphotochemistry, with a focus on isoprene chemistry.
This site is also well instrumented for atmospheric dynamics studies. There will be twosurface flux measurement experiments (one over the forest canopy, one in a nearbypasture) adjacent to this site. There will also be a moored balloon with meteorologicalsensors attached at various heights and a wind profiler located at this site. Thesemeasurements provide a unique opportunity to study the complex dynamics associatedwith rural areas with complex mixtures of landuse.
Sampling at Dickson will be through a common manifold with an inlet loacated at 10meters.
Table 6. Chemical and Meteorological measurements at the Dickson site.
Parameter Frequency InvestigatorO3 1-min., 24 hr TVA (Olszyna)NO, NO2, NOy 1-min., 24 hr TVA (Olszyna)CO, SO2 1-min., 24 hr TVA (Olszyna)VOCs (canister) 5-min, 1/day EPA (Lonneman)Oxygenated VOCs NCAR (Apel)Isoprene and oxidation products Purdue (Shepson)PANs, Alkyl nitrates Western Mich. (Bertman)Aerosol mass (FRM) 24 hr TVA (Olszyna)Aerosol speciation 12 hr GIT (Bauman)Surface Fluxes (canopy) NOAA/ATDD (Meyers)Surface Fluxes (pasture) NOAA/ETL (Neff)Wind profiler NOAA/ETL (Neff)Tethered Balloon NOAA/ETL (Neff)wind speed, wind dir. 1-min., 24 hr TVA (Olszyna)temp., RH, solar rad 1-min., 24 hr TVA (Olszyna)
Site Manager Ð Ken Olszyna, TVA

SOS 1999 Measurement Plan
15
Cornelia Fort Air Park:
The Cornelia Fort Air Park is located 8-9 km to the northeast of the Polk office buildingsite. The nearest major roads from the prevailing wind direction (SW) are 4-6 km away,which represents 1-2 hours of photochemical processing (and mixing) time. However,easterly wind will bring air from a major thoroughfare (SH 155) that is only 1 km distant.The airport is privately owned, serves mostly small private aircraft, and encompasses alarge area adjacent to the Cumberland River, directly across from Opreyland. The area ismostly open and flat with some small stands of forest interspersed.
This will be our ÒSuperÓ chemistry site. It was selected to be at, or near, the point ofmaximum ozone formation rate under normal summertime advection (winds 3-10 m/s).This site will host several major experiments, a few of which are described below.
Ozone Photochemistry Ð The focus of this effort is on characterizing the rate of ozoneformation and the parameters that influence it. The wide variety of measurements willallow a true Òradical closureÓ experiment. The atmospheric concentration of peroxyradicals (and therefore the rate of ozone formation) will be estimated three ways:1. Direct measurement of HOO radicals.2. Determination of ROO levels using the chemical amplifier technique.3. Estimation of ROO by the photostationary state deficit technique.
The results of these efforts will be compared to results from model simulations. Theseindividual measurements and their combined analysis will provide an importantevaluation of our ability to determine this key parameter.
The multiple methods that will be used at the Cornelia Fort site will also provide anopportunity for informal measurement intercomparisons for VOCs, NO2, andformaldehyde.
The site will also have a wide array of aerosol measurements. These data will afford theopportunity to provide information on the species that constitute the fine aerosol massand contrast these measurement with regional values. The fast response speciationmeasurements will provide valuable insights into the dynamics of human exposure andsource/receptor relationships for fine particles and their gaseous precursors. Particularemphasis will be placed on the quantification and speciation of the semi-volatile organicfraction of the fine particle mass.
Another focus of the measurements planned for the Cornelia Fort site is thecharacterization of the nocturnal boundary layer. A variety of high-resolution remotesensing instrumentation is being deployed to accomplish the objectives of this research.

SOS 1999 Measurement Plan
16
Table 7. Chemical and meteorological measurements at the Cornelia Fort site.
Parameter Frequency InvestigatorO3 UV abs 1 min Ð 24 hr AL (Williams)O3 NO Chemi. 1 min Ð 24 hr AL (Williams)NO, NOy 1 min Ð 24 hr AL (Williams)CO 1 min Ð 24 hr AL (Williams)SO2 1 min Ð 24 hr AL (Williams)NO2 (photolytic) 1 min Ð 24 hr AL (Williams)NO2 (photolytic) 1 min Ð 24 hr EPA (McClenny)NO2 (LIF) 1 min Ð 24 hr UC Berkley (Cohen)ROO (amplifer) 1 min Ð 24 hr TVA (Tanner)HO, HOO 1 min Ð 24 hr PSU (Brune)VOCs C2-C8 (FID-GC) 5 min 12/day Ohio U. (Young)VOCs C2-C12 (GC-MS) 1 hr EPA (McClenny)Aromatics, Aldehydes (CIMS) U. Innsbruck (Hansel)CH2O (Dasgupta) 5 min Ð 24 hr EPA (McClenny)CH2O (tunable diode laser) 1 min Ð 24 hr NCAR (Fried)Oxygenated VOCs NOAA/AL (Stroud)Peroxides NOAA/AL (Jobson)PAN, PPN, MPAN NOAA/AL (Roberts)O3/aerosol profiles NOAA/ETL (Hardesty)PM2.5 Mass 15 min 24 hr TVA (Tanner)Filter speciation 1-hr 4/day NOAA/AL (Norton)NO3, SO4, C 5 min Ð 24 hr ADI (Hering)EC/OC 15 min Ð 24 hr EPA (StockburgerParticle size distribution EPA (Stockburger)b absorption 15 min Ð24 hr EPA (Stockburger)SVOC 12 hr daily EPA (Stockburger)Carbon isotope 12 hr daily EPA (Lewis)MOUDI Impactor, speciation 12 hr daily EPA (Stockburger)Wind / temp profiles NOAA/Al (Angevine)SODAR array NOAA/ETL (Neff)S-band radar NOAA/ETL (Neff)Doppler winds (mini-MOPA) NOAA/ETL (Hardesty)Water vapor profiles (mini-MOPA) NOAA/ETL (Hardesty)Wind speed, wind direction NOAA/ETL (Neff)RH, Solar NOAA/ETL (Neff)Spectral Radiometer NCAR (Shetter)
Site Manager Ð Eric Williams, NOAA/AL

SOS 1999 Measurement Plan
17
DOAS Measurements:Three differential optical absorption spectrometers (DOAS) will be used to make long-path measurements over the Cornelia Fort site. EPA (McClenny) will operate a DOASfor NO2 measurement on the Cornelia Fort site.
Two additional DOAS units will be operated by J. Stutz (UCLA) and U. Platt(Heidelberg). One unit will be located at Cornelia Fort airport, the second at the StateLaboratory on Heart Lane. The retro reflector for both spectrometers will be located onthe roof of The Gaylord Entertainment Building on the East side of the river Figure 2.)The path length from the state laboratory to Gaylord is 4-5 km, while the path lengthfrom Cornelia Fort to Gaylord is approximately 1 km. The species to be measured withthe two instruments are as follows:
State Lab to Gaylord NO3, NO2
Cornelia Fort to Gaylord HONO, CH2O, O3, SO2, NO2
Figure 2. DOAS Measurements.
Gassaway Bldg.
Polk Bldg.
State Lab
Cornelia Fort
Gaylord Bldg.
HomesteadVillage

SOS 1999 Measurement Plan
18
Ozonsondes:An ozondsonde will be released daily, during the study, at 1:00 PM local time. Therelease will be from the NWS site near Old Hickory Lake. Releases will be conducted byNOAA/CMDL (Oltmans). These launches will provide ozone and meteorologicalprofiles up to the stratosphere, providing information on downmixing of ozone from theupper atmosphere.