Embed Size (px)
Citation preview
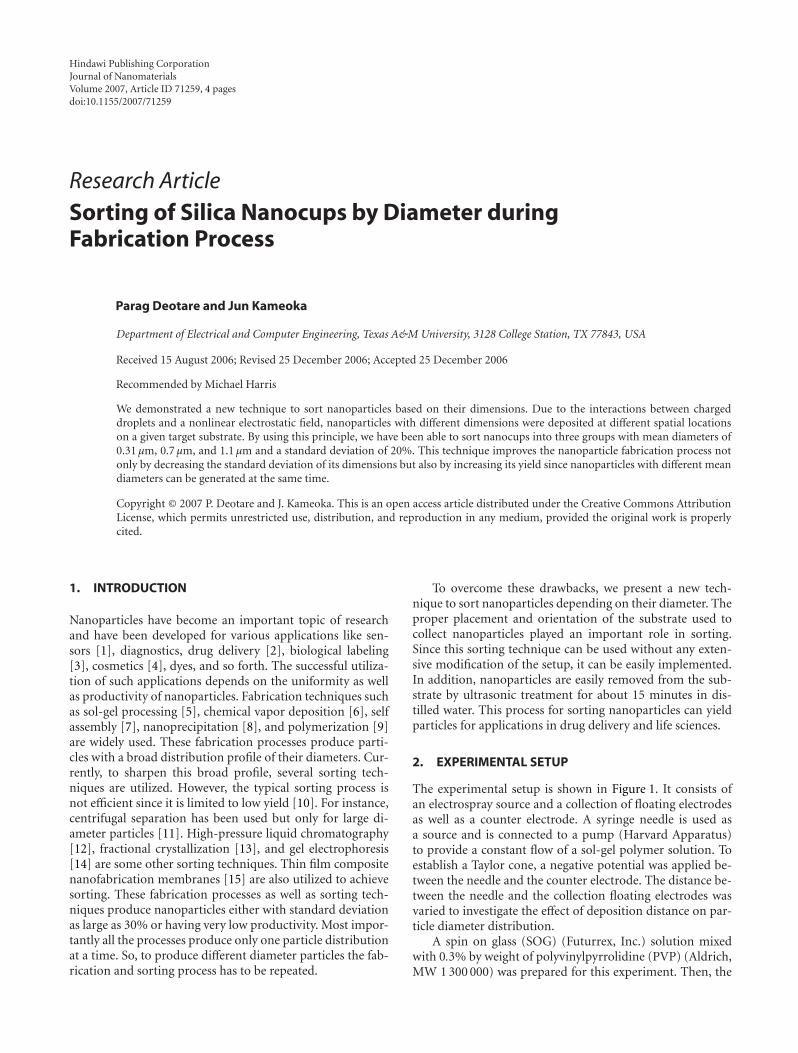
Hindawi Publishing CorporationJournal of NanomaterialsVolume 2007, Article ID 71259, 4 pagesdoi:10.1155/2007/71259
Research ArticleSorting of Silica Nanocups by Diameter duringFabrication Process
Parag Deotare and Jun Kameoka
Department of Electrical and Computer Engineering, Texas A&M University, 3128 College Station, TX 77843, USA
Received 15 August 2006; Revised 25 December 2006; Accepted 25 December 2006
Recommended by Michael Harris
We demonstrated a new technique to sort nanoparticles based on their dimensions. Due to the interactions between chargeddroplets and a nonlinear electrostatic field, nanoparticles with different dimensions were deposited at different spatial locationson a given target substrate. By using this principle, we have been able to sort nanocups into three groups with mean diameters of0.31 µm, 0.7 µm, and 1.1 µm and a standard deviation of 20%. This technique improves the nanoparticle fabrication process notonly by decreasing the standard deviation of its dimensions but also by increasing its yield since nanoparticles with different meandiameters can be generated at the same time.
Copyright © 2007 P. Deotare and J. Kameoka. This is an open access article distributed under the Creative Commons AttributionLicense, which permits unrestricted use, distribution, and reproduction in any medium, provided the original work is properlycited.
1. INTRODUCTION
Nanoparticles have become an important topic of researchand have been developed for various applications like sen-sors [1], diagnostics, drug delivery [2], biological labeling[3], cosmetics [4], dyes, and so forth. The successful utiliza-tion of such applications depends on the uniformity as wellas productivity of nanoparticles. Fabrication techniques suchas sol-gel processing [5], chemical vapor deposition [6], selfassembly [7], nanoprecipitation [8], and polymerization [9]are widely used. These fabrication processes produce parti-cles with a broad distribution profile of their diameters. Cur-rently, to sharpen this broad profile, several sorting tech-niques are utilized. However, the typical sorting process isnot efficient since it is limited to low yield [10]. For instance,centrifugal separation has been used but only for large di-ameter particles [11]. High-pressure liquid chromatography[12], fractional crystallization [13], and gel electrophoresis[14] are some other sorting techniques. Thin film compositenanofabrication membranes [15] are also utilized to achievesorting. These fabrication processes as well as sorting tech-niques produce nanoparticles either with standard deviationas large as 30% or having very low productivity. Most impor-tantly all the processes produce only one particle distributionat a time. So, to produce different diameter particles the fab-rication and sorting process has to be repeated.
To overcome these drawbacks, we present a new tech-nique to sort nanoparticles depending on their diameter. Theproper placement and orientation of the substrate used tocollect nanoparticles played an important role in sorting.Since this sorting technique can be used without any exten-sive modification of the setup, it can be easily implemented.In addition, nanoparticles are easily removed from the sub-strate by ultrasonic treatment for about 15 minutes in dis-tilled water. This process for sorting nanoparticles can yieldparticles for applications in drug delivery and life sciences.
2. EXPERIMENTAL SETUP
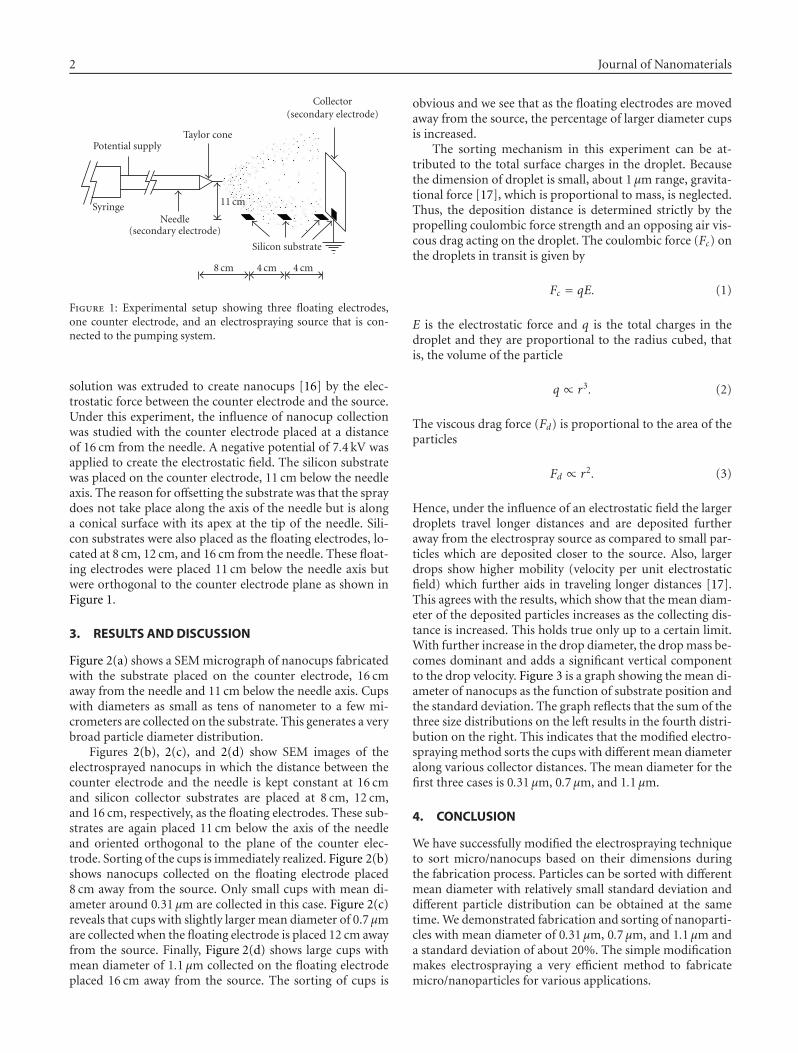
The experimental setup is shown in Figure 1. It consists ofan electrospray source and a collection of floating electrodesas well as a counter electrode. A syringe needle is used asa source and is connected to a pump (Harvard Apparatus)to provide a constant flow of a sol-gel polymer solution. Toestablish a Taylor cone, a negative potential was applied be-tween the needle and the counter electrode. The distance be-tween the needle and the collection floating electrodes wasvaried to investigate the effect of deposition distance on par-ticle diameter distribution.
A spin on glass (SOG) (Futurrex, Inc.) solution mixedwith 0.3% by weight of polyvinylpyrrolidine (PVP) (Aldrich,MW 1 300 000) was prepared for this experiment. Then, the
2 Journal of Nanomaterials
Potential supplyTaylor cone
Collector(secondary electrode)
SyringeNeedle
(secondary electrode)
11 cm
Silicon substrate
8 cm 4 cm 4 cm
Figure 1: Experimental setup showing three floating electrodes,one counter electrode, and an electrospraying source that is con-nected to the pumping system.
solution was extruded to create nanocups [16] by the elec-trostatic force between the counter electrode and the source.Under this experiment, the influence of nanocup collectionwas studied with the counter electrode placed at a distanceof 16 cm from the needle. A negative potential of 7.4 kV wasapplied to create the electrostatic field. The silicon substratewas placed on the counter electrode, 11 cm below the needleaxis. The reason for offsetting the substrate was that the spraydoes not take place along the axis of the needle but is alonga conical surface with its apex at the tip of the needle. Sili-con substrates were also placed as the floating electrodes, lo-cated at 8 cm, 12 cm, and 16 cm from the needle. These float-ing electrodes were placed 11 cm below the needle axis butwere orthogonal to the counter electrode plane as shown inFigure 1.
3. RESULTS AND DISCUSSION
Figure 2(a) shows a SEM micrograph of nanocups fabricatedwith the substrate placed on the counter electrode, 16 cmaway from the needle and 11 cm below the needle axis. Cupswith diameters as small as tens of nanometer to a few mi-crometers are collected on the substrate. This generates a verybroad particle diameter distribution.
Figures 2(b), 2(c), and 2(d) show SEM images of theelectrosprayed nanocups in which the distance between thecounter electrode and the needle is kept constant at 16 cmand silicon collector substrates are placed at 8 cm, 12 cm,and 16 cm, respectively, as the floating electrodes. These sub-strates are again placed 11 cm below the axis of the needleand oriented orthogonal to the plane of the counter elec-trode. Sorting of the cups is immediately realized. Figure 2(b)shows nanocups collected on the floating electrode placed8 cm away from the source. Only small cups with mean di-ameter around 0.31 µm are collected in this case. Figure 2(c)reveals that cups with slightly larger mean diameter of 0.7 µmare collected when the floating electrode is placed 12 cm awayfrom the source. Finally, Figure 2(d) shows large cups withmean diameter of 1.1 µm collected on the floating electrodeplaced 16 cm away from the source. The sorting of cups is
obvious and we see that as the floating electrodes are movedaway from the source, the percentage of larger diameter cupsis increased.
The sorting mechanism in this experiment can be at-tributed to the total surface charges in the droplet. Becausethe dimension of droplet is small, about 1 µm range, gravita-tional force [17], which is proportional to mass, is neglected.Thus, the deposition distance is determined strictly by thepropelling coulombic force strength and an opposing air vis-cous drag acting on the droplet. The coulombic force (Fc) onthe droplets in transit is given by
Fc = qE. (1)
E is the electrostatic force and q is the total charges in thedroplet and they are proportional to the radius cubed, thatis, the volume of the particle
q ∝ r3. (2)
The viscous drag force (Fd) is proportional to the area of theparticles
Fd ∝ r2. (3)
Hence, under the influence of an electrostatic field the largerdroplets travel longer distances and are deposited furtheraway from the electrospray source as compared to small par-ticles which are deposited closer to the source. Also, largerdrops show higher mobility (velocity per unit electrostaticfield) which further aids in traveling longer distances [17].This agrees with the results, which show that the mean diam-eter of the deposited particles increases as the collecting dis-tance is increased. This holds true only up to a certain limit.With further increase in the drop diameter, the drop mass be-comes dominant and adds a significant vertical componentto the drop velocity. Figure 3 is a graph showing the mean di-ameter of nanocups as the function of substrate position andthe standard deviation. The graph reflects that the sum of thethree size distributions on the left results in the fourth distri-bution on the right. This indicates that the modified electro-spraying method sorts the cups with different mean diameteralong various collector distances. The mean diameter for thefirst three cases is 0.31 µm, 0.7 µm, and 1.1 µm.
4. CONCLUSION
We have successfully modified the electrospraying techniqueto sort micro/nanocups based on their dimensions duringthe fabrication process. Particles can be sorted with differentmean diameter with relatively small standard deviation anddifferent particle distribution can be obtained at the sametime. We demonstrated fabrication and sorting of nanoparti-cles with mean diameter of 0.31 µm, 0.7 µm, and 1.1 µm anda standard deviation of about 20%. The simple modificationmakes electrospraying a very efficient method to fabricatemicro/nanoparticles for various applications.

P. Deotare and J. Kameoka 3
1 µm
(a)
1 µm
(b)
1 µm
(c)
1 µm
(d)
Figure 2: SEM images of nanocups collected at the electrodes. (a) Nanocups collected on the counter electrode that is located 16 cm awayform the source. (b) Nanocups collected on the floating electrode 8 cm away from source. (c) Nanocups collected on floating electrode 12 cmaway from the source. (d) Nanocups collected on floating electrode 16 cm away from the source.
16 cm orig16 cm12 cm8 cm
0
0.2
0.4
0.6
0.8
1
1.2
1.4
1.6
Figure 3: Graph showing diameter of nanocups as a function ofthe location of floating electrodes which are 8 cm, 12 cm, and 16 cmaway from the source with the counter electrode placed at 16 cm,and 16 cm orig is for the nanocups collected at the counter elec-trode placed 16 cm away from the source.
ACKNOWLEDGMENT
The FE-SEM acquisition was supported by the National Sci-ence Foundation under Grant no. DBI-0116835.
REFERENCES
[1] A. N. Shipway, E. Katz, and I. Willner, “Nanoparticle arrayson surfaces for electronic, optical, and sensor applications,”ChemPhysChem, vol. 1, no. 1, pp. 18–52, 2000.
[2] K. Y. Win and S.-S. Feng, “Effects of particle size and surfacecoating on cellular uptake of polymeric nanoparticles for oraldelivery of anticancer drugs,” Biomaterials, vol. 26, no. 15, pp.2713–2722, 2005.
[3] X. He, K. Wang, W. Tan, et al., “Photostable luminescentnanoparticles as biological label for cell recognition of sys-tem lupus erythematosus patients,” Journal of Nanoscience andNanotechnology, vol. 2, no. 3-4, pp. 317–320, 2002.
[4] S. A. Wissing and R. H. Muller, “A novel sunscreen sys-tem based on tocopherol acetate incorporated into solidlipid nanoparticles,” International Journal of Cosmetic Science,vol. 23, no. 4, pp. 233–243, 2001.
[5] M. Epifani, C. Giannini, L. Tapfer, and L. Vasanelli, “Sol-gelsynthesis and characterization of Ag and Au nanoparticles inSiO2, TiO2, and ZrO2 thin films,” Journal of the American Ce-ramic Society, vol. 83, no. 10, pp. 2385–2393, 2000.

4 Journal of Nanomaterials
[6] R. A. Bennett, M. A. Newton, R. D. Smith, J. Evans, and M.Bowker, “Titania surface structures for directed growth ofmetal nanoparticles via metal vapour deposition and metalorganic chemical vapour deposition,” Materials Science andTechnology, vol. 18, no. 7, pp. 710–716, 2002.
[7] R. K. Rana, V. S. Murthy, J. Yu, and M. S. Wong, “Nanoparti-cle self-assembly of hierarchically ordered microcapsule struc-tures,” Advanced Materials, vol. 17, no. 9, pp. 1145–1150, 2005.
[8] Y. Dong and S.-S. Feng, “Methoxy poly(ethylene glycol)-poly(lactide) (MPEG-PLA) nanoparticles for controlled de-livery of anticancer drugs,” Biomaterials, vol. 25, no. 14, pp.2843–2849, 2004.
[9] M. L. Hans and A. M. Lowman, “Biodegradable nanoparticlesfor drug delivery and targeting,” Current Opinion in Solid Stateand Materials Science, vol. 6, no. 4, pp. 319–327, 2002.
[10] V. L. Jimenez, M. C. Leopold, C. Mazzitelli, J. W. Jorgenson,and R. W. Murray, “HPLC of monolayer-protected gold nan-oclusters,” Analytical Chemistry, vol. 75, no. 2, pp. 199–206,2003.
[11] A. S. Shet, N. S. Key, and R. P. Hebbel, “Measuring circu-lating cell-derived microparticles,” Journal of Thrombosis andHaemostasis, vol. 2, no. 10, p. 1848, 2004.
[12] J. P. Wilcoxon, J. E. Martin, and P. Provencio, “Size distribu-tions of gold nanoclusters studied by liquid chromatography,”Langmuir, vol. 16, no. 25, pp. 9912–9920, 2000.
[13] T. G. Schaaff, M. N. Shafigullin, J. T. Khoury, et al., “Isolationof smaller nanocrystal Au molecules: robust quantum effectsin optical spectra,” Journal of Physical Chemistry B, vol. 101,no. 40, pp. 7885–7891, 1997.
[14] T. G. Schaaff, G. Knight, M. N. Shafigullin, R. F. Borkman,and R. L. Whetten, “Isolation and selected properties of a 10.4kDa gold: glutathione cluster compound,” Journal of PhysicalChemistry B, vol. 102, no. 52, pp. 10643–10646, 1998.
[15] A. Akthakul, A. I. Hochbaum, F. Stellacci, and A. M. Mayes,“Size fractionation of metal nanoparticles by membrane fil-tration,” Advanced Materials, vol. 17, no. 5, pp. 532–535, 2005.
[16] P. Deotare and J. Kameoka, “Fabrication of silica nanocom-posite-cups using electrospraying,” Nanotechnology, vol. 17,no. 5, pp. 1380–1383, 2006.
[17] A. G. Bailey, Electrostatic Spraying of Liquids, edited by J. F.Hughes, SRP, Somerset, UK, 1998.

Submit your manuscripts athttp://www.hindawi.com
ScientificaHindawi Publishing Corporationhttp://www.hindawi.com Volume 2014
CorrosionInternational Journal of
Hindawi Publishing Corporationhttp://www.hindawi.com Volume 2014
Polymer ScienceInternational Journal of
Hindawi Publishing Corporationhttp://www.hindawi.com Volume 2014
Hindawi Publishing Corporationhttp://www.hindawi.com Volume 2014
CeramicsJournal of
Hindawi Publishing Corporationhttp://www.hindawi.com Volume 2014
CompositesJournal of
NanoparticlesJournal of
Hindawi Publishing Corporationhttp://www.hindawi.com Volume 2014
Hindawi Publishing Corporationhttp://www.hindawi.com Volume 2014
International Journal of
Biomaterials
Hindawi Publishing Corporationhttp://www.hindawi.com Volume 2014
NanoscienceJournal of
TextilesHindawi Publishing Corporation http://www.hindawi.com Volume 2014
Journal of
NanotechnologyHindawi Publishing Corporationhttp://www.hindawi.com Volume 2014
Journal of
CrystallographyJournal of
Hindawi Publishing Corporationhttp://www.hindawi.com Volume 2014
The Scientific World JournalHindawi Publishing Corporation http://www.hindawi.com Volume 2014
Hindawi Publishing Corporationhttp://www.hindawi.com Volume 2014
CoatingsJournal of
Advances in
Materials Science and EngineeringHindawi Publishing Corporationhttp://www.hindawi.com Volume 2014
Smart Materials Research
Hindawi Publishing Corporationhttp://www.hindawi.com Volume 2014
Hindawi Publishing Corporationhttp://www.hindawi.com Volume 2014
MetallurgyJournal of
Hindawi Publishing Corporationhttp://www.hindawi.com Volume 2014
BioMed Research International
MaterialsJournal of
Hindawi Publishing Corporationhttp://www.hindawi.com Volume 2014
Nano
materials
Hindawi Publishing Corporationhttp://www.hindawi.com Volume 2014
Journal ofNanomaterials