Embed Size (px)
Citation preview
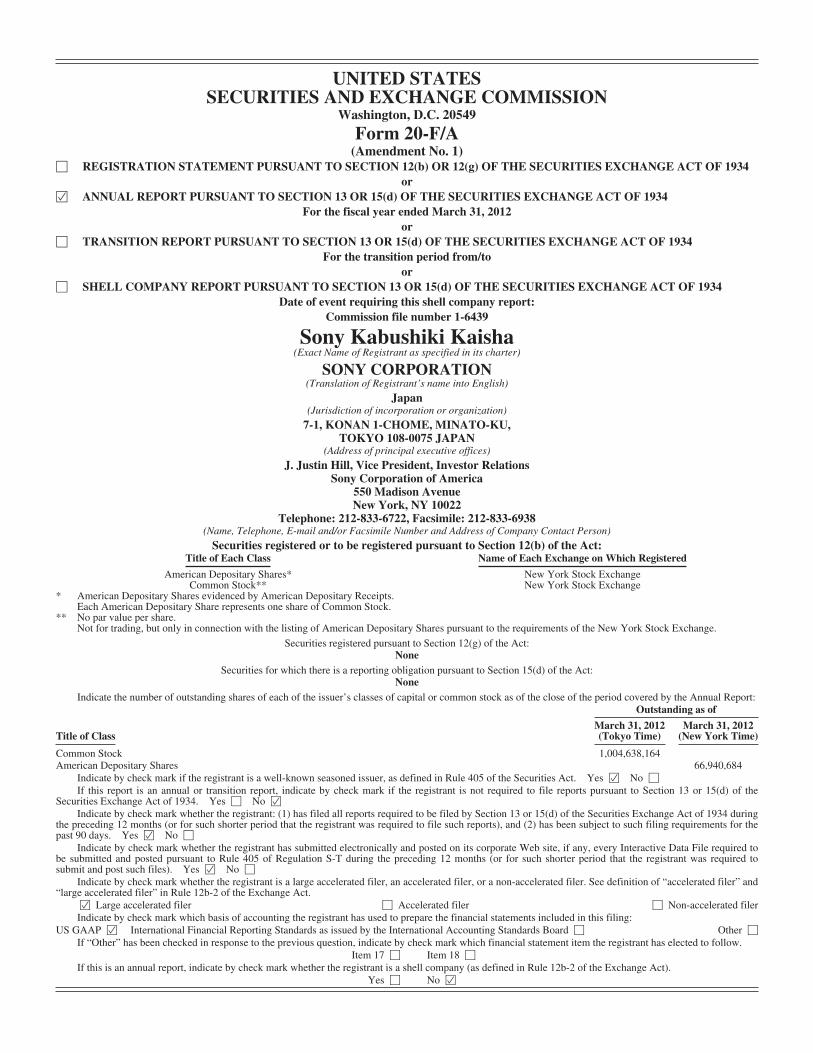
UNITED STATESSECURITIES AND EXCHANGE COMMISSION
Washington, D.C. 20549
Form 20-F/A(Amendment No. 1)
‘ REGISTRATION STATEMENT PURSUANT TO SECTION 12(b) OR 12(g) OF THE SECURITIES EXCHANGE ACT OF 1934or
Í ANNUAL REPORT PURSUANT TO SECTION 13 OR 15(d) OF THE SECURITIES EXCHANGE ACT OF 1934For the fiscal year ended March 31, 2012
or‘ TRANSITION REPORT PURSUANT TO SECTION 13 OR 15(d) OF THE SECURITIES EXCHANGE ACT OF 1934
For the transition period from/toor
‘ SHELL COMPANY REPORT PURSUANT TO SECTION 13 OR 15(d) OF THE SECURITIES EXCHANGE ACT OF 1934Date of event requiring this shell company report:
Commission file number 1-6439
Sony Kabushiki Kaisha(Exact Name of Registrant as specified in its charter)
SONY CORPORATION(Translation of Registrant’s name into English)
Japan(Jurisdiction of incorporation or organization)
7-1, KONAN 1-CHOME, MINATO-KU,TOKYO 108-0075 JAPAN
(Address of principal executive offices)
J. Justin Hill, Vice President, Investor RelationsSony Corporation of America
550 Madison AvenueNew York, NY 10022
Telephone: 212-833-6722, Facsimile: 212-833-6938(Name, Telephone, E-mail and/or Facsimile Number and Address of Company Contact Person)
Securities registered or to be registered pursuant to Section 12(b) of the Act:Title of Each Class Name of Each Exchange on Which Registered
American Depositary Shares* New York Stock ExchangeCommon Stock** New York Stock Exchange
* American Depositary Shares evidenced by American Depositary Receipts.Each American Depositary Share represents one share of Common Stock.
** No par value per share.Not for trading, but only in connection with the listing of American Depositary Shares pursuant to the requirements of the New York Stock Exchange.
Securities registered pursuant to Section 12(g) of the Act:None
Securities for which there is a reporting obligation pursuant to Section 15(d) of the Act:None
Indicate the number of outstanding shares of each of the issuer’s classes of capital or common stock as of the close of the period covered by the Annual Report:Outstanding as of
March 31, 2012 March 31, 2012Title of Class (Tokyo Time) (New York Time)
Common Stock 1,004,638,164American Depositary Shares 66,940,684
Indicate by check mark if the registrant is a well-known seasoned issuer, as defined in Rule 405 of the Securities Act. Yes Í No ‘If this report is an annual or transition report, indicate by check mark if the registrant is not required to file reports pursuant to Section 13 or 15(d) of the
Securities Exchange Act of 1934. Yes ‘ No ÍIndicate by check mark whether the registrant: (1) has filed all reports required to be filed by Section 13 or 15(d) of the Securities Exchange Act of 1934 during
the preceding 12 months (or for such shorter period that the registrant was required to file such reports), and (2) has been subject to such filing requirements for thepast 90 days. Yes Í No ‘
Indicate by check mark whether the registrant has submitted electronically and posted on its corporate Web site, if any, every Interactive Data File required tobe submitted and posted pursuant to Rule 405 of Regulation S-T during the preceding 12 months (or for such shorter period that the registrant was required tosubmit and post such files). Yes Í No ‘
Indicate by check mark whether the registrant is a large accelerated filer, an accelerated filer, or a non-accelerated filer. See definition of “accelerated filer” and“large accelerated filer” in Rule 12b-2 of the Exchange Act.
Í Large accelerated filer ‘ Accelerated filer ‘ Non-accelerated filerIndicate by check mark which basis of accounting the registrant has used to prepare the financial statements included in this filing:
US GAAP Í International Financial Reporting Standards as issued by the International Accounting Standards Board ‘ Other ‘If “Other” has been checked in response to the previous question, indicate by check mark which financial statement item the registrant has elected to follow.
Item 17 ‘ Item 18 ‘If this is an annual report, indicate by check mark whether the registrant is a shell company (as defined in Rule 12b-2 of the Exchange Act).
Yes ‘ No Í
Explanatory Note
Sony Corporation (“Sony”) is filing this Amendment No. 1 on Form 20-F/A (the “Form 20-F/A”) to amendits annual report on Form 20-F for the fiscal year ended March 31, 2012 (the “2011 Form 20-F”) as originallyfiled with the Securities and Exchange Commission (the “SEC”) on June 27, 2012. The Report of IndependentRegistered Public Accounting Firm in the Consolidated Financial Statements (the “Report”), as submitted to theSEC by Sony on a Form 6-K on June 1, 2012, was erroneously attached to the 2011 Form 20-F under Item 8. TheReport attached to the 2011 Form 20-F did not include an opinion on the financial statement schedule (the“Schedule”), presented on page F-101 in the 2011 Form 20-F. This amendment replaces that Report with thecorrect version of the Report referring to the above mentioned Schedule and presents Item 8 of the 2011Form 20-F with the correct version of the Report as page F-2. This amendment does not contain any changes todata and footnotes in the Consolidated Financial Statements of Sony Corporation and its consolidatedsubsidiaries, presented on pages F-3 through F-101 or the data and footnotes in the Consolidated FinancialStatements of Sony Mobile Communications AB on pages A-1 through A-30 of the 2011 Form 20-F.
Other than as expressly set forth above, this Form 20-F/A does not, and does not purport to, revise, update,amend or restate the information presented in any Item of the 2011 Form 20-F or reflect any events that haveoccurred after the filing of the 2011 Form 20-F.
Item 8. Financial Information
A. Consolidated Statements and Other Financial Information.
Refer to the consolidated financial statements and the notes to the consolidated financial statements.
Legal Proceedings
In May 2011, Sony Corporation’s U.S. subsidiary, Sony Electronics Inc., received a subpoena from the U.S.Department of Justice (“DOJ”) Antitrust Division seeking information about its secondary batteries business.Sony understands that the DOJ and agencies outside the United States are investigating competition in thesecondary batteries market. Based on the stage of the proceedings, it is not possible to estimate the amount ofloss or range of possible loss, if any, that might result from adverse judgments, settlements or other resolution ofthis matter.
Beginning in early 2011, the network services of PlayStation®Network, Qriocity™, Sony OnlineEntertainment LLC and websites of other subsidiaries came under cyber-attack. As of June 27, 2012, Sony hasnot received any confirmed reports of customer identity theft issues or misuse of credit cards from such cyber-attacks. However, in connection with certain of these matters, Sony has received inquiries from authorities in anumber of jurisdictions, including orders for reports issued by the Ministry of Economy, Trade and Industry ofJapan as well as the Financial Services Agency of Japan, formal and/or informal requests for information fromAttorneys General from a number of states in the United States and the U.S. Federal Trade Commission, variousU.S. congressional inquiries and others. Additionally, Sony Corporation and/or certain of its subsidiaries havebeen named in a number of purported class actions in certain jurisdictions, including the United States. Based onthe stage of these inquiries and proceedings, it is not possible to estimate the amount of loss or range of possibleloss, if any, that might result from adverse judgments, settlements or other resolution of all of these matters.
In October 2009, Sony Corporation’s U.S. subsidiary, Sony Optiarc America Inc., received a subpoena fromthe DOJ seeking information about its optical disk drive business. Sony understands that the DOJ and agenciesoutside the United States are investigating competition in optical disk drives. Subsequently, a number ofpurported class action lawsuits were filed in certain jurisdictions, including the United States, in which theplaintiffs allege that Sony Corporation and certain of its subsidiaries violated antitrust laws and seek recovery ofdamages and other remedies. Based on the stage of these proceedings, it is not possible to estimate the amount ofloss or range of possible loss, if any, that might result from adverse judgments, settlements or other resolution ofthese matters.
In addition, Sony Corporation and certain of its subsidiaries are defendants or otherwise involved in otherpending legal and regulatory proceedings. However, based upon the information currently available, Sonybelieves that the outcome from such legal and regulatory proceedings would not have a material effect on Sony’sconsolidated financial statements.
Dividend Policy
Sony believes that continuously increasing corporate value and providing dividends are essential torewarding shareholders. It is Sony’s policy to utilize retained earnings, after ensuring the perpetuation of stabledividends, to carry out various investments that contribute to an increase in corporate value such as those thatensure future growth and strengthen competitiveness.
A fiscal year-end dividend of 12.5 yen per share of Common Stock of Sony Corporation was approved atthe Board of Directors meeting held on May 9, 2012 and the payment of such dividend started on June 6, 2012.Sony Corporation has already paid an interim dividend for Common Stock of 12.5 yen per share to eachshareholder; accordingly, the total annual dividend per share of Common Stock for the fiscal year endedMarch 31, 2012 is 25.0 yen.
B. Significant Changes
No significant change has occurred since the date of the annual financial statements included in this annualreport.
INDEX TO CONSOLIDATED FINANCIAL STATEMENTS
SONY CORPORATION AND CONSOLIDATED SUBSIDIARIES
Page
Report of Independent Registered Public Accounting Firm . . . . . . . . . . . . . . . . . . . . . . . . . . . . . . . . . . . . . F-2
Consolidated Balance Sheet at March 31, 2011 and 2012 . . . . . . . . . . . . . . . . . . . . . . . . . . . . . . . . . . . . . . F-4
Consolidated Statements of Income for the fiscal years ended March 31, 2010, 2011 and 2012 . . . . . . . . . F-6
Consolidated Statements of Cash Flows for the fiscal years ended March 31, 2010, 2011 and 2012 . . . . . F-8
Consolidated Statements of Changes in Stockholders’ Equity for the fiscal years ended March 31, 2010,2011 and 2012 . . . . . . . . . . . . . . . . . . . . . . . . . . . . . . . . . . . . . . . . . . . . . . . . . . . . . . . . . . . . . . . . . . . . . . F-10
Index to Notes to Consolidated Financial Statements . . . . . . . . . . . . . . . . . . . . . . . . . . . . . . . . . . . . . . . . . . F-13
Notes to Consolidated Financial Statements . . . . . . . . . . . . . . . . . . . . . . . . . . . . . . . . . . . . . . . . . . . . . . . . . F-14
Financial Statement Schedule II for the fiscal years ended March 31, 2010, 2011 and 2012 — Valuationand Qualifying Accounts . . . . . . . . . . . . . . . . . . . . . . . . . . . . . . . . . . . . . . . . . . . . . . . . . . . . . . . . . . . . . . F-101
************************************************************************
Consolidated Financial Statements of Sony Mobile Communications AB . . . . . . . . . . . . . . . . . . . . . . . . . . A-1
Report of Independent Auditors . . . . . . . . . . . . . . . . . . . . . . . . . . . . . . . . . . . . . . . . . . . . . . . . . . . . . . . . . . . A-30
Consolidated Financial Statements of Sony Mobile Communications AB are provided pursuant toRegulation S-X Rule 3-09.
F-1
Report of Independent Registered Public Accounting Firm
To the Board of Directors and Stockholders of SonyCorporation (Sony Kabushiki Kaisha)
In our opinion, the consolidated financial statements listed in the accompanying index present fairly, in allmaterial respects, the financial position of Sony Corporation and its subsidiaries (the “Company”) at March 31, 2012and 2011, and the results of their operations and their cash flows for each of the three years in the period ended March31, 2012, in conformity with accounting principles generally accepted in the United States of America. In addition, inour opinion, the financial statement schedule listed in the accompanying index presents fairly, in all material respects,the information set forth therein when read in conjunction with the related consolidated financial statements. Also inour opinion, the Company maintained, in all material respects, effective internal control over financial reporting as ofMarch 31, 2012, based on criteria established in Internal Control - Integrated Framework issued by the Committee ofSponsoring Organizations of the Treadway Commission (COSO). The Company’s management is responsible forthese financial statements and financial statement schedule, for maintaining effective internal control over financialreporting and for its assessment of the effectiveness of internal control over financial reporting, included inManagement’s Annual Report on Internal Control over Financial Reporting appearing under Item 15(b). Ourresponsibility is to express opinions on these financial statements, on the financial statement schedule, and on theCompany’s internal control over financial reporting based on our integrated audits. We conducted our audits inaccordance with the standards of the Public Company Accounting Oversight Board (United States). Those standardsrequire that we plan and perform the audits to obtain reasonable assurance about whether the financial statements arefree of material misstatement and whether effective internal control over financial reporting was maintained in allmaterial respects. Our audits of the financial statements included examining, on a test basis, evidence supporting theamounts and disclosures in the financial statements, assessing the accounting principles used and significant estimatesmade by management, and evaluating the overall financial statement presentation. Our audit of internal control overfinancial reporting included obtaining an understanding of internal control over financial reporting, assessing the riskthat a material weakness exists, and testing and evaluating the design and operating effectiveness of internal controlbased on the assessed risk. Our audits also included performing such other procedures as we considered necessary inthe circumstances. We believe that our audits provide a reasonable basis for our opinions.
A company’s internal control over financial reporting is a process designed to provide reasonable assuranceregarding the reliability of financial reporting and the preparation of financial statements for external purposes inaccordance with generally accepted accounting principles. A company’s internal control over financial reportingincludes those policies and procedures that (i) pertain to the maintenance of records that, in reasonable detail,accurately and fairly reflect the transactions and dispositions of the assets of the company; (ii) provide reasonableassurance that transactions are recorded as necessary to permit preparation of financial statements in accordancewith generally accepted accounting principles, and that receipts and expenditures of the company are being madeonly in accordance with authorizations of management and directors of the company; and (iii) provide reasonableassurance regarding prevention or timely detection of unauthorized acquisition, use, or disposition of thecompany’s assets that could have a material effect on the financial statements.
Because of its inherent limitations, internal control over financial reporting may not prevent or detectmisstatements. Also, projections of any evaluation of effectiveness to future periods are subject to the risk thatcontrols may become inadequate because of changes in conditions, or that the degree of compliance with thepolicies or procedures may deteriorate.
As described in Management’s Annual Report on Internal Control over Financial Reporting, managementhas excluded Sony Mobile Communications AB from its assessment of internal control over financial reportingas of March 31, 2012, because it was acquired by the Company in a purchase business combination during theyear ended March 31, 2012. We have also excluded Sony Mobile Communications AB from our audit of internalcontrol over financial reporting. Sony Mobile Communications AB is a wholly-owned subsidiary whose totalassets and total sales and operating revenue represent 347.0 billion yen and 77.7 billion yen, respectively, of therelated consolidated financial statement amounts as of and for the year ended March 31, 2012.
/s/ PricewaterhouseCoopers AarataTokyo, JapanMay 31, 2012
F-2

[THIS PAGE IS INTENTIONALLY LEFT BLANK]
F-3
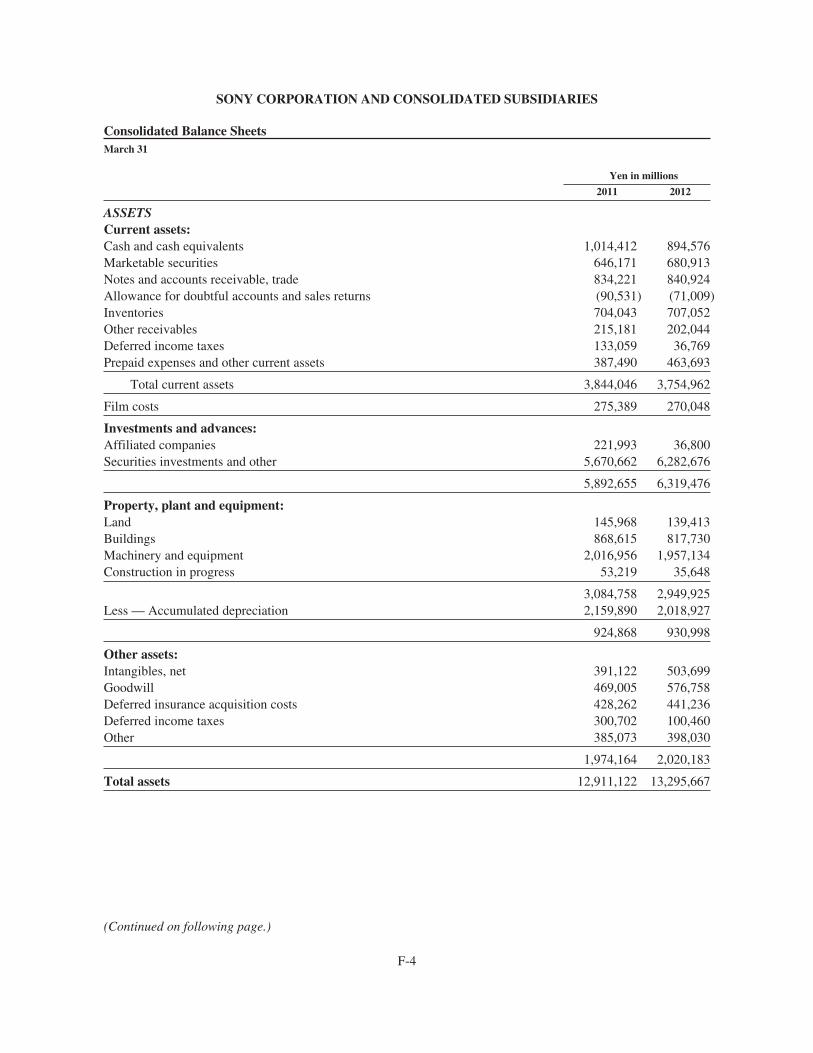
SONY CORPORATION AND CONSOLIDATED SUBSIDIARIES
Consolidated Balance SheetsMarch 31
Yen in millions
2011 2012
ASSETSCurrent assets:Cash and cash equivalents 1,014,412 894,576Marketable securities 646,171 680,913Notes and accounts receivable, trade 834,221 840,924Allowance for doubtful accounts and sales returns (90,531) (71,009)Inventories 704,043 707,052Other receivables 215,181 202,044Deferred income taxes 133,059 36,769Prepaid expenses and other current assets 387,490 463,693
Total current assets 3,844,046 3,754,962
Film costs 275,389 270,048
Investments and advances:Affiliated companies 221,993 36,800Securities investments and other 5,670,662 6,282,676
5,892,655 6,319,476
Property, plant and equipment:Land 145,968 139,413Buildings 868,615 817,730Machinery and equipment 2,016,956 1,957,134Construction in progress 53,219 35,648
3,084,758 2,949,925Less — Accumulated depreciation 2,159,890 2,018,927
924,868 930,998
Other assets:Intangibles, net 391,122 503,699Goodwill 469,005 576,758Deferred insurance acquisition costs 428,262 441,236Deferred income taxes 300,702 100,460Other 385,073 398,030
1,974,164 2,020,183
Total assets 12,911,122 13,295,667
(Continued on following page.)
F-4
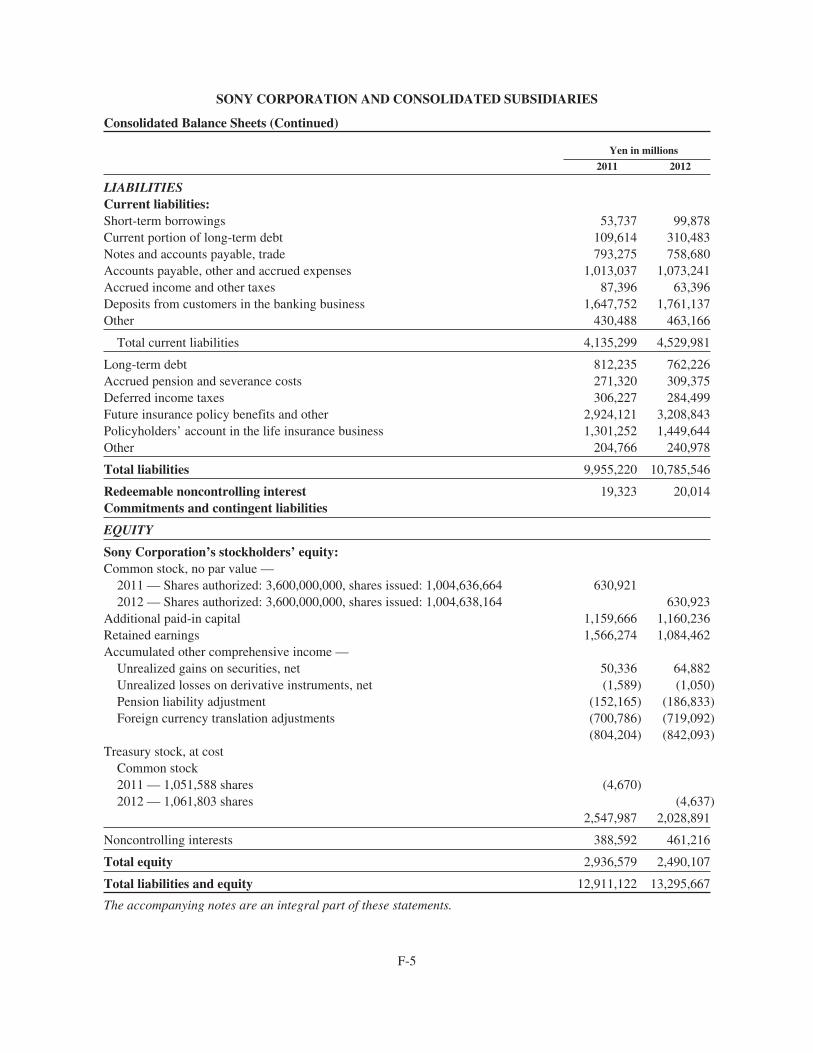
SONY CORPORATION AND CONSOLIDATED SUBSIDIARIES
Consolidated Balance Sheets (Continued)
Yen in millions
2011 2012
LIABILITIESCurrent liabilities:Short-term borrowings 53,737 99,878Current portion of long-term debt 109,614 310,483Notes and accounts payable, trade 793,275 758,680Accounts payable, other and accrued expenses 1,013,037 1,073,241Accrued income and other taxes 87,396 63,396Deposits from customers in the banking business 1,647,752 1,761,137Other 430,488 463,166
Total current liabilities 4,135,299 4,529,981
Long-term debt 812,235 762,226Accrued pension and severance costs 271,320 309,375Deferred income taxes 306,227 284,499Future insurance policy benefits and other 2,924,121 3,208,843Policyholders’ account in the life insurance business 1,301,252 1,449,644Other 204,766 240,978
Total liabilities 9,955,220 10,785,546
Redeemable noncontrolling interest 19,323 20,014Commitments and contingent liabilities
EQUITY
Sony Corporation’s stockholders’ equity:Common stock, no par value —
2011 — Shares authorized: 3,600,000,000, shares issued: 1,004,636,664 630,9212012 — Shares authorized: 3,600,000,000, shares issued: 1,004,638,164 630,923
Additional paid-in capital 1,159,666 1,160,236Retained earnings 1,566,274 1,084,462Accumulated other comprehensive income —
Unrealized gains on securities, net 50,336 64,882Unrealized losses on derivative instruments, net (1,589) (1,050)Pension liability adjustment (152,165) (186,833)Foreign currency translation adjustments (700,786) (719,092)
(804,204) (842,093)Treasury stock, at cost
Common stock2011 — 1,051,588 shares (4,670)2012 — 1,061,803 shares (4,637)
2,547,987 2,028,891
Noncontrolling interests 388,592 461,216
Total equity 2,936,579 2,490,107
Total liabilities and equity 12,911,122 13,295,667
The accompanying notes are an integral part of these statements.
F-5
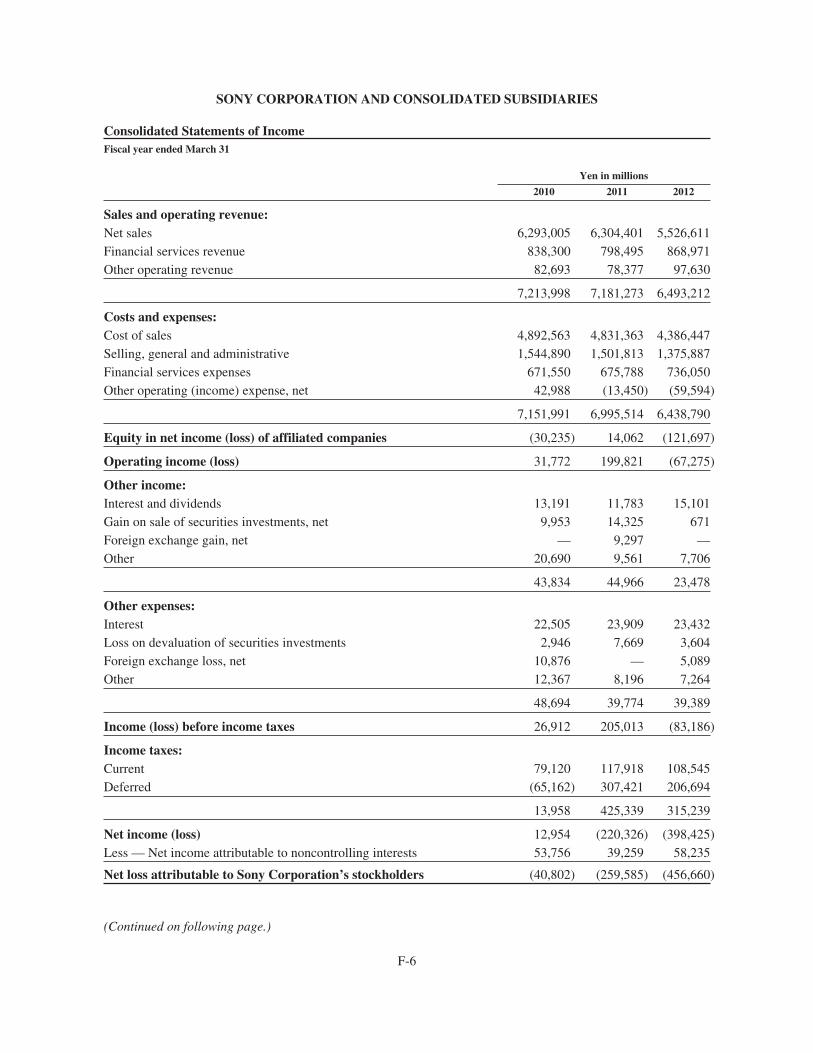
SONY CORPORATION AND CONSOLIDATED SUBSIDIARIES
Consolidated Statements of IncomeFiscal year ended March 31
Yen in millions
2010 2011 2012
Sales and operating revenue:Net sales 6,293,005 6,304,401 5,526,611Financial services revenue 838,300 798,495 868,971Other operating revenue 82,693 78,377 97,630
7,213,998 7,181,273 6,493,212
Costs and expenses:Cost of sales 4,892,563 4,831,363 4,386,447Selling, general and administrative 1,544,890 1,501,813 1,375,887Financial services expenses 671,550 675,788 736,050Other operating (income) expense, net 42,988 (13,450) (59,594)
7,151,991 6,995,514 6,438,790
Equity in net income (loss) of affiliated companies (30,235) 14,062 (121,697)
Operating income (loss) 31,772 199,821 (67,275)
Other income:Interest and dividends 13,191 11,783 15,101Gain on sale of securities investments, net 9,953 14,325 671Foreign exchange gain, net — 9,297 —Other 20,690 9,561 7,706
43,834 44,966 23,478
Other expenses:Interest 22,505 23,909 23,432Loss on devaluation of securities investments 2,946 7,669 3,604Foreign exchange loss, net 10,876 — 5,089Other 12,367 8,196 7,264
48,694 39,774 39,389
Income (loss) before income taxes 26,912 205,013 (83,186)
Income taxes:Current 79,120 117,918 108,545Deferred (65,162) 307,421 206,694
13,958 425,339 315,239
Net income (loss) 12,954 (220,326) (398,425)Less — Net income attributable to noncontrolling interests 53,756 39,259 58,235
Net loss attributable to Sony Corporation’s stockholders (40,802) (259,585) (456,660)
(Continued on following page.)
F-6
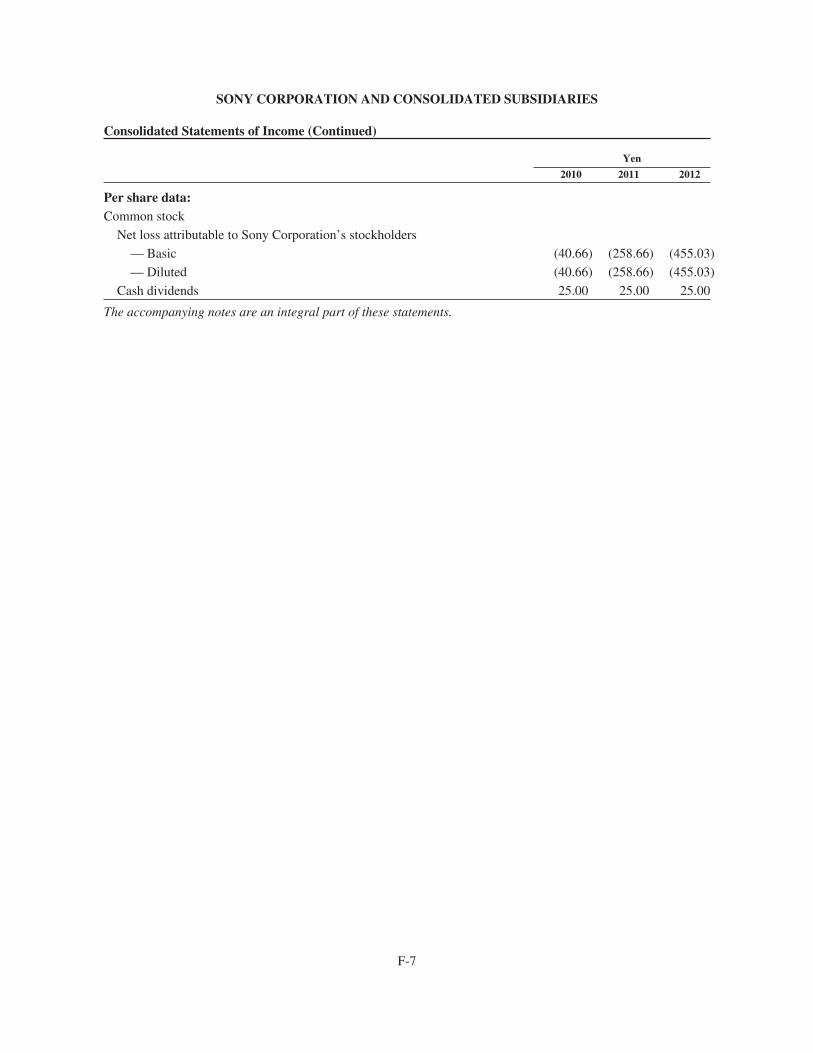
SONY CORPORATION AND CONSOLIDATED SUBSIDIARIES
Consolidated Statements of Income (Continued)
Yen
2010 2011 2012
Per share data:Common stock
Net loss attributable to Sony Corporation’s stockholders
— Basic (40.66) (258.66) (455.03)
— Diluted (40.66) (258.66) (455.03)
Cash dividends 25.00 25.00 25.00
The accompanying notes are an integral part of these statements.
F-7
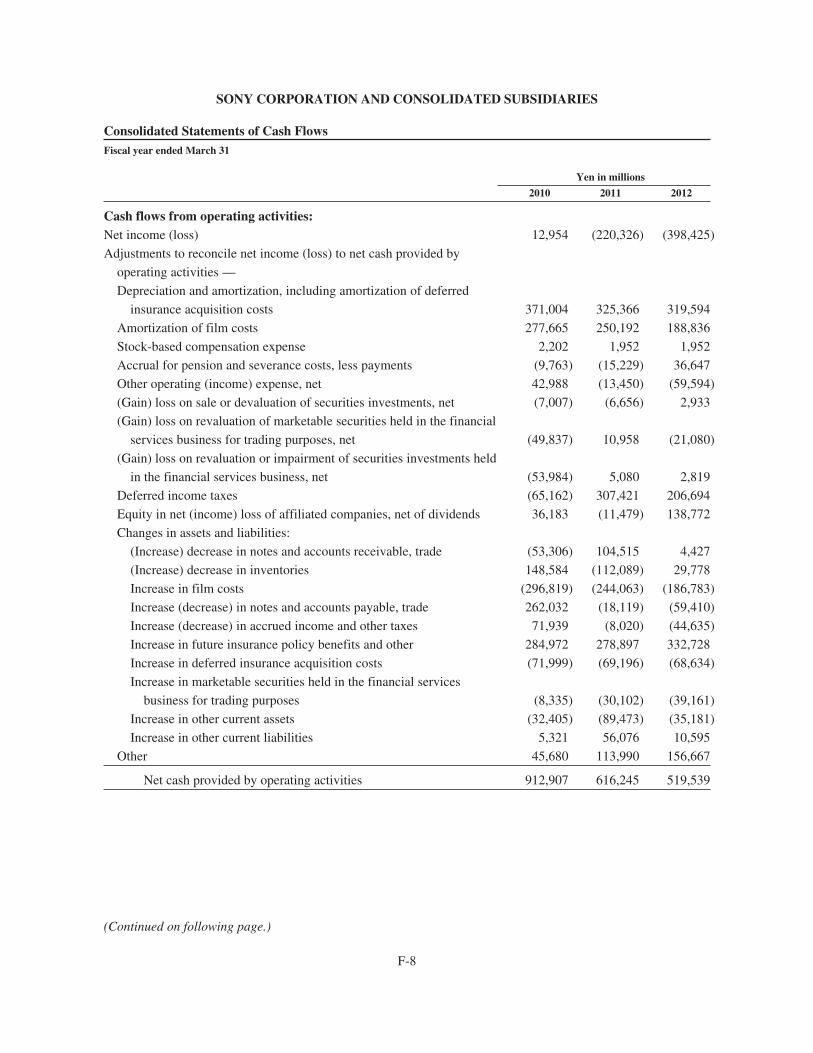
SONY CORPORATION AND CONSOLIDATED SUBSIDIARIES
Consolidated Statements of Cash FlowsFiscal year ended March 31
Yen in millions
2010 2011 2012
Cash flows from operating activities:Net income (loss) 12,954 (220,326) (398,425)
Adjustments to reconcile net income (loss) to net cash provided by
operating activities —
Depreciation and amortization, including amortization of deferred
insurance acquisition costs 371,004 325,366 319,594
Amortization of film costs 277,665 250,192 188,836
Stock-based compensation expense 2,202 1,952 1,952
Accrual for pension and severance costs, less payments (9,763) (15,229) 36,647
Other operating (income) expense, net 42,988 (13,450) (59,594)
(Gain) loss on sale or devaluation of securities investments, net (7,007) (6,656) 2,933
(Gain) loss on revaluation of marketable securities held in the financial
services business for trading purposes, net (49,837) 10,958 (21,080)
(Gain) loss on revaluation or impairment of securities investments held
in the financial services business, net (53,984) 5,080 2,819
Deferred income taxes (65,162) 307,421 206,694
Equity in net (income) loss of affiliated companies, net of dividends 36,183 (11,479) 138,772
Changes in assets and liabilities:
(Increase) decrease in notes and accounts receivable, trade (53,306) 104,515 4,427
(Increase) decrease in inventories 148,584 (112,089) 29,778
Increase in film costs (296,819) (244,063) (186,783)
Increase (decrease) in notes and accounts payable, trade 262,032 (18,119) (59,410)
Increase (decrease) in accrued income and other taxes 71,939 (8,020) (44,635)
Increase in future insurance policy benefits and other 284,972 278,897 332,728
Increase in deferred insurance acquisition costs (71,999) (69,196) (68,634)
Increase in marketable securities held in the financial services
business for trading purposes (8,335) (30,102) (39,161)
Increase in other current assets (32,405) (89,473) (35,181)
Increase in other current liabilities 5,321 56,076 10,595
Other 45,680 113,990 156,667
Net cash provided by operating activities 912,907 616,245 519,539
(Continued on following page.)
F-8
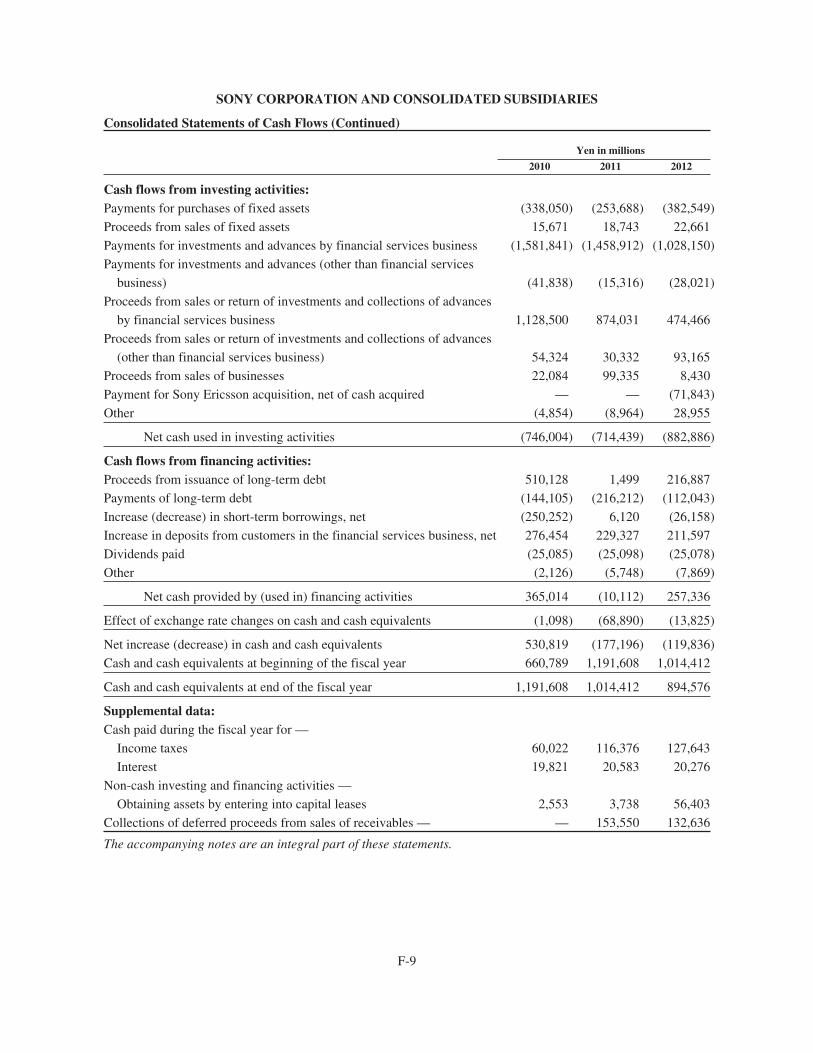
SONY CORPORATION AND CONSOLIDATED SUBSIDIARIES
Consolidated Statements of Cash Flows (Continued)
Yen in millions
2010 2011 2012
Cash flows from investing activities:Payments for purchases of fixed assets (338,050) (253,688) (382,549)
Proceeds from sales of fixed assets 15,671 18,743 22,661
Payments for investments and advances by financial services business (1,581,841) (1,458,912) (1,028,150)
Payments for investments and advances (other than financial services
business) (41,838) (15,316) (28,021)
Proceeds from sales or return of investments and collections of advances
by financial services business 1,128,500 874,031 474,466
Proceeds from sales or return of investments and collections of advances
(other than financial services business) 54,324 30,332 93,165
Proceeds from sales of businesses 22,084 99,335 8,430
Payment for Sony Ericsson acquisition, net of cash acquired — — (71,843)
Other (4,854) (8,964) 28,955
Net cash used in investing activities (746,004) (714,439) (882,886)
Cash flows from financing activities:Proceeds from issuance of long-term debt 510,128 1,499 216,887
Payments of long-term debt (144,105) (216,212) (112,043)
Increase (decrease) in short-term borrowings, net (250,252) 6,120 (26,158)
Increase in deposits from customers in the financial services business, net 276,454 229,327 211,597
Dividends paid (25,085) (25,098) (25,078)
Other (2,126) (5,748) (7,869)
Net cash provided by (used in) financing activities 365,014 (10,112) 257,336
Effect of exchange rate changes on cash and cash equivalents (1,098) (68,890) (13,825)
Net increase (decrease) in cash and cash equivalents 530,819 (177,196) (119,836)
Cash and cash equivalents at beginning of the fiscal year 660,789 1,191,608 1,014,412
Cash and cash equivalents at end of the fiscal year 1,191,608 1,014,412 894,576
Supplemental data:Cash paid during the fiscal year for —
Income taxes 60,022 116,376 127,643
Interest 19,821 20,583 20,276
Non-cash investing and financing activities —
Obtaining assets by entering into capital leases 2,553 3,738 56,403
Collections of deferred proceeds from sales of receivables — — 153,550 132,636
The accompanying notes are an integral part of these statements.
F-9
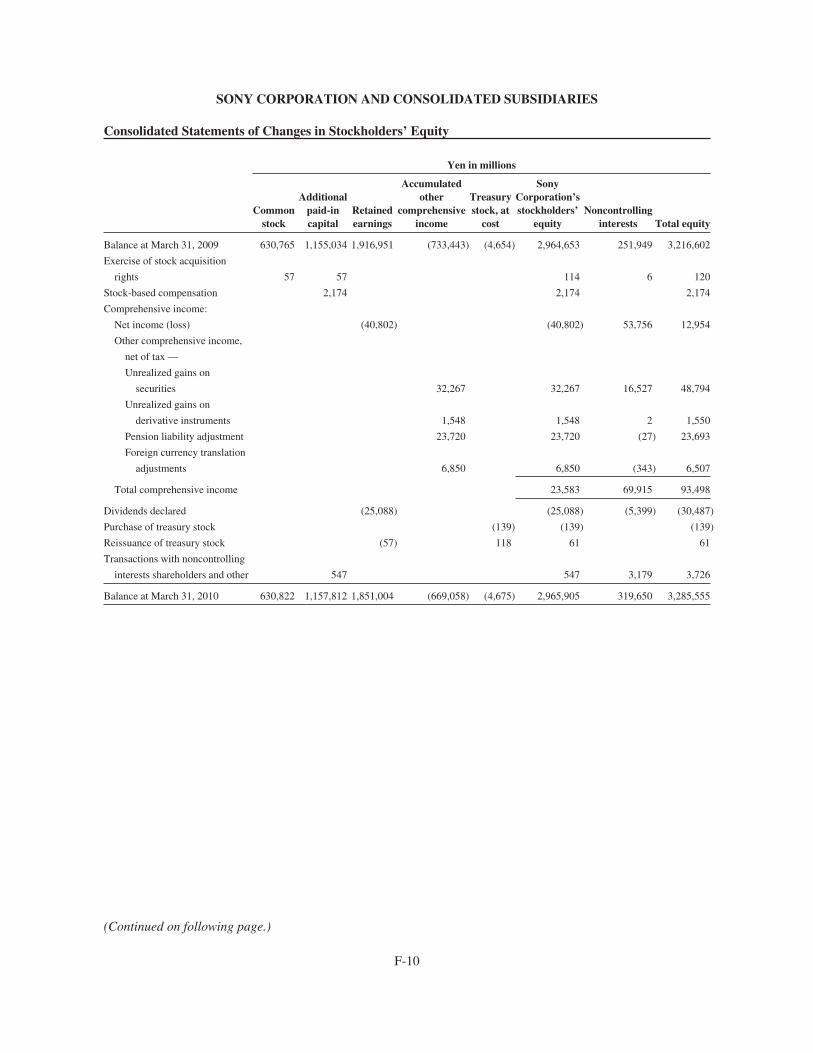
SONY CORPORATION AND CONSOLIDATED SUBSIDIARIES
Consolidated Statements of Changes in Stockholders’ Equity
Yen in millions
Commonstock
Additionalpaid-incapital
Retainedearnings
Accumulatedother
comprehensiveincome
Treasurystock, at
cost
SonyCorporation’sstockholders’
equityNoncontrolling
interests Total equity
Balance at March 31, 2009 630,765 1,155,034 1,916,951 (733,443) (4,654) 2,964,653 251,949 3,216,602
Exercise of stock acquisition
rights 57 57 114 6 120
Stock-based compensation 2,174 2,174 2,174
Comprehensive income:
Net income (loss) (40,802) (40,802) 53,756 12,954
Other comprehensive income,
net of tax —
Unrealized gains on
securities 32,267 32,267 16,527 48,794
Unrealized gains on
derivative instruments 1,548 1,548 2 1,550
Pension liability adjustment 23,720 23,720 (27) 23,693
Foreign currency translation
adjustments 6,850 6,850 (343) 6,507
Total comprehensive income 23,583 69,915 93,498
Dividends declared (25,088) (25,088) (5,399) (30,487)
Purchase of treasury stock (139) (139) (139)
Reissuance of treasury stock (57) 118 61 61
Transactions with noncontrolling
interests shareholders and other 547 547 3,179 3,726
Balance at March 31, 2010 630,822 1,157,812 1,851,004 (669,058) (4,675) 2,965,905 319,650 3,285,555
(Continued on following page.)
F-10
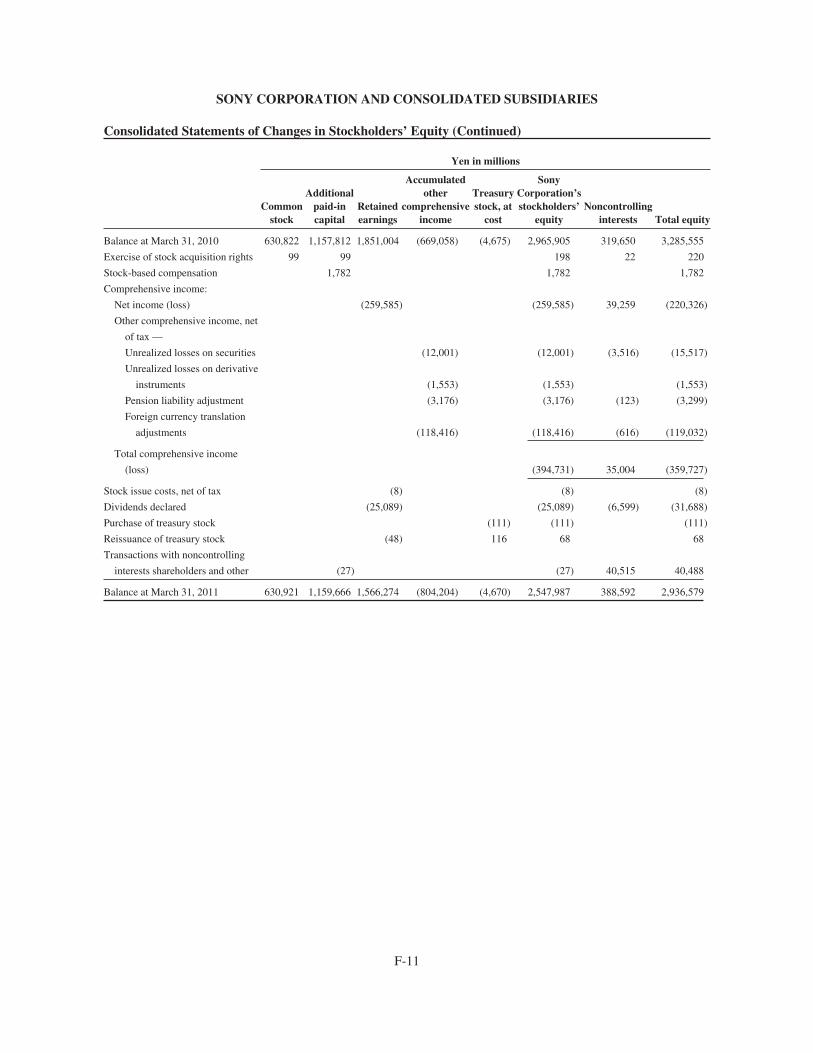
SONY CORPORATION AND CONSOLIDATED SUBSIDIARIES
Consolidated Statements of Changes in Stockholders’ Equity (Continued)
Yen in millions
Commonstock
Additionalpaid-incapital
Retainedearnings
Accumulatedother
comprehensiveincome
Treasurystock, at
cost
SonyCorporation’sstockholders’
equityNoncontrolling
interests Total equity
Balance at March 31, 2010 630,822 1,157,812 1,851,004 (669,058) (4,675) 2,965,905 319,650 3,285,555
Exercise of stock acquisition rights 99 99 198 22 220
Stock-based compensation 1,782 1,782 1,782
Comprehensive income:
Net income (loss) (259,585) (259,585) 39,259 (220,326)
Other comprehensive income, net
of tax —
Unrealized losses on securities (12,001) (12,001) (3,516) (15,517)
Unrealized losses on derivative
instruments (1,553) (1,553) (1,553)
Pension liability adjustment (3,176) (3,176) (123) (3,299)
Foreign currency translation
adjustments (118,416) (118,416) (616) (119,032)
Total comprehensive income
(loss) (394,731) 35,004 (359,727)
Stock issue costs, net of tax (8) (8) (8)
Dividends declared (25,089) (25,089) (6,599) (31,688)
Purchase of treasury stock (111) (111) (111)
Reissuance of treasury stock (48) 116 68 68
Transactions with noncontrolling
interests shareholders and other (27) (27) 40,515 40,488
Balance at March 31, 2011 630,921 1,159,666 1,566,274 (804,204) (4,670) 2,547,987 388,592 2,936,579
F-11
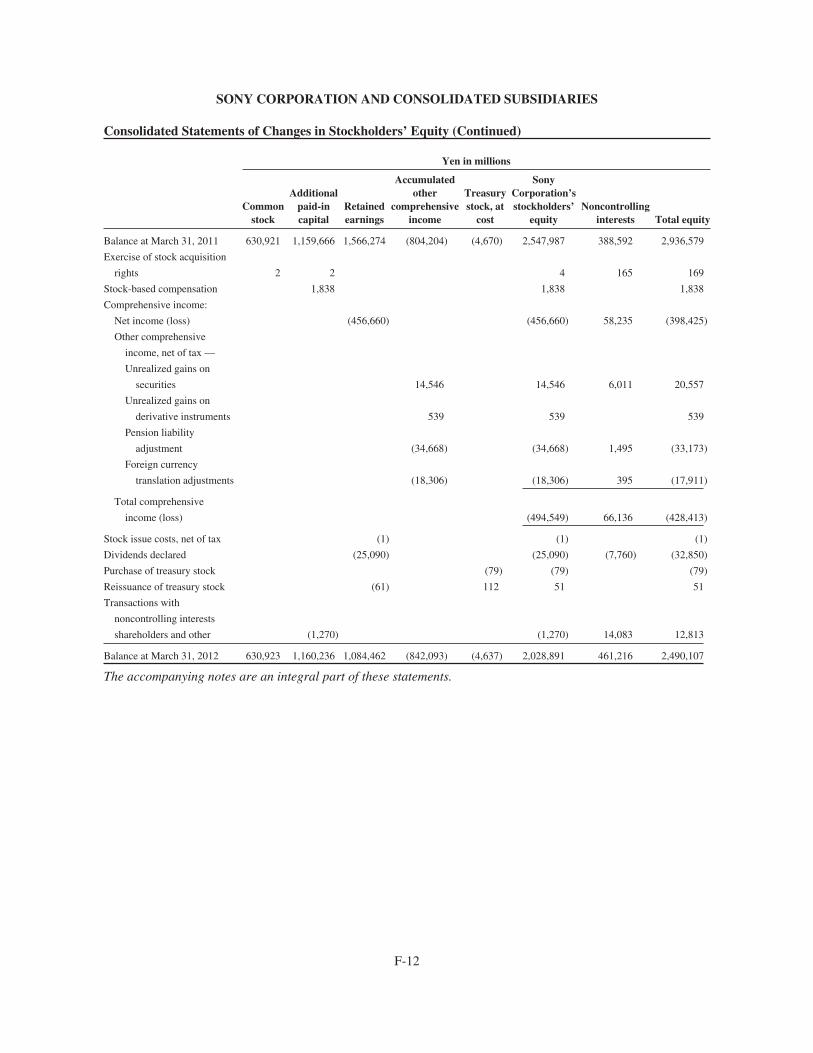
SONY CORPORATION AND CONSOLIDATED SUBSIDIARIES
Consolidated Statements of Changes in Stockholders’ Equity (Continued)
Yen in millions
Commonstock
Additionalpaid-incapital
Retainedearnings
Accumulatedother
comprehensiveincome
Treasurystock, at
cost
SonyCorporation’sstockholders’
equityNoncontrolling
interests Total equity
Balance at March 31, 2011 630,921 1,159,666 1,566,274 (804,204) (4,670) 2,547,987 388,592 2,936,579
Exercise of stock acquisition
rights 2 2 4 165 169
Stock-based compensation 1,838 1,838 1,838
Comprehensive income:
Net income (loss) (456,660) (456,660) 58,235 (398,425)
Other comprehensive
income, net of tax —
Unrealized gains on
securities 14,546 14,546 6,011 20,557
Unrealized gains on
derivative instruments 539 539 539
Pension liability
adjustment (34,668) (34,668) 1,495 (33,173)
Foreign currency
translation adjustments (18,306) (18,306) 395 (17,911)
Total comprehensive
income (loss) (494,549) 66,136 (428,413)
Stock issue costs, net of tax (1) (1) (1)
Dividends declared (25,090) (25,090) (7,760) (32,850)
Purchase of treasury stock (79) (79) (79)
Reissuance of treasury stock (61) 112 51 51
Transactions with
noncontrolling interests
shareholders and other (1,270) (1,270) 14,083 12,813
Balance at March 31, 2012 630,923 1,160,236 1,084,462 (842,093) (4,637) 2,028,891 461,216 2,490,107
The accompanying notes are an integral part of these statements.
F-12
SONY CORPORATION AND CONSOLIDATED SUBSIDIARIES
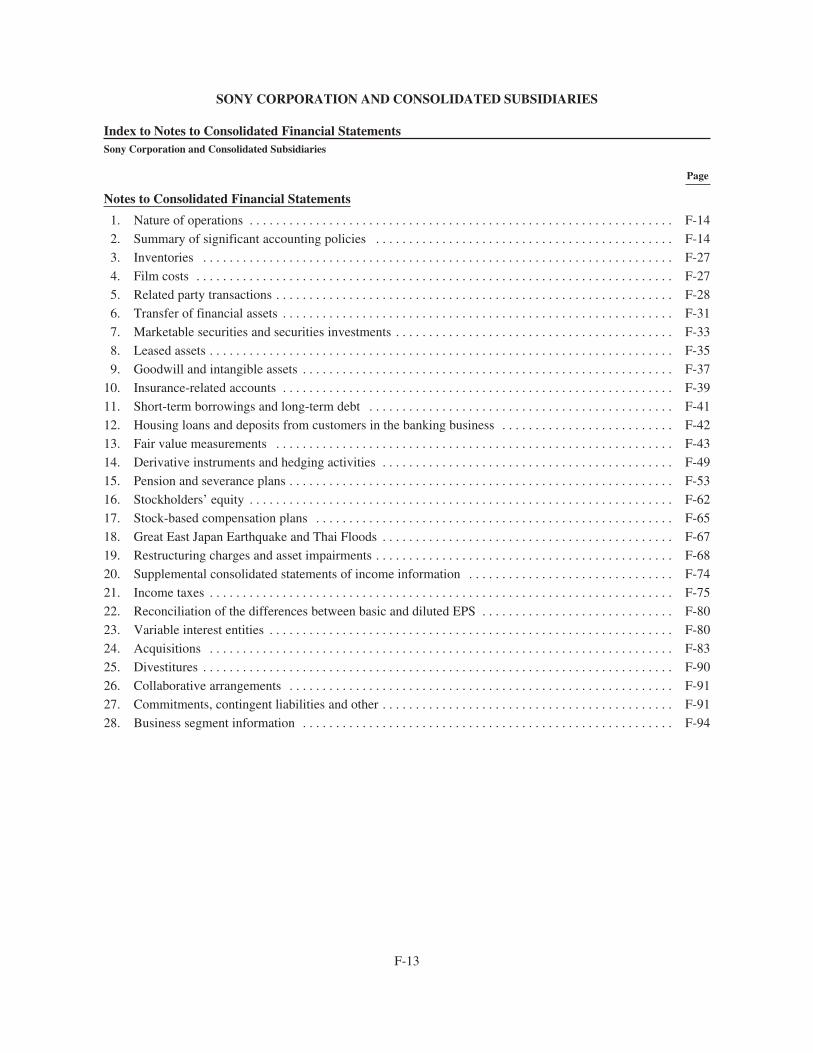
Index to Notes to Consolidated Financial StatementsSony Corporation and Consolidated Subsidiaries
Page
Notes to Consolidated Financial Statements
1. Nature of operations . . . . . . . . . . . . . . . . . . . . . . . . . . . . . . . . . . . . . . . . . . . . . . . . . . . . . . . . . . . . . . . . F-14
2. Summary of significant accounting policies . . . . . . . . . . . . . . . . . . . . . . . . . . . . . . . . . . . . . . . . . . . . . F-14
3. Inventories . . . . . . . . . . . . . . . . . . . . . . . . . . . . . . . . . . . . . . . . . . . . . . . . . . . . . . . . . . . . . . . . . . . . . . . F-27
4. Film costs . . . . . . . . . . . . . . . . . . . . . . . . . . . . . . . . . . . . . . . . . . . . . . . . . . . . . . . . . . . . . . . . . . . . . . . . F-27
5. Related party transactions . . . . . . . . . . . . . . . . . . . . . . . . . . . . . . . . . . . . . . . . . . . . . . . . . . . . . . . . . . . . F-28
6. Transfer of financial assets . . . . . . . . . . . . . . . . . . . . . . . . . . . . . . . . . . . . . . . . . . . . . . . . . . . . . . . . . . . F-31
7. Marketable securities and securities investments . . . . . . . . . . . . . . . . . . . . . . . . . . . . . . . . . . . . . . . . . . F-33
8. Leased assets . . . . . . . . . . . . . . . . . . . . . . . . . . . . . . . . . . . . . . . . . . . . . . . . . . . . . . . . . . . . . . . . . . . . . . F-35
9. Goodwill and intangible assets . . . . . . . . . . . . . . . . . . . . . . . . . . . . . . . . . . . . . . . . . . . . . . . . . . . . . . . . F-37
10. Insurance-related accounts . . . . . . . . . . . . . . . . . . . . . . . . . . . . . . . . . . . . . . . . . . . . . . . . . . . . . . . . . . . F-39
11. Short-term borrowings and long-term debt . . . . . . . . . . . . . . . . . . . . . . . . . . . . . . . . . . . . . . . . . . . . . . F-41
12. Housing loans and deposits from customers in the banking business . . . . . . . . . . . . . . . . . . . . . . . . . . F-42
13. Fair value measurements . . . . . . . . . . . . . . . . . . . . . . . . . . . . . . . . . . . . . . . . . . . . . . . . . . . . . . . . . . . . F-43
14. Derivative instruments and hedging activities . . . . . . . . . . . . . . . . . . . . . . . . . . . . . . . . . . . . . . . . . . . . F-49
15. Pension and severance plans . . . . . . . . . . . . . . . . . . . . . . . . . . . . . . . . . . . . . . . . . . . . . . . . . . . . . . . . . . F-53
16. Stockholders’ equity . . . . . . . . . . . . . . . . . . . . . . . . . . . . . . . . . . . . . . . . . . . . . . . . . . . . . . . . . . . . . . . . F-62
17. Stock-based compensation plans . . . . . . . . . . . . . . . . . . . . . . . . . . . . . . . . . . . . . . . . . . . . . . . . . . . . . . F-65
18. Great East Japan Earthquake and Thai Floods . . . . . . . . . . . . . . . . . . . . . . . . . . . . . . . . . . . . . . . . . . . . F-67
19. Restructuring charges and asset impairments . . . . . . . . . . . . . . . . . . . . . . . . . . . . . . . . . . . . . . . . . . . . . F-68
20. Supplemental consolidated statements of income information . . . . . . . . . . . . . . . . . . . . . . . . . . . . . . . F-74
21. Income taxes . . . . . . . . . . . . . . . . . . . . . . . . . . . . . . . . . . . . . . . . . . . . . . . . . . . . . . . . . . . . . . . . . . . . . . F-75
22. Reconciliation of the differences between basic and diluted EPS . . . . . . . . . . . . . . . . . . . . . . . . . . . . . F-80
23. Variable interest entities . . . . . . . . . . . . . . . . . . . . . . . . . . . . . . . . . . . . . . . . . . . . . . . . . . . . . . . . . . . . . F-80
24. Acquisitions . . . . . . . . . . . . . . . . . . . . . . . . . . . . . . . . . . . . . . . . . . . . . . . . . . . . . . . . . . . . . . . . . . . . . . F-83
25. Divestitures . . . . . . . . . . . . . . . . . . . . . . . . . . . . . . . . . . . . . . . . . . . . . . . . . . . . . . . . . . . . . . . . . . . . . . . F-90
26. Collaborative arrangements . . . . . . . . . . . . . . . . . . . . . . . . . . . . . . . . . . . . . . . . . . . . . . . . . . . . . . . . . . F-91
27. Commitments, contingent liabilities and other . . . . . . . . . . . . . . . . . . . . . . . . . . . . . . . . . . . . . . . . . . . . F-91
28. Business segment information . . . . . . . . . . . . . . . . . . . . . . . . . . . . . . . . . . . . . . . . . . . . . . . . . . . . . . . . F-94
F-13
SONY CORPORATION AND CONSOLIDATED SUBSIDIARIES
Notes to Consolidated Financial StatementsSony Corporation and Consolidated Subsidiaries
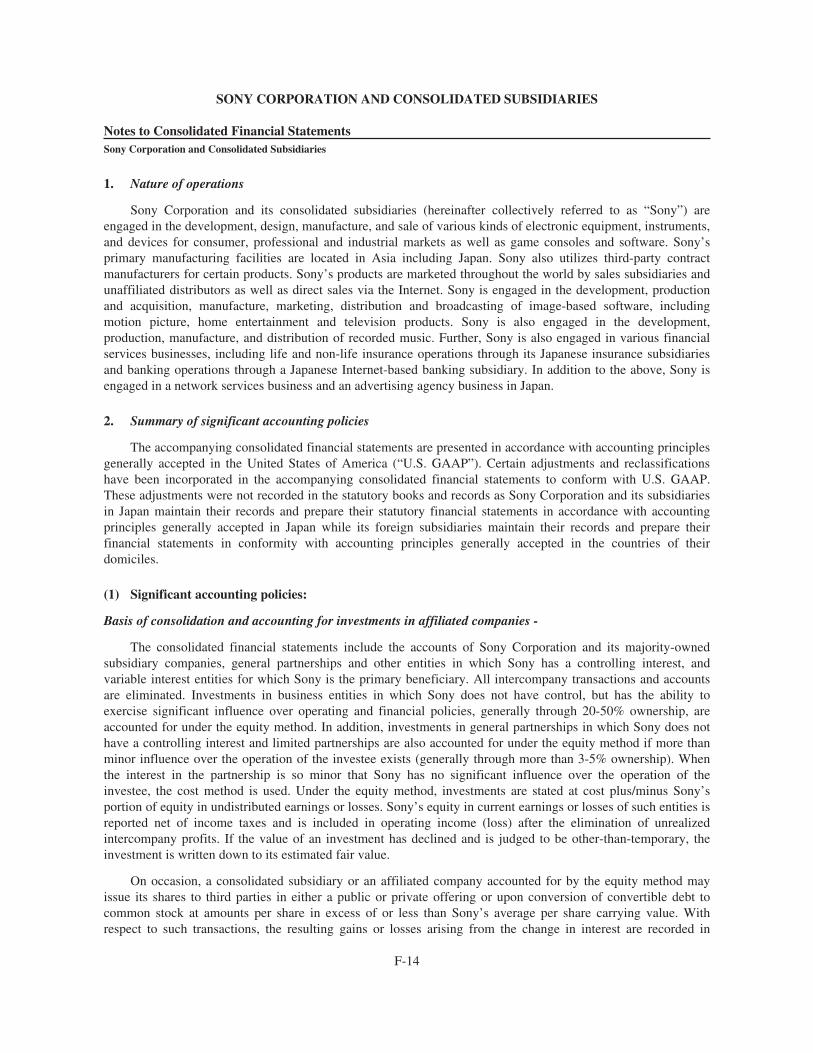
1. Nature of operations
Sony Corporation and its consolidated subsidiaries (hereinafter collectively referred to as “Sony”) areengaged in the development, design, manufacture, and sale of various kinds of electronic equipment, instruments,and devices for consumer, professional and industrial markets as well as game consoles and software. Sony’sprimary manufacturing facilities are located in Asia including Japan. Sony also utilizes third-party contractmanufacturers for certain products. Sony’s products are marketed throughout the world by sales subsidiaries andunaffiliated distributors as well as direct sales via the Internet. Sony is engaged in the development, productionand acquisition, manufacture, marketing, distribution and broadcasting of image-based software, includingmotion picture, home entertainment and television products. Sony is also engaged in the development,production, manufacture, and distribution of recorded music. Further, Sony is also engaged in various financialservices businesses, including life and non-life insurance operations through its Japanese insurance subsidiariesand banking operations through a Japanese Internet-based banking subsidiary. In addition to the above, Sony isengaged in a network services business and an advertising agency business in Japan.
2. Summary of significant accounting policies
The accompanying consolidated financial statements are presented in accordance with accounting principlesgenerally accepted in the United States of America (“U.S. GAAP”). Certain adjustments and reclassificationshave been incorporated in the accompanying consolidated financial statements to conform with U.S. GAAP.These adjustments were not recorded in the statutory books and records as Sony Corporation and its subsidiariesin Japan maintain their records and prepare their statutory financial statements in accordance with accountingprinciples generally accepted in Japan while its foreign subsidiaries maintain their records and prepare theirfinancial statements in conformity with accounting principles generally accepted in the countries of theirdomiciles.
(1) Significant accounting policies:
Basis of consolidation and accounting for investments in affiliated companies -
The consolidated financial statements include the accounts of Sony Corporation and its majority-ownedsubsidiary companies, general partnerships and other entities in which Sony has a controlling interest, andvariable interest entities for which Sony is the primary beneficiary. All intercompany transactions and accountsare eliminated. Investments in business entities in which Sony does not have control, but has the ability toexercise significant influence over operating and financial policies, generally through 20-50% ownership, areaccounted for under the equity method. In addition, investments in general partnerships in which Sony does nothave a controlling interest and limited partnerships are also accounted for under the equity method if more thanminor influence over the operation of the investee exists (generally through more than 3-5% ownership). Whenthe interest in the partnership is so minor that Sony has no significant influence over the operation of theinvestee, the cost method is used. Under the equity method, investments are stated at cost plus/minus Sony’sportion of equity in undistributed earnings or losses. Sony’s equity in current earnings or losses of such entities isreported net of income taxes and is included in operating income (loss) after the elimination of unrealizedintercompany profits. If the value of an investment has declined and is judged to be other-than-temporary, theinvestment is written down to its estimated fair value.
On occasion, a consolidated subsidiary or an affiliated company accounted for by the equity method mayissue its shares to third parties in either a public or private offering or upon conversion of convertible debt tocommon stock at amounts per share in excess of or less than Sony’s average per share carrying value. Withrespect to such transactions, the resulting gains or losses arising from the change in interest are recorded in
F-14
SONY CORPORATION AND CONSOLIDATED SUBSIDIARIES
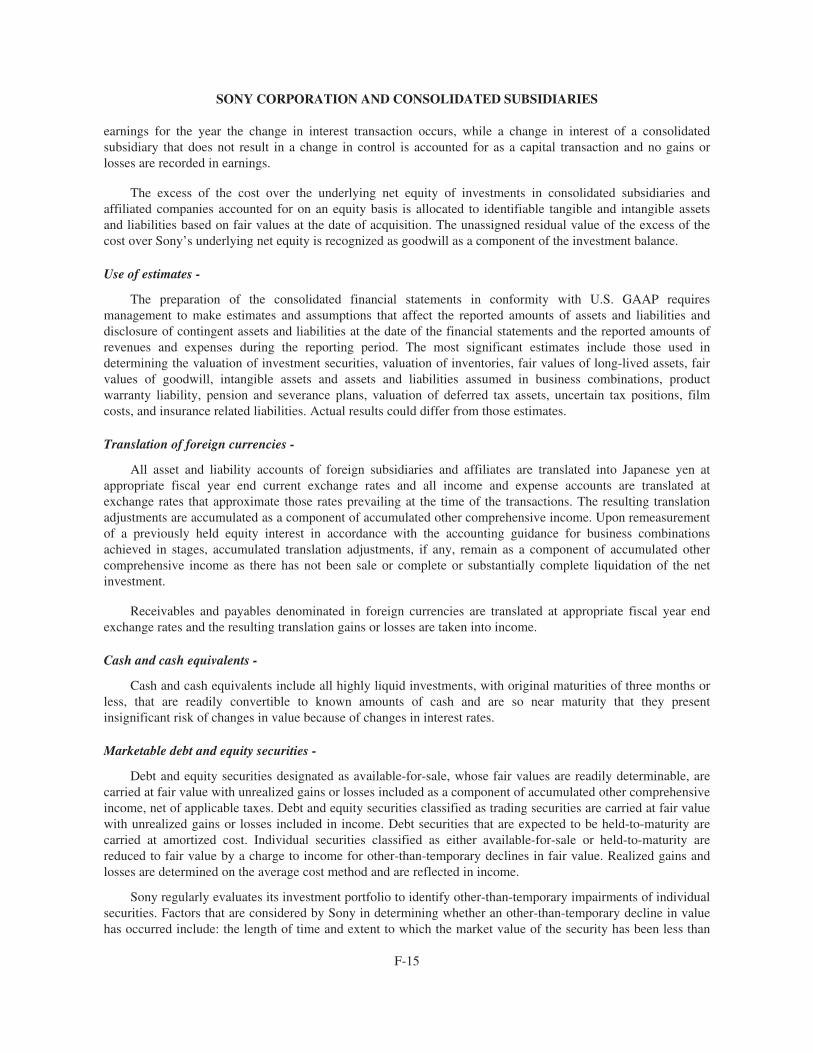
earnings for the year the change in interest transaction occurs, while a change in interest of a consolidatedsubsidiary that does not result in a change in control is accounted for as a capital transaction and no gains orlosses are recorded in earnings.
The excess of the cost over the underlying net equity of investments in consolidated subsidiaries andaffiliated companies accounted for on an equity basis is allocated to identifiable tangible and intangible assetsand liabilities based on fair values at the date of acquisition. The unassigned residual value of the excess of thecost over Sony’s underlying net equity is recognized as goodwill as a component of the investment balance.
Use of estimates -
The preparation of the consolidated financial statements in conformity with U.S. GAAP requiresmanagement to make estimates and assumptions that affect the reported amounts of assets and liabilities anddisclosure of contingent assets and liabilities at the date of the financial statements and the reported amounts ofrevenues and expenses during the reporting period. The most significant estimates include those used indetermining the valuation of investment securities, valuation of inventories, fair values of long-lived assets, fairvalues of goodwill, intangible assets and assets and liabilities assumed in business combinations, productwarranty liability, pension and severance plans, valuation of deferred tax assets, uncertain tax positions, filmcosts, and insurance related liabilities. Actual results could differ from those estimates.
Translation of foreign currencies -
All asset and liability accounts of foreign subsidiaries and affiliates are translated into Japanese yen atappropriate fiscal year end current exchange rates and all income and expense accounts are translated atexchange rates that approximate those rates prevailing at the time of the transactions. The resulting translationadjustments are accumulated as a component of accumulated other comprehensive income. Upon remeasurementof a previously held equity interest in accordance with the accounting guidance for business combinationsachieved in stages, accumulated translation adjustments, if any, remain as a component of accumulated othercomprehensive income as there has not been sale or complete or substantially complete liquidation of the netinvestment.
Receivables and payables denominated in foreign currencies are translated at appropriate fiscal year endexchange rates and the resulting translation gains or losses are taken into income.
Cash and cash equivalents -
Cash and cash equivalents include all highly liquid investments, with original maturities of three months orless, that are readily convertible to known amounts of cash and are so near maturity that they presentinsignificant risk of changes in value because of changes in interest rates.
Marketable debt and equity securities -
Debt and equity securities designated as available-for-sale, whose fair values are readily determinable, arecarried at fair value with unrealized gains or losses included as a component of accumulated other comprehensiveincome, net of applicable taxes. Debt and equity securities classified as trading securities are carried at fair valuewith unrealized gains or losses included in income. Debt securities that are expected to be held-to-maturity arecarried at amortized cost. Individual securities classified as either available-for-sale or held-to-maturity arereduced to fair value by a charge to income for other-than-temporary declines in fair value. Realized gains andlosses are determined on the average cost method and are reflected in income.
Sony regularly evaluates its investment portfolio to identify other-than-temporary impairments of individualsecurities. Factors that are considered by Sony in determining whether an other-than-temporary decline in valuehas occurred include: the length of time and extent to which the market value of the security has been less than
F-15
SONY CORPORATION AND CONSOLIDATED SUBSIDIARIES
its original cost, the financial condition, operating results, business plans and estimated future cash flows of theissuer of the security, other specific factors affecting the market value, deterioration of the credit condition of theissuers, sovereign risk, and whether or not Sony is able to retain the investment for a period of time sufficient toallow for the anticipated recovery in market value.
In evaluating the factors for available-for-sale securities whose fair values are readily determinable, Sonypresumes a decline in value to be other-than-temporary if the fair value of the security is 20 percent or morebelow its original cost for an extended period of time (generally for a period of up to six months). This criterionis employed as a threshold to identify securities which may have a decline in value that is other-than-temporary.The presumption of an other-than-temporary impairment in such cases may be overcome if there is evidence tosupport that the decline is temporary in nature due to the existence of other factors which overcome the durationor magnitude of the decline. On the other hand, there may be cases where impairment losses are recognized whenthe decline in the fair value of the security is not more than 20 percent or such decline has not existed for anextended period of time, as a result of considering specific factors which may indicate the decline in the fairvalue is other-than-temporary.
When an other-than-temporary impairment of a debt security has occurred, the amount of the other-than-temporary impairment recognized in income depends on whether Sony intends to sell the security or more likelythan not will be required to sell the security before recovery of its amortized cost. If the debt security meets eitherof these two criteria, the other-than-temporary impairment is recognized in income, measured as the entiredifference between the security’s amortized cost and its fair value at the impairment measurement date. Forother-than-temporary impairments of debt securities that do not meet these two criteria, the net amountrecognized in income is a credit loss equal to the difference between the amortized cost of the debt security andits net present value calculated by discounting Sony’s best estimate of projected future cash flows at the effectiveinterest rate implicit in the debt security prior to impairment. Any difference between the fair value and the netpresent value of the debt security at the impairment measurement date is recorded in accumulated othercomprehensive income. Unrealized gains or losses on securities for which an other-than-temporary impairmenthas been recognized in income are presented as a separate component of accumulated other comprehensiveincome.
Equity securities in non-public companies -
Equity securities in non-public companies are primarily carried at cost if fair value is not readilydeterminable. If the carrying value of a non-public equity investment is estimated to have declined and suchdecline is judged to be other-than-temporary, Sony recognizes the impairment of the investment and the carryingvalue is reduced to its fair value. Determination of impairment is based on the consideration of several factors,including operating results, business plans and estimated future cash flows. Fair value is determined through theuse of various methodologies such as discounted cash flows, valuation of recent financings and comparablevaluations of similar companies.
Allowance for doubtful accounts -
Sony maintains an allowance for doubtful accounts to reserve for potentially uncollectible receivables. Sonyreviews accounts receivable by amounts due by customers which are past due to identify specific customers withknown disputes or collectability issues. In determining the amount of the reserve, Sony makes judgments aboutthe creditworthiness of customers based on past collection experience and ongoing credit risk evaluations.
Inventories -
Inventories in the Consumer Products & Services, Professional, Device & Solutions and Music segments aswell as non-film inventories for the Pictures segment are valued at cost, not in excess of market, cost beingdetermined on the “average cost” basis except for the cost of finished products carried by certain subsidiary
F-16
SONY CORPORATION AND CONSOLIDATED SUBSIDIARIES
companies which is determined on the “first-in, first-out” basis, including the inventories in the Sony MobileCommunications segment. The market value of inventory is determined as the net realizable value - i.e.,estimated selling price in the ordinary course of business less predictable costs of completion and disposal. Sonydoes not consider a normal profit margin when calculating the net realizable value.
Other receivables -
Other receivables include receivables which relate to arrangements with certain component manufacturerswhereby Sony procures goods, including product components, for these component manufacturers and isreimbursed for the related purchases. No revenue or profit is recognized on these transfers. Sony usually willrepurchase the inventory at a later date from the component manufacturers as either finished goods inventory oras partially assembled product.
Film costs -
Film costs include direct production costs, production overhead and acquisition costs for both motionpicture and television productions and are stated at the lower of unamortized cost or estimated fair value andclassified as noncurrent assets. Film costs are amortized and the estimated liabilities for residuals andparticipations are accrued using an individual-film-forecast method based on the ratio of current period actualrevenues to the estimated remaining total revenues. Film costs also include broadcasting rights which consist ofacquired programming to be aired on Sony’s worldwide channel network and are recognized when the licenseperiod begins and the program is available for use. Broadcasting rights are stated at the lower of unamortizedcost or net realizable value, classified as either current or noncurrent assets based on timing of expected use, andamortized based on estimated usage or on a straight-line basis over the useful life, as appropriate. Estimates usedin calculating the fair value of the film costs and the net realizable value of the broadcasting rights are basedupon assumptions about future demand and market conditions and are reviewed on a periodic basis.
Property, plant and equipment and depreciation -
Property, plant and equipment are stated at cost. Depreciation of property, plant and equipment is computedon the declining-balance method for Sony Corporation and its Japanese subsidiaries, except for certainsemiconductor manufacturing facilities and buildings whose depreciation is computed on the straight-line methodover the estimated useful life of the assets. Depreciation of property, plant and equipment for foreign subsidiariesis also computed on the straight-line method. Useful lives for depreciation range from two to 50 years forbuildings and from two to 10 years for machinery and equipment. Significant renewals and additions arecapitalized at cost. Maintenance and repairs, and minor renewals and betterments are charged to income asincurred.
Goodwill and other intangible assets -
Goodwill and certain other intangible assets that are determined to have an indefinite useful life are notamortized and are tested annually for impairment during the fourth quarter of the fiscal year and between annualtests if an event occurs or circumstances change that would more likely than not reduce the fair value below itscarrying amount. Goodwill impairment is determined using a two-step process. The first step of the goodwillimpairment test is used to identify potential impairment by comparing the fair value of a reporting unit with itscarrying amount, including goodwill. Reporting units are Sony’s operating segments or one level below theoperating segments. If the fair value of a reporting unit exceeds its carrying amount, goodwill of the reportingunit is considered not impaired and the second step of the impairment test is not performed. If the carryingamount of a reporting unit exceeds its fair value, the second step of the goodwill impairment test is performed tomeasure the amount of impairment loss, if any. The second step of the goodwill impairment test compares theimplied fair value of the reporting unit’s goodwill with the carrying amount of that goodwill. If the carryingamount of the reporting unit’s goodwill exceeds the implied fair value of that goodwill, an impairment loss is
F-17
SONY CORPORATION AND CONSOLIDATED SUBSIDIARIES
recognized in an amount equal to that excess. Fair value of reporting units and indefinite lived intangible assets isgenerally determined using a discounted cash flow analysis. This approach uses significant estimates andassumptions including projected future cash flows, the timing of such cash flows, discount rates reflecting therisk inherent in future cash flows, perpetual growth rates, determination of appropriate comparable entities andthe determination of whether a premium or discount should be applied to comparables. In addition to theestimates of future cash flows, two of the most significant estimates involved in the determination of fair value ofthe reporting units are the discount rates and perpetual growth rate applied to terminal values used in thediscounted cash flow analysis. The discount rates used in the cash flow models for the goodwill impairmenttesting consider market and industry data as well as specific risk factors for each reporting unit. The perpetualgrowth rates for the individual reporting units, for purposes of the terminal value determination, are generally setafter an initial three-year forecasted period, although certain reporting units utilized longer forecasted periods,and are based on historical experience, market and industry data.
Intangible assets with finite useful lives mainly consist of patent rights, know-how, license agreements,customer relationships, trademarks, software to be sold, leased or otherwise marketed, music catalogs, artistcontracts and television carriage agreements (broadcasting agreements). Patent rights, know-how, licenseagreements, trademarks and software to be sold, leased or otherwise marketed are generally amortized on astraight-line basis, generally, over three to eight years. Customer relationships, music catalogs, artist contractsand television carriage agreements (broadcasting agreements) are amortized on a straight-line basis, generally,over 10 to 40 years.
Software to be sold, leased, or marketed -
Sony accounts for software development costs in accordance with accounting guidance for the costs ofsoftware to be sold, leased, or marketed. The costs related to establishing the technological feasibility of asoftware product are expensed as incurred as a part of research and development in cost of sales. Costs that areincurred to produce the finished product after technological feasibility is established are capitalized andamortized to cost of sales over the estimated economic life, which is generally three years. The technologicalfeasibility of game software is established when the product master is completed. Consideration to capitalizegame software development costs before this point is limited to the development costs of games for whichtechnological feasibility can be proven to be at an earlier stage. At each balance sheet date, Sony performsperiodic reviews to ensure that unamortized capitalized software costs remain recoverable from future profits ofthe related software products.
Deferred insurance acquisition costs -
Costs that vary with and are primarily related to acquiring new insurance policies are deferred as long asthey are recoverable. The deferred insurance acquisition costs include such items as commissions, medicalexamination costs and inspection report fees, and are subject to recoverability testing at least annually to ensurethat the capitalized amounts do not exceed the present value of anticipated gross profits or premiums less benefitsand maintenance expenses, as applicable. The deferred insurance acquisition costs for traditional life insurancecontracts are amortized over the premium-paying period of the related insurance policies using assumptionsconsistent with those used in computing policy reserves. The deferred insurance acquisition costs fornon-traditional life insurance contracts are amortized over the expected life in proportion to the estimated grossprofits.
Product warranty -
Sony provides for the estimated cost of product warranties at the time revenue is recognized. The productwarranty is calculated based upon product sales, estimated probability of failure and estimated cost per claim.The variables used in the calculation of the provision are reviewed on a periodic basis.
F-18
SONY CORPORATION AND CONSOLIDATED SUBSIDIARIES
Certain subsidiaries in the Consumer Products & Services and Professional, Device & Solutions segmentsoffer extended warranty programs. The consideration received for extended warranty service is deferred andrecognized as revenue on a straight-line basis over the term of the extended warranty.
Future insurance policy benefits -
Liabilities for future insurance policy benefits are primarily comprised of the present value of estimatedfuture payments to policyholders. These liabilities are computed by the net level premium method based upon theassumptions, including future investment yield, morbidity, mortality, withdrawals and other factors. Theseassumptions are reviewed on a periodic basis. Liabilities for future insurance policy benefits also includeliabilities for guaranteed benefits related to certain non-traditional life and annuity contracts.
Policyholders’ account in the life insurance business -
Liabilities for policyholders’ account in the life insurance business represent the contract value that hasaccrued to the benefit of the policyholders as of the balance sheet date. This liability is generally equal to theaccumulated account deposits, plus interest credited, less policyholder withdrawals and other charges assessedagainst the account balances.
Impairment of long-lived assets -
Sony reviews the recoverability of the carrying value of its long-lived assets held and used, other thangoodwill and intangible assets with indefinite lives, and assets to be disposed of, whenever events or changes incircumstances indicate that the individual carrying amount of an asset or asset group may not be recoverable.Long-lived assets to be held and used are reviewed for impairment by comparing the carrying value of the assetor asset group with their estimated undiscounted future cash flows. If the cash flows are determined to be lessthan the carrying value of the asset or asset group, an impairment loss has occurred and the loss would berecognized during the period for the difference between the carrying value of the asset or asset group andestimated fair value. Long-lived assets that are to be disposed of other than by sale are considered held and useduntil they are disposed of. Long-lived assets that are to be disposed of by sale are reported at the lower of theircarrying value or fair value less cost to sell and are not depreciated. Fair value is determined using the presentvalue of estimated net cash flows or comparable market values. This approach uses significant estimates andassumptions including projected future cash flows, the timing of such cash flows, discount rates reflecting therisk inherent in future cash flows, perpetual growth rates applied to determine terminal values, determination ofappropriate market comparables and the determination of whether a premium or discount should be applied tocomparables.
Fair value measurement -
Sony measures fair value as an exit price, or the amount that would be received to sell an asset or paid totransfer a liability in an orderly transaction between market participants as of the measurement date.
F-19
SONY CORPORATION AND CONSOLIDATED SUBSIDIARIES
The accounting guidance for fair value measurements specifies a hierarchy of inputs to valuation techniquesbased on the extent to which inputs used in measuring fair value are observable in the market. Observable inputsreflect market data obtained from independent sources, while unobservable inputs reflect Sony’s assumptionsabout the assumptions that market participants would use in pricing the asset or liability. Observable market datais used if such data is available without undue cost and effort. Each fair value measurement is reported in one ofthree levels which is determined by the lowest level input that is significant to the fair value measurement in itsentirety. These levels are:
Level 1 — Inputs are unadjusted quoted prices for identical assets and liabilities in active markets.
Level 2 — Inputs are based on observable inputs other than level 1 prices, such as quoted prices forsimilar instruments in active markets, quoted prices for identical or similar instruments inmarkets that are not active and model-derived valuations, in which all significant inputs areobservable in active markets.
Level 3 — One or more significant inputs are unobservable.
When available, Sony uses unadjusted quoted market prices in active markets to measure fair value andclassifies such items within level 1. If quoted market prices are not available, fair value is based upon internallydeveloped valuation techniques that use, where possible, current market-based or independently sourced marketparameters, such as interest rates, currency rates and option volatilities. Items valued using internally generatedmodels are classified according to the lowest level input that is significant to the valuation. For certain financialassets and liabilities, Sony determines fair value using third-party information such as indicative quotes fromdealers and quantitative input from investment advisors following Sony’s established valuation proceduresincluding validation against internally developed prices. Additionally, Sony considers both counterparty creditrisk and Sony’s own creditworthiness in determining fair value. Sony attempts to mitigate credit risk to thirdparties by entering into netting agreements and actively monitoring the creditworthiness of counterparties and itsexposure to credit risk through the use of credit limits and by selecting major international banks and financialinstitutions as counterparties.
Transfers between levels are deemed to have occurred at the beginning of the each interim period in whichthe transfers occur.
Derivative financial instruments -
All derivatives are recognized as either assets or liabilities in the consolidated balance sheets at fair value.Changes in the fair value of derivative financial instruments are either recognized periodically in income orstockholders’ equity (as a component of accumulated other comprehensive income), depending on whether thederivative financial instrument qualifies as a hedge and the derivative is being used to hedge changes in fair valueor cash flows.
The accounting guidance for hybrid financial instruments permits an entity to elect fair valueremeasurement for any hybrid financial instrument if the hybrid instrument contains an embedded derivative thatwould otherwise be required to be bifurcated and accounted for separately under accounting guidance forderivative instruments and hedging activities. The election to measure the hybrid instrument at fair value is madeon an instrument-by-instrument basis and is irreversible. Certain subsidiaries in the Financial Services segmenthave hybrid financial instruments, disclosed in Note 7 as debt securities, that contain embedded derivativeswhere the entire instrument is carried at fair value.
In accordance with accounting guidance for derivative instruments and hedging activities, the variousderivative financial instruments held by Sony are classified and accounted for as described below.
F-20
SONY CORPORATION AND CONSOLIDATED SUBSIDIARIES
Fair value hedges
Changes in the fair value of derivatives designated and effective as fair value hedges for recognized assetsor liabilities or unrecognized firm commitments are recognized in earnings as offsets to changes in the fair valueof the related hedged assets or liabilities.
Cash flow hedges
Changes in the fair value of derivatives designated and effective as cash flow hedges for forecastedtransactions or exposures associated with recognized assets or liabilities are initially recorded in othercomprehensive income and reclassified into earnings when the hedged transaction affects earnings. Changes inthe fair value of the ineffective portion are recognized in current period earnings.
Derivatives not designated as hedges
Changes in the fair value of derivatives that are not designated as hedges are recognized in current periodearnings.
Assessment of hedges
When applying hedge accounting, Sony formally documents all hedging relationships between thederivatives designated as hedges and the hedged items, as well as its risk management objectives and strategiesfor undertaking various hedging activities. Sony links all hedges that are designated as fair value or cash flowhedges to specific assets or liabilities on the consolidated balance sheets or to the specific forecasted transactions.Sony also assesses, both at the inception of the hedge and on an on-going basis, whether the derivatives that aredesignated as hedges are highly effective in offsetting changes in fair value or cash flows of hedged items. Whenit is determined that a derivative is not highly effective as a hedge, Sony discontinues hedge accounting. Hedgeineffectiveness, if any, is included in the current period earnings.
Stock-based compensation -
Sony accounts for stock-based compensation using the fair value based method, measured on the date ofgrant using the Black-Scholes option-pricing model. The expense is mainly included in selling, general andadministrative expenses. Sony recognizes this compensation expense, net of an estimated forfeiture rate, only forthe rights expected to vest ratably over the requisite service period of the stock acquisition rights, which isgenerally a period of three years. The estimated forfeiture rate is based on Sony’s historical experience in thestock acquisition rights plans where the majority of the vesting terms have been satisfied.
Revenue recognition -
Revenues from sales in the Consumer Products & Services, Professional, Device & Solutions, Music andSony Mobile Communications segments are recognized when persuasive evidence of an arrangement exists,delivery has occurred or services have been rendered, the sales price is fixed or determinable, and collectability isreasonably assured. Delivery is considered to have occurred when the customer has taken title to the product andthe risks and rewards of ownership have been substantively transferred. If the sales contract contains a customeracceptance provision, then sales are recognized after customer acceptance occurs or the acceptance provisionslapse. Revenues are recognized net of anticipated returns and sales incentives.
Revenue arrangements with customers may include multiple elements, including any combination ofproducts, services and software. An example includes sales of electronics products with rights to receivepromotional goods. For Sony’s multiple element arrangements where at least one of the elements is not subject toexisting software revenue recognition guidance, elements are separated into more than one unit of accountingwhen the delivered element(s) have value to the customer on a standalone basis, and delivery of the undelivered
F-21
SONY CORPORATION AND CONSOLIDATED SUBSIDIARIES
element(s) is probable and substantially in the control of Sony. Revenue is then allocated to each unit ofaccounting based on the relative selling price of each unit of accounting based first on vendor-specific objectiveevidence of selling price (“VSOE”) if it exists, based next on third-party evidence of selling price (“TPE”) ifVSOE does not exist, and, finally, if both VSOE and TPE do not exist, based on estimated selling prices (“ESP”).VSOE is limited to either the price charged for an element when it is sold separately or, for an element not yetbeing sold separately, the price established by management having the relevant authority; it must be probable thatthe price, once established, will not change before the separate introduction of the element into the market place.TPE is the price of Sony’s or any competitor’s largely interchangeable products or services in standalone sales tosimilarly situated customers. ESP is the price at which Sony would transact if the element were sold by Sonyregularly on a standalone basis. When determining ESP, Sony considers all relevant inputs, including sales, costand margin analysis of the product, targeted rate of return of the product, competitors’ and Sony’s pricingpractices and customer perspectives.
Certain software products published by Sony provide limited on-line features at no additional cost to thecustomer. Generally, such features are considered to be incidental to the overall software product and aninconsequential deliverable. Accordingly, revenue related to software products containing these limited on-linefeatures is not deferred. In instances where the software products’ on-line features or additional functionality isconsidered a substantive deliverable in addition to the software product, revenue and costs of sales arerecognized ratably over an estimated service period, which is estimated to be six months.
Revenues from the theatrical exhibition of motion pictures are recognized as the customer exhibits the film.Revenues from the licensing of motion picture and television product are recorded when the product is availablefor exploitation by the licensee and when any restrictions regarding the use of the product lapse. Revenues fromthe sale of DVDs and Blu-ray Disc™, net of anticipated returns and sales incentives, are recognized uponavailability of sale to the public. Revenues from the sale of broadcast advertising are recognized when theadvertisement is aired. Revenues from subscription fees received by the television networks are recognized whenthe service is provided.
Traditional life insurance policies that the life insurance subsidiary underwrites, most of which arecategorized as long-duration contracts, mainly consist of whole life, term life and accident and health insurancecontracts. Premiums from these policies are reported as revenue when due from policyholders.
Amounts received as payment for non-traditional contracts such as interest sensitive whole life contracts,single payment juvenile contracts and other contracts without life contingencies are recognized in policyholders’account in the life insurance business. Revenues from these contracts are comprised of fees earned foradministrative and contract-holder services, which are recognized over the period of the contracts, and includedin financial services revenue.
Property and casualty insurance policies that the non-life insurance subsidiary underwrites are primarilyautomotive insurance contracts which are categorized as short-duration contracts. Premiums from these policiesare reported as revenue over the period of the contract in proportion to the amount of insurance protectionprovided.
Revenue is recognized net of any taxes collected from customers and subsequently remitted to governmentalauthorities.
Consideration given to a customer or a reseller -
In accordance with the accounting guidance for consideration given by a vendor to a customer or reseller ofthe vendor’s products, sales incentives or other cash consideration given to a customer or a reseller includingpayments for buydowns, slotting fees and cooperative advertising programs, are accounted for as a reduction ofrevenue unless Sony receives an identifiable benefit (goods or services) in exchange for the consideration, thefair value of the benefit is reasonably estimated and documentation from the reseller is received to support theamounts paid to the reseller. Payments meeting these criteria are recorded as selling, general and administrative
F-22
SONY CORPORATION AND CONSOLIDATED SUBSIDIARIES
expenses. For the fiscal years ended March 31, 2010, 2011 and 2012, consideration given to a reseller, primarilyfor free promotional shipping and cooperative advertising programs included in selling, general andadministrative expenses totaled 23,591 million yen, 23,250 million yen and 17,641 million yen, respectively.
Cost of sales -
Costs classified as cost of sales relate to the producing and manufacturing of products and include itemssuch as material cost, subcontractor cost, depreciation of fixed assets, amortization of intangible assets, personnelexpenses, research and development costs, and amortization of film costs related to motion picture and televisionproducts.
Research and development costs -
Research and development costs, included in cost of sales, include items such as salaries, personnelexpenses and other direct and indirect expenses associated with research and product development. Research anddevelopment costs are expensed as incurred.
Selling, general and administrative -
Costs classified as selling expense relate to promoting and selling products and include items such asadvertising, promotion, shipping, and warranty expenses. General and administrative expenses include operatingitems such as officers’ salaries, personnel expenses, depreciation of fixed assets, office rental for sales, marketingand administrative divisions, a provision for doubtful accounts and amortization of intangible assets.
Financial services expenses -
Financial services expenses include a provision for policy reserves and amortization of deferred insuranceacquisition costs, and all other operating costs such as personnel expenses, depreciation of fixed assets, andoffice rental of subsidiaries in the Financial Services segment.
Advertising costs -
Advertising costs are expensed when the advertisement or commercial appears in the selected media.
Shipping and handling costs -
The majority of shipping and handling, warehousing and internal transfer costs for finished goods areincluded in selling, general and administrative expenses. An exception to this is in the Pictures segment wheresuch costs are charged to cost of sales as they are an integral part of producing and distributing films underaccounting guidance for accounting by producers or distributors of films. All other costs related to Sony’sdistribution network are included in cost of sales, including inbound freight charges, purchasing and receivingcosts, inspection costs and warehousing costs for raw materials and in-process inventory. Amounts paid bycustomers for shipping and handling costs are included in net sales.
Income taxes -
The provision for income taxes is computed based on the pretax income included in the consolidatedstatements of income, and the tax liability attributed to undistributed earnings of subsidiaries and affiliatedcompanies accounted for by the equity method expected to be remitted in the foreseeable future. The asset andliability approach is used to recognize deferred tax assets and liabilities for the expected future tax consequencesof temporary differences between the carrying amounts and the tax bases of assets and liabilities.
F-23
SONY CORPORATION AND CONSOLIDATED SUBSIDIARIES
Carrying amounts of deferred tax assets require a reduction by a valuation allowance if, based on theavailable evidence, it is more likely than not that such assets will not be realized. Accordingly, the need toestablish valuation allowances for deferred tax assets is assessed periodically with appropriate considerationgiven to all positive and negative evidence related to the realization of the deferred tax assets. Management’sjudgments related to this assessment consider, among other matters, the nature, frequency and severity of currentand cumulative losses on an individual tax jurisdiction basis, forecasts of future profitability after considerationof uncertain tax positions, excess of appreciated asset value over the tax basis of net assets, the duration ofstatutory carryforward periods, the past utilization of net operating loss carryforwards prior to expiration, as wellas prudent and feasible tax planning strategies which would be employed by Sony to prevent net operating lossand tax credit carryforwards from expiring unutilized.
Sony records assets and liabilities for unrecognized tax benefits resulting from uncertain tax positions takenor expected to be taken in a tax return. Sony continues to recognize interest and penalties, if any, with respect toincome taxes, including unrecognized tax benefits, as interest expense and as income tax expense, respectively,in the consolidated statements of income. The amount of income taxes Sony pays is subject to ongoing audits byvarious taxing authorities, which may result in proposed assessments. In addition, several significant itemsrelated to intercompany transfer pricing are currently the subject of negotiations between taxing authorities indifferent jurisdictions as a result of pending advance pricing agreement applications and competent authorityrequests. Sony’s estimate for the potential outcome for any uncertain tax issues is judgmental and requiressignificant estimates. Sony assesses its income tax positions and records tax benefits for all years subject toexaminations based upon the evaluation of the facts, circumstances and information available at that reportingdate. For those tax positions for which it is more likely than not that a tax benefit will be sustained, Sony recordsthe amount that has a greater than 50% likelihood of being realized upon settlement with a taxing authority thathas full knowledge of all relevant information. If Sony does not believe that it is more likely than not that a taxbenefit will be sustained, no tax benefit is recognized. However, Sony’s future results may include favorable orunfavorable adjustments to Sony’s estimated tax liabilities due to closure of income tax examinations, theoutcome of negotiations between taxing authorities in different jurisdictions, new regulatory or judicialpronouncements or other relevant events. As a result, the amount of unrecognized tax benefits, and the effectivetax rate, may fluctuate significantly.
Net income (loss) attributable to Sony Corporation’s stockholders per share (“EPS”) -
Basic EPS is computed based on the weighted-average number of shares of common stock outstandingduring each period. The computation of diluted EPS reflects the maximum possible dilution from conversion,exercise, or contingent issuance of securities including the conversion of contingently convertible debtinstruments regardless of whether the conditions to exercise the conversion rights have been met. All potentiallydilutive securities are excluded from the calculation in a situation where there is a net loss attributable to SonyCorporation’s stockholders.
(2) Recently adopted accounting pronouncements:
Goodwill impairment testing for reporting units with zero or negative carrying amounts -
In December 2010, the Financial Accounting Standards Board (“FASB”) issued new accounting guidancethat modifies the first step of the goodwill impairment test for reporting units with zero or negative carryingamounts. For those reporting units, an entity is required to perform the second step of the goodwill impairmenttest if it is more likely than not that a goodwill impairment exists. In determining whether it is more likely thannot that a goodwill impairment exists, an entity should consider whether there are any adverse qualitative factorsindicating that an impairment may exist. The qualitative factors are consistent with existing authoritativeguidance, which requires that goodwill of a reporting unit be tested for impairment between annual tests if anevent occurs or circumstances change that would more likely than not reduce the fair value of a reporting unitbelow its carrying amount. This guidance was effective for Sony as of April 1, 2011. The adoption of thisguidance did not have a material impact on Sony’s results of operations and financial position.
F-24
SONY CORPORATION AND CONSOLIDATED SUBSIDIARIES
Disclosure of supplementary pro forma information for business combinations -
In December 2010, the FASB issued new accounting guidance addressing when a business combinationshould be assumed to have occurred for the purpose of providing pro forma disclosure. The new guidancerequires disclosure of revenue and income of the combined entity as though the business combination occurred asof the beginning of the comparable prior reporting period. The guidance also expands the supplemental pro formadisclosure to include a description of the nature and amount of material, nonrecurring pro forma adjustmentsdirectly attributable to the business combination included in the reported pro forma revenue and earnings. Theguidance was effective for Sony as of April 1, 2011. Since this guidance impacts disclosures only, its adoptiondid not have an impact on Sony’s results of operations and financial position.
Amendments to achieve common fair value measurement and disclosure requirements in U.S. GAAP andInternational Financial Reporting Standards (“IFRS”) -
In May 2011, the FASB issued new guidance to substantially converge fair value measurement anddisclosure requirements under U.S. GAAP and IFRS, including a consistent definition of fair value. Theamendments change the wording used to describe many of the requirements in U.S. GAAP for measuring fairvalue and for disclosing information about fair value measurements. For many of the requirements, the FASBdoes not intend for the new guidance to result in a change in the application of the existing guidance for fairvalue measurements. However, some of the amendments clarify the FASB’s intent about the application ofexisting fair value measurement requirements and other amendments change a particular principle or requirementfor measuring fair value or for disclosing information about fair value measurements. The guidance was effectivefor Sony in the fourth quarter of the fiscal year ended March 31, 2012. The adoption of this guidance did nothave a material impact on Sony’s results of operations and financial position.
Disclosures about an employer’s participation in a multiemployer plan -
In September 2011, the FASB issued new disclosure guidance regarding multiemployer pension and otherpostretirement benefit plans. This guidance requires additional quantitative and qualitative disclosures for allindividually significant multiemployer pension plans on annual basis, and revises the disclosures formultiemployer plans that provide other postretirement benefits. This guidance does not change the currentrecognition and measurement guidance for an employer’s participation in a multiemployer plan. This guidancewas effective for Sony beginning with the fiscal year ended March 31, 2012, and is applied retrospectively. Sincethis guidance impacts disclosures only, and Sony does not have any significant participation in multiemployerplans, its adoption did not have an impact on Sony’s results of operations and financial position.
(3) Recent accounting pronouncements not yet adopted:
Accounting for costs associated with acquiring or renewing insurance contracts -
In October 2010, the FASB issued new accounting guidance for costs associated with acquiring or renewinginsurance contracts. Under the new guidance acquisition costs are to include only those costs that are directlyrelated to the acquisition or renewal of insurance contracts by applying a model similar to the accounting for loanorigination costs. An entity may defer incremental direct costs of contract acquisition that are incurred intransactions with independent third parties or employees as well as the portion of employee compensation andother costs directly related to underwriting, policy issuance and processing, medical inspection, and contractselling for successfully negotiated contracts. Additionally, an entity may capitalize as a deferred acquisition costonly those advertising costs meeting the capitalization criteria for direct-response advertising. This change iseffective for Sony as of April 1, 2012. Sony will apply this guidance prospectively from the date of adoption. Theadoption of this guidance is not expected to have a material impact on Sony’s results of operations and financialposition.
Testing goodwill for impairment -
In September 2011, the FASB issued a new standard to simplify how an entity tests goodwill forimpairment. The new standard allows companies an option to first assess qualitative factors to determine whether
F-25
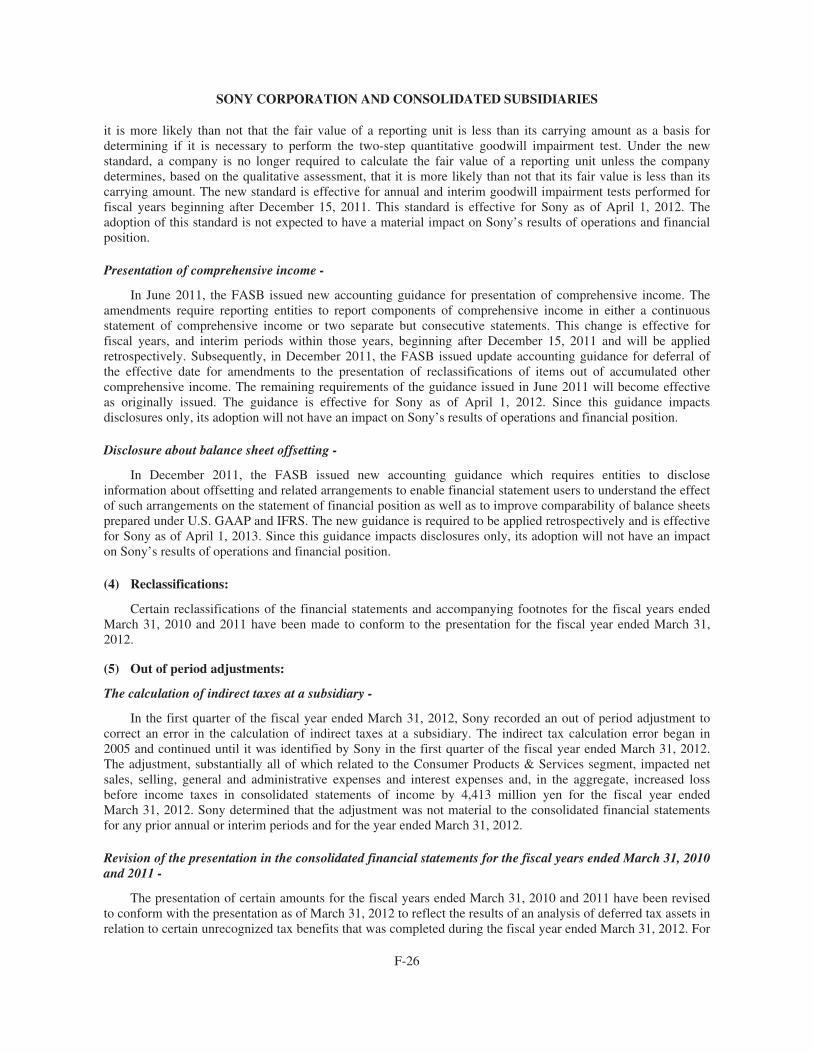
SONY CORPORATION AND CONSOLIDATED SUBSIDIARIES
it is more likely than not that the fair value of a reporting unit is less than its carrying amount as a basis fordetermining if it is necessary to perform the two-step quantitative goodwill impairment test. Under the newstandard, a company is no longer required to calculate the fair value of a reporting unit unless the companydetermines, based on the qualitative assessment, that it is more likely than not that its fair value is less than itscarrying amount. The new standard is effective for annual and interim goodwill impairment tests performed forfiscal years beginning after December 15, 2011. This standard is effective for Sony as of April 1, 2012. Theadoption of this standard is not expected to have a material impact on Sony’s results of operations and financialposition.
Presentation of comprehensive income -
In June 2011, the FASB issued new accounting guidance for presentation of comprehensive income. Theamendments require reporting entities to report components of comprehensive income in either a continuousstatement of comprehensive income or two separate but consecutive statements. This change is effective forfiscal years, and interim periods within those years, beginning after December 15, 2011 and will be appliedretrospectively. Subsequently, in December 2011, the FASB issued update accounting guidance for deferral ofthe effective date for amendments to the presentation of reclassifications of items out of accumulated othercomprehensive income. The remaining requirements of the guidance issued in June 2011 will become effectiveas originally issued. The guidance is effective for Sony as of April 1, 2012. Since this guidance impactsdisclosures only, its adoption will not have an impact on Sony’s results of operations and financial position.
Disclosure about balance sheet offsetting -
In December 2011, the FASB issued new accounting guidance which requires entities to discloseinformation about offsetting and related arrangements to enable financial statement users to understand the effectof such arrangements on the statement of financial position as well as to improve comparability of balance sheetsprepared under U.S. GAAP and IFRS. The new guidance is required to be applied retrospectively and is effectivefor Sony as of April 1, 2013. Since this guidance impacts disclosures only, its adoption will not have an impacton Sony’s results of operations and financial position.
(4) Reclassifications:
Certain reclassifications of the financial statements and accompanying footnotes for the fiscal years endedMarch 31, 2010 and 2011 have been made to conform to the presentation for the fiscal year ended March 31,2012.
(5) Out of period adjustments:
The calculation of indirect taxes at a subsidiary -
In the first quarter of the fiscal year ended March 31, 2012, Sony recorded an out of period adjustment tocorrect an error in the calculation of indirect taxes at a subsidiary. The indirect tax calculation error began in2005 and continued until it was identified by Sony in the first quarter of the fiscal year ended March 31, 2012.The adjustment, substantially all of which related to the Consumer Products & Services segment, impacted netsales, selling, general and administrative expenses and interest expenses and, in the aggregate, increased lossbefore income taxes in consolidated statements of income by 4,413 million yen for the fiscal year endedMarch 31, 2012. Sony determined that the adjustment was not material to the consolidated financial statementsfor any prior annual or interim periods and for the year ended March 31, 2012.
Revision of the presentation in the consolidated financial statements for the fiscal years ended March 31, 2010and 2011 -
The presentation of certain amounts for the fiscal years ended March 31, 2010 and 2011 have been revisedto conform with the presentation as of March 31, 2012 to reflect the results of an analysis of deferred tax assets inrelation to certain unrecognized tax benefits that was completed during the fiscal year ended March 31, 2012. For
F-26
SONY CORPORATION AND CONSOLIDATED SUBSIDIARIES
the fiscal year ended March 31, 2010, within income taxes in the consolidated statements of income, this revisionincreased current income taxes by 30,422 million yen with a corresponding decrease to deferred income taxes,with no impact on net income and net loss attributable to Sony Corporation’s stockholders. For the fiscal yearended March 31, 2010, within operating activities in the consolidated statements of cash flows, this revisiondecreased deferred income taxes by 30,422 million yen, increased accrued income and other taxes by8,320 million yen and increased other by 22,102 million yen, with no impact on net cash provided by operatingactivities. This revision had no impact on Sony’s consolidated statements of changes in stockholders’ equity forthe fiscal year ended March 31, 2010. As of March 31, 2011, in the consolidated balance sheets, this revisionincreased deferred income taxes in other assets by 61,115 million yen, decreased other noncurrent assets by74,981 million yen, decreased total assets by 13,866 million yen, increased accrued income and other taxes by8,320 million yen, decreased other noncurrent liabilities by 22,186 million yen and decreased total liabilities andequity by 13,866 million yen. This revision had no impact on Sony’s consolidated statements of income,consolidated statements of cash flows and consolidated statements of changes in stockholders’ equity for thefiscal year ended March 31, 2011.
3. Inventories
Inventories are comprised of the following:
Yen in millions
March 31
2011 2012
Finished products 529,666 498,430Work in process 70,969 88,236Raw materials, purchased components and supplies 103,408 120,386
704,043 707,052
4. Film costs
Film costs are comprised of the following:
Yen in millions
March 31
2011 2012
Motion picture productions:Released 102,415 98,910Completed and not released 14,260 10,800In production and development 107,811 102,295
Television productions:Released 40,581 44,461In production and development 1,688 2,853
Broadcasting rights 24,544 27,830Less: current portion of broadcasting rights included in inventories (15,910) (17,101)
Film costs 275,389 270,048
Sony estimates that approximately 90% of the unamortized costs of released films at March 31, 2012 will beamortized within the next three years. Approximately 84 billion yen of completed film costs are expected to beamortized during the next twelve months. Approximately 91 billion yen of accrued participation liabilitiesincluded in accounts payable, other and accrued expenses are expected to be paid during the next twelve months.
F-27
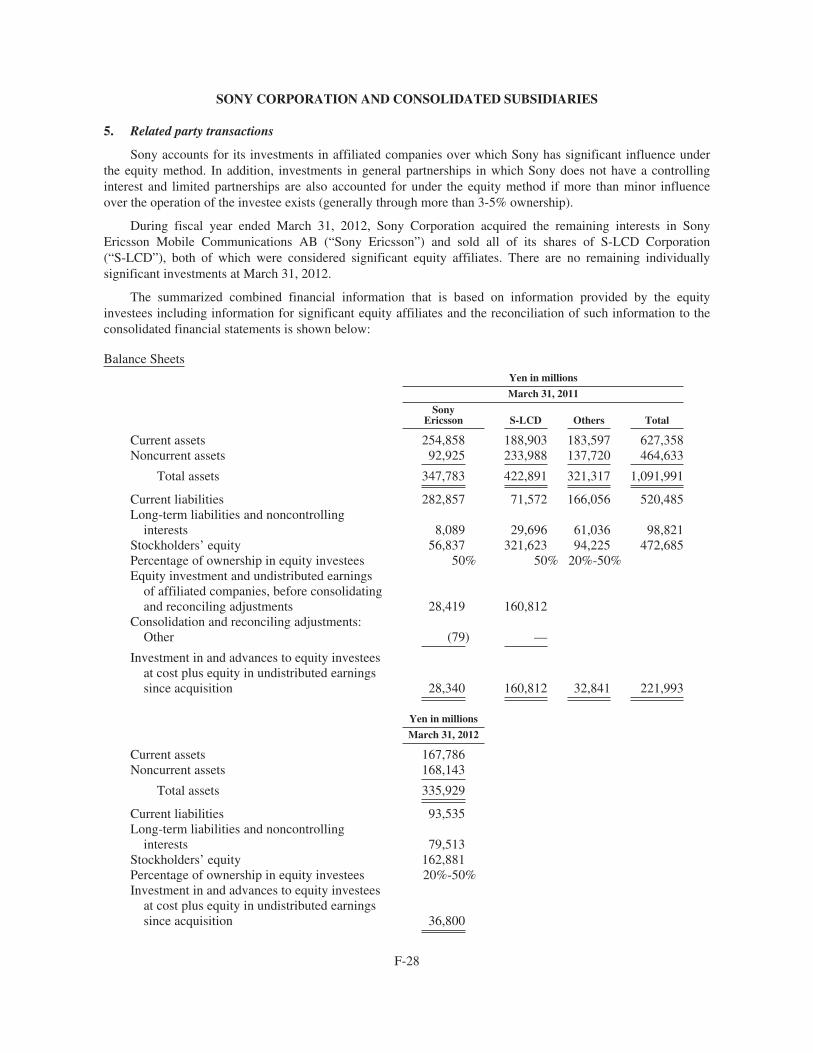
SONY CORPORATION AND CONSOLIDATED SUBSIDIARIES
5. Related party transactions
Sony accounts for its investments in affiliated companies over which Sony has significant influence underthe equity method. In addition, investments in general partnerships in which Sony does not have a controllinginterest and limited partnerships are also accounted for under the equity method if more than minor influenceover the operation of the investee exists (generally through more than 3-5% ownership).
During fiscal year ended March 31, 2012, Sony Corporation acquired the remaining interests in SonyEricsson Mobile Communications AB (“Sony Ericsson”) and sold all of its shares of S-LCD Corporation(“S-LCD”), both of which were considered significant equity affiliates. There are no remaining individuallysignificant investments at March 31, 2012.
The summarized combined financial information that is based on information provided by the equityinvestees including information for significant equity affiliates and the reconciliation of such information to theconsolidated financial statements is shown below:
Balance SheetsYen in millions
March 31, 2011
SonyEricsson S-LCD Others Total
Current assets 254,858 188,903 183,597 627,358Noncurrent assets 92,925 233,988 137,720 464,633
Total assets 347,783 422,891 321,317 1,091,991
Current liabilities 282,857 71,572 166,056 520,485Long-term liabilities and noncontrolling
interests 8,089 29,696 61,036 98,821Stockholders’ equity 56,837 321,623 94,225 472,685Percentage of ownership in equity investees 50% 50% 20%-50%Equity investment and undistributed earnings
of affiliated companies, before consolidatingand reconciling adjustments 28,419 160,812
Consolidation and reconciling adjustments:Other (79) —
Investment in and advances to equity investeesat cost plus equity in undistributed earningssince acquisition 28,340 160,812 32,841 221,993
Yen in millions
March 31, 2012
Current assets 167,786Noncurrent assets 168,143
Total assets 335,929
Current liabilities 93,535Long-term liabilities and noncontrolling
interests 79,513Stockholders’ equity 162,881Percentage of ownership in equity investees 20%-50%Investment in and advances to equity investees
at cost plus equity in undistributed earningssince acquisition 36,800
F-28
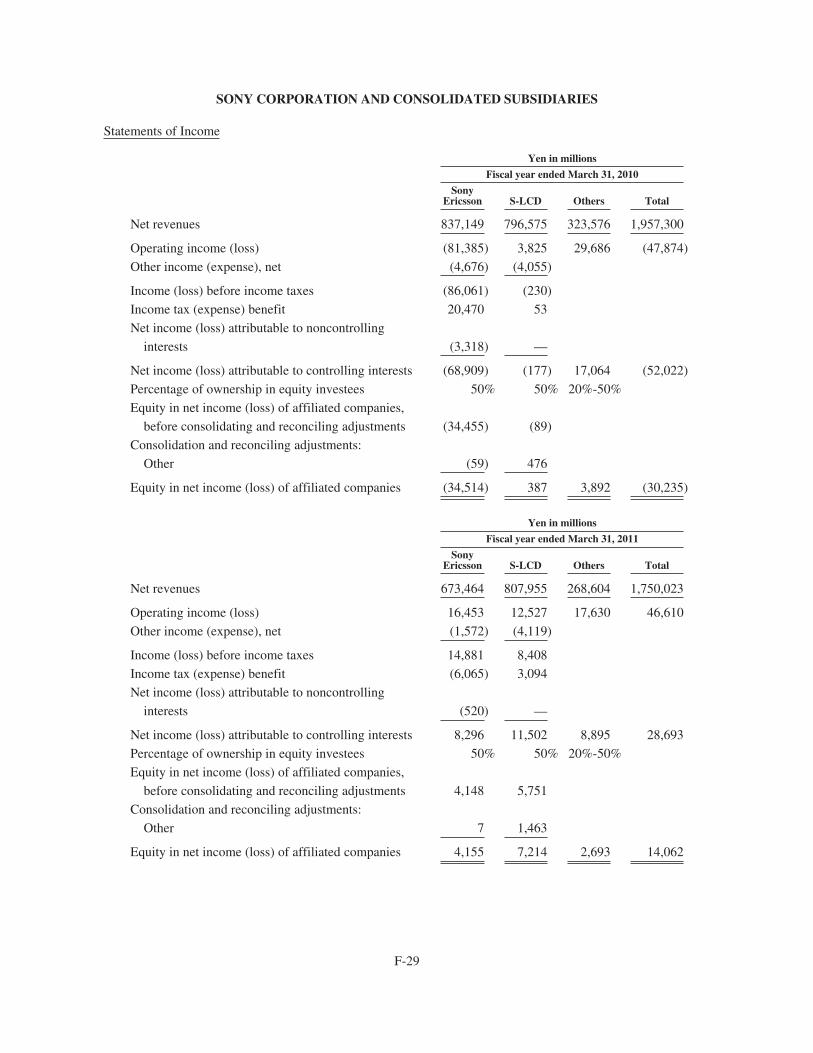
SONY CORPORATION AND CONSOLIDATED SUBSIDIARIES
Statements of Income
Yen in millions
Fiscal year ended March 31, 2010
SonyEricsson S-LCD Others Total
Net revenues 837,149 796,575 323,576 1,957,300
Operating income (loss) (81,385) 3,825 29,686 (47,874)
Other income (expense), net (4,676) (4,055)
Income (loss) before income taxes (86,061) (230)
Income tax (expense) benefit 20,470 53
Net income (loss) attributable to noncontrolling
interests (3,318) —
Net income (loss) attributable to controlling interests (68,909) (177) 17,064 (52,022)
Percentage of ownership in equity investees 50% 50% 20%-50%
Equity in net income (loss) of affiliated companies,
before consolidating and reconciling adjustments (34,455) (89)
Consolidation and reconciling adjustments:
Other (59) 476
Equity in net income (loss) of affiliated companies (34,514) 387 3,892 (30,235)
Yen in millions
Fiscal year ended March 31, 2011
SonyEricsson S-LCD Others Total
Net revenues 673,464 807,955 268,604 1,750,023
Operating income (loss) 16,453 12,527 17,630 46,610
Other income (expense), net (1,572) (4,119)
Income (loss) before income taxes 14,881 8,408
Income tax (expense) benefit (6,065) 3,094
Net income (loss) attributable to noncontrolling
interests (520) —
Net income (loss) attributable to controlling interests 8,296 11,502 8,895 28,693
Percentage of ownership in equity investees 50% 50% 20%-50%
Equity in net income (loss) of affiliated companies,
before consolidating and reconciling adjustments 4,148 5,751
Consolidation and reconciling adjustments:
Other 7 1,463
Equity in net income (loss) of affiliated companies 4,155 7,214 2,693 14,062
F-29
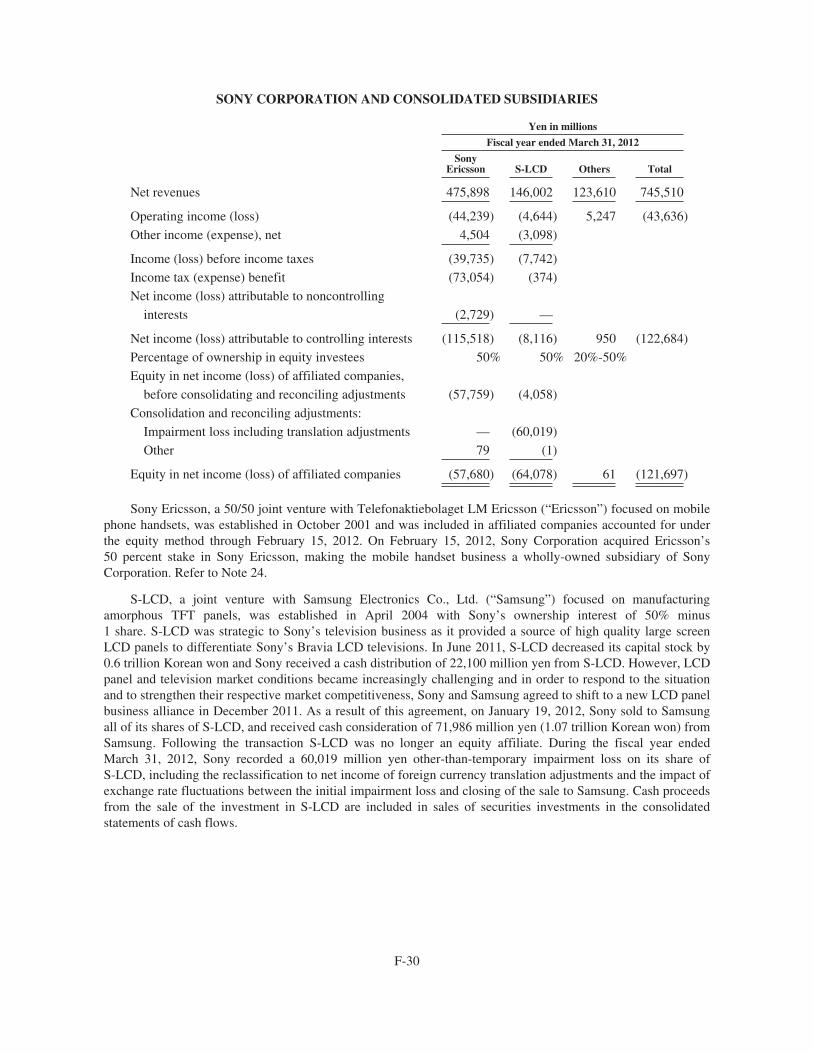
SONY CORPORATION AND CONSOLIDATED SUBSIDIARIES
Yen in millions
Fiscal year ended March 31, 2012
SonyEricsson S-LCD Others Total
Net revenues 475,898 146,002 123,610 745,510
Operating income (loss) (44,239) (4,644) 5,247 (43,636)
Other income (expense), net 4,504 (3,098)
Income (loss) before income taxes (39,735) (7,742)
Income tax (expense) benefit (73,054) (374)
Net income (loss) attributable to noncontrolling
interests (2,729) —
Net income (loss) attributable to controlling interests (115,518) (8,116) 950 (122,684)
Percentage of ownership in equity investees 50% 50% 20%-50%
Equity in net income (loss) of affiliated companies,
before consolidating and reconciling adjustments (57,759) (4,058)
Consolidation and reconciling adjustments:
Impairment loss including translation adjustments — (60,019)
Other 79 (1)
Equity in net income (loss) of affiliated companies (57,680) (64,078) 61 (121,697)
Sony Ericsson, a 50/50 joint venture with Telefonaktiebolaget LM Ericsson (“Ericsson”) focused on mobilephone handsets, was established in October 2001 and was included in affiliated companies accounted for underthe equity method through February 15, 2012. On February 15, 2012, Sony Corporation acquired Ericsson’s50 percent stake in Sony Ericsson, making the mobile handset business a wholly-owned subsidiary of SonyCorporation. Refer to Note 24.
S-LCD, a joint venture with Samsung Electronics Co., Ltd. (“Samsung”) focused on manufacturingamorphous TFT panels, was established in April 2004 with Sony’s ownership interest of 50% minus1 share. S-LCD was strategic to Sony’s television business as it provided a source of high quality large screenLCD panels to differentiate Sony’s Bravia LCD televisions. In June 2011, S-LCD decreased its capital stock by0.6 trillion Korean won and Sony received a cash distribution of 22,100 million yen from S-LCD. However, LCDpanel and television market conditions became increasingly challenging and in order to respond to the situationand to strengthen their respective market competitiveness, Sony and Samsung agreed to shift to a new LCD panelbusiness alliance in December 2011. As a result of this agreement, on January 19, 2012, Sony sold to Samsungall of its shares of S-LCD, and received cash consideration of 71,986 million yen (1.07 trillion Korean won) fromSamsung. Following the transaction S-LCD was no longer an equity affiliate. During the fiscal year endedMarch 31, 2012, Sony recorded a 60,019 million yen other-than-temporary impairment loss on its share ofS-LCD, including the reclassification to net income of foreign currency translation adjustments and the impact ofexchange rate fluctuations between the initial impairment loss and closing of the sale to Samsung. Cash proceedsfrom the sale of the investment in S-LCD are included in sales of securities investments in the consolidatedstatements of cash flows.
F-30
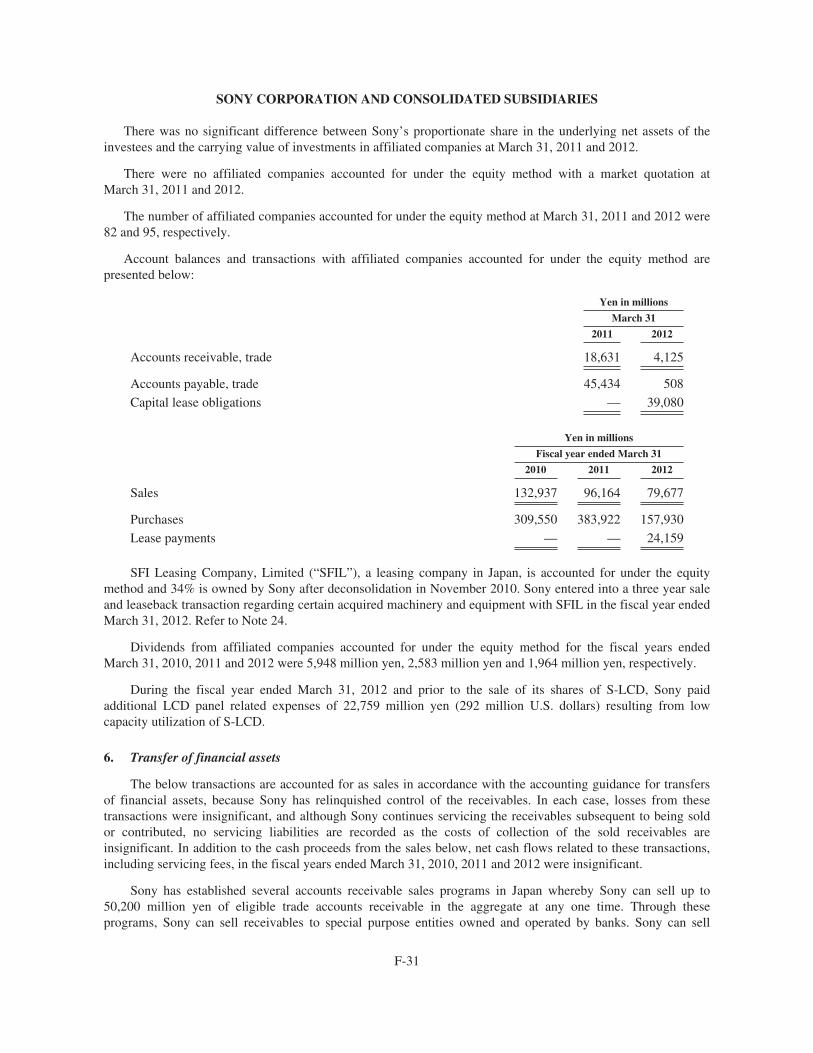
SONY CORPORATION AND CONSOLIDATED SUBSIDIARIES
There was no significant difference between Sony’s proportionate share in the underlying net assets of theinvestees and the carrying value of investments in affiliated companies at March 31, 2011 and 2012.
There were no affiliated companies accounted for under the equity method with a market quotation atMarch 31, 2011 and 2012.
The number of affiliated companies accounted for under the equity method at March 31, 2011 and 2012 were82 and 95, respectively.
Account balances and transactions with affiliated companies accounted for under the equity method arepresented below:
Yen in millions
March 31
2011 2012
Accounts receivable, trade 18,631 4,125
Accounts payable, trade 45,434 508
Capital lease obligations — 39,080
Yen in millions
Fiscal year ended March 31
2010 2011 2012
Sales 132,937 96,164 79,677
Purchases 309,550 383,922 157,930
Lease payments — — 24,159
SFI Leasing Company, Limited (“SFIL”), a leasing company in Japan, is accounted for under the equitymethod and 34% is owned by Sony after deconsolidation in November 2010. Sony entered into a three year saleand leaseback transaction regarding certain acquired machinery and equipment with SFIL in the fiscal year endedMarch 31, 2012. Refer to Note 24.
Dividends from affiliated companies accounted for under the equity method for the fiscal years endedMarch 31, 2010, 2011 and 2012 were 5,948 million yen, 2,583 million yen and 1,964 million yen, respectively.
During the fiscal year ended March 31, 2012 and prior to the sale of its shares of S-LCD, Sony paidadditional LCD panel related expenses of 22,759 million yen (292 million U.S. dollars) resulting from lowcapacity utilization of S-LCD.
6. Transfer of financial assets
The below transactions are accounted for as sales in accordance with the accounting guidance for transfersof financial assets, because Sony has relinquished control of the receivables. In each case, losses from thesetransactions were insignificant, and although Sony continues servicing the receivables subsequent to being soldor contributed, no servicing liabilities are recorded as the costs of collection of the sold receivables areinsignificant. In addition to the cash proceeds from the sales below, net cash flows related to these transactions,including servicing fees, in the fiscal years ended March 31, 2010, 2011 and 2012 were insignificant.
Sony has established several accounts receivable sales programs in Japan whereby Sony can sell up to50,200 million yen of eligible trade accounts receivable in the aggregate at any one time. Through theseprograms, Sony can sell receivables to special purpose entities owned and operated by banks. Sony can sell
F-31
SONY CORPORATION AND CONSOLIDATED SUBSIDIARIES
receivables in which the agreed upon original due dates are no more than 190 days after the sales of receivables.Total trade accounts receivable sold during the fiscal years ended March 31, 2010, 2011 and 2012 were109,271 million yen, 136,232 million yen and 126,513 million yen, respectively.
A subsidiary of the Financial Services segment has established several receivables sales programs wherebythe subsidiary can sell up to 24,000 million yen of eligible receivables in the aggregate at any one time. Throughthese programs, the subsidiary can sell receivables to special purpose entities owned and operated by banks. Thesubsidiary can sell receivables in which the agreed upon original due dates are no more than 180 days after thesales of receivables. Total receivables sold during the fiscal years ended March 31, 2010, 2011 and 2012 were183,805 million yen, 166,025 million yen and 130,060 million yen, respectively.
During the fiscal year ended March 31, 2010, Sony established an accounts receivable sales program in theUnited States. Through this program, a bankruptcy-remote entity, which is consolidated by Sony’s U.S.subsidiary, can sell up to 450 million U.S. dollars of eligible trade accounts receivables in the aggregate at anyone time to a commercial bank. Total trade accounts receivables sold during the fiscal year ended March 31,2010 were 258,085 million yen. Subsequent to its establishment, Sony amended this program. While thetransactions continued to qualify as sales under the new accounting guidance for transfers of financial assets, theamended program requires that a portion of the sales proceeds be held back and deferred until collection of therelated receivables by the purchaser. The portion of the sales proceeds held back and deferred is initially recordedat estimated fair value, is included in other current assets and was 32,751 million yen at March 31, 2011 and16,272 million yen at March 31, 2012. Sony includes collections on such receivables as cash flows withinoperating activities in the consolidated statements of cash flows since the receivables are the result of operatingactivities and the associated interest rate risk is insignificant due to its short-term nature. Total trade receivablessold, deferred proceeds from those sales and collections of deferred proceeds during the fiscal year endedMarch 31, 2011 were 414,147 million yen, 185,647 million yen and 153,550 million yen, respectively. Totaltrade receivables sold, deferred proceeds from those sales and collections of deferred proceeds during the fiscalyear ended March 31, 2012 were 476,855 million yen, 117,343 million yen and 132,636 million yen,respectively.
The accounts receivable sales programs in Japan and in the Financial Services segment above involvedqualified special purpose entities (“QSPEs”) under the accounting guidance effective prior to April 1, 2010 fortransfers of financial assets. Since the QSPEs met certain criteria, they were not consolidated by Sony. FromApril 1, 2010, the entities that formerly met the criteria to be a QSPE are subject to the same consolidationaccounting guidance as other variable interest entities (“VIEs”). Refer to Note 23.
F-32
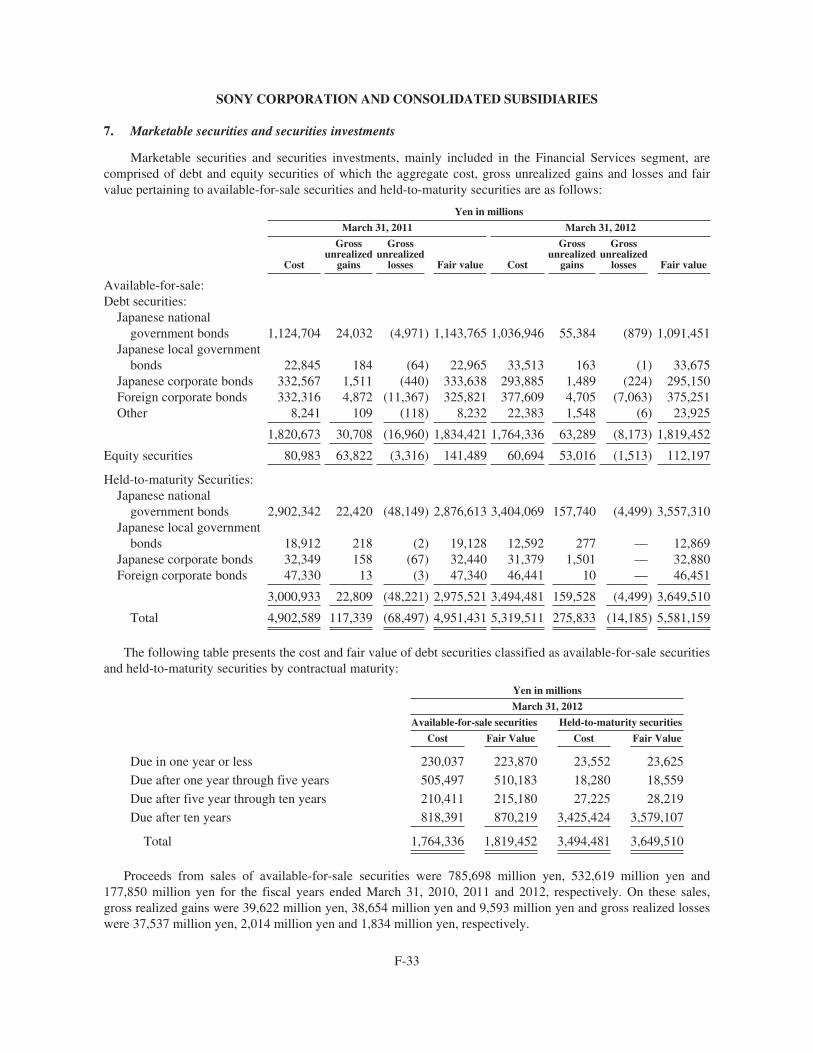
SONY CORPORATION AND CONSOLIDATED SUBSIDIARIES
7. Marketable securities and securities investments
Marketable securities and securities investments, mainly included in the Financial Services segment, arecomprised of debt and equity securities of which the aggregate cost, gross unrealized gains and losses and fairvalue pertaining to available-for-sale securities and held-to-maturity securities are as follows:
Yen in millions
March 31, 2011 March 31, 2012
Cost
Grossunrealized
gains
Grossunrealized
losses Fair value Cost
Grossunrealized
gains
Grossunrealized
losses Fair value
Available-for-sale:Debt securities:
Japanese nationalgovernment bonds 1,124,704 24,032 (4,971) 1,143,765 1,036,946 55,384 (879) 1,091,451
Japanese local governmentbonds 22,845 184 (64) 22,965 33,513 163 (1) 33,675
Japanese corporate bonds 332,567 1,511 (440) 333,638 293,885 1,489 (224) 295,150Foreign corporate bonds 332,316 4,872 (11,367) 325,821 377,609 4,705 (7,063) 375,251Other 8,241 109 (118) 8,232 22,383 1,548 (6) 23,925
1,820,673 30,708 (16,960) 1,834,421 1,764,336 63,289 (8,173) 1,819,452
Equity securities 80,983 63,822 (3,316) 141,489 60,694 53,016 (1,513) 112,197
Held-to-maturity Securities:Japanese national
government bonds 2,902,342 22,420 (48,149) 2,876,613 3,404,069 157,740 (4,499) 3,557,310Japanese local government
bonds 18,912 218 (2) 19,128 12,592 277 — 12,869Japanese corporate bonds 32,349 158 (67) 32,440 31,379 1,501 — 32,880Foreign corporate bonds 47,330 13 (3) 47,340 46,441 10 — 46,451
3,000,933 22,809 (48,221) 2,975,521 3,494,481 159,528 (4,499) 3,649,510
Total 4,902,589 117,339 (68,497) 4,951,431 5,319,511 275,833 (14,185) 5,581,159
The following table presents the cost and fair value of debt securities classified as available-for-sale securitiesand held-to-maturity securities by contractual maturity:
Yen in millions
March 31, 2012
Available-for-sale securities Held-to-maturity securities
Cost Fair Value Cost Fair Value
Due in one year or less 230,037 223,870 23,552 23,625
Due after one year through five years 505,497 510,183 18,280 18,559
Due after five year through ten years 210,411 215,180 27,225 28,219
Due after ten years 818,391 870,219 3,425,424 3,579,107
Total 1,764,336 1,819,452 3,494,481 3,649,510
Proceeds from sales of available-for-sale securities were 785,698 million yen, 532,619 million yen and177,850 million yen for the fiscal years ended March 31, 2010, 2011 and 2012, respectively. On these sales,gross realized gains were 39,622 million yen, 38,654 million yen and 9,593 million yen and gross realized losseswere 37,537 million yen, 2,014 million yen and 1,834 million yen, respectively.
F-33
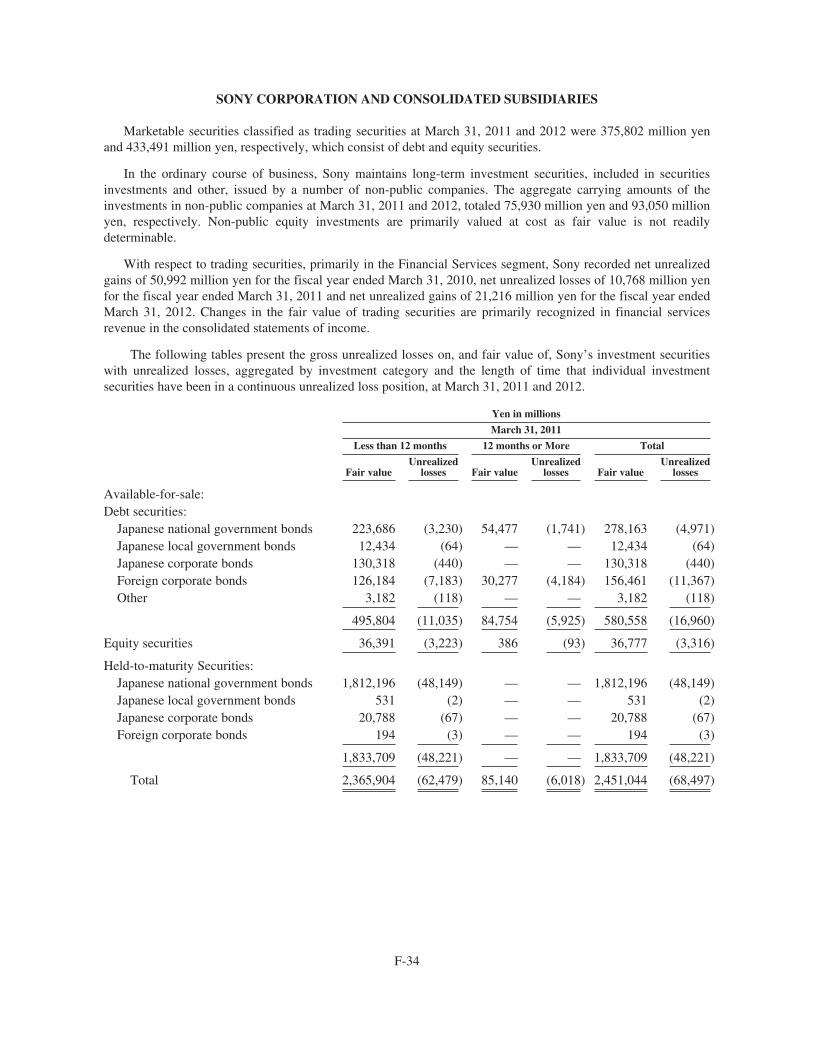
SONY CORPORATION AND CONSOLIDATED SUBSIDIARIES
Marketable securities classified as trading securities at March 31, 2011 and 2012 were 375,802 million yenand 433,491 million yen, respectively, which consist of debt and equity securities.
In the ordinary course of business, Sony maintains long-term investment securities, included in securitiesinvestments and other, issued by a number of non-public companies. The aggregate carrying amounts of theinvestments in non-public companies at March 31, 2011 and 2012, totaled 75,930 million yen and 93,050 millionyen, respectively. Non-public equity investments are primarily valued at cost as fair value is not readilydeterminable.
With respect to trading securities, primarily in the Financial Services segment, Sony recorded net unrealizedgains of 50,992 million yen for the fiscal year ended March 31, 2010, net unrealized losses of 10,768 million yenfor the fiscal year ended March 31, 2011 and net unrealized gains of 21,216 million yen for the fiscal year endedMarch 31, 2012. Changes in the fair value of trading securities are primarily recognized in financial servicesrevenue in the consolidated statements of income.
The following tables present the gross unrealized losses on, and fair value of, Sony’s investment securitieswith unrealized losses, aggregated by investment category and the length of time that individual investmentsecurities have been in a continuous unrealized loss position, at March 31, 2011 and 2012.
Yen in millions
March 31, 2011
Less than 12 months 12 months or More Total
Fair valueUnrealized
losses Fair valueUnrealized
losses Fair valueUnrealized
losses
Available-for-sale:Debt securities:
Japanese national government bonds 223,686 (3,230) 54,477 (1,741) 278,163 (4,971)Japanese local government bonds 12,434 (64) — — 12,434 (64)Japanese corporate bonds 130,318 (440) — — 130,318 (440)Foreign corporate bonds 126,184 (7,183) 30,277 (4,184) 156,461 (11,367)Other 3,182 (118) — — 3,182 (118)
495,804 (11,035) 84,754 (5,925) 580,558 (16,960)
Equity securities 36,391 (3,223) 386 (93) 36,777 (3,316)
Held-to-maturity Securities:Japanese national government bonds 1,812,196 (48,149) — — 1,812,196 (48,149)Japanese local government bonds 531 (2) — — 531 (2)Japanese corporate bonds 20,788 (67) — — 20,788 (67)Foreign corporate bonds 194 (3) — — 194 (3)
1,833,709 (48,221) — — 1,833,709 (48,221)
Total 2,365,904 (62,479) 85,140 (6,018) 2,451,044 (68,497)
F-34
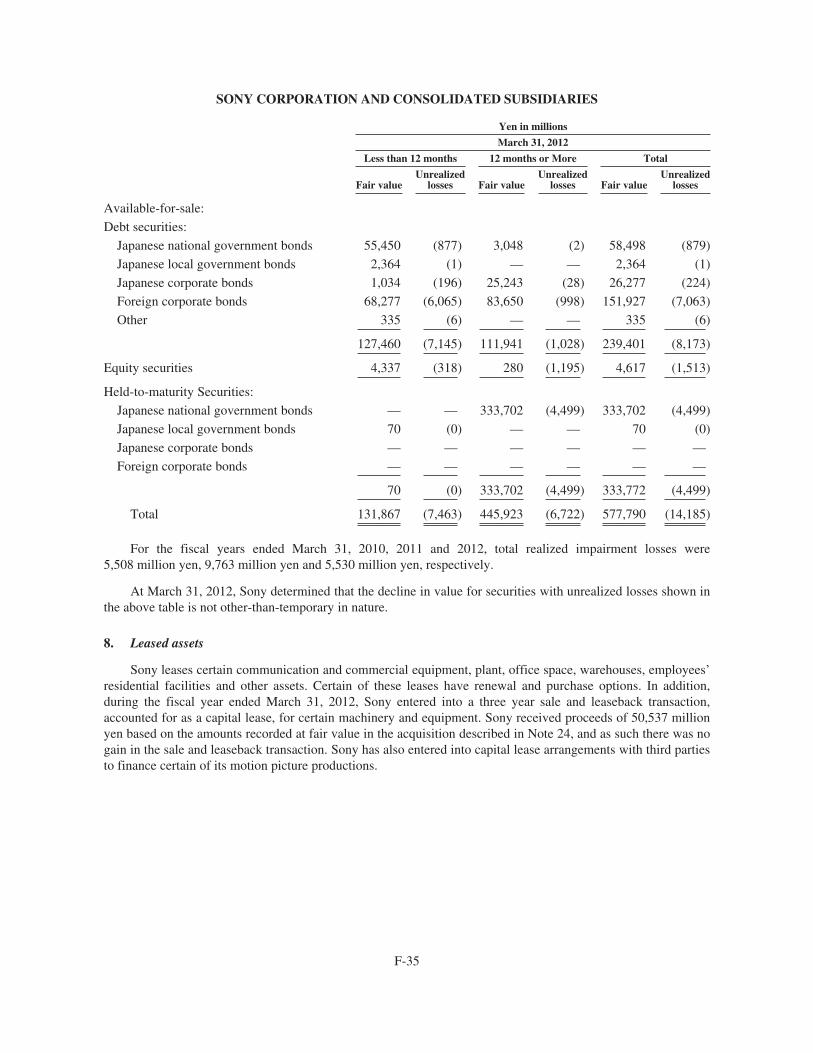
SONY CORPORATION AND CONSOLIDATED SUBSIDIARIES
Yen in millions
March 31, 2012
Less than 12 months 12 months or More Total
Fair valueUnrealized
losses Fair valueUnrealized
losses Fair valueUnrealized
losses
Available-for-sale:
Debt securities:
Japanese national government bonds 55,450 (877) 3,048 (2) 58,498 (879)
Japanese local government bonds 2,364 (1) — — 2,364 (1)
Japanese corporate bonds 1,034 (196) 25,243 (28) 26,277 (224)
Foreign corporate bonds 68,277 (6,065) 83,650 (998) 151,927 (7,063)
Other 335 (6) — — 335 (6)
127,460 (7,145) 111,941 (1,028) 239,401 (8,173)
Equity securities 4,337 (318) 280 (1,195) 4,617 (1,513)
Held-to-maturity Securities:
Japanese national government bonds — — 333,702 (4,499) 333,702 (4,499)
Japanese local government bonds 70 (0) — — 70 (0)
Japanese corporate bonds — — — — — —
Foreign corporate bonds — — — — — —
70 (0) 333,702 (4,499) 333,772 (4,499)
Total 131,867 (7,463) 445,923 (6,722) 577,790 (14,185)
For the fiscal years ended March 31, 2010, 2011 and 2012, total realized impairment losses were5,508 million yen, 9,763 million yen and 5,530 million yen, respectively.
At March 31, 2012, Sony determined that the decline in value for securities with unrealized losses shown inthe above table is not other-than-temporary in nature.
8. Leased assets
Sony leases certain communication and commercial equipment, plant, office space, warehouses, employees’residential facilities and other assets. Certain of these leases have renewal and purchase options. In addition,during the fiscal year ended March 31, 2012, Sony entered into a three year sale and leaseback transaction,accounted for as a capital lease, for certain machinery and equipment. Sony received proceeds of 50,537 millionyen based on the amounts recorded at fair value in the acquisition described in Note 24, and as such there was nogain in the sale and leaseback transaction. Sony has also entered into capital lease arrangements with third partiesto finance certain of its motion picture productions.
F-35

SONY CORPORATION AND CONSOLIDATED SUBSIDIARIES
Leased assets under capital leases are comprised of the following:
Yen in millions
March 31
Class of property 2011 2012
Machinery, equipment and others 9,288 58,751
Film costs 19,208 9,465
Accumulated amortization (4,634) (20,514)
23,862 47,702
The following is a schedule by year of the future minimum lease payments under capital leases togetherwith the present value of the net minimum lease payments as of March 31, 2012:
Fiscal year ending March 31 Yen in millions
2013 20,6522014 20,0982015 2,0352016 1,4692017 1,346Later years 5,647
Total minimum lease payments 51,247Less — Amount representing interest 1,493
Present value of net minimum lease payments 49,754Less — Current obligations 20,494
Long-term capital lease obligations 29,260
Rental expenses under operating leases for the fiscal years ended March 31, 2010, 2011 and 2012 were87,077 million yen, 78,538 million yen and 76,188 million yen, respectively. Sublease rentals received underoperating leases for the fiscal years ended March 31, 2010, 2011 and 2012 were 1,675 million yen, 1,974 millionyen and 1,423 million yen, respectively. The total minimum rentals to be received in the future undernoncancelable subleases for operating leases as of March 31, 2012 were 4,527 million yen.
The minimum rental payments required under operating leases that have initial or remaining noncancelablelease terms in excess of one year at March 31, 2012 are as follows:
Fiscal year ending March 31 Yen in millions
2013 42,7892014 33,1102015 24,0872016 17,3682017 13,653Later years 49,174
Total minimum future rentals 180,181
F-36
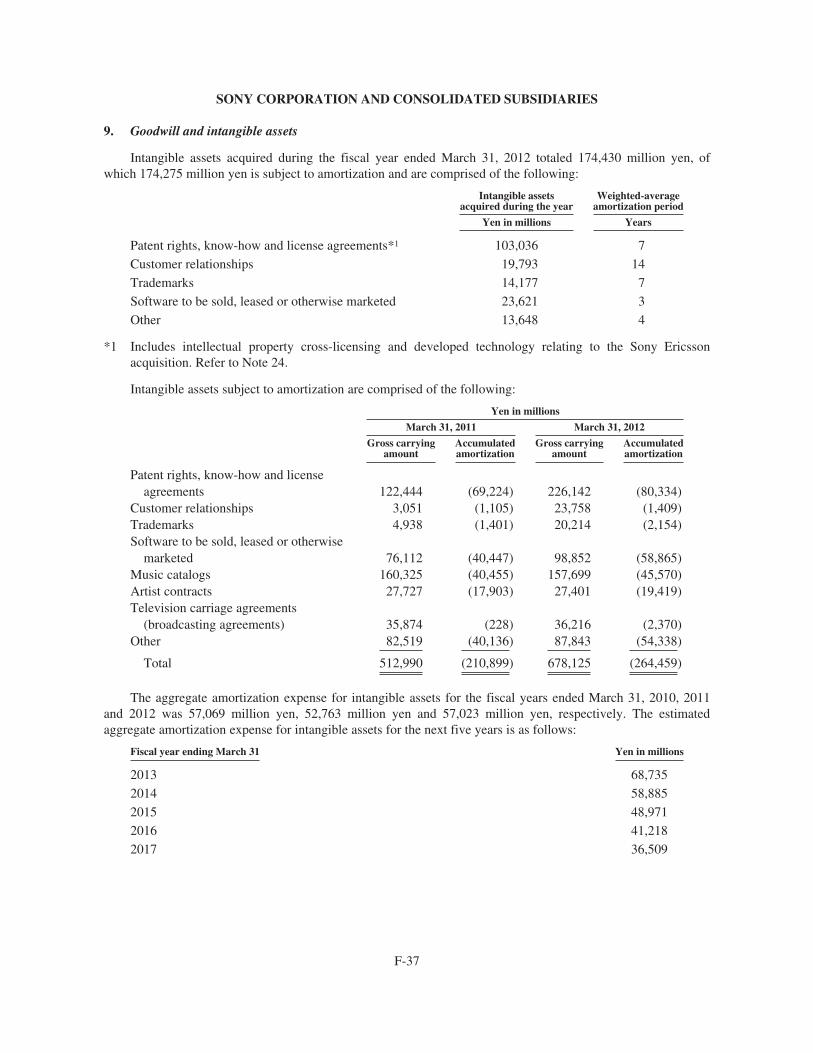
SONY CORPORATION AND CONSOLIDATED SUBSIDIARIES
9. Goodwill and intangible assets
Intangible assets acquired during the fiscal year ended March 31, 2012 totaled 174,430 million yen, ofwhich 174,275 million yen is subject to amortization and are comprised of the following:
Intangible assetsacquired during the year
Weighted-averageamortization period
Yen in millions Years
Patent rights, know-how and license agreements*1 103,036 7
Customer relationships 19,793 14
Trademarks 14,177 7
Software to be sold, leased or otherwise marketed 23,621 3
Other 13,648 4
*1 Includes intellectual property cross-licensing and developed technology relating to the Sony Ericssonacquisition. Refer to Note 24.
Intangible assets subject to amortization are comprised of the following:
Yen in millions
March 31, 2011 March 31, 2012
Gross carryingamount
Accumulatedamortization
Gross carryingamount
Accumulatedamortization
Patent rights, know-how and licenseagreements 122,444 (69,224) 226,142 (80,334)
Customer relationships 3,051 (1,105) 23,758 (1,409)Trademarks 4,938 (1,401) 20,214 (2,154)Software to be sold, leased or otherwise
marketed 76,112 (40,447) 98,852 (58,865)Music catalogs 160,325 (40,455) 157,699 (45,570)Artist contracts 27,727 (17,903) 27,401 (19,419)Television carriage agreements
(broadcasting agreements) 35,874 (228) 36,216 (2,370)Other 82,519 (40,136) 87,843 (54,338)
Total 512,990 (210,899) 678,125 (264,459)
The aggregate amortization expense for intangible assets for the fiscal years ended March 31, 2010, 2011and 2012 was 57,069 million yen, 52,763 million yen and 57,023 million yen, respectively. The estimatedaggregate amortization expense for intangible assets for the next five years is as follows:
Fiscal year ending March 31 Yen in millions
2013 68,735
2014 58,885
2015 48,971
2016 41,218
2017 36,509
F-37
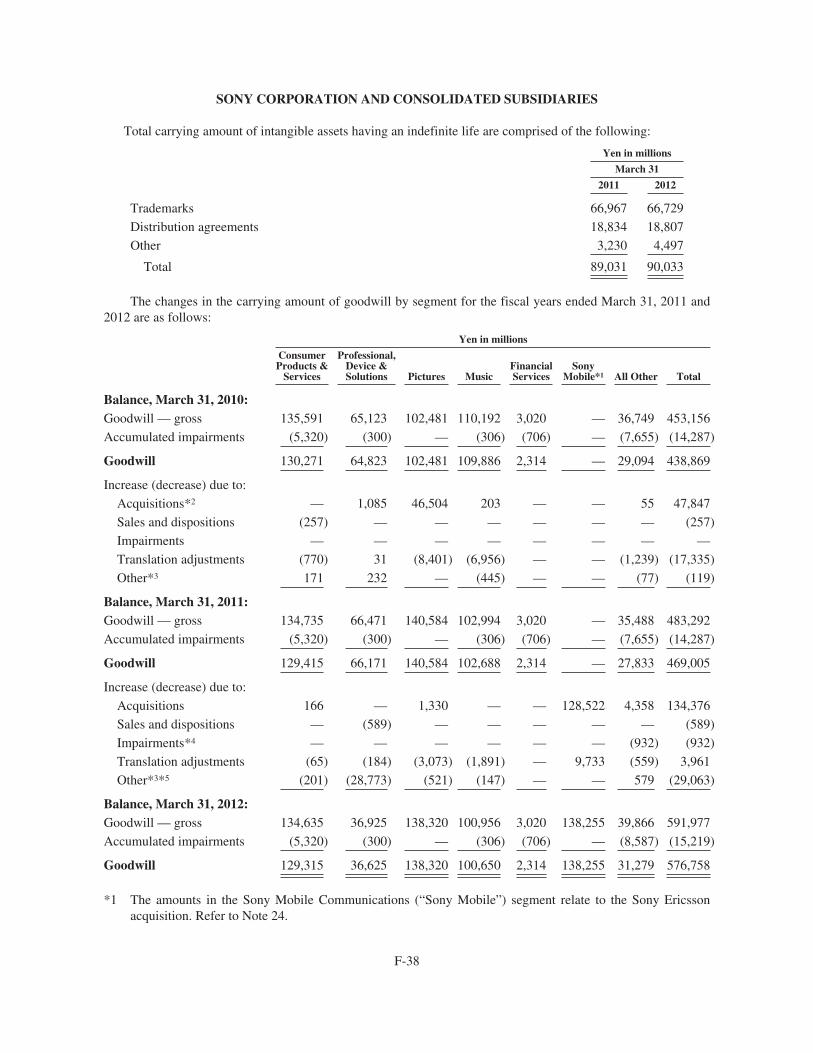
SONY CORPORATION AND CONSOLIDATED SUBSIDIARIES
Total carrying amount of intangible assets having an indefinite life are comprised of the following:
Yen in millions
March 31
2011 2012
Trademarks 66,967 66,729
Distribution agreements 18,834 18,807
Other 3,230 4,497
Total 89,031 90,033
The changes in the carrying amount of goodwill by segment for the fiscal years ended March 31, 2011 and2012 are as follows:
Yen in millions
ConsumerProducts &
Services
Professional,Device &Solutions Pictures Music
FinancialServices
SonyMobile*1 All Other Total
Balance, March 31, 2010:Goodwill — gross 135,591 65,123 102,481 110,192 3,020 — 36,749 453,156
Accumulated impairments (5,320) (300) — (306) (706) — (7,655) (14,287)
Goodwill 130,271 64,823 102,481 109,886 2,314 — 29,094 438,869
Increase (decrease) due to:
Acquisitions*2 — 1,085 46,504 203 — — 55 47,847
Sales and dispositions (257) — — — — — — (257)
Impairments — — — — — — — —
Translation adjustments (770) 31 (8,401) (6,956) — — (1,239) (17,335)
Other*3 171 232 — (445) — — (77) (119)
Balance, March 31, 2011:Goodwill — gross 134,735 66,471 140,584 102,994 3,020 — 35,488 483,292
Accumulated impairments (5,320) (300) — (306) (706) — (7,655) (14,287)
Goodwill 129,415 66,171 140,584 102,688 2,314 — 27,833 469,005
Increase (decrease) due to:
Acquisitions 166 — 1,330 — — 128,522 4,358 134,376
Sales and dispositions — (589) — — — — — (589)
Impairments*4 — — — — — — (932) (932)
Translation adjustments (65) (184) (3,073) (1,891) — 9,733 (559) 3,961
Other*3*5 (201) (28,773) (521) (147) — — 579 (29,063)
Balance, March 31, 2012:Goodwill — gross 134,635 36,925 138,320 100,956 3,020 138,255 39,866 591,977
Accumulated impairments (5,320) (300) — (306) (706) — (8,587) (15,219)
Goodwill 129,315 36,625 138,320 100,650 2,314 138,255 31,279 576,758
*1 The amounts in the Sony Mobile Communications (“Sony Mobile”) segment relate to the Sony Ericssonacquisition. Refer to Note 24.
F-38
SONY CORPORATION AND CONSOLIDATED SUBSIDIARIES
*2 Substantially all of the acquisition amounts in the Pictures segment relate to the Game Show Network, LLC(“GSN”) acquisition. Refer to Note 24.
*3 Other primarily consists of purchase price adjustments for prior years and amounts reclassified as held forsale.
*4 During the fiscal year ended March 31, 2012, Sony recorded impairment losses of 932 million yen in areporting unit included in All Other. The impairment charge reflected the overall decline in the fair value ofthe reporting unit. The fair value of the reporting unit was estimated using the expected present value offuture cash flows.
*5 During the fiscal year ended March 31, 2012, Sony entered into a memorandum of understanding with athird-party to sell the chemical products business, which is included in the Professional, Device & Solutionssegment. Sony classified certain assets and liabilities related to the business as held for sale as of March 31,2012, and anticipates completing the divestiture during the fiscal year ending March 31, 2013. Noimpairment loss was recognized as a result of the held for sale classification. The assets held for sale include29,182 million yen of goodwill and it was reclassified to other assets in the consolidated balance sheets.Refer to Note 25.
As described in Note 2, Sony performs an annual impairment test for goodwill. As a result of theimpairment test, there were no impairments other than the one noted above for the fiscal year ended March 31,2012.
10. Insurance-related accounts
Sony’s Financial Services segment subsidiaries in Japan maintain their accounting records as described inNote 2 in accordance with the accounting principles and practices generally accepted in Japan, which vary insome respects from U.S. GAAP.
Those differences are mainly that insurance acquisition costs for life and non-life insurance are charged toincome when incurred in Japan whereas in the U.S. those costs are deferred and amortized generally over thepremium-paying period of the related insurance policies, and that future policy benefits for life insurancecalculated locally under the authorization of the supervisory administrative agencies are comprehensivelyadjusted to a net level premium method with certain adjustments of actuarial assumptions for U.S. GAAPpurposes. For purposes of preparing the consolidated financial statements, appropriate adjustments have beenmade to reflect the accounting for these items in accordance with U.S. GAAP.
The combined amounts of statutory net equity of the insurance subsidiaries, which is not measured inaccordance with U.S. GAAP, as of March 31, 2011 and 2012 were 232,160 million yen and 282,846 million yen,respectively.
(1) Insurance policies:
Life insurance policies that a subsidiary in the Financial Services segment underwrites, most of which arecategorized as long-duration contracts, mainly consist of whole life, term life and accident and health insurancecontracts. The life insurance revenues for the fiscal years ended March 31, 2010, 2011 and 2012 were554,650 million yen, 600,291 million yen and 654,986 million yen, respectively. Property and casualty insurancepolicies that a subsidiary in the Financial Services segment underwrites are primarily automotive insurancecontracts, which are categorized as short-duration contracts. The non-life insurance revenues for the fiscal yearsended March 31, 2010, 2011 and 2012 were 64,987 million yen, 71,037 million yen and 76,958 million yen,respectively.
F-39
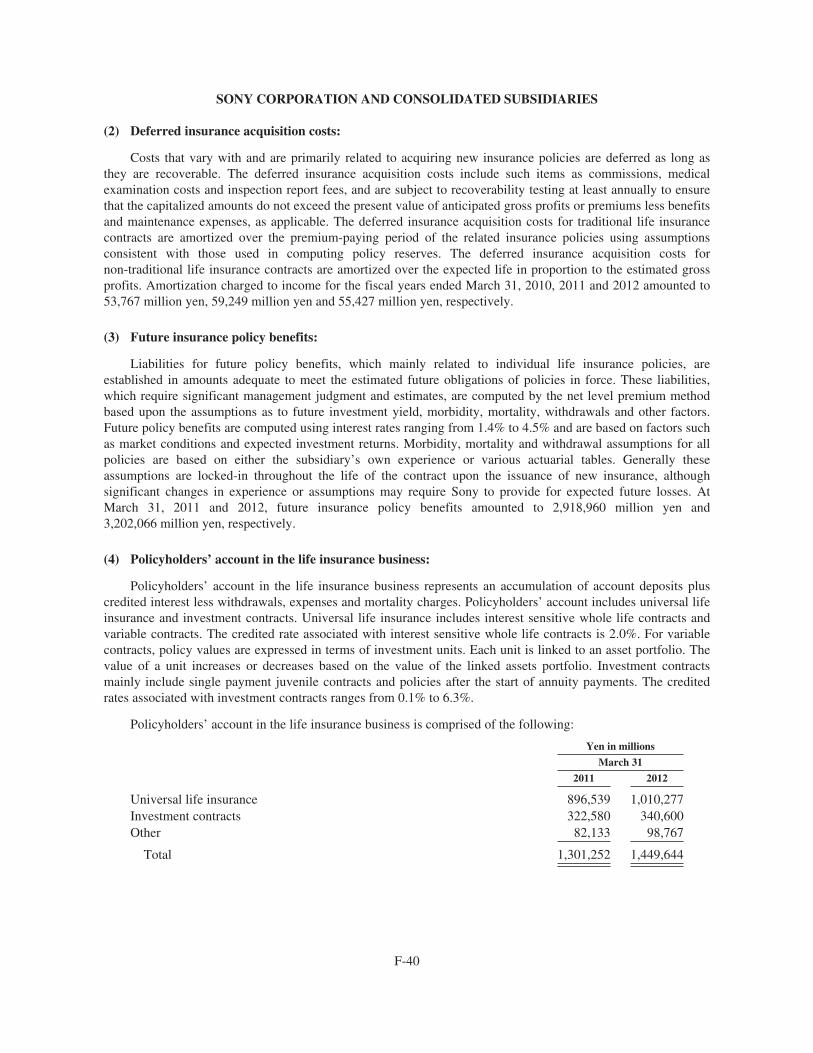
SONY CORPORATION AND CONSOLIDATED SUBSIDIARIES
(2) Deferred insurance acquisition costs:
Costs that vary with and are primarily related to acquiring new insurance policies are deferred as long asthey are recoverable. The deferred insurance acquisition costs include such items as commissions, medicalexamination costs and inspection report fees, and are subject to recoverability testing at least annually to ensurethat the capitalized amounts do not exceed the present value of anticipated gross profits or premiums less benefitsand maintenance expenses, as applicable. The deferred insurance acquisition costs for traditional life insurancecontracts are amortized over the premium-paying period of the related insurance policies using assumptionsconsistent with those used in computing policy reserves. The deferred insurance acquisition costs fornon-traditional life insurance contracts are amortized over the expected life in proportion to the estimated grossprofits. Amortization charged to income for the fiscal years ended March 31, 2010, 2011 and 2012 amounted to53,767 million yen, 59,249 million yen and 55,427 million yen, respectively.
(3) Future insurance policy benefits:
Liabilities for future policy benefits, which mainly related to individual life insurance policies, areestablished in amounts adequate to meet the estimated future obligations of policies in force. These liabilities,which require significant management judgment and estimates, are computed by the net level premium methodbased upon the assumptions as to future investment yield, morbidity, mortality, withdrawals and other factors.Future policy benefits are computed using interest rates ranging from 1.4% to 4.5% and are based on factors suchas market conditions and expected investment returns. Morbidity, mortality and withdrawal assumptions for allpolicies are based on either the subsidiary’s own experience or various actuarial tables. Generally theseassumptions are locked-in throughout the life of the contract upon the issuance of new insurance, althoughsignificant changes in experience or assumptions may require Sony to provide for expected future losses. AtMarch 31, 2011 and 2012, future insurance policy benefits amounted to 2,918,960 million yen and3,202,066 million yen, respectively.
(4) Policyholders’ account in the life insurance business:
Policyholders’ account in the life insurance business represents an accumulation of account deposits pluscredited interest less withdrawals, expenses and mortality charges. Policyholders’ account includes universal lifeinsurance and investment contracts. Universal life insurance includes interest sensitive whole life contracts andvariable contracts. The credited rate associated with interest sensitive whole life contracts is 2.0%. For variablecontracts, policy values are expressed in terms of investment units. Each unit is linked to an asset portfolio. Thevalue of a unit increases or decreases based on the value of the linked assets portfolio. Investment contractsmainly include single payment juvenile contracts and policies after the start of annuity payments. The creditedrates associated with investment contracts ranges from 0.1% to 6.3%.
Policyholders’ account in the life insurance business is comprised of the following:
Yen in millions
March 31
2011 2012
Universal life insurance 896,539 1,010,277Investment contracts 322,580 340,600Other 82,133 98,767
Total 1,301,252 1,449,644
F-40
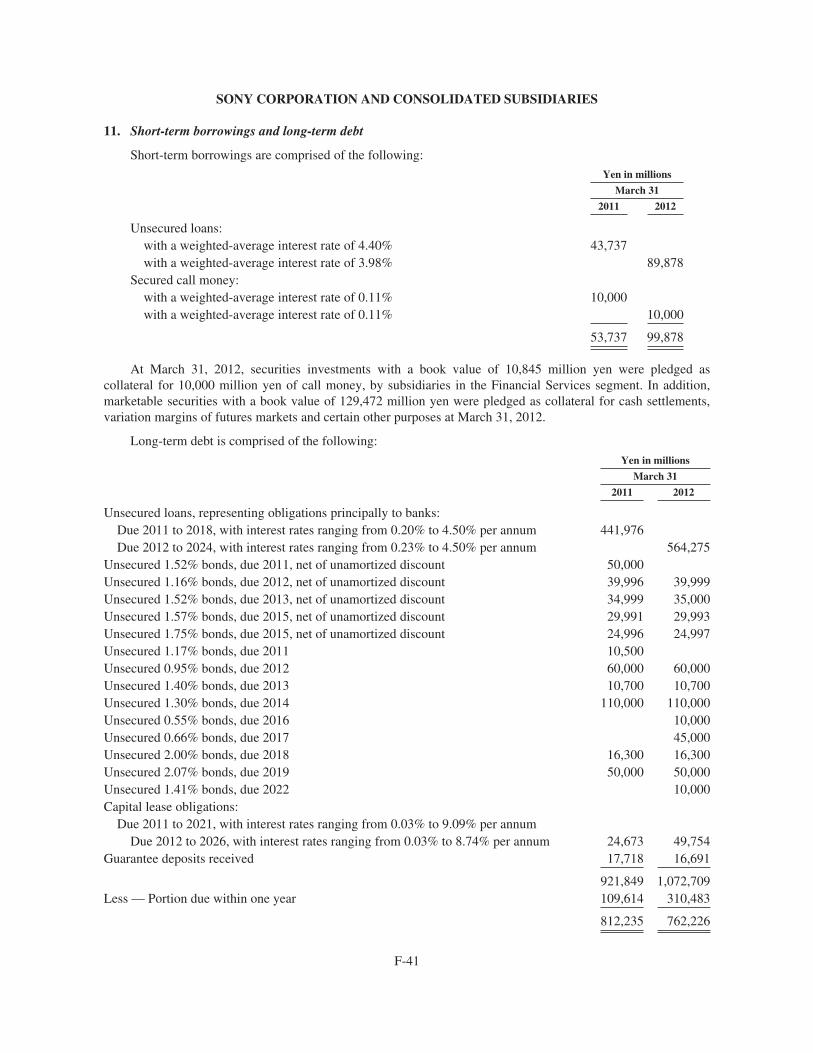
SONY CORPORATION AND CONSOLIDATED SUBSIDIARIES
11. Short-term borrowings and long-term debt
Short-term borrowings are comprised of the following:
Yen in millions
March 31
2011 2012
Unsecured loans:with a weighted-average interest rate of 4.40% 43,737with a weighted-average interest rate of 3.98% 89,878
Secured call money:with a weighted-average interest rate of 0.11% 10,000with a weighted-average interest rate of 0.11% 10,000
53,737 99,878
At March 31, 2012, securities investments with a book value of 10,845 million yen were pledged ascollateral for 10,000 million yen of call money, by subsidiaries in the Financial Services segment. In addition,marketable securities with a book value of 129,472 million yen were pledged as collateral for cash settlements,variation margins of futures markets and certain other purposes at March 31, 2012.
Long-term debt is comprised of the following:
Yen in millions
March 31
2011 2012
Unsecured loans, representing obligations principally to banks:Due 2011 to 2018, with interest rates ranging from 0.20% to 4.50% per annum 441,976Due 2012 to 2024, with interest rates ranging from 0.23% to 4.50% per annum 564,275
Unsecured 1.52% bonds, due 2011, net of unamortized discount 50,000Unsecured 1.16% bonds, due 2012, net of unamortized discount 39,996 39,999Unsecured 1.52% bonds, due 2013, net of unamortized discount 34,999 35,000Unsecured 1.57% bonds, due 2015, net of unamortized discount 29,991 29,993Unsecured 1.75% bonds, due 2015, net of unamortized discount 24,996 24,997Unsecured 1.17% bonds, due 2011 10,500Unsecured 0.95% bonds, due 2012 60,000 60,000Unsecured 1.40% bonds, due 2013 10,700 10,700Unsecured 1.30% bonds, due 2014 110,000 110,000Unsecured 0.55% bonds, due 2016 10,000Unsecured 0.66% bonds, due 2017 45,000Unsecured 2.00% bonds, due 2018 16,300 16,300Unsecured 2.07% bonds, due 2019 50,000 50,000Unsecured 1.41% bonds, due 2022 10,000Capital lease obligations:
Due 2011 to 2021, with interest rates ranging from 0.03% to 9.09% per annumDue 2012 to 2026, with interest rates ranging from 0.03% to 8.74% per annum 24,673 49,754
Guarantee deposits received 17,718 16,691
921,849 1,072,709Less — Portion due within one year 109,614 310,483
812,235 762,226
F-41
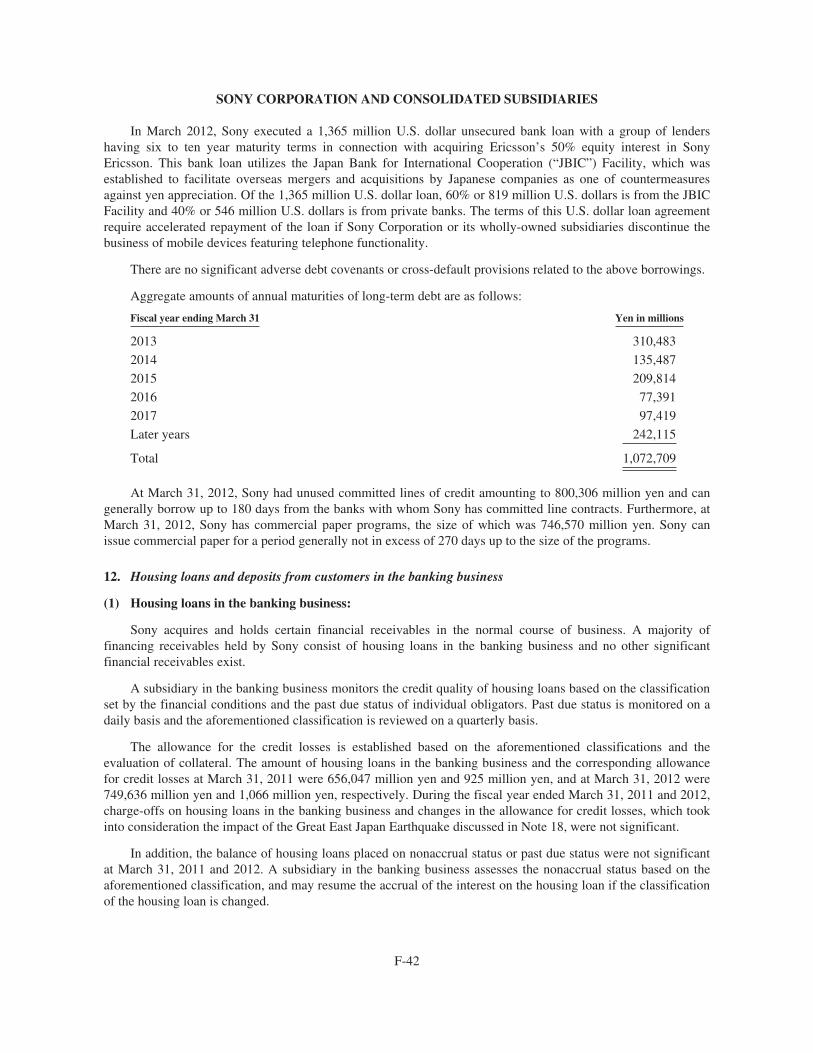
SONY CORPORATION AND CONSOLIDATED SUBSIDIARIES
In March 2012, Sony executed a 1,365 million U.S. dollar unsecured bank loan with a group of lendershaving six to ten year maturity terms in connection with acquiring Ericsson’s 50% equity interest in SonyEricsson. This bank loan utilizes the Japan Bank for International Cooperation (“JBIC”) Facility, which wasestablished to facilitate overseas mergers and acquisitions by Japanese companies as one of countermeasuresagainst yen appreciation. Of the 1,365 million U.S. dollar loan, 60% or 819 million U.S. dollars is from the JBICFacility and 40% or 546 million U.S. dollars is from private banks. The terms of this U.S. dollar loan agreementrequire accelerated repayment of the loan if Sony Corporation or its wholly-owned subsidiaries discontinue thebusiness of mobile devices featuring telephone functionality.
There are no significant adverse debt covenants or cross-default provisions related to the above borrowings.
Aggregate amounts of annual maturities of long-term debt are as follows:
Fiscal year ending March 31 Yen in millions
2013 310,483
2014 135,487
2015 209,814
2016 77,391
2017 97,419
Later years 242,115
Total 1,072,709
At March 31, 2012, Sony had unused committed lines of credit amounting to 800,306 million yen and cangenerally borrow up to 180 days from the banks with whom Sony has committed line contracts. Furthermore, atMarch 31, 2012, Sony has commercial paper programs, the size of which was 746,570 million yen. Sony canissue commercial paper for a period generally not in excess of 270 days up to the size of the programs.
12. Housing loans and deposits from customers in the banking business
(1) Housing loans in the banking business:
Sony acquires and holds certain financial receivables in the normal course of business. A majority offinancing receivables held by Sony consist of housing loans in the banking business and no other significantfinancial receivables exist.
A subsidiary in the banking business monitors the credit quality of housing loans based on the classificationset by the financial conditions and the past due status of individual obligators. Past due status is monitored on adaily basis and the aforementioned classification is reviewed on a quarterly basis.
The allowance for the credit losses is established based on the aforementioned classifications and theevaluation of collateral. The amount of housing loans in the banking business and the corresponding allowancefor credit losses at March 31, 2011 were 656,047 million yen and 925 million yen, and at March 31, 2012 were749,636 million yen and 1,066 million yen, respectively. During the fiscal year ended March 31, 2011 and 2012,charge-offs on housing loans in the banking business and changes in the allowance for credit losses, which tookinto consideration the impact of the Great East Japan Earthquake discussed in Note 18, were not significant.
In addition, the balance of housing loans placed on nonaccrual status or past due status were not significantat March 31, 2011 and 2012. A subsidiary in the banking business assesses the nonaccrual status based on theaforementioned classification, and may resume the accrual of the interest on the housing loan if the classificationof the housing loan is changed.
F-42
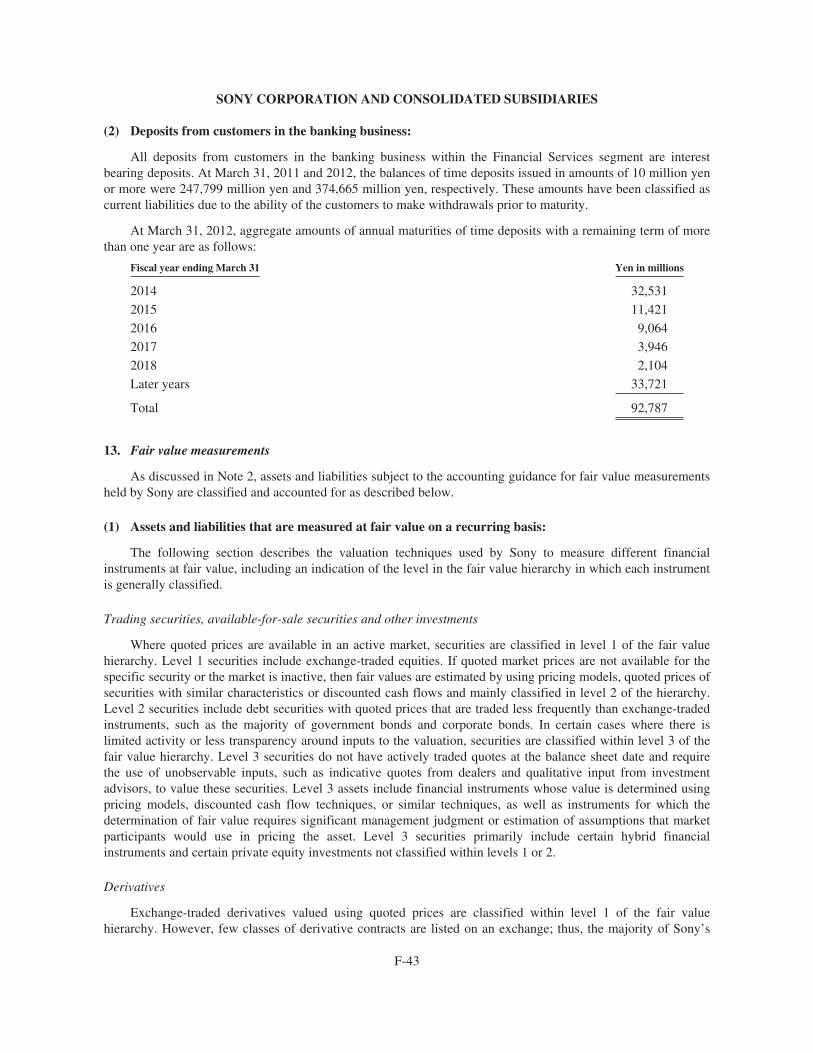
SONY CORPORATION AND CONSOLIDATED SUBSIDIARIES
(2) Deposits from customers in the banking business:
All deposits from customers in the banking business within the Financial Services segment are interestbearing deposits. At March 31, 2011 and 2012, the balances of time deposits issued in amounts of 10 million yenor more were 247,799 million yen and 374,665 million yen, respectively. These amounts have been classified ascurrent liabilities due to the ability of the customers to make withdrawals prior to maturity.
At March 31, 2012, aggregate amounts of annual maturities of time deposits with a remaining term of morethan one year are as follows:
Fiscal year ending March 31 Yen in millions
2014 32,531
2015 11,421
2016 9,064
2017 3,946
2018 2,104
Later years 33,721
Total 92,787
13. Fair value measurements
As discussed in Note 2, assets and liabilities subject to the accounting guidance for fair value measurementsheld by Sony are classified and accounted for as described below.
(1) Assets and liabilities that are measured at fair value on a recurring basis:
The following section describes the valuation techniques used by Sony to measure different financialinstruments at fair value, including an indication of the level in the fair value hierarchy in which each instrumentis generally classified.
Trading securities, available-for-sale securities and other investments
Where quoted prices are available in an active market, securities are classified in level 1 of the fair valuehierarchy. Level 1 securities include exchange-traded equities. If quoted market prices are not available for thespecific security or the market is inactive, then fair values are estimated by using pricing models, quoted prices ofsecurities with similar characteristics or discounted cash flows and mainly classified in level 2 of the hierarchy.Level 2 securities include debt securities with quoted prices that are traded less frequently than exchange-tradedinstruments, such as the majority of government bonds and corporate bonds. In certain cases where there islimited activity or less transparency around inputs to the valuation, securities are classified within level 3 of thefair value hierarchy. Level 3 securities do not have actively traded quotes at the balance sheet date and requirethe use of unobservable inputs, such as indicative quotes from dealers and qualitative input from investmentadvisors, to value these securities. Level 3 assets include financial instruments whose value is determined usingpricing models, discounted cash flow techniques, or similar techniques, as well as instruments for which thedetermination of fair value requires significant management judgment or estimation of assumptions that marketparticipants would use in pricing the asset. Level 3 securities primarily include certain hybrid financialinstruments and certain private equity investments not classified within levels 1 or 2.
Derivatives
Exchange-traded derivatives valued using quoted prices are classified within level 1 of the fair valuehierarchy. However, few classes of derivative contracts are listed on an exchange; thus, the majority of Sony’s
F-43
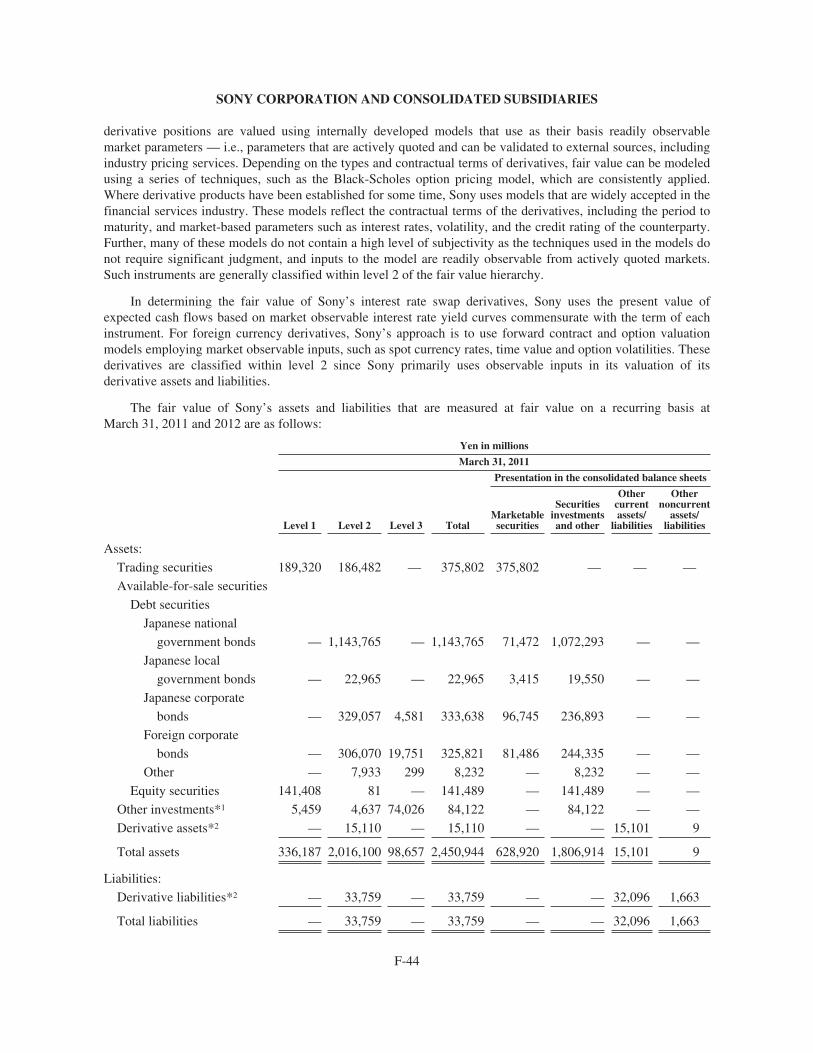
SONY CORPORATION AND CONSOLIDATED SUBSIDIARIES
derivative positions are valued using internally developed models that use as their basis readily observablemarket parameters — i.e., parameters that are actively quoted and can be validated to external sources, includingindustry pricing services. Depending on the types and contractual terms of derivatives, fair value can be modeledusing a series of techniques, such as the Black-Scholes option pricing model, which are consistently applied.Where derivative products have been established for some time, Sony uses models that are widely accepted in thefinancial services industry. These models reflect the contractual terms of the derivatives, including the period tomaturity, and market-based parameters such as interest rates, volatility, and the credit rating of the counterparty.Further, many of these models do not contain a high level of subjectivity as the techniques used in the models donot require significant judgment, and inputs to the model are readily observable from actively quoted markets.Such instruments are generally classified within level 2 of the fair value hierarchy.
In determining the fair value of Sony’s interest rate swap derivatives, Sony uses the present value ofexpected cash flows based on market observable interest rate yield curves commensurate with the term of eachinstrument. For foreign currency derivatives, Sony’s approach is to use forward contract and option valuationmodels employing market observable inputs, such as spot currency rates, time value and option volatilities. Thesederivatives are classified within level 2 since Sony primarily uses observable inputs in its valuation of itsderivative assets and liabilities.
The fair value of Sony’s assets and liabilities that are measured at fair value on a recurring basis atMarch 31, 2011 and 2012 are as follows:
Yen in millions
March 31, 2011
Presentation in the consolidated balance sheets
Level 1 Level 2 Level 3 TotalMarketablesecurities
Securitiesinvestmentsand other
Othercurrentassets/
liabilities
Othernoncurrent
assets/liabilities
Assets:
Trading securities 189,320 186,482 — 375,802 375,802 — — —
Available-for-sale securities
Debt securities
Japanese national
government bonds — 1,143,765 — 1,143,765 71,472 1,072,293 — —
Japanese local
government bonds — 22,965 — 22,965 3,415 19,550 — —
Japanese corporate
bonds — 329,057 4,581 333,638 96,745 236,893 — —
Foreign corporate
bonds — 306,070 19,751 325,821 81,486 244,335 — —
Other — 7,933 299 8,232 — 8,232 — —
Equity securities 141,408 81 — 141,489 — 141,489 — —
Other investments*1 5,459 4,637 74,026 84,122 — 84,122 — —
Derivative assets*2 — 15,110 — 15,110 — — 15,101 9
Total assets 336,187 2,016,100 98,657 2,450,944 628,920 1,806,914 15,101 9
Liabilities:
Derivative liabilities*2 — 33,759 — 33,759 — — 32,096 1,663
Total liabilities — 33,759 — 33,759 — — 32,096 1,663
F-44
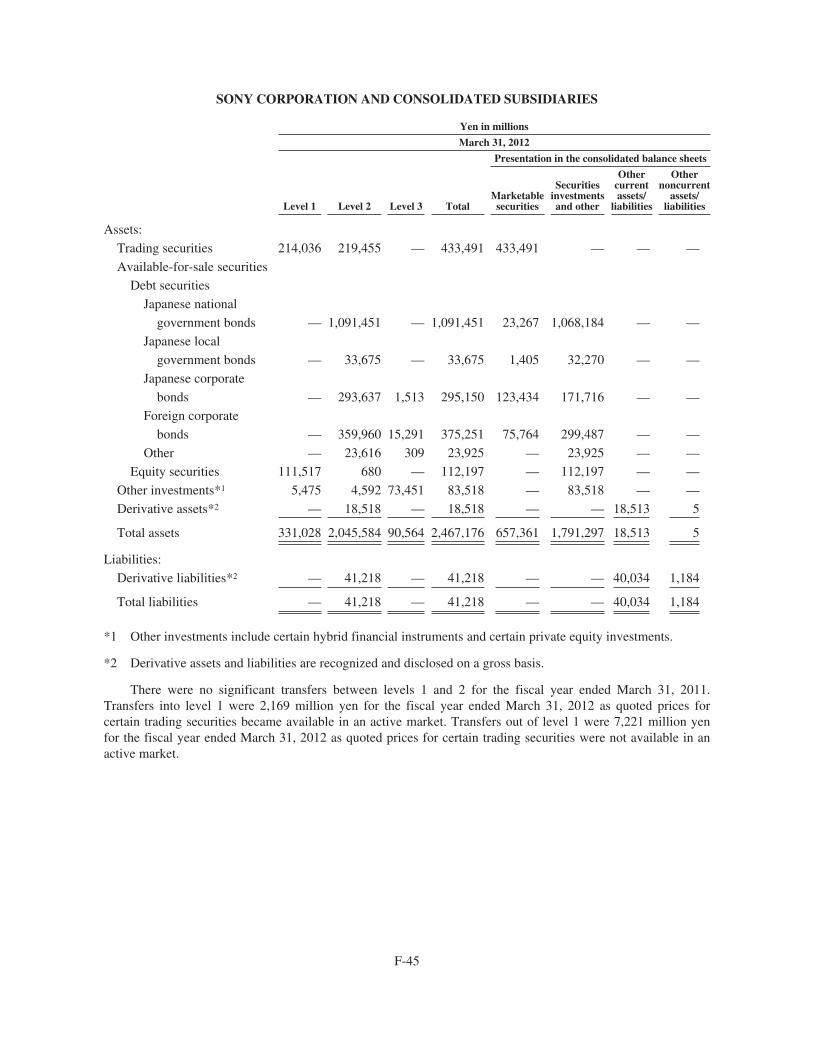
SONY CORPORATION AND CONSOLIDATED SUBSIDIARIES
Yen in millions
March 31, 2012
Presentation in the consolidated balance sheets
Level 1 Level 2 Level 3 TotalMarketablesecurities
Securitiesinvestmentsand other
Othercurrentassets/
liabilities
Othernoncurrent
assets/liabilities
Assets:
Trading securities 214,036 219,455 — 433,491 433,491 — — —
Available-for-sale securities
Debt securities
Japanese national
government bonds — 1,091,451 — 1,091,451 23,267 1,068,184 — —
Japanese local
government bonds — 33,675 — 33,675 1,405 32,270 — —
Japanese corporate
bonds — 293,637 1,513 295,150 123,434 171,716 — —
Foreign corporate
bonds — 359,960 15,291 375,251 75,764 299,487 — —
Other — 23,616 309 23,925 — 23,925 — —
Equity securities 111,517 680 — 112,197 — 112,197 — —
Other investments*1 5,475 4,592 73,451 83,518 — 83,518 — —
Derivative assets*2 — 18,518 — 18,518 — — 18,513 5
Total assets 331,028 2,045,584 90,564 2,467,176 657,361 1,791,297 18,513 5
Liabilities:
Derivative liabilities*2 — 41,218 — 41,218 — — 40,034 1,184
Total liabilities — 41,218 — 41,218 — — 40,034 1,184
*1 Other investments include certain hybrid financial instruments and certain private equity investments.
*2 Derivative assets and liabilities are recognized and disclosed on a gross basis.
There were no significant transfers between levels 1 and 2 for the fiscal year ended March 31, 2011.Transfers into level 1 were 2,169 million yen for the fiscal year ended March 31, 2012 as quoted prices forcertain trading securities became available in an active market. Transfers out of level 1 were 7,221 million yenfor the fiscal year ended March 31, 2012 as quoted prices for certain trading securities were not available in anactive market.
F-45
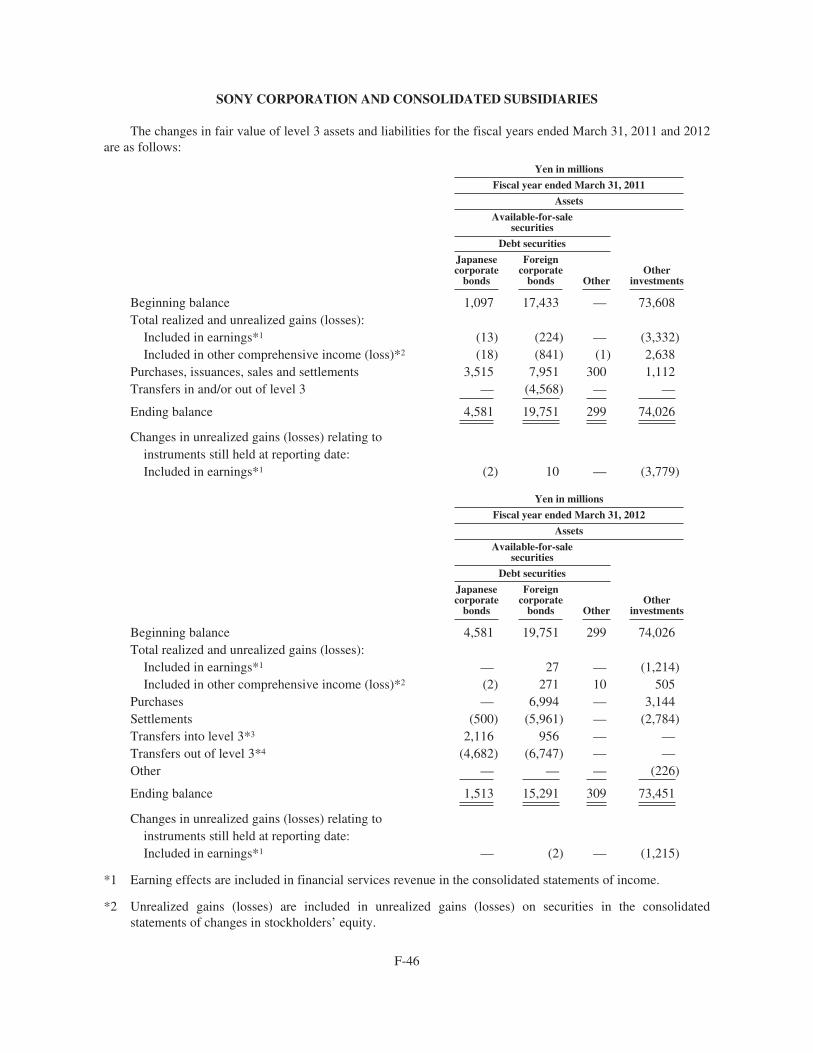
SONY CORPORATION AND CONSOLIDATED SUBSIDIARIES
The changes in fair value of level 3 assets and liabilities for the fiscal years ended March 31, 2011 and 2012are as follows:
Yen in millions
Fiscal year ended March 31, 2011
Assets
Available-for-salesecurities
Otherinvestments
Debt securities
Japanesecorporate
bonds
Foreigncorporate
bonds Other
Beginning balance 1,097 17,433 — 73,608Total realized and unrealized gains (losses):
Included in earnings*1 (13) (224) — (3,332)Included in other comprehensive income (loss)*2 (18) (841) (1) 2,638
Purchases, issuances, sales and settlements 3,515 7,951 300 1,112Transfers in and/or out of level 3 — (4,568) — —
Ending balance 4,581 19,751 299 74,026
Changes in unrealized gains (losses) relating toinstruments still held at reporting date:Included in earnings*1 (2) 10 — (3,779)
Yen in millions
Fiscal year ended March 31, 2012
Assets
Available-for-salesecurities
Otherinvestments
Debt securities
Japanesecorporate
bonds
Foreigncorporate
bonds Other
Beginning balance 4,581 19,751 299 74,026Total realized and unrealized gains (losses):
Included in earnings*1 — 27 — (1,214)Included in other comprehensive income (loss)*2 (2) 271 10 505
Purchases — 6,994 — 3,144Settlements (500) (5,961) — (2,784)Transfers into level 3*3 2,116 956 — —Transfers out of level 3*4 (4,682) (6,747) — —Other — — — (226)
Ending balance 1,513 15,291 309 73,451
Changes in unrealized gains (losses) relating toinstruments still held at reporting date:Included in earnings*1 — (2) — (1,215)
*1 Earning effects are included in financial services revenue in the consolidated statements of income.
*2 Unrealized gains (losses) are included in unrealized gains (losses) on securities in the consolidatedstatements of changes in stockholders’ equity.
F-46
SONY CORPORATION AND CONSOLIDATED SUBSIDIARIES
*3 Certain corporate bonds were transferred into level 3 because differences between fair value determined byindicative quotes from dealers and internally developed prices became significant and the observability ofinputs decreased.
*4 Certain corporate bonds were transferred out of level 3 because quoted prices became available.
Level 3 assets include certain hybrid financial instruments for which the price fluctuates primarily based onthe main stock index in Japan (Nikkei index), certain private equity investments, and certain domestic andforeign corporate bonds for which quoted prices are not available in a market and where there is lesstransparency around inputs. In determining the fair value of such assets, Sony uses third-party information suchas indicative quotes from dealers without adjustment. For validating the fair values, Sony primarily uses internalmodels which include management judgment or estimation of assumptions that market participants would use inpricing the asset.
(2) Assets and liabilities that are measured at fair value on a nonrecurring basis:
Sony also has assets and liabilities that are required to be recorded at fair value on a nonrecurring basiswhen certain circumstances occur. During the fiscal years ended March 31, 2011 and 2012, such measurementsof fair value related primarily to the impairments of long-lived assets, the remeasurement of the previouslyowned equity interests as part of the Game Show Network and Sony Ericsson acquisitions, and the S-LCDimpairment.
Long-lived assets impairments
Long-lived assets are measured at the lesser of carrying value or fair value if such assets are held for sale orwhen there is a determination that the asset is impaired. During the fiscal years ended March 31, 2011 and 2012,Sony recorded impairment losses of 23,735 million yen and 59,583 million yen related to long-lived assets withcarrying values prior to impairment of 27,513 million yen and 67,875 million yen; the fair value of the long-livedassets after impairments was 3,778 million yen and 8,292 million yen, respectively. Sony’s determination of fairvalue was based on the comparable market values or estimated net cash flows which considered prices and otherrelevant information generated by market transactions involving comparable assets or cash flow projectionsbased upon the most recent business plan. These measurements are classified as level 3 because significantunobservable inputs, such as the conditions of the assets or projections of future cash flows, were considered inthe fair value measurements.
Remeasurement of previously owned equity interests
During the fiscal years ended March 31, 2011 and 2012, Sony remeasured to fair value the previouslyowned equity interests as part of the Game Show Network and Sony Ericsson acquisitions. These measurementsare classified as level 3 because significant unobservable inputs, such as projections of future cash flows andmarket comparables of similar transactions and companies were considered in the fair value measurements. Referto Note 24.
S-LCD impairment
During the fiscal year ended March 31, 2012, Sony recorded a 60,019 million yen other-than-temporaryimpairment loss on its share of S-LCD, including the reclassification to net income of foreign currencytranslation adjustments and the impact of the exchange rate fluctuations between the initial impairment loss andclosing of the sale to Samsung. The fair value of the shares of S-LCD after impairment was 71,662 million yenwhich approximated the cash consideration of 1.07 trillion Korean won subsequently received from Samsungupon its acquisition of Sony’s share of S-LCD. This measurement is classified as level 3 because significantunobservable inputs, primarily the estimate of the cash that would be received upon the sale to Samsung wereconsidered in the fair value measurement. Refer to Note 5.
F-47
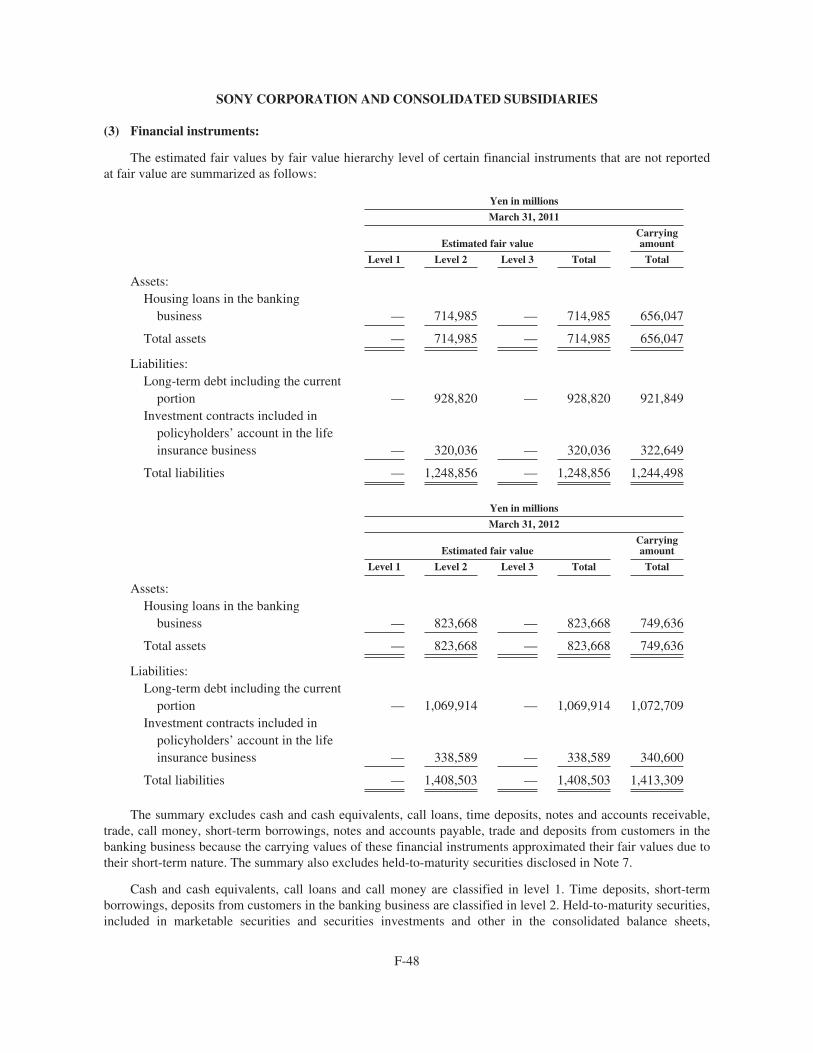
SONY CORPORATION AND CONSOLIDATED SUBSIDIARIES
(3) Financial instruments:
The estimated fair values by fair value hierarchy level of certain financial instruments that are not reportedat fair value are summarized as follows:
Yen in millions
March 31, 2011
Estimated fair valueCarryingamount
Level 1 Level 2 Level 3 Total Total
Assets:Housing loans in the banking
business — 714,985 — 714,985 656,047
Total assets — 714,985 — 714,985 656,047
Liabilities:Long-term debt including the current
portion — 928,820 — 928,820 921,849Investment contracts included in
policyholders’ account in the lifeinsurance business — 320,036 — 320,036 322,649
Total liabilities — 1,248,856 — 1,248,856 1,244,498
Yen in millions
March 31, 2012
Estimated fair valueCarryingamount
Level 1 Level 2 Level 3 Total Total
Assets:Housing loans in the banking
business — 823,668 — 823,668 749,636
Total assets — 823,668 — 823,668 749,636
Liabilities:Long-term debt including the current
portion — 1,069,914 — 1,069,914 1,072,709Investment contracts included in
policyholders’ account in the lifeinsurance business — 338,589 — 338,589 340,600
Total liabilities — 1,408,503 — 1,408,503 1,413,309
The summary excludes cash and cash equivalents, call loans, time deposits, notes and accounts receivable,trade, call money, short-term borrowings, notes and accounts payable, trade and deposits from customers in thebanking business because the carrying values of these financial instruments approximated their fair values due totheir short-term nature. The summary also excludes held-to-maturity securities disclosed in Note 7.
Cash and cash equivalents, call loans and call money are classified in level 1. Time deposits, short-termborrowings, deposits from customers in the banking business are classified in level 2. Held-to-maturity securities,included in marketable securities and securities investments and other in the consolidated balance sheets,
F-48
SONY CORPORATION AND CONSOLIDATED SUBSIDIARIES
primarily include debt securities with quoted prices that are traded less frequently than exchange-tradedinstruments, such as the majority of government bonds and corporate bonds and are substantially all classified inlevel 2. The fair values of housing loans in the banking business, included in securities investments and other inthe consolidated balance sheets, were estimated based on the discounted future cash flows using interest ratesreflecting London InterBank Offered Rate base yield curve with a certain risk premium. The fair values of long-term debt including the current portion and investment contracts included in policyholders’ account in the lifeinsurance business were estimated based on either the market value or the discounted future cash flows usingSony’s current incremental borrowing rates for similar liabilities.
14. Derivative instruments and hedging activities
Sony has certain financial instruments including financial assets and liabilities acquired in the normal courseof business. Such financial instruments are exposed to market risk arising from the changes of foreign currencyexchange rates and interest rates. In applying a consistent risk management strategy for the purpose of reducingsuch risk, Sony uses derivative financial instruments, which include foreign exchange forward contracts, foreigncurrency option contracts, and interest rate swap agreements (including interest rate and currency swapagreements). Certain other derivative financial instruments are entered into in the Financial Services segment forasset-liability management (ALM) purposes. These instruments are executed with creditworthy financialinstitutions, and virtually all foreign currency contracts are denominated in U.S. dollars, euros and othercurrencies of major countries. These derivatives generally mature or expire within six months after the balancesheet date. Other than derivatives utilized in the Financial Services segment for ALM, Sony does not usederivative financial instruments for trading or speculative purposes. These derivative transactions utilized forALM in the Financial Services segment are executed within a certain limit in accordance with an internal riskmanagement policy.
Derivative financial instruments held by Sony are classified and accounted for as described below.
Fair value hedges
Both the derivatives designated as fair value hedges and the hedged items are reflected at fair value in theconsolidated balance sheets. Changes in the fair value of the derivatives designated as fair value hedges as wellas offsetting changes in the carrying value of the underlying hedged items are recognized in income. For thefiscal years ended March 31, 2010, 2011 and 2012, these fair value hedges were fully effective. In addition, therewere no amounts excluded from the assessment of hedge effectiveness of fair value hedges.
Cash flow hedges
Changes in the fair value of derivatives designated as cash flow hedges are initially recorded in othercomprehensive income (“OCI”) and reclassified into earnings when the hedged transaction affects earnings. Forthe fiscal years ended March 31, 2010, 2011 and 2012, the ineffective portion of the hedging relationship is notsignificant. In addition, there were no amounts excluded from the assessment of hedge effectiveness for cashflow hedges.
Derivatives not designated as hedges
Changes in the fair value of derivatives not designated as hedges are recognized in income.
A description of the purpose and classification of the derivative financial instruments held by Sony is asfollows:
Foreign exchange forward contracts and foreign currency option contracts
Foreign exchange forward contracts and purchased and written foreign currency option contracts are utilizedprimarily to limit the exposure affected by changes in foreign currency exchange rates on cash flows generated
F-49
SONY CORPORATION AND CONSOLIDATED SUBSIDIARIES
by anticipated intercompany transactions and intercompany accounts receivable and payable denominated inforeign currencies. The majority of written foreign currency option contracts are a part of range forward contractarrangements and expire in the same month with the corresponding purchased foreign currency option contracts.
Sony also enters into foreign exchange forward contracts, which effectively fix the cash flows from foreigncurrency denominated debt. Accordingly, these derivatives have been designated as cash flow hedges.
Foreign exchange forward contracts and foreign currency option contracts that do not qualify as hedges aremarked-to-market with changes in value recognized in other income and expenses.
Foreign exchange forward contracts, foreign currency option contracts and currency swap agreements heldby certain subsidiaries in the Financial Services segment are marked-to-market with changes in value recognizedin financial service revenue.
Interest rate swap agreements (including interest rate and currency swap agreements)
Interest rate swap agreements are utilized primarily to lower funding costs, to diversify sources of fundingand to limit Sony’s exposure associated with underlying debt instruments and available-for-sale debt securitiesresulting from adverse fluctuations in interest rates, foreign currency exchange rates and changes in fair values.Interest rate swap agreements entered into in the Financial Services segment are used for reducing the risk arisingfrom the changes in the fair value of fixed rate available-for-sale debt securities. These derivatives are consideredto be a hedge against changes in the fair value of available-for-sale debt securities in the Financial Servicessegment. Accordingly, these derivatives have been designated as fair value hedges.
Sony also enters into certain interest rate swap agreements for the purpose of reducing the risk arising fromthe changes in anticipated cash flows of variable rate debt and foreign currency denominated debt. These interestrate swap agreements, which effectively swap foreign currency denominated variable rate debt for functionalcurrency denominated fixed rate debt, are considered to be a hedge against changes in the anticipated cash flowsof Sony’s foreign denominated variable rate obligations. Accordingly, these derivatives have been designated ascash flow hedges.
Certain subsidiaries in the Financial Services segment have interest rate swap agreements as part of theirALM, which are marked-to-market with changes in value recognized in financial service revenue.
Any other interest rate swap agreements that do not qualify as hedges, which are used for reducing the riskarising from changes of variable rate debt, are marked-to-market with changes in value recognized in otherincome and expenses.
Other agreements
Certain subsidiaries in the Financial Services segment have credit default swap agreements, equity futurecontracts, other currency contracts and hybrid financial instruments as part of their ALM, which aremarked-to-market with changes in value recognized in financial services revenue. The hybrid financialinstruments, disclosed in Note 7 as debt securities, contain embedded derivatives that are not required to bebifurcated because the entire instruments are carried at fair value.
F-50
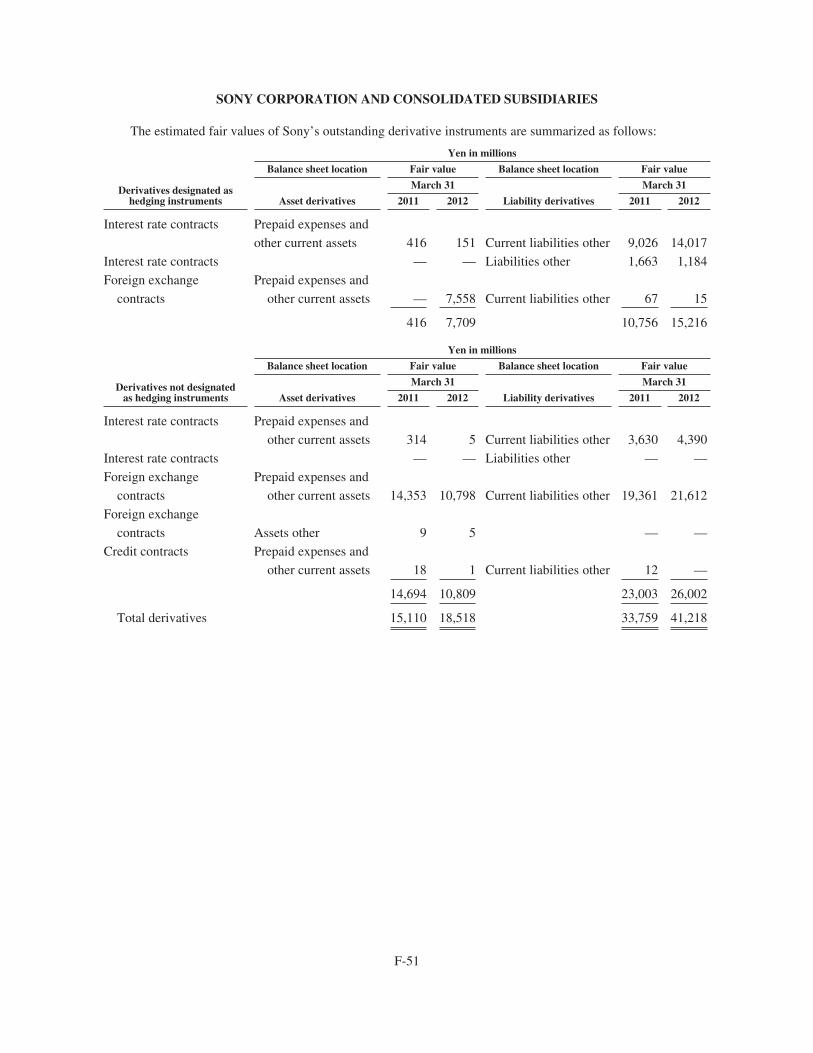
SONY CORPORATION AND CONSOLIDATED SUBSIDIARIES
The estimated fair values of Sony’s outstanding derivative instruments are summarized as follows:
Derivatives designated ashedging instruments
Yen in millions
Balance sheet location Fair value Balance sheet location Fair value
March 31 March 31
Asset derivatives 2011 2012 Liability derivatives 2011 2012
Interest rate contracts Prepaid expenses and
other current assets 416 151 Current liabilities other 9,026 14,017
Interest rate contracts — — Liabilities other 1,663 1,184
Foreign exchange
contracts
Prepaid expenses and
other current assets — 7,558 Current liabilities other 67 15
416 7,709 10,756 15,216
Derivatives not designatedas hedging instruments
Yen in millions
Balance sheet location Fair value Balance sheet location Fair value
March 31 March 31
Asset derivatives 2011 2012 Liability derivatives 2011 2012
Interest rate contracts Prepaid expenses and
other current assets 314 5 Current liabilities other 3,630 4,390
Interest rate contracts — — Liabilities other — —
Foreign exchange
contracts
Prepaid expenses and
other current assets 14,353 10,798 Current liabilities other 19,361 21,612
Foreign exchange
contracts Assets other 9 5 — —
Credit contracts Prepaid expenses and
other current assets 18 1 Current liabilities other 12 —
14,694 10,809 23,003 26,002
Total derivatives 15,110 18,518 33,759 41,218
F-51
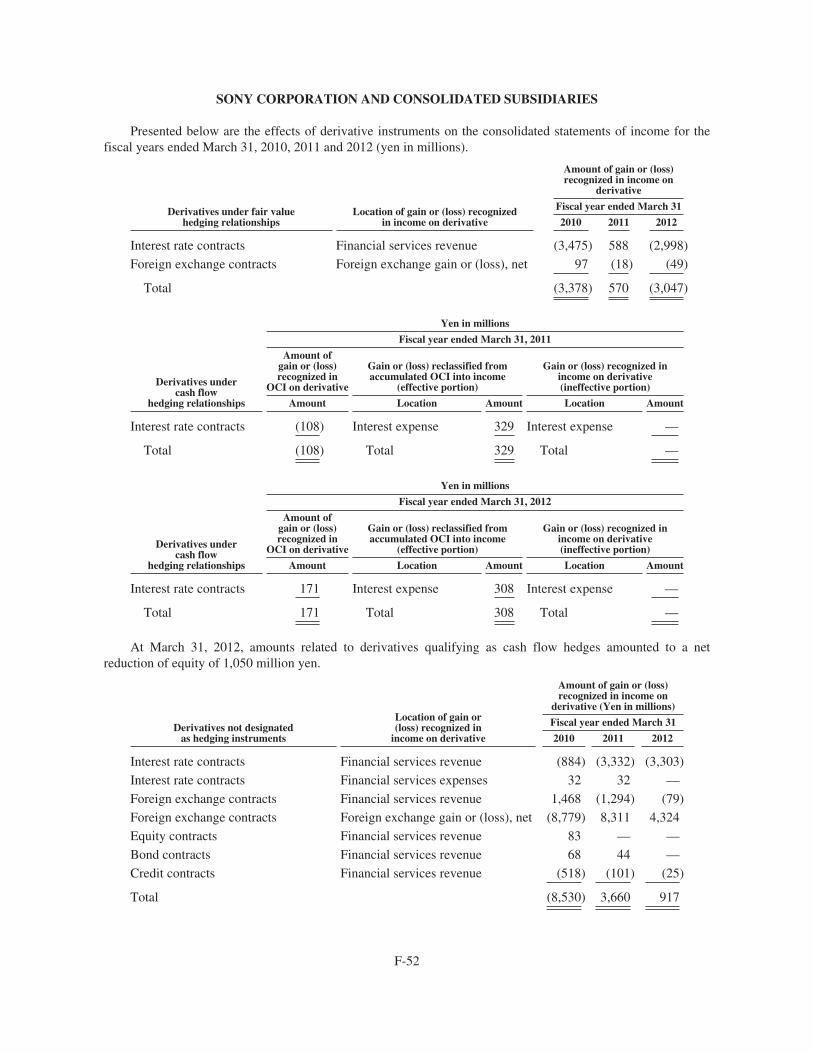
SONY CORPORATION AND CONSOLIDATED SUBSIDIARIES
Presented below are the effects of derivative instruments on the consolidated statements of income for thefiscal years ended March 31, 2010, 2011 and 2012 (yen in millions).
Derivatives under fair valuehedging relationships
Location of gain or (loss) recognizedin income on derivative
Amount of gain or (loss)recognized in income on
derivative
Fiscal year ended March 31
2010 2011 2012
Interest rate contracts Financial services revenue (3,475) 588 (2,998)
Foreign exchange contracts Foreign exchange gain or (loss), net 97 (18) (49)
Total (3,378) 570 (3,047)
Derivatives undercash flow
hedging relationships
Yen in millions
Fiscal year ended March 31, 2011
Amount ofgain or (loss)recognized in
OCI on derivative
Gain or (loss) reclassified fromaccumulated OCI into income
(effective portion)
Gain or (loss) recognized inincome on derivative(ineffective portion)
Amount Location Amount Location Amount
Interest rate contracts (108) Interest expense 329 Interest expense —
Total (108) Total 329 Total —
Derivatives undercash flow
hedging relationships
Yen in millions
Fiscal year ended March 31, 2012
Amount ofgain or (loss)recognized in
OCI on derivative
Gain or (loss) reclassified fromaccumulated OCI into income
(effective portion)
Gain or (loss) recognized inincome on derivative(ineffective portion)
Amount Location Amount Location Amount
Interest rate contracts 171 Interest expense 308 Interest expense —
Total 171 Total 308 Total —
At March 31, 2012, amounts related to derivatives qualifying as cash flow hedges amounted to a netreduction of equity of 1,050 million yen.
Derivatives not designatedas hedging instruments
Location of gain or(loss) recognized in
income on derivative
Amount of gain or (loss)recognized in income on
derivative (Yen in millions)
Fiscal year ended March 31
2010 2011 2012
Interest rate contracts Financial services revenue (884) (3,332) (3,303)
Interest rate contracts Financial services expenses 32 32 —
Foreign exchange contracts Financial services revenue 1,468 (1,294) (79)
Foreign exchange contracts Foreign exchange gain or (loss), net (8,779) 8,311 4,324
Equity contracts Financial services revenue 83 — —
Bond contracts Financial services revenue 68 44 —
Credit contracts Financial services revenue (518) (101) (25)
Total (8,530) 3,660 917
F-52
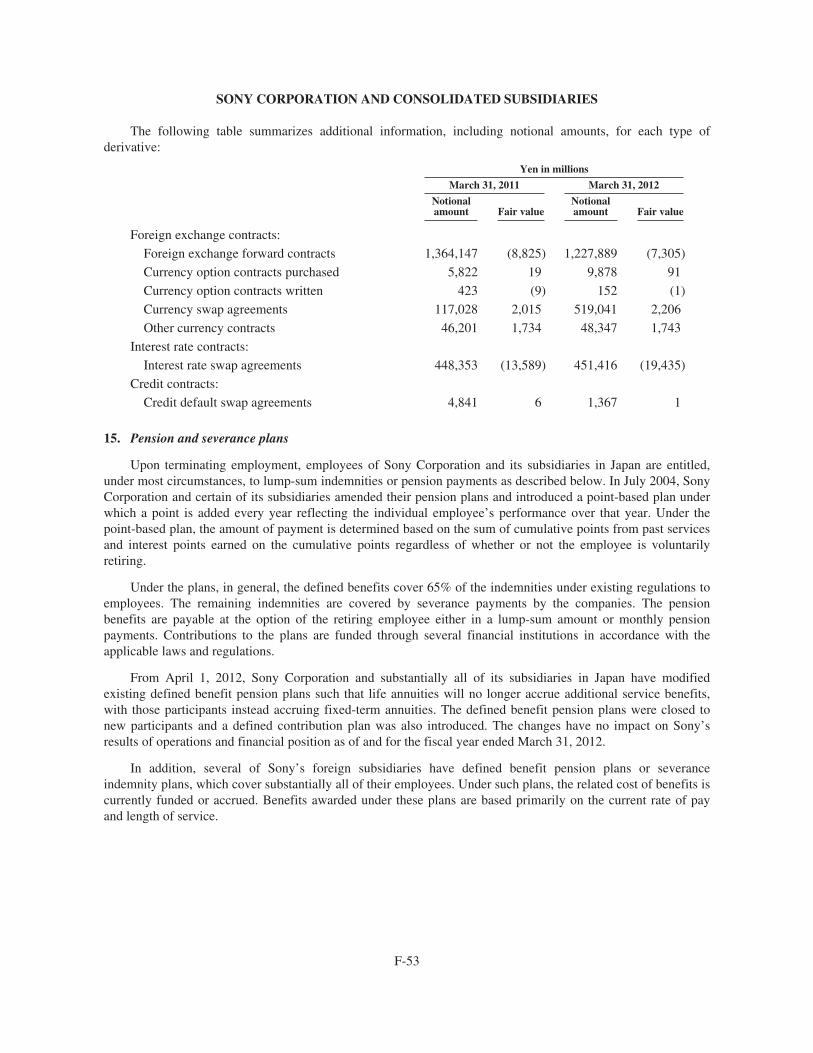
SONY CORPORATION AND CONSOLIDATED SUBSIDIARIES
The following table summarizes additional information, including notional amounts, for each type ofderivative:
Yen in millions
March 31, 2011 March 31, 2012
Notionalamount Fair value
Notionalamount Fair value
Foreign exchange contracts:
Foreign exchange forward contracts 1,364,147 (8,825) 1,227,889 (7,305)
Currency option contracts purchased 5,822 19 9,878 91
Currency option contracts written 423 (9) 152 (1)
Currency swap agreements 117,028 2,015 519,041 2,206
Other currency contracts 46,201 1,734 48,347 1,743
Interest rate contracts:
Interest rate swap agreements 448,353 (13,589) 451,416 (19,435)
Credit contracts:
Credit default swap agreements 4,841 6 1,367 1
15. Pension and severance plans
Upon terminating employment, employees of Sony Corporation and its subsidiaries in Japan are entitled,under most circumstances, to lump-sum indemnities or pension payments as described below. In July 2004, SonyCorporation and certain of its subsidiaries amended their pension plans and introduced a point-based plan underwhich a point is added every year reflecting the individual employee’s performance over that year. Under thepoint-based plan, the amount of payment is determined based on the sum of cumulative points from past servicesand interest points earned on the cumulative points regardless of whether or not the employee is voluntarilyretiring.
Under the plans, in general, the defined benefits cover 65% of the indemnities under existing regulations toemployees. The remaining indemnities are covered by severance payments by the companies. The pensionbenefits are payable at the option of the retiring employee either in a lump-sum amount or monthly pensionpayments. Contributions to the plans are funded through several financial institutions in accordance with theapplicable laws and regulations.
From April 1, 2012, Sony Corporation and substantially all of its subsidiaries in Japan have modifiedexisting defined benefit pension plans such that life annuities will no longer accrue additional service benefits,with those participants instead accruing fixed-term annuities. The defined benefit pension plans were closed tonew participants and a defined contribution plan was also introduced. The changes have no impact on Sony’sresults of operations and financial position as of and for the fiscal year ended March 31, 2012.
In addition, several of Sony’s foreign subsidiaries have defined benefit pension plans or severanceindemnity plans, which cover substantially all of their employees. Under such plans, the related cost of benefits iscurrently funded or accrued. Benefits awarded under these plans are based primarily on the current rate of payand length of service.
F-53
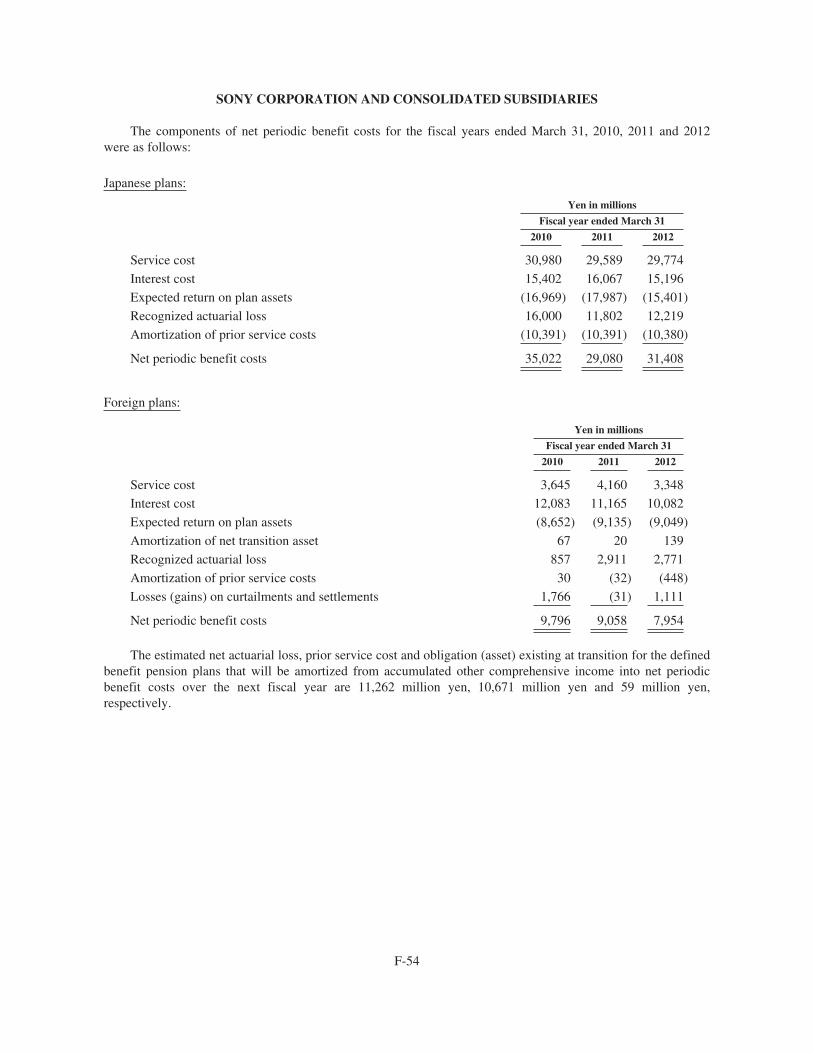
SONY CORPORATION AND CONSOLIDATED SUBSIDIARIES
The components of net periodic benefit costs for the fiscal years ended March 31, 2010, 2011 and 2012were as follows:
Japanese plans:
Yen in millions
Fiscal year ended March 31
2010 2011 2012
Service cost 30,980 29,589 29,774
Interest cost 15,402 16,067 15,196
Expected return on plan assets (16,969) (17,987) (15,401)
Recognized actuarial loss 16,000 11,802 12,219
Amortization of prior service costs (10,391) (10,391) (10,380)
Net periodic benefit costs 35,022 29,080 31,408
Foreign plans:
Yen in millions
Fiscal year ended March 31
2010 2011 2012
Service cost 3,645 4,160 3,348
Interest cost 12,083 11,165 10,082
Expected return on plan assets (8,652) (9,135) (9,049)
Amortization of net transition asset 67 20 139
Recognized actuarial loss 857 2,911 2,771
Amortization of prior service costs 30 (32) (448)
Losses (gains) on curtailments and settlements 1,766 (31) 1,111
Net periodic benefit costs 9,796 9,058 7,954
The estimated net actuarial loss, prior service cost and obligation (asset) existing at transition for the definedbenefit pension plans that will be amortized from accumulated other comprehensive income into net periodicbenefit costs over the next fiscal year are 11,262 million yen, 10,671 million yen and 59 million yen,respectively.
F-54
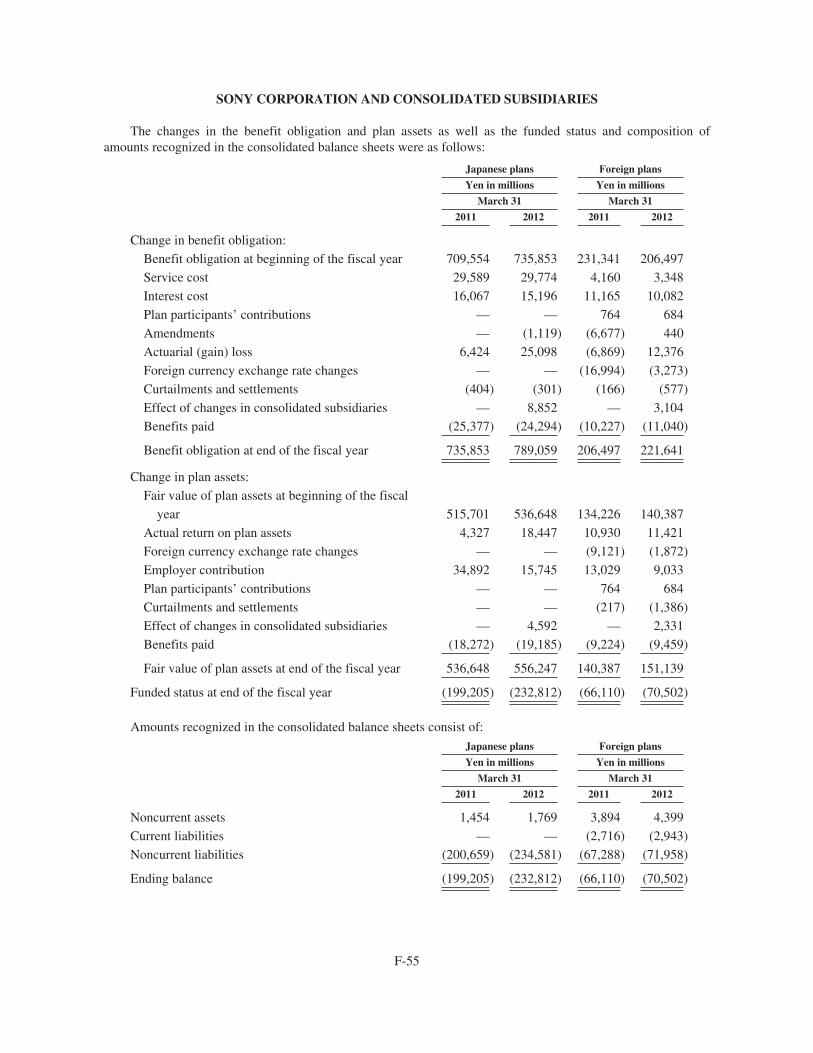
SONY CORPORATION AND CONSOLIDATED SUBSIDIARIES
The changes in the benefit obligation and plan assets as well as the funded status and composition ofamounts recognized in the consolidated balance sheets were as follows:
Japanese plans Foreign plans
Yen in millions Yen in millions
March 31 March 31
2011 2012 2011 2012
Change in benefit obligation:
Benefit obligation at beginning of the fiscal year 709,554 735,853 231,341 206,497
Service cost 29,589 29,774 4,160 3,348
Interest cost 16,067 15,196 11,165 10,082
Plan participants’ contributions — — 764 684
Amendments — (1,119) (6,677) 440
Actuarial (gain) loss 6,424 25,098 (6,869) 12,376
Foreign currency exchange rate changes — — (16,994) (3,273)
Curtailments and settlements (404) (301) (166) (577)
Effect of changes in consolidated subsidiaries — 8,852 — 3,104
Benefits paid (25,377) (24,294) (10,227) (11,040)
Benefit obligation at end of the fiscal year 735,853 789,059 206,497 221,641
Change in plan assets:
Fair value of plan assets at beginning of the fiscal
year 515,701 536,648 134,226 140,387
Actual return on plan assets 4,327 18,447 10,930 11,421
Foreign currency exchange rate changes — — (9,121) (1,872)
Employer contribution 34,892 15,745 13,029 9,033
Plan participants’ contributions — — 764 684
Curtailments and settlements — — (217) (1,386)
Effect of changes in consolidated subsidiaries — 4,592 — 2,331
Benefits paid (18,272) (19,185) (9,224) (9,459)
Fair value of plan assets at end of the fiscal year 536,648 556,247 140,387 151,139
Funded status at end of the fiscal year (199,205) (232,812) (66,110) (70,502)
Amounts recognized in the consolidated balance sheets consist of:
Japanese plans Foreign plans
Yen in millions Yen in millions
March 31 March 31
2011 2012 2011 2012
Noncurrent assets 1,454 1,769 3,894 4,399
Current liabilities — — (2,716) (2,943)
Noncurrent liabilities (200,659) (234,581) (67,288) (71,958)
Ending balance (199,205) (232,812) (66,110) (70,502)
F-55
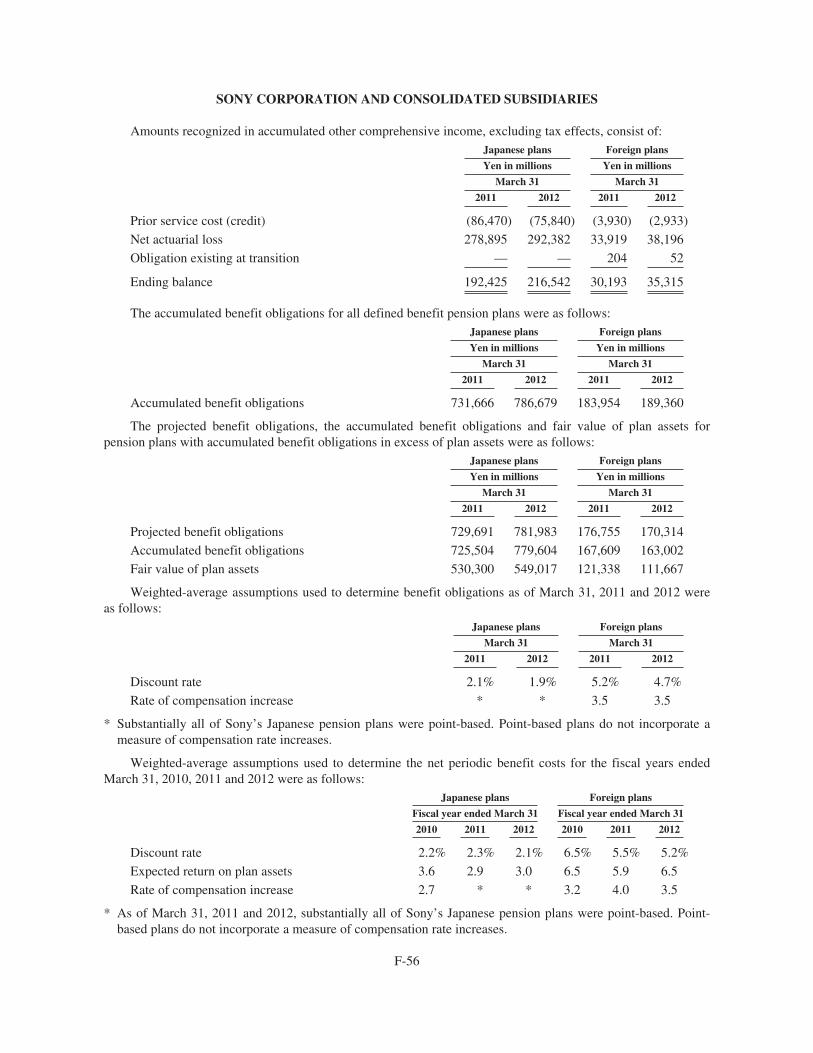
SONY CORPORATION AND CONSOLIDATED SUBSIDIARIES
Amounts recognized in accumulated other comprehensive income, excluding tax effects, consist of:Japanese plans Foreign plans
Yen in millions Yen in millions
March 31 March 31
2011 2012 2011 2012
Prior service cost (credit) (86,470) (75,840) (3,930) (2,933)
Net actuarial loss 278,895 292,382 33,919 38,196
Obligation existing at transition — — 204 52
Ending balance 192,425 216,542 30,193 35,315
The accumulated benefit obligations for all defined benefit pension plans were as follows:Japanese plans Foreign plans
Yen in millions Yen in millions
March 31 March 31
2011 2012 2011 2012
Accumulated benefit obligations 731,666 786,679 183,954 189,360
The projected benefit obligations, the accumulated benefit obligations and fair value of plan assets forpension plans with accumulated benefit obligations in excess of plan assets were as follows:
Japanese plans Foreign plans
Yen in millions Yen in millions
March 31 March 31
2011 2012 2011 2012
Projected benefit obligations 729,691 781,983 176,755 170,314
Accumulated benefit obligations 725,504 779,604 167,609 163,002
Fair value of plan assets 530,300 549,017 121,338 111,667
Weighted-average assumptions used to determine benefit obligations as of March 31, 2011 and 2012 wereas follows:
Japanese plans Foreign plans
March 31 March 31
2011 2012 2011 2012
Discount rate 2.1% 1.9% 5.2% 4.7%
Rate of compensation increase * * 3.5 3.5
* Substantially all of Sony’s Japanese pension plans were point-based. Point-based plans do not incorporate ameasure of compensation rate increases.
Weighted-average assumptions used to determine the net periodic benefit costs for the fiscal years endedMarch 31, 2010, 2011 and 2012 were as follows:
Japanese plans Foreign plans
Fiscal year ended March 31 Fiscal year ended March 31
2010 2011 2012 2010 2011 2012
Discount rate 2.2% 2.3% 2.1% 6.5% 5.5% 5.2%
Expected return on plan assets 3.6 2.9 3.0 6.5 5.9 6.5
Rate of compensation increase 2.7 * * 3.2 4.0 3.5
* As of March 31, 2011 and 2012, substantially all of Sony’s Japanese pension plans were point-based. Point-based plans do not incorporate a measure of compensation rate increases.
F-56
SONY CORPORATION AND CONSOLIDATED SUBSIDIARIES
Sony reviews these assumptions for changes in circumstances.
The weighted-average rate of compensation increase is calculated based only on the pay-related plans. Thepoint-based plans discussed above are excluded from the calculation because payments made under the plan arenot based on employee compensation.
To determine the expected long-term rate of return on pension plan assets, Sony considers the current andexpected asset allocations, as well as the historical and expected long-term rates of returns on various categoriesof plan assets. Sony’s pension investment policy recognizes the expected growth and the variability riskassociated with the long-term nature of pension liabilities, the returns and risks of diversification across assetclasses, and the correlation among assets. The asset allocations are designed to maximize returns consistent withlevels of liquidity and investment risk that are considered prudent and reasonable. While the pension investmentpolicy gives appropriate consideration to recent market performance and historical returns, the investmentassumptions utilized by Sony are designed to achieve a long-term return consistent with the long-term nature ofthe corresponding pension liabilities.
The investment objectives of Sony’s plan assets are designed to generate returns that will enable the plans tomeet their future obligations. The precise amount for which these obligations will be settled depends on futureevents, including the retirement dates and life expectancy of the plans’ participants. The obligations are estimatedusing actuarial assumptions, based on the current economic environment and other pertinent factors. Sony’sinvestment strategy balances the requirement to generate returns, using potentially higher yielding assets such asequity securities, with the need to control risk in the portfolio with less volatile assets, such as fixed-incomesecurities. Risks include, among others, inflation, volatility in equity values and changes in interest rates thatcould negatively impact the funding level of the plans, thereby increasing its dependence on contributions fromSony. To mitigate any potential concentration risk, thorough consideration is given to balancing the portfolioamong industry sectors and geographies, taking into account interest rate sensitivity, dependence on economicgrowth, currency and other factors that affect investment returns. The target allocations as of March 31, 2012,are, as a result of Sony’s asset liability management, 28% of equity securities, 58% of fixed income securitiesand 14% of other investments for the pension plans of Sony Corporation and most of its subsidiaries in Japan,and, on a weighted average basis, 46% of equity securities, 39% of fixed income securities and 15% of otherinvestments for the pension plans of foreign subsidiaries.
F-57
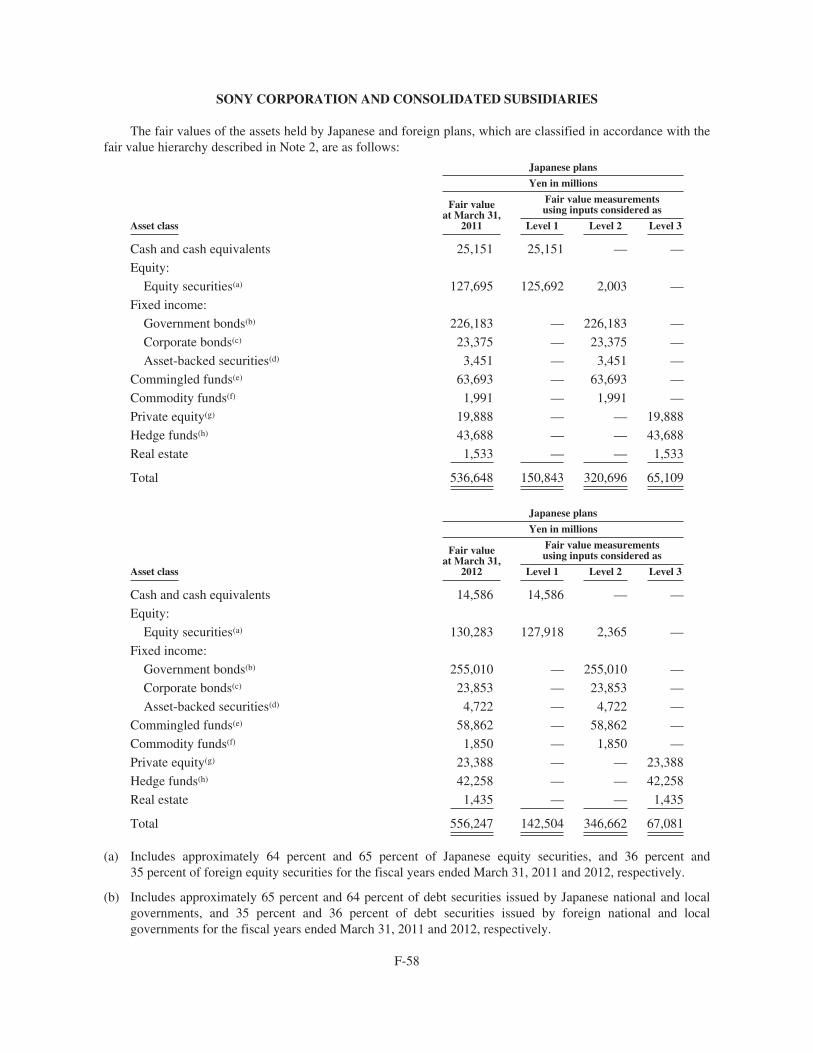
SONY CORPORATION AND CONSOLIDATED SUBSIDIARIES
The fair values of the assets held by Japanese and foreign plans, which are classified in accordance with thefair value hierarchy described in Note 2, are as follows:
Japanese plans
Yen in millions
Fair valueat March 31,
2011
Fair value measurementsusing inputs considered as
Asset class Level 1 Level 2 Level 3
Cash and cash equivalents 25,151 25,151 — —
Equity:
Equity securities(a) 127,695 125,692 2,003 —
Fixed income:
Government bonds(b) 226,183 — 226,183 —
Corporate bonds(c) 23,375 — 23,375 —
Asset-backed securities(d) 3,451 — 3,451 —
Commingled funds(e) 63,693 — 63,693 —
Commodity funds(f) 1,991 — 1,991 —
Private equity(g) 19,888 — — 19,888
Hedge funds(h) 43,688 — — 43,688
Real estate 1,533 — — 1,533
Total 536,648 150,843 320,696 65,109
Japanese plans
Yen in millions
Fair valueat March 31,
2012
Fair value measurementsusing inputs considered as
Asset class Level 1 Level 2 Level 3
Cash and cash equivalents 14,586 14,586 — —
Equity:
Equity securities(a) 130,283 127,918 2,365 —
Fixed income:
Government bonds(b) 255,010 — 255,010 —
Corporate bonds(c) 23,853 — 23,853 —
Asset-backed securities(d) 4,722 — 4,722 —
Commingled funds(e) 58,862 — 58,862 —
Commodity funds(f) 1,850 — 1,850 —
Private equity(g) 23,388 — — 23,388
Hedge funds(h) 42,258 — — 42,258
Real estate 1,435 — — 1,435
Total 556,247 142,504 346,662 67,081
(a) Includes approximately 64 percent and 65 percent of Japanese equity securities, and 36 percent and35 percent of foreign equity securities for the fiscal years ended March 31, 2011 and 2012, respectively.
(b) Includes approximately 65 percent and 64 percent of debt securities issued by Japanese national and localgovernments, and 35 percent and 36 percent of debt securities issued by foreign national and localgovernments for the fiscal years ended March 31, 2011 and 2012, respectively.
F-58
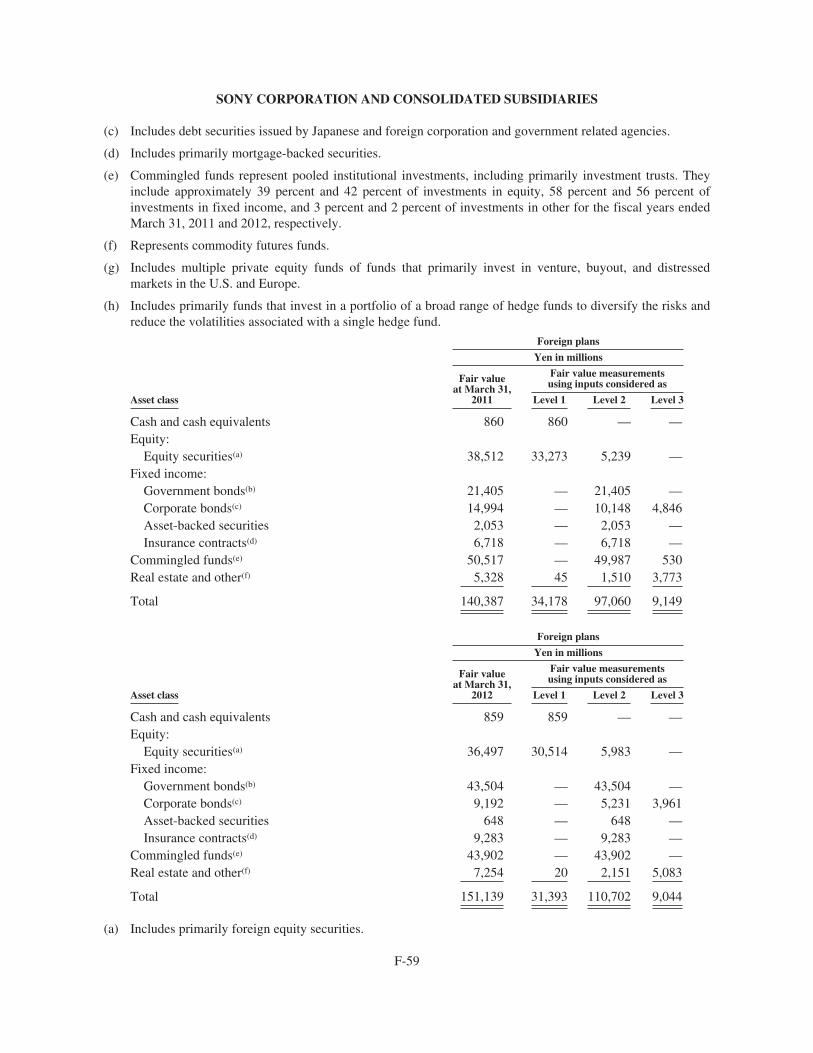
SONY CORPORATION AND CONSOLIDATED SUBSIDIARIES
(c) Includes debt securities issued by Japanese and foreign corporation and government related agencies.
(d) Includes primarily mortgage-backed securities.
(e) Commingled funds represent pooled institutional investments, including primarily investment trusts. Theyinclude approximately 39 percent and 42 percent of investments in equity, 58 percent and 56 percent ofinvestments in fixed income, and 3 percent and 2 percent of investments in other for the fiscal years endedMarch 31, 2011 and 2012, respectively.
(f) Represents commodity futures funds.
(g) Includes multiple private equity funds of funds that primarily invest in venture, buyout, and distressedmarkets in the U.S. and Europe.
(h) Includes primarily funds that invest in a portfolio of a broad range of hedge funds to diversify the risks andreduce the volatilities associated with a single hedge fund.
Foreign plans
Yen in millions
Fair valueat March 31,
2011
Fair value measurementsusing inputs considered as
Asset class Level 1 Level 2 Level 3
Cash and cash equivalents 860 860 — —Equity:
Equity securities(a) 38,512 33,273 5,239 —Fixed income:
Government bonds(b) 21,405 — 21,405 —Corporate bonds(c) 14,994 — 10,148 4,846Asset-backed securities 2,053 — 2,053 —Insurance contracts(d) 6,718 — 6,718 —
Commingled funds(e) 50,517 — 49,987 530Real estate and other(f) 5,328 45 1,510 3,773
Total 140,387 34,178 97,060 9,149
Foreign plans
Yen in millions
Fair valueat March 31,
2012
Fair value measurementsusing inputs considered as
Asset class Level 1 Level 2 Level 3
Cash and cash equivalents 859 859 — —Equity:
Equity securities(a) 36,497 30,514 5,983 —Fixed income:
Government bonds(b) 43,504 — 43,504 —Corporate bonds(c) 9,192 — 5,231 3,961Asset-backed securities 648 — 648 —Insurance contracts(d) 9,283 — 9,283 —
Commingled funds(e) 43,902 — 43,902 —Real estate and other(f) 7,254 20 2,151 5,083
Total 151,139 31,393 110,702 9,044
(a) Includes primarily foreign equity securities.
F-59
SONY CORPORATION AND CONSOLIDATED SUBSIDIARIES
(b) Includes primarily foreign government debt securities.
(c) Includes primarily foreign corporate debt securities.
(d) Represents annuity contracts with or without profit sharing.
(e) Commingled funds represent pooled institutional investments including mutual funds, common trust funds,and collective investment funds. They are primarily comprised of foreign equities and fixed incomeinvestments.
(f) Includes primarily private real estate investment trusts.
Each level in the fair value hierarchy in which each plan asset is classified is determined based on inputsused to measure the fair values of the asset, and does not necessarily indicate the risks or rating of the asset.
The following is a description of the valuation techniques used to measure Japanese and foreign plan assetsat fair value. There were no changes in valuation techniques during the fiscal years ended March 31, 2011 and2012.
Equity securities are valued at the closing price reported in the active market in which the individualsecurities are traded. These assets are generally classified as level 1.
The fair value of fixed income securities is typically estimated using pricing models, quoted prices ofsecurities with similar characteristics or discounted cash flows and are generally classified as level 2.
Commingled funds are typically valued using the net asset value provided by the administrator of the fundand reviewed by Sony. The net asset value is based on the value of the underlying assets owned by the fund,minus liabilities and divided by the number of shares or units outstanding. These assets are classified as level 1,level 2 or level 3 depending on availability of quoted market prices.
Commodity funds are valued using inputs that are derived principally from or corroborated by observablemarket data. These assets are generally classified as level 2.
Private equity and private real estate investment trust valuations require significant judgment due to theabsence of quoted market prices, the inherent lack of liquidity and the long-term nature of such assets. Theseassets are initially valued at cost and are reviewed periodically utilizing available and relevant market data todetermine if the carrying value of these assets should be adjusted. These investments are classified as level 3. Thevaluation methodology is applied consistently from period to period.
Hedge funds are valued using the net asset value as determined by the administrator or custodian of thefund. These investments are classified as level 3.
F-60
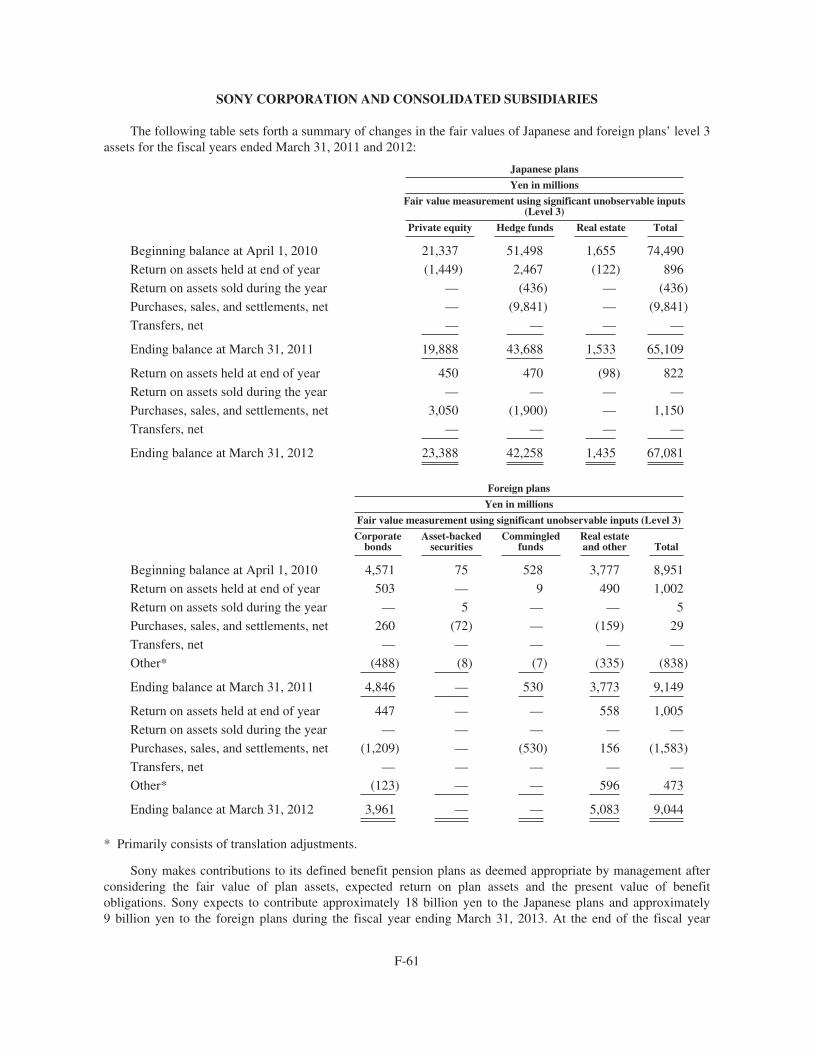
SONY CORPORATION AND CONSOLIDATED SUBSIDIARIES
The following table sets forth a summary of changes in the fair values of Japanese and foreign plans’ level 3assets for the fiscal years ended March 31, 2011 and 2012:
Japanese plans
Yen in millions
Fair value measurement using significant unobservable inputs(Level 3)
Private equity Hedge funds Real estate Total
Beginning balance at April 1, 2010 21,337 51,498 1,655 74,490
Return on assets held at end of year (1,449) 2,467 (122) 896
Return on assets sold during the year — (436) — (436)
Purchases, sales, and settlements, net — (9,841) — (9,841)
Transfers, net — — — —
Ending balance at March 31, 2011 19,888 43,688 1,533 65,109
Return on assets held at end of year 450 470 (98) 822
Return on assets sold during the year — — — —
Purchases, sales, and settlements, net 3,050 (1,900) — 1,150
Transfers, net — — — —
Ending balance at March 31, 2012 23,388 42,258 1,435 67,081
Foreign plans
Yen in millions
Fair value measurement using significant unobservable inputs (Level 3)
Corporatebonds
Asset-backedsecurities
Commingledfunds
Real estateand other Total
Beginning balance at April 1, 2010 4,571 75 528 3,777 8,951
Return on assets held at end of year 503 — 9 490 1,002
Return on assets sold during the year — 5 — — 5
Purchases, sales, and settlements, net 260 (72) — (159) 29
Transfers, net — — — — —
Other* (488) (8) (7) (335) (838)
Ending balance at March 31, 2011 4,846 — 530 3,773 9,149
Return on assets held at end of year 447 — — 558 1,005
Return on assets sold during the year — — — — —
Purchases, sales, and settlements, net (1,209) — (530) 156 (1,583)
Transfers, net — — — — —
Other* (123) — — 596 473
Ending balance at March 31, 2012 3,961 — — 5,083 9,044
* Primarily consists of translation adjustments.
Sony makes contributions to its defined benefit pension plans as deemed appropriate by management afterconsidering the fair value of plan assets, expected return on plan assets and the present value of benefitobligations. Sony expects to contribute approximately 18 billion yen to the Japanese plans and approximately9 billion yen to the foreign plans during the fiscal year ending March 31, 2013. At the end of the fiscal year
F-61
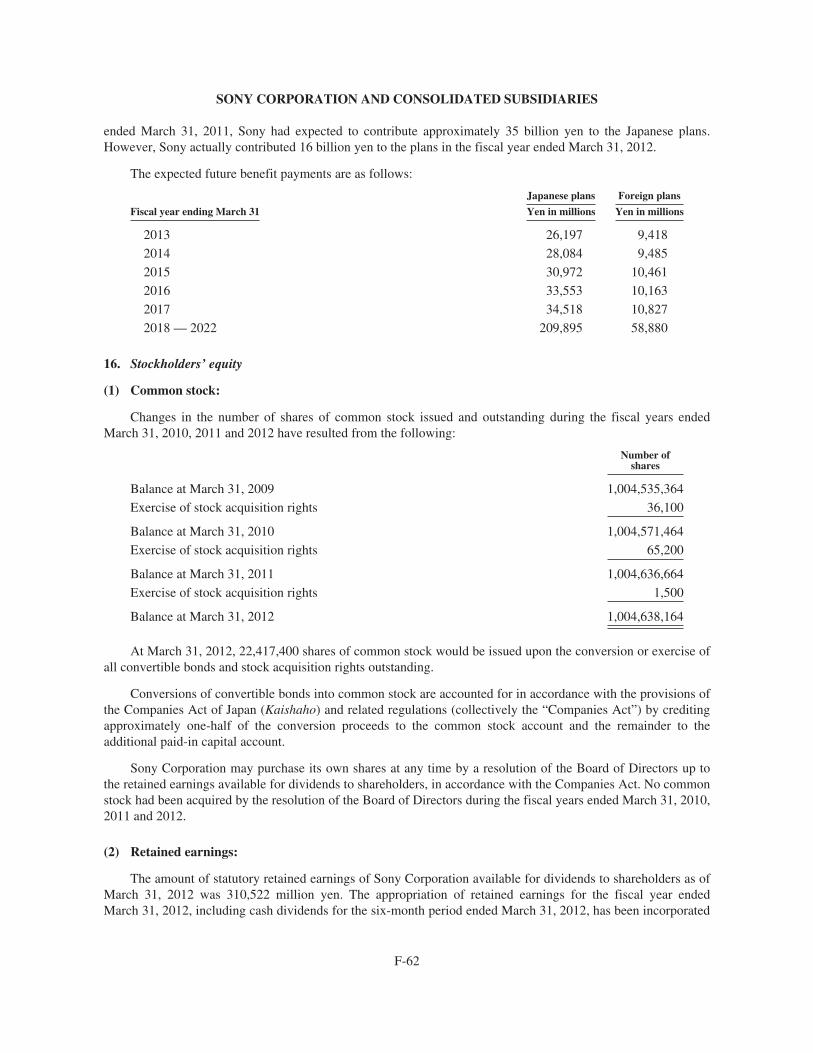
SONY CORPORATION AND CONSOLIDATED SUBSIDIARIES
ended March 31, 2011, Sony had expected to contribute approximately 35 billion yen to the Japanese plans.However, Sony actually contributed 16 billion yen to the plans in the fiscal year ended March 31, 2012.
The expected future benefit payments are as follows:
Japanese plans Foreign plans
Fiscal year ending March 31 Yen in millions Yen in millions
2013 26,197 9,418
2014 28,084 9,485
2015 30,972 10,461
2016 33,553 10,163
2017 34,518 10,827
2018 — 2022 209,895 58,880
16. Stockholders’ equity
(1) Common stock:
Changes in the number of shares of common stock issued and outstanding during the fiscal years endedMarch 31, 2010, 2011 and 2012 have resulted from the following:
Number ofshares
Balance at March 31, 2009 1,004,535,364
Exercise of stock acquisition rights 36,100
Balance at March 31, 2010 1,004,571,464
Exercise of stock acquisition rights 65,200
Balance at March 31, 2011 1,004,636,664
Exercise of stock acquisition rights 1,500
Balance at March 31, 2012 1,004,638,164
At March 31, 2012, 22,417,400 shares of common stock would be issued upon the conversion or exercise ofall convertible bonds and stock acquisition rights outstanding.
Conversions of convertible bonds into common stock are accounted for in accordance with the provisions ofthe Companies Act of Japan (Kaishaho) and related regulations (collectively the “Companies Act”) by creditingapproximately one-half of the conversion proceeds to the common stock account and the remainder to theadditional paid-in capital account.
Sony Corporation may purchase its own shares at any time by a resolution of the Board of Directors up tothe retained earnings available for dividends to shareholders, in accordance with the Companies Act. No commonstock had been acquired by the resolution of the Board of Directors during the fiscal years ended March 31, 2010,2011 and 2012.
(2) Retained earnings:
The amount of statutory retained earnings of Sony Corporation available for dividends to shareholders as ofMarch 31, 2012 was 310,522 million yen. The appropriation of retained earnings for the fiscal year endedMarch 31, 2012, including cash dividends for the six-month period ended March 31, 2012, has been incorporated
F-62
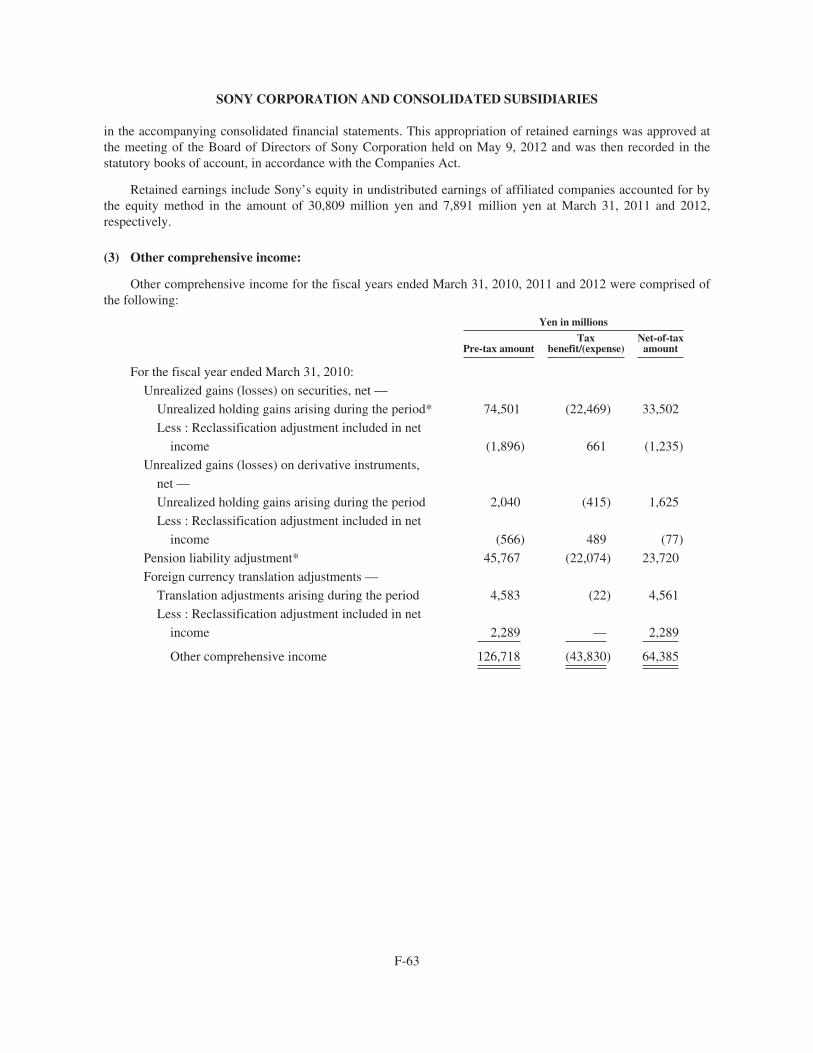
SONY CORPORATION AND CONSOLIDATED SUBSIDIARIES
in the accompanying consolidated financial statements. This appropriation of retained earnings was approved atthe meeting of the Board of Directors of Sony Corporation held on May 9, 2012 and was then recorded in thestatutory books of account, in accordance with the Companies Act.
Retained earnings include Sony’s equity in undistributed earnings of affiliated companies accounted for bythe equity method in the amount of 30,809 million yen and 7,891 million yen at March 31, 2011 and 2012,respectively.
(3) Other comprehensive income:
Other comprehensive income for the fiscal years ended March 31, 2010, 2011 and 2012 were comprised ofthe following:
Yen in millions
Pre-tax amountTax
benefit/(expense)Net-of-tax
amount
For the fiscal year ended March 31, 2010:
Unrealized gains (losses) on securities, net —
Unrealized holding gains arising during the period* 74,501 (22,469) 33,502
Less : Reclassification adjustment included in net
income (1,896) 661 (1,235)
Unrealized gains (losses) on derivative instruments,
net —
Unrealized holding gains arising during the period 2,040 (415) 1,625
Less : Reclassification adjustment included in net
income (566) 489 (77)
Pension liability adjustment* 45,767 (22,074) 23,720
Foreign currency translation adjustments —
Translation adjustments arising during the period 4,583 (22) 4,561
Less : Reclassification adjustment included in net
income 2,289 — 2,289
Other comprehensive income 126,718 (43,830) 64,385
F-63
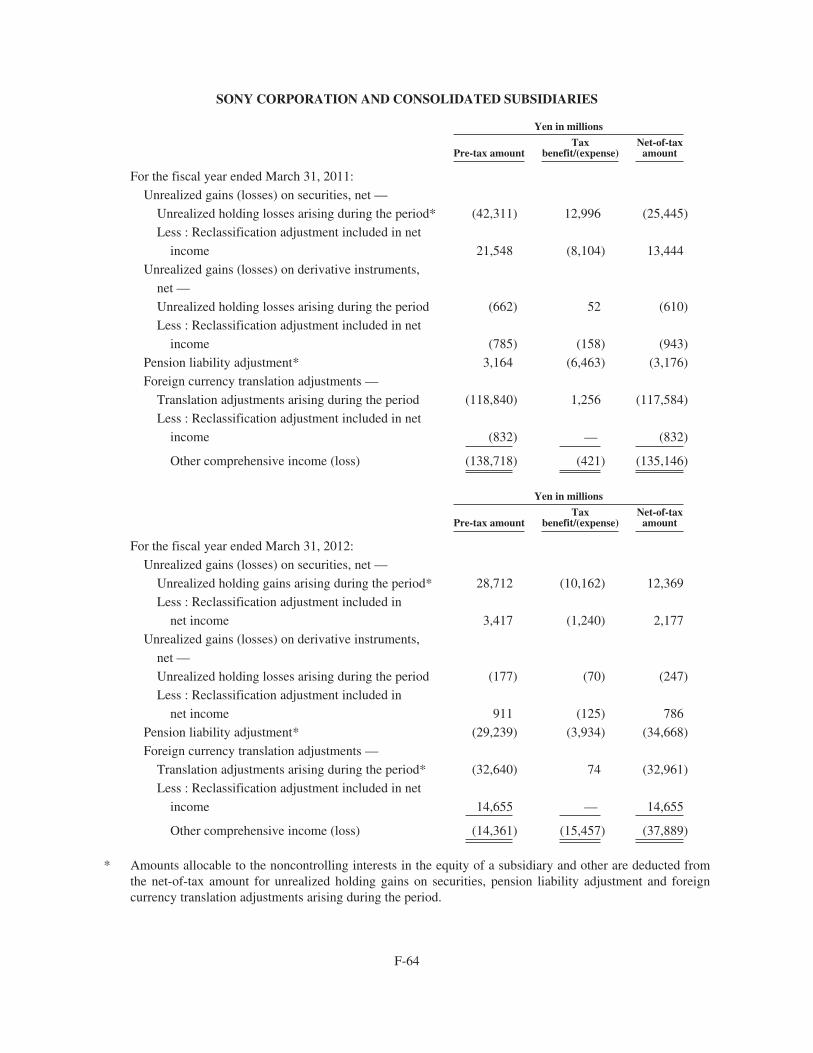
SONY CORPORATION AND CONSOLIDATED SUBSIDIARIES
Yen in millions
Pre-tax amountTax
benefit/(expense)Net-of-tax
amount
For the fiscal year ended March 31, 2011:
Unrealized gains (losses) on securities, net —
Unrealized holding losses arising during the period* (42,311) 12,996 (25,445)
Less : Reclassification adjustment included in net
income 21,548 (8,104) 13,444
Unrealized gains (losses) on derivative instruments,
net —
Unrealized holding losses arising during the period (662) 52 (610)
Less : Reclassification adjustment included in net
income (785) (158) (943)
Pension liability adjustment* 3,164 (6,463) (3,176)
Foreign currency translation adjustments —
Translation adjustments arising during the period (118,840) 1,256 (117,584)
Less : Reclassification adjustment included in net
income (832) — (832)
Other comprehensive income (loss) (138,718) (421) (135,146)
Yen in millions
Pre-tax amountTax
benefit/(expense)Net-of-tax
amount
For the fiscal year ended March 31, 2012:
Unrealized gains (losses) on securities, net —
Unrealized holding gains arising during the period* 28,712 (10,162) 12,369
Less : Reclassification adjustment included in
net income 3,417 (1,240) 2,177
Unrealized gains (losses) on derivative instruments,
net —
Unrealized holding losses arising during the period (177) (70) (247)
Less : Reclassification adjustment included in
net income 911 (125) 786
Pension liability adjustment* (29,239) (3,934) (34,668)
Foreign currency translation adjustments —
Translation adjustments arising during the period* (32,640) 74 (32,961)
Less : Reclassification adjustment included in net
income 14,655 — 14,655
Other comprehensive income (loss) (14,361) (15,457) (37,889)
* Amounts allocable to the noncontrolling interests in the equity of a subsidiary and other are deducted fromthe net-of-tax amount for unrealized holding gains on securities, pension liability adjustment and foreigncurrency translation adjustments arising during the period.
F-64
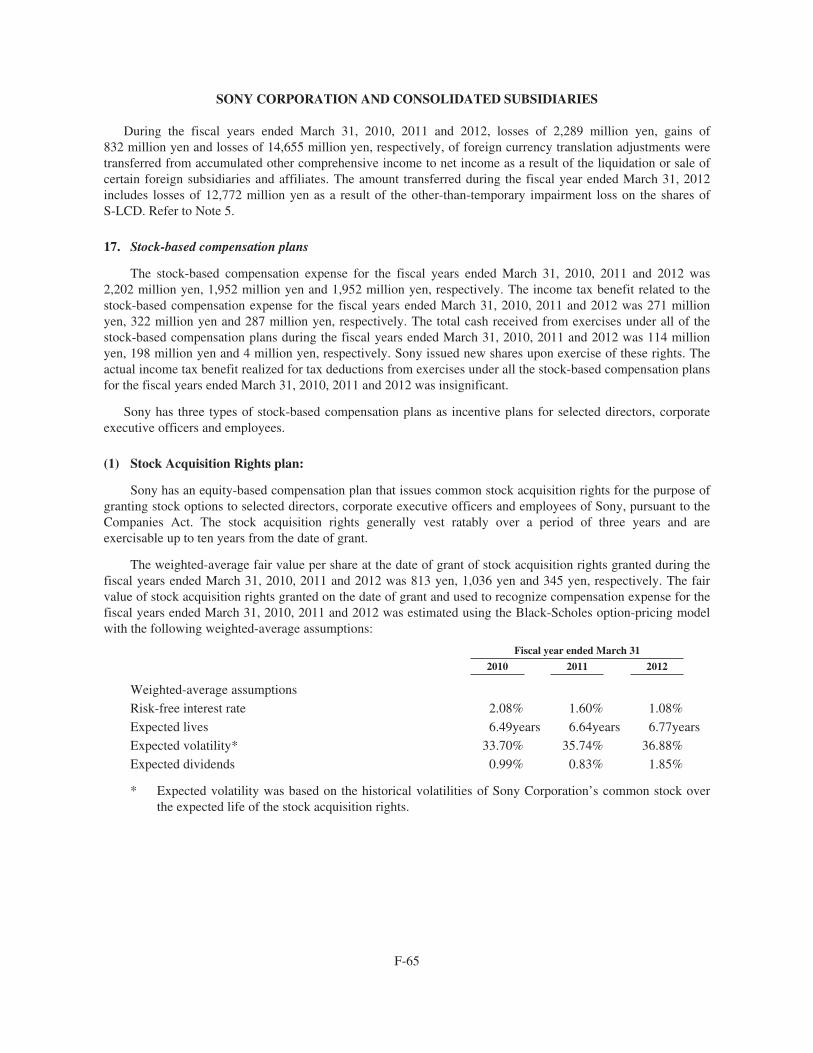
SONY CORPORATION AND CONSOLIDATED SUBSIDIARIES
During the fiscal years ended March 31, 2010, 2011 and 2012, losses of 2,289 million yen, gains of832 million yen and losses of 14,655 million yen, respectively, of foreign currency translation adjustments weretransferred from accumulated other comprehensive income to net income as a result of the liquidation or sale ofcertain foreign subsidiaries and affiliates. The amount transferred during the fiscal year ended March 31, 2012includes losses of 12,772 million yen as a result of the other-than-temporary impairment loss on the shares ofS-LCD. Refer to Note 5.
17. Stock-based compensation plans
The stock-based compensation expense for the fiscal years ended March 31, 2010, 2011 and 2012 was2,202 million yen, 1,952 million yen and 1,952 million yen, respectively. The income tax benefit related to thestock-based compensation expense for the fiscal years ended March 31, 2010, 2011 and 2012 was 271 millionyen, 322 million yen and 287 million yen, respectively. The total cash received from exercises under all of thestock-based compensation plans during the fiscal years ended March 31, 2010, 2011 and 2012 was 114 millionyen, 198 million yen and 4 million yen, respectively. Sony issued new shares upon exercise of these rights. Theactual income tax benefit realized for tax deductions from exercises under all the stock-based compensation plansfor the fiscal years ended March 31, 2010, 2011 and 2012 was insignificant.
Sony has three types of stock-based compensation plans as incentive plans for selected directors, corporateexecutive officers and employees.
(1) Stock Acquisition Rights plan:
Sony has an equity-based compensation plan that issues common stock acquisition rights for the purpose ofgranting stock options to selected directors, corporate executive officers and employees of Sony, pursuant to theCompanies Act. The stock acquisition rights generally vest ratably over a period of three years and areexercisable up to ten years from the date of grant.
The weighted-average fair value per share at the date of grant of stock acquisition rights granted during thefiscal years ended March 31, 2010, 2011 and 2012 was 813 yen, 1,036 yen and 345 yen, respectively. The fairvalue of stock acquisition rights granted on the date of grant and used to recognize compensation expense for thefiscal years ended March 31, 2010, 2011 and 2012 was estimated using the Black-Scholes option-pricing modelwith the following weighted-average assumptions:
Fiscal year ended March 31
2010 2011 2012
Weighted-average assumptions
Risk-free interest rate 2.08% 1.60% 1.08%
Expected lives 6.49years 6.64years 6.77years
Expected volatility* 33.70% 35.74% 36.88%
Expected dividends 0.99% 0.83% 1.85%
* Expected volatility was based on the historical volatilities of Sony Corporation’s common stock overthe expected life of the stock acquisition rights.
F-65
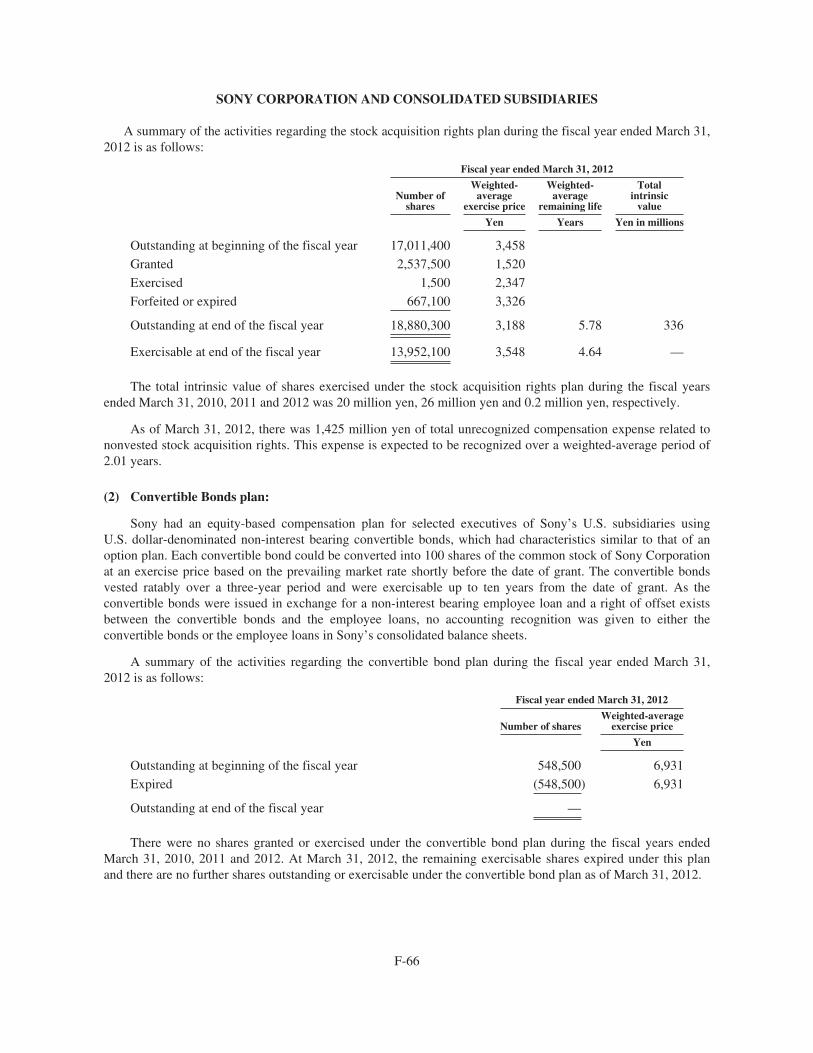
SONY CORPORATION AND CONSOLIDATED SUBSIDIARIES
A summary of the activities regarding the stock acquisition rights plan during the fiscal year ended March 31,2012 is as follows:
Fiscal year ended March 31, 2012
Number ofshares
Weighted-average
exercise price
Weighted-average
remaining life
Totalintrinsic
value
Yen Years Yen in millions
Outstanding at beginning of the fiscal year 17,011,400 3,458
Granted 2,537,500 1,520
Exercised 1,500 2,347
Forfeited or expired 667,100 3,326
Outstanding at end of the fiscal year 18,880,300 3,188 5.78 336
Exercisable at end of the fiscal year 13,952,100 3,548 4.64 —
The total intrinsic value of shares exercised under the stock acquisition rights plan during the fiscal yearsended March 31, 2010, 2011 and 2012 was 20 million yen, 26 million yen and 0.2 million yen, respectively.
As of March 31, 2012, there was 1,425 million yen of total unrecognized compensation expense related tononvested stock acquisition rights. This expense is expected to be recognized over a weighted-average period of2.01 years.
(2) Convertible Bonds plan:
Sony had an equity-based compensation plan for selected executives of Sony’s U.S. subsidiaries usingU.S. dollar-denominated non-interest bearing convertible bonds, which had characteristics similar to that of anoption plan. Each convertible bond could be converted into 100 shares of the common stock of Sony Corporationat an exercise price based on the prevailing market rate shortly before the date of grant. The convertible bondsvested ratably over a three-year period and were exercisable up to ten years from the date of grant. As theconvertible bonds were issued in exchange for a non-interest bearing employee loan and a right of offset existsbetween the convertible bonds and the employee loans, no accounting recognition was given to either theconvertible bonds or the employee loans in Sony’s consolidated balance sheets.
A summary of the activities regarding the convertible bond plan during the fiscal year ended March 31,2012 is as follows:
Fiscal year ended March 31, 2012
Number of sharesWeighted-average
exercise price
Yen
Outstanding at beginning of the fiscal year 548,500 6,931
Expired (548,500) 6,931
Outstanding at end of the fiscal year —
There were no shares granted or exercised under the convertible bond plan during the fiscal years endedMarch 31, 2010, 2011 and 2012. At March 31, 2012, the remaining exercisable shares expired under this planand there are no further shares outstanding or exercisable under the convertible bond plan as of March 31, 2012.
F-66
SONY CORPORATION AND CONSOLIDATED SUBSIDIARIES
(3) Stock Appreciation Rights (“SARs”) plan:
Sony granted SARs in the United States of America for selected employees. Under the terms of these plans,employees upon exercise of such rights receive cash equal to the amount that the market price of SonyCorporation’s common stock exceeds the strike price of the SARs. The SARs generally vest ratably over a periodof three years, and are generally exercisable up to ten years from the date of grant.
There were no SARs granted during the fiscal years ended March 31, 2010, 2011 and 2012. As of March 31,2012, there were 23,200 SARs outstanding and the weighted-average exercise price was 4,298 yen. All SARswere exercisable as of March 31, 2012.
The compensation expense for the SARs is measured as the excess of the quoted market price of SonyCorporation’s common stock over the SARs strike price. SAR compensation expense for the fiscal years endedMarch 31, 2010, 2011, and 2012 was insignificant.
18. Great East Japan Earthquake and Thai Floods
(1) Great East Japan Earthquake
On March 11, 2011, Japan experienced a massive earthquake and tsunami (the “Great East JapanEarthquake”). The disaster caused significant damage to certain fixed assets including buildings, machinery andequipment as well as inventories in manufacturing sites and warehouses located principally in northeasternJapan.
For the fiscal year ended March 31, 2011, Sony incurred incremental losses and expenses including repair,removal and cleaning costs directly related to the damage caused by the disaster of 10,897 million yen, includingthe disposal or impairment of fixed assets of 7,668 million yen. These losses and expenses were primarilyrecorded in other operating (income) expense, net in the consolidated statements of income and were offset byinsurance recoveries of 10,841 million yen, the amount that was deemed probable up to the extent of thecorresponding losses recognized, as described below. The restoration costs anticipated to occur on or afterApril 1, 2011 were not recorded in the period ended March 31, 2011. In addition, Sony also incurred other lossesand expenses of 11,821 million yen, which included idle facility costs at manufacturing sites, and an additionalprovision for life insurance policy reserves. These losses and expenses were primarily recorded in cost ofsales and financial services expenses in the consolidated statements of income.
For the fiscal year ended March 31, 2012, Sony incurred incremental losses and expenses including repair,removal, restoration and cleaning costs directly related to the damage caused by the disaster of 5,864 million yen.These losses and expenses were primarily recorded in cost of sales in the consolidated statements of income andwere partially offset by insurance recoveries of 2,159 million yen, as described below. In addition, Sony alsoincurred other losses and expenses of 6,294 million yen, which included idle facility costs at manufacturingsites. These losses and expenses were primarily recorded in cost of sales in the consolidated statements ofincome.
Sony has insurance policies which cover certain damage directly caused by the Great East Japan Earthquakefor Sony Corporation and certain of its subsidiaries including manufacturing sites. The insurance policies coverthe damage and costs associated with fixed assets and inventories and provide business interruption coverage,including lost profits.
Insurance claims in the amount of 15,000 million yen, the total coverage amount, were agreed to by theinsurance carriers as a final settlement and were paid in March 2012. Of this amount, 2,000 million yen is due toa certain carrier as reinsurance and recorded in other current liabilities in the consolidated balance sheets. Theinsurance proceeds are primarily included in investing activities in the consolidated statements of cash flows.
F-67
SONY CORPORATION AND CONSOLIDATED SUBSIDIARIES
(2) Thai Floods
In October 2011, certain of Sony’s Thailand subsidiaries temporarily closed operations due to significantfloods (the “Floods”). The Floods caused significant damage to certain fixed assets including buildings,machinery and equipment as well as inventories in manufacturing sites and warehouses located in Thailand. Inaddition, the Floods impacted the operations of certain Sony subsidiaries in Japan and other countries.
For the fiscal year ended March 31, 2012, Sony incurred incremental losses and expenses including repair,removal and cleaning costs directly related to the damage caused by the Floods of 13,236 million yen, includingthe disposal or impairment of fixed assets of 7,882 million yen. These losses and expenses were primarilyrecorded in other operating (income) expense, net in the consolidated statements of income and were offset byinsurance recoveries as described below. The restoration costs anticipated to occur on or after April 1, 2012 werenot recorded in the fiscal year ended March 31, 2012 and will be recorded when the services are rendered andliabilities incurred. In addition, Sony also incurred other losses and expenses of 13,899 million yen, whichincluded idle facility costs at manufacturing sites and other additional expenses. These losses and expenses weremainly recorded in cost of sales in the consolidated statements of income.
Sony has insurance policies which cover certain damage directly caused by the Floods for Sony Corporationand certain of its subsidiaries including manufacturing sites. The insurance policies cover the damage and costsassociated with fixed assets, inventories and additional expenses including removal and cleaning costs andprovide business interruption coverage, including lost profits.
Insurance claims in the amount of 50,416 million yen were agreed to by the insurance carriers and were paidduring the fiscal year ended March 31, 2012. Of this amount, Sony received 26,316 million yen for fixed assets,inventories and additional expenses, of which 17,520 million yen represents the portion of insurance recoveriesin excess of the carrying value before the damage caused by the Floods of the insured fixed assets andinventories, and were recorded in cost of sales and other operating (income) expense, net in the consolidatedstatements of income. The remaining amount of the insurance claims paid of 24,100 million yen was for businessinterruption insurance recoveries, which applies to the lost profit which occurred after the Floods toDecember 31, 2011, and were recorded in other operating revenue in the consolidated statements of income. Theinsurance proceeds for fixed assets and for other than fixed assets are included in investing activities andoperating activities in the consolidated statements of cash flows, respectively.
In addition, as of March 31, 2012, Sony still had pending insurance claims for damage to fixed assets,inventories, additional expenses and business interruption. Sony recorded insurance receivables of 5,788 millionyen which represents the portion of the insurance claims that were deemed probable of collection up to the extentof the amount of corresponding losses recognized in the same period and substantially all relate to damagedassets and inventories. Sony concluded that the recoveries from these insurance claims are probable based on thecoverage under valid policies, communications with the insurance carriers, Sony’s past claims history with theinsurance carriers, and Sony’s assessment that the insurance carriers have the financial ability to pay the claims.These receivables were primarily recorded in prepaid expenses and other current assets in the consolidatedbalance sheets.
19. Restructuring charges and asset impairments
As part of its effort to improve the performance of the various businesses, Sony has undertaken a number ofrestructuring initiatives. Sony defines restructuring initiatives as activities initiated by Sony, such as exiting abusiness or product category or implementing a headcount reduction program, which are designed to generate apositive impact on future profitability. For the fiscal years ended March 31, 2010, 2011 and 2012, Sony recordedtotal restructuring charges of 116,472 million yen, 62,318 million yen and 52,645 million yen, respectively.
Sony anticipates recording approximately 75 billion yen of restructuring charges for the fiscal year endingMarch 31, 2013.
F-68
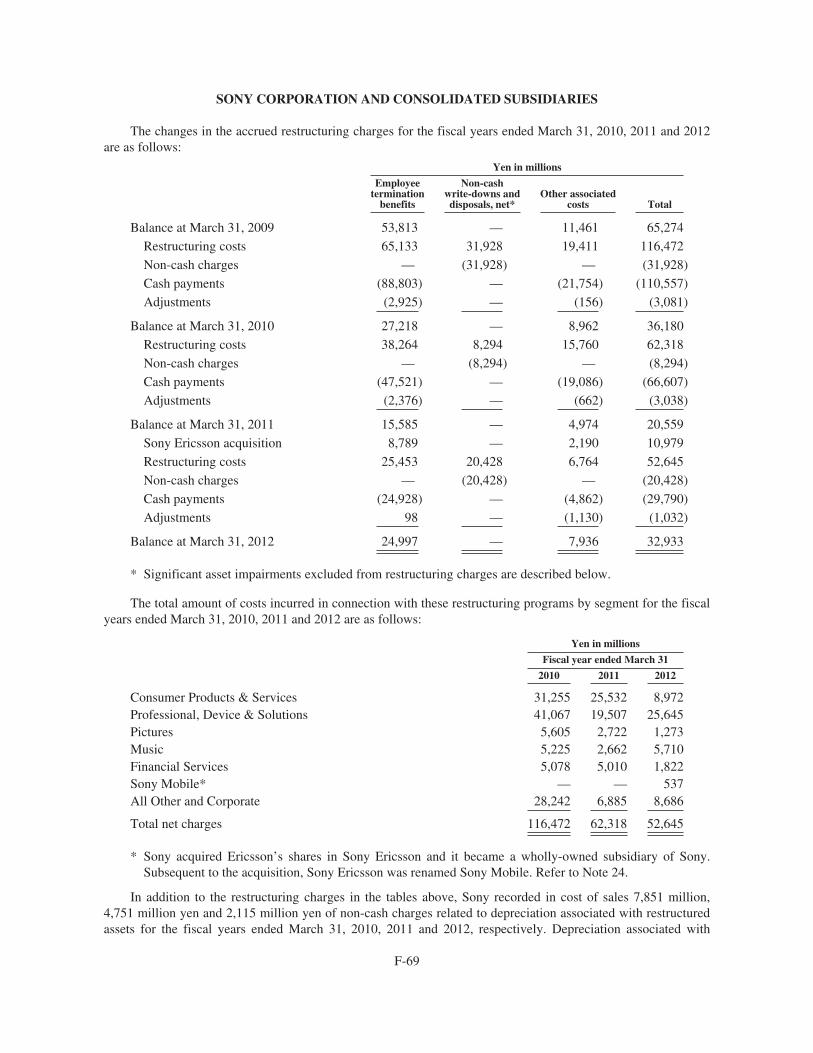
SONY CORPORATION AND CONSOLIDATED SUBSIDIARIES
The changes in the accrued restructuring charges for the fiscal years ended March 31, 2010, 2011 and 2012are as follows:
Yen in millions
Employeetermination
benefits
Non-cashwrite-downs anddisposals, net*
Other associatedcosts Total
Balance at March 31, 2009 53,813 — 11,461 65,274
Restructuring costs 65,133 31,928 19,411 116,472
Non-cash charges — (31,928) — (31,928)
Cash payments (88,803) — (21,754) (110,557)
Adjustments (2,925) — (156) (3,081)
Balance at March 31, 2010 27,218 — 8,962 36,180
Restructuring costs 38,264 8,294 15,760 62,318
Non-cash charges — (8,294) — (8,294)
Cash payments (47,521) — (19,086) (66,607)
Adjustments (2,376) — (662) (3,038)
Balance at March 31, 2011 15,585 — 4,974 20,559
Sony Ericsson acquisition 8,789 — 2,190 10,979
Restructuring costs 25,453 20,428 6,764 52,645
Non-cash charges — (20,428) — (20,428)
Cash payments (24,928) — (4,862) (29,790)
Adjustments 98 — (1,130) (1,032)
Balance at March 31, 2012 24,997 — 7,936 32,933
* Significant asset impairments excluded from restructuring charges are described below.
The total amount of costs incurred in connection with these restructuring programs by segment for the fiscalyears ended March 31, 2010, 2011 and 2012 are as follows:
Yen in millions
Fiscal year ended March 31
2010 2011 2012
Consumer Products & Services 31,255 25,532 8,972Professional, Device & Solutions 41,067 19,507 25,645Pictures 5,605 2,722 1,273Music 5,225 2,662 5,710Financial Services 5,078 5,010 1,822Sony Mobile* — — 537All Other and Corporate 28,242 6,885 8,686
Total net charges 116,472 62,318 52,645
* Sony acquired Ericsson’s shares in Sony Ericsson and it became a wholly-owned subsidiary of Sony.Subsequent to the acquisition, Sony Ericsson was renamed Sony Mobile. Refer to Note 24.
In addition to the restructuring charges in the tables above, Sony recorded in cost of sales 7,851 million,4,751 million yen and 2,115 million yen of non-cash charges related to depreciation associated with restructuredassets for the fiscal years ended March 31, 2010, 2011 and 2012, respectively. Depreciation associated with
F-69
SONY CORPORATION AND CONSOLIDATED SUBSIDIARIES
restructured assets as used in the context of the disclosures regarding restructuring activity refers to the increasein depreciation expense caused by shortening the useful life or updating the salvage value of depreciable fixedassets to coincide with the end of production under an approved restructuring plan. Any impairment of the assetis recognized immediately in the period.
Consumer Products & Services segment
In an effort to improve the performance of the Consumer Products & Services segment, Sony has undergonea number of restructuring efforts to reduce its operating costs. These efforts included headcount reductionprograms, initiatives to advance rationalization of manufacturing operations, shifting and aggregatingmanufacturing to low-cost areas, and utilizing the services of third-party original equipment and designmanufacturers (OEMs and ODMs). Significant restructuring activities are as follows:
Retirement programs -
In an effort to improve the performance of the Consumer Products & Services segment, Sony has undergoneseveral headcount reduction programs to further reduce operating costs. Through measures including therealignment of its manufacturing sites, a review of its development and design structure, and the streamlining ofits sales and administrative functions, Sony has continued to implement a company-wide (includingheadquarters) rationalization. Sony intends to reallocate and optimize its workforce through programs includingwork reassignments and outplacements. As a result of these measures, Sony recorded in the ConsumerProducts & Services segment restructuring charges related mainly to employee termination benefits totaling20,189 million yen, 14,035 million yen and 8,134 million yen for the fiscal years ended March 31, 2010, 2011and 2012, respectively, in selling, general and administrative expenses in the consolidated statements of income.These staff reductions were achieved worldwide mostly through the implementation of early retirementprograms. Sony will continue to implement programs to reduce headcount by streamlining business operations,including closure and consolidation of manufacturing sites, and the consolidation of headquarters andadministrative functions.
Realignment of manufacturing operations in Japan -
During the fiscal year ended March 31, 2010, Sony implemented extensive measures to better compete interms of speed to market and profitability, including the reevaluation of both its domestic and overseasmanufacturing operations. As part of this process, manufacturing operations in Japan for certain productcategories were consolidated in order to increase the efficiency of these manufacturing operations.
As a result of this realignment of manufacturing operations in Japan, restructuring charges for the closure ofproduction facilities totaling 7,132 million yen were recorded which consisted mainly of personnel related costsand the disposal or impairment of assets. Of the total restructuring charges, 3,586 million yen for employeetermination benefits were recorded in selling, general and administrative expenses and 3,261 million yen for thedisposal or impairment of assets was recorded in other operating (income) expense, net in the consolidatedstatements of income. In addition to the restructuring charges, 4,823 million yen of non-cash charges related todepreciation associated with restructured assets were recorded in cost of sales in the consolidated statements ofincome as a result of this realignment of manufacturing operations in Japan.
Sales and transfers of manufacturing operations outside of Japan -
During the fiscal year ended March 31, 2011, Sony sold and transferred certain manufacturing operationsoutside of Japan to third parties to reduce operating costs. The resulting restructuring charges included expensesof 11,583 million yen related to the transfer of a factory in Barcelona and the impairment of related assets.
Cash flows from the sales and transfers of manufacturing operations are included in sales of businesses inthe consolidated statements of cash flows.
F-70
SONY CORPORATION AND CONSOLIDATED SUBSIDIARIES
Professional, Device & Solutions segment
In an effort to improve the performance of the Professional, Device & Solutions segment, Sony hasundergone a number of restructuring efforts to reduce operating costs. These efforts included headcountreduction programs, initiatives to advance rationalization of manufacturing operations, shifting and aggregatingmanufacturing to low-cost areas, and utilizing the services of third-party original equipment and designmanufacturers (OEMs and ODMs). Significant restructuring activities are as follows:
Retirement programs -
In an effort to improve the performance of the Professional, Device & Solutions segment, Sony hasundergone several headcount reduction programs to further reduce operating costs. Through measures includingthe realignment of its manufacturing sites, a review of its development and design structure, and the streamliningof its sales and administrative functions, Sony has continued to implement a company-wide (includingheadquarters) rationalization. Sony intends to reallocate and optimize its workforce through programs includingwork reassignments and outplacements. As a result of these measures, Sony recorded in the Professional,Device & Solutions segment restructuring charges related mainly to employee termination benefits totaling23,002 million yen, 14,073 million yen and 6,925 million yen for the fiscal years ended March 31, 2010, 2011and 2012, respectively, in selling, general and administrative expenses in the consolidated statements of income.These staff reductions were achieved worldwide mostly through the implementation of early retirementprograms. Sony will continue to implement programs to reduce headcount by streamlining business operations,including closure and consolidation of manufacturing sites, and the consolidation of headquarters andadministrative functions.
Realignment of manufacturing operations in Japan -
During the fiscal year ended March 31, 2010, Sony implemented extensive measures to better compete interms of speed to market and profitability, including the reevaluation of both its domestic and overseasmanufacturing operations. As part of this process, manufacturing operations in Japan for certain productcategories were consolidated in order to increase the efficiency of these manufacturing operations.
As a result of this realignment of manufacturing operations in Japan, restructuring charges for the closure ofproduction facilities totaling 6,087 million yen consisted mainly of personnel related costs and the disposal orimpairment of assets. Of the total restructuring charges, 5,273 million yen for employee termination benefitswere recorded in selling, general and administrative expenses and 455 million yen for the disposal or impairmentof assets were recorded in other operating (income) expense, net in the consolidated statements of income. Inaddition to the restructuring charges, 799 million yen of non-cash charges related to depreciation associated withrestructured assets were recorded in cost of sales in the consolidated statements of income as a result of thisrealignment of manufacturing operations in Japan.
Sale and asset-impairment of small- and medium-sized TFT LCD business -
In an effort to increase efficiency and strengthen operations in the small- and medium-sized TFT LCDbusiness by consolidating manufacturing operations, Sony recorded 7,832 million yen for the impairment of TFTLCD related fixed assets for the fiscal year ended March 31, 2010. These charges were recorded in otheroperating (income) expense, net in the consolidated statements of income.
As described in Note 25, Sony sold its small- and medium-sized TFT LCD business to Japan Display Inc.During the fiscal year ended March 31, 2012, Sony recorded an impairment loss of 19,187 million yen in otheroperating (income) expense, net in the consolidated statements of income, as the long-lived assets used by thebusiness were classified as held for sale and recorded at the lesser of carrying value or fair value.
F-71
SONY CORPORATION AND CONSOLIDATED SUBSIDIARIES
Asset-impairment of OLED related equipment -
During the fiscal year ended March 31, 2010, Sony recorded 5,265 million yen for the impairment of OLEDrelated equipment, which was rendered obsolete due to the utilization of an alternative technology in themanufacture of OLED products. These charges were recorded in other operating (income) expense, net in theconsolidated statements of income.
Pictures segment
In an effort to improve the performance of the Pictures segment, Sony has undergone a number ofrestructuring efforts to reduce operating costs and rationalize certain operations.
The resulting restructuring charges, included in the table above, were related mainly to employeetermination benefits and included in selling, general and administrative expenses in the consolidated statementsof income.
Music segment
In an effort to improve the performance of the Music segment due to the continued contraction of thephysical music market, Sony has undergone a number of restructuring efforts to reduce operating costs.
The resulting restructuring charges, included in the table above, were related mainly to employeetermination benefits and included in selling, general and administrative expenses in the consolidated statementsof income.
Financial Services segment
In an effort to improve the performance of the Financial Services segment, Sony has undergonerestructuring efforts to reduce operating costs.
During the fiscal year ended March 31, 2010, Sony recorded restructuring charges of 3,718 million yen infinancial service expenses and 1,360 million yen in other operating (income) expense, net in the consolidatedstatements of income. These restructuring charges were related mainly to the realignment of credit financingoperations and the disposal or impairment of assets. During the fiscal year ended March 31, 2011, Sony recordedrestructuring charges of 3,371 million yen in financial service expenses and 1,639 million yen in other operating(income) expense, net in the consolidated statements of income. These restructuring charges related mainly to thepartial sale of a leasing and credit card business.
Cash flows from the partial sale of a leasing and credit card business are included in sales of businesses inthe consolidated statements of cash flows.
Sony Mobile segment
As a result of the acquisition of Sony Ericsson, which was subsequently renamed Sony Mobile, Sonyreflected in the consolidated balance sheets 10,979 million yen of restructuring liabilities which related torestructuring activities undertaken by Sony Ericsson prior to Sony’s acquisition of Ericsson’s 50% equity interestin Sony Ericsson, but which had not yet been paid or settled by Sony Ericsson. The restructuring liability relatesto activities previously accrued by Sony Ericsson but which were unpaid as of the acquisition date representingseverance costs of 8,789 million yen and other associated costs of 2,190 million yen.
In an effort to improve the performance of the Sony Mobile segment, Sony has undergone restructuringefforts to reduce operating costs.
The resulting restructuring charges, included in the table above, were related mainly to employeetermination benefits and included in selling, general and administrative expenses in the consolidated statementsof income from February 16, 2012 through March 31, 2012.
F-72
SONY CORPORATION AND CONSOLIDATED SUBSIDIARIES
All Other and Corporate
Realignment of manufacturing operations in Japan -
During the fiscal year ended March 31, 2010, Sony implemented extensive measures to better compete interms of speed to market and profitability, including the reevaluation of both its domestic and overseasmanufacturing operations. As part of this process, mobile phone customer service and manufacturing operationsin Japan were consolidated in order to establish an integrated operational structure from manufacturing throughto customer service.
As a result of this realignment, restructuring charges for the closure of production facilities totaling6,041 million yen were recorded, which consisted mainly of personnel related costs and the disposal orimpairment of assets. Of the total restructuring charges, 4,900 million yen for employee termination benefits wasrecorded in selling, general and administrative expenses, and 862 million yen for the disposal or impairment ofassets was recorded in other operating (income) expense, net in the consolidated statements of income. Inaddition to the restructuring charges, 553 million yen of non-cash charges related to depreciation associated withrestructured assets were recorded in cost of sales in the consolidated statements of income.
Withdrawal from property lease contract -
During the fiscal year ended March 31, 2010, Sony withdrew from the property management operation of anentertainment complex in Japan and terminated the property lease contract. Sony recorded 6,495 million yen oftermination payments in cost of sales in the consolidated statements of income.
Corporate restructuring charges related to headquarters -
During the fiscal year ended March 31, 2010, Sony underwent headquarters restructuring activities. As aresult, 5,897 million yen for employee termination benefits were recorded in selling, general and administrativeexpenses in the consolidated statements of income for the fiscal year ended March 31, 2010.
Other asset impairment information
Asset-impairment of LCD television business related long-lived assets -
Sony recorded impairment losses of 27,100 million yen and 16,700 million yen for the fiscal years endedMarch 31, 2010 and 2012, respectively, included within the Consumer Products & Services segment, related tothe LCD television assets group. These impairment losses primarily reflect a decrease in the estimated fair valueof property, plant and equipment and certain intangible assets.
During the fiscal year ended March 31, 2010, management updated its strategic plans, which resulted indecreases in the assets’ estimated service periods and corresponding estimated future cash flows leading to theimpairment loss.
During the fiscal year ended March 31, 2012, the corresponding estimated future cash flows leading to theimpairment charge reflect the continued deterioration in LCD television market conditions in Japan, Europe andNorth America, and unfavorable foreign exchange rates.
Sony excluded these losses on impairment from restructuring charges as they were not directly related toSony’s ongoing restructuring initiatives.
Asset-impairment of network business related long-lived assets -
Sony recorded an impairment loss of 12,601 million yen for the fiscal year ended March 31, 2012, includedwithin the Consumer Products & Services segment, related to the network business asset group, which has made
F-73
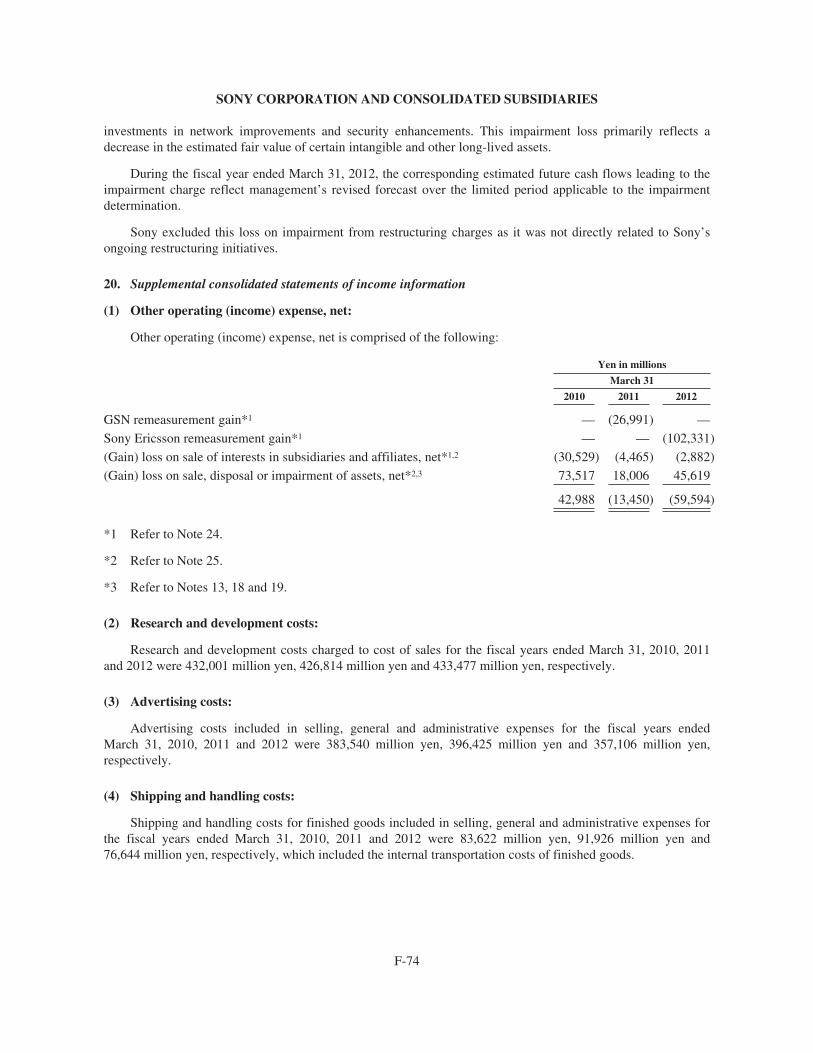
SONY CORPORATION AND CONSOLIDATED SUBSIDIARIES
investments in network improvements and security enhancements. This impairment loss primarily reflects adecrease in the estimated fair value of certain intangible and other long-lived assets.
During the fiscal year ended March 31, 2012, the corresponding estimated future cash flows leading to theimpairment charge reflect management’s revised forecast over the limited period applicable to the impairmentdetermination.
Sony excluded this loss on impairment from restructuring charges as it was not directly related to Sony’songoing restructuring initiatives.
20. Supplemental consolidated statements of income information
(1) Other operating (income) expense, net:
Other operating (income) expense, net is comprised of the following:
Yen in millions
March 31
2010 2011 2012
GSN remeasurement gain*1 — (26,991) —
Sony Ericsson remeasurement gain*1 — — (102,331)
(Gain) loss on sale of interests in subsidiaries and affiliates, net*1,2 (30,529) (4,465) (2,882)
(Gain) loss on sale, disposal or impairment of assets, net*2,3 73,517 18,006 45,619
42,988 (13,450) (59,594)
*1 Refer to Note 24.
*2 Refer to Note 25.
*3 Refer to Notes 13, 18 and 19.
(2) Research and development costs:
Research and development costs charged to cost of sales for the fiscal years ended March 31, 2010, 2011and 2012 were 432,001 million yen, 426,814 million yen and 433,477 million yen, respectively.
(3) Advertising costs:
Advertising costs included in selling, general and administrative expenses for the fiscal years endedMarch 31, 2010, 2011 and 2012 were 383,540 million yen, 396,425 million yen and 357,106 million yen,respectively.
(4) Shipping and handling costs:
Shipping and handling costs for finished goods included in selling, general and administrative expenses forthe fiscal years ended March 31, 2010, 2011 and 2012 were 83,622 million yen, 91,926 million yen and76,644 million yen, respectively, which included the internal transportation costs of finished goods.
F-74
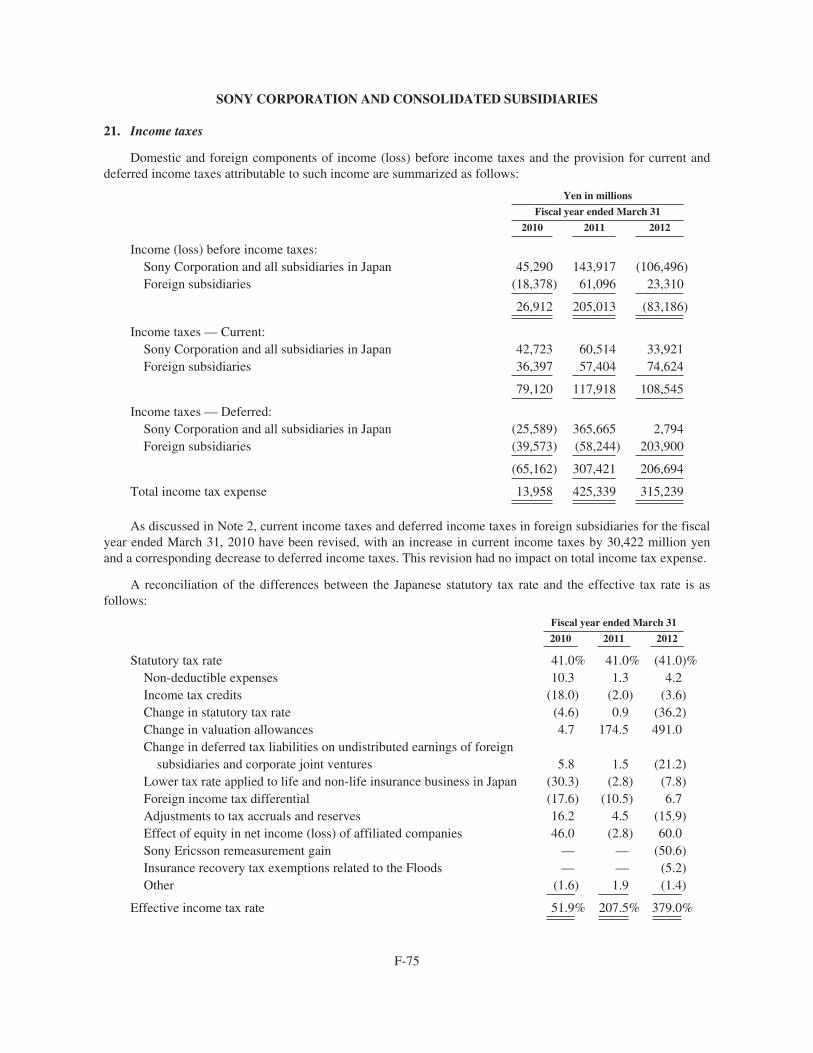
SONY CORPORATION AND CONSOLIDATED SUBSIDIARIES
21. Income taxes
Domestic and foreign components of income (loss) before income taxes and the provision for current anddeferred income taxes attributable to such income are summarized as follows:
Yen in millions
Fiscal year ended March 31
2010 2011 2012
Income (loss) before income taxes:Sony Corporation and all subsidiaries in Japan 45,290 143,917 (106,496)Foreign subsidiaries (18,378) 61,096 23,310
26,912 205,013 (83,186)
Income taxes — Current:Sony Corporation and all subsidiaries in Japan 42,723 60,514 33,921Foreign subsidiaries 36,397 57,404 74,624
79,120 117,918 108,545
Income taxes — Deferred:Sony Corporation and all subsidiaries in Japan (25,589) 365,665 2,794Foreign subsidiaries (39,573) (58,244) 203,900
(65,162) 307,421 206,694
Total income tax expense 13,958 425,339 315,239
As discussed in Note 2, current income taxes and deferred income taxes in foreign subsidiaries for the fiscalyear ended March 31, 2010 have been revised, with an increase in current income taxes by 30,422 million yenand a corresponding decrease to deferred income taxes. This revision had no impact on total income tax expense.
A reconciliation of the differences between the Japanese statutory tax rate and the effective tax rate is asfollows:
Fiscal year ended March 31
2010 2011 2012
Statutory tax rate 41.0% 41.0% (41.0)%Non-deductible expenses 10.3 1.3 4.2Income tax credits (18.0) (2.0) (3.6)Change in statutory tax rate (4.6) 0.9 (36.2)Change in valuation allowances 4.7 174.5 491.0Change in deferred tax liabilities on undistributed earnings of foreign
subsidiaries and corporate joint ventures 5.8 1.5 (21.2)Lower tax rate applied to life and non-life insurance business in Japan (30.3) (2.8) (7.8)Foreign income tax differential (17.6) (10.5) 6.7Adjustments to tax accruals and reserves 16.2 4.5 (15.9)Effect of equity in net income (loss) of affiliated companies 46.0 (2.8) 60.0Sony Ericsson remeasurement gain — — (50.6)Insurance recovery tax exemptions related to the Floods — — (5.2)Other (1.6) 1.9 (1.4)
Effective income tax rate 51.9% 207.5% 379.0%
F-75
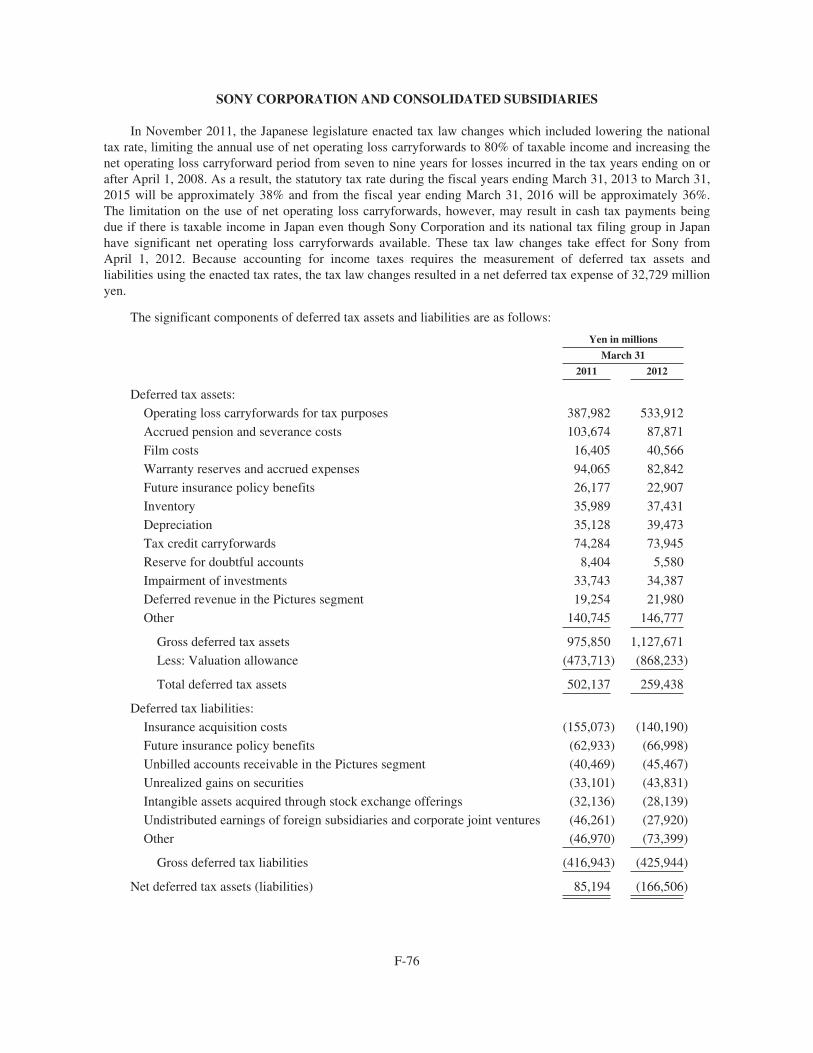
SONY CORPORATION AND CONSOLIDATED SUBSIDIARIES
In November 2011, the Japanese legislature enacted tax law changes which included lowering the nationaltax rate, limiting the annual use of net operating loss carryforwards to 80% of taxable income and increasing thenet operating loss carryforward period from seven to nine years for losses incurred in the tax years ending on orafter April 1, 2008. As a result, the statutory tax rate during the fiscal years ending March 31, 2013 to March 31,2015 will be approximately 38% and from the fiscal year ending March 31, 2016 will be approximately 36%.The limitation on the use of net operating loss carryforwards, however, may result in cash tax payments beingdue if there is taxable income in Japan even though Sony Corporation and its national tax filing group in Japanhave significant net operating loss carryforwards available. These tax law changes take effect for Sony fromApril 1, 2012. Because accounting for income taxes requires the measurement of deferred tax assets andliabilities using the enacted tax rates, the tax law changes resulted in a net deferred tax expense of 32,729 millionyen.
The significant components of deferred tax assets and liabilities are as follows:
Yen in millions
March 31
2011 2012
Deferred tax assets:
Operating loss carryforwards for tax purposes 387,982 533,912
Accrued pension and severance costs 103,674 87,871
Film costs 16,405 40,566
Warranty reserves and accrued expenses 94,065 82,842
Future insurance policy benefits 26,177 22,907
Inventory 35,989 37,431
Depreciation 35,128 39,473
Tax credit carryforwards 74,284 73,945
Reserve for doubtful accounts 8,404 5,580
Impairment of investments 33,743 34,387
Deferred revenue in the Pictures segment 19,254 21,980
Other 140,745 146,777
Gross deferred tax assets 975,850 1,127,671
Less: Valuation allowance (473,713) (868,233)
Total deferred tax assets 502,137 259,438
Deferred tax liabilities:
Insurance acquisition costs (155,073) (140,190)
Future insurance policy benefits (62,933) (66,998)
Unbilled accounts receivable in the Pictures segment (40,469) (45,467)
Unrealized gains on securities (33,101) (43,831)
Intangible assets acquired through stock exchange offerings (32,136) (28,139)
Undistributed earnings of foreign subsidiaries and corporate joint ventures (46,261) (27,920)
Other (46,970) (73,399)
Gross deferred tax liabilities (416,943) (425,944)
Net deferred tax assets (liabilities) 85,194 (166,506)
F-76
SONY CORPORATION AND CONSOLIDATED SUBSIDIARIES
As discussed in Note 2, the presentation of deferred income taxes in other assets as of March 31, 2011 in theconsolidated balance sheets have been revised to conform with the presentation as of March 31, 2012 to reflectthe results of an analysis of deferred tax assets in relation to certain unrecognized tax benefits that was completedduring the fiscal year ended March 31, 2012. This revision increased total deferred tax assets by 61,115 millionyen, which is composed of an increase of gross deferred tax assets and valuation allowance by 71,126 millionyen and 10,011 million yen, respectively, as of March 31, 2011.
The significant increase in the deferred tax asset for film costs is as a result of a change in the method ofamortization for film costs for tax return purposes. For book purposes, film costs are amortized on an individual-film-forecast method based on the ratio of current period actual revenues to the estimated remaining totalrevenues. For tax purposes, there is a film by film election to amortize film costs on either the income forecastmethod or the straight line method. Sony elected straight line for all films released in the fiscal year endedMarch 31, 2012.
The valuation allowance mainly relates to deferred tax assets of certain consolidated subsidiaries withoperating loss carryforwards and tax credit carryforwards for tax purposes that are not more-likely-than-not to berealized. The net changes in the total valuation allowance were increases of 5,741 million yen, 347,460 millionyen and 394,520 million yen for the fiscal years ended March 31, 2010, 2011 and 2012, respectively.
The increase during the fiscal year ended March 31, 2011 was primarily due to the additional valuationallowance recorded on deferred tax assets at Sony Corporation and its national tax filing group in Japan. SonyCorporation and its national tax filing group in Japan were in a three year cumulative loss position in the fiscalyear ended March 31, 2011. In Japan, Sony Corporation files a standalone tax filing for local tax purposes and aconsolidated national tax filing with its wholly-owned Japanese subsidiaries for national tax purposes. As thenational tax filing group only includes wholly-owned subsidiaries, certain Japanese subsidiaries are excluded, themost significant of which are Sony Financial Holdings Inc. and its subsidiaries. Due to the cumulative losses inrecent years, and because the net operating losses in Japan have a relatively short carryforward period of seven tonine years, a limited number of years remain in the carryforward period. The first year of expiration of theremaining net operating losses in Japan would be 2014 for local taxes and 2016 for national taxes. Carryingamounts of deferred tax assets require a reduction by a valuation allowance if, based on the available positive andnegative evidence, it is more likely than not that such assets will not be realized. While the cumulative lossposition and the remaining limited years in the carryforward period were significant negative evidence, there waspositive evidence in the form of a history of taxable income and a history of utilizing assets before expiration, aswell as the availability of tax strategies regarding the utilization of the deferred tax assets. However, based on thenear term forecast at the end of the fiscal year ended March 31, 2011, including the anticipated impact of theGreat East Japan Earthquake and the lesser weight provided to longer range forecasts when an entity is in acumulative loss, Sony did not believe that the objectively verifiable positive evidence was sufficient to overcomethe significant negative evidence of the cumulative loss. As the weight given to the positive and negativeevidence is commensurate with the extent to which the evidence may be objectively verified, it is generallydifficult for positive evidence regarding projected future taxable income exclusive of reversing taxable temporarydifferences to outweigh objectively verifiable negative evidence of recent financial reporting losses. Accordingly,Sony, based on the weight of the available positive and negative evidence, established a valuation allowance of362,316 million yen as of March 31, 2011.
The increase during the fiscal year ended March 31, 2012 was primarily due to the additional valuationallowances recorded on deferred tax assets in the U.S. and the U.K. and additional valuation allowances recordedin Japan for Sony Corporation and certain Japanese subsidiaries. As of March 31, 2012, Sony has concluded thatwith respect to Sony Americas Holding Inc. (“SAHI”) and its consolidated tax filing group in the U.S., and SonyEurope Limited (“SEU”), a subsidiary in the U.K., the cumulative loss position was significant negative evidencethat was difficult to overcome. There was positive evidence in the form of tax planning actions and strategies, thelong carryforward periods for utilization, as well as a history of taxable income and utilization of assets beforeexpiration. The tax planning strategies included changes in film amortization methods in the U.S. as described
F-77
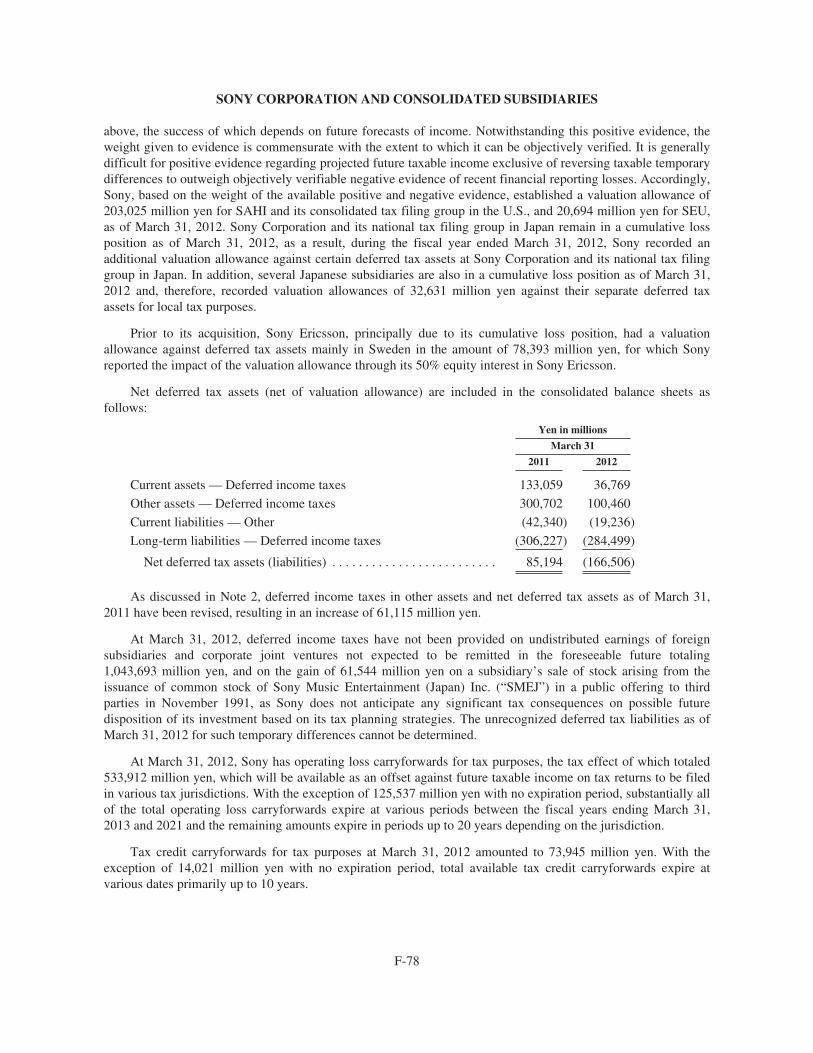
SONY CORPORATION AND CONSOLIDATED SUBSIDIARIES
above, the success of which depends on future forecasts of income. Notwithstanding this positive evidence, theweight given to evidence is commensurate with the extent to which it can be objectively verified. It is generallydifficult for positive evidence regarding projected future taxable income exclusive of reversing taxable temporarydifferences to outweigh objectively verifiable negative evidence of recent financial reporting losses. Accordingly,Sony, based on the weight of the available positive and negative evidence, established a valuation allowance of203,025 million yen for SAHI and its consolidated tax filing group in the U.S., and 20,694 million yen for SEU,as of March 31, 2012. Sony Corporation and its national tax filing group in Japan remain in a cumulative lossposition as of March 31, 2012, as a result, during the fiscal year ended March 31, 2012, Sony recorded anadditional valuation allowance against certain deferred tax assets at Sony Corporation and its national tax filinggroup in Japan. In addition, several Japanese subsidiaries are also in a cumulative loss position as of March 31,2012 and, therefore, recorded valuation allowances of 32,631 million yen against their separate deferred taxassets for local tax purposes.
Prior to its acquisition, Sony Ericsson, principally due to its cumulative loss position, had a valuationallowance against deferred tax assets mainly in Sweden in the amount of 78,393 million yen, for which Sonyreported the impact of the valuation allowance through its 50% equity interest in Sony Ericsson.
Net deferred tax assets (net of valuation allowance) are included in the consolidated balance sheets asfollows:
Yen in millions
March 31
2011 2012
Current assets — Deferred income taxes 133,059 36,769
Other assets — Deferred income taxes 300,702 100,460
Current liabilities — Other (42,340) (19,236)
Long-term liabilities — Deferred income taxes (306,227) (284,499)
Net deferred tax assets (liabilities) . . . . . . . . . . . . . . . . . . . . . . . . . 85,194 (166,506)
As discussed in Note 2, deferred income taxes in other assets and net deferred tax assets as of March 31,2011 have been revised, resulting in an increase of 61,115 million yen.
At March 31, 2012, deferred income taxes have not been provided on undistributed earnings of foreignsubsidiaries and corporate joint ventures not expected to be remitted in the foreseeable future totaling1,043,693 million yen, and on the gain of 61,544 million yen on a subsidiary’s sale of stock arising from theissuance of common stock of Sony Music Entertainment (Japan) Inc. (“SMEJ”) in a public offering to thirdparties in November 1991, as Sony does not anticipate any significant tax consequences on possible futuredisposition of its investment based on its tax planning strategies. The unrecognized deferred tax liabilities as ofMarch 31, 2012 for such temporary differences cannot be determined.
At March 31, 2012, Sony has operating loss carryforwards for tax purposes, the tax effect of which totaled533,912 million yen, which will be available as an offset against future taxable income on tax returns to be filedin various tax jurisdictions. With the exception of 125,537 million yen with no expiration period, substantially allof the total operating loss carryforwards expire at various periods between the fiscal years ending March 31,2013 and 2021 and the remaining amounts expire in periods up to 20 years depending on the jurisdiction.
Tax credit carryforwards for tax purposes at March 31, 2012 amounted to 73,945 million yen. With theexception of 14,021 million yen with no expiration period, total available tax credit carryforwards expire atvarious dates primarily up to 10 years.
F-78
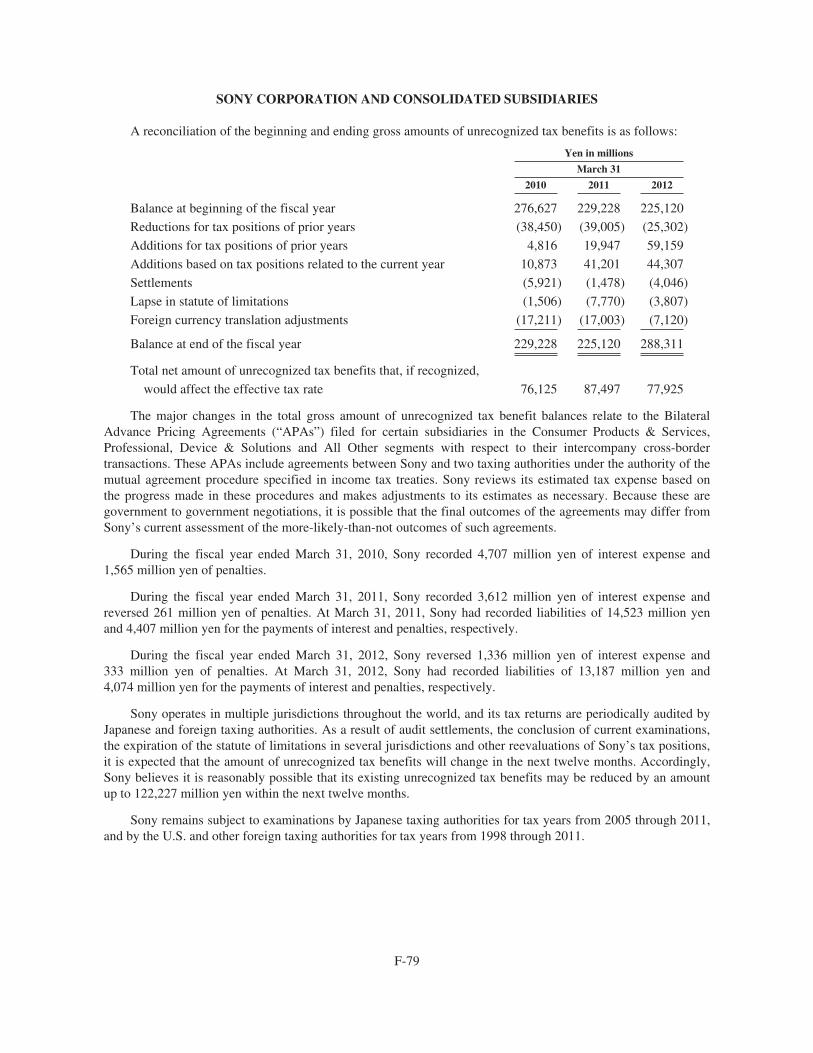
SONY CORPORATION AND CONSOLIDATED SUBSIDIARIES
A reconciliation of the beginning and ending gross amounts of unrecognized tax benefits is as follows:
Yen in millions
March 31
2010 2011 2012
Balance at beginning of the fiscal year 276,627 229,228 225,120
Reductions for tax positions of prior years (38,450) (39,005) (25,302)
Additions for tax positions of prior years 4,816 19,947 59,159
Additions based on tax positions related to the current year 10,873 41,201 44,307
Settlements (5,921) (1,478) (4,046)
Lapse in statute of limitations (1,506) (7,770) (3,807)
Foreign currency translation adjustments (17,211) (17,003) (7,120)
Balance at end of the fiscal year 229,228 225,120 288,311
Total net amount of unrecognized tax benefits that, if recognized,
would affect the effective tax rate 76,125 87,497 77,925
The major changes in the total gross amount of unrecognized tax benefit balances relate to the BilateralAdvance Pricing Agreements (“APAs”) filed for certain subsidiaries in the Consumer Products & Services,Professional, Device & Solutions and All Other segments with respect to their intercompany cross-bordertransactions. These APAs include agreements between Sony and two taxing authorities under the authority of themutual agreement procedure specified in income tax treaties. Sony reviews its estimated tax expense based onthe progress made in these procedures and makes adjustments to its estimates as necessary. Because these aregovernment to government negotiations, it is possible that the final outcomes of the agreements may differ fromSony’s current assessment of the more-likely-than-not outcomes of such agreements.
During the fiscal year ended March 31, 2010, Sony recorded 4,707 million yen of interest expense and1,565 million yen of penalties.
During the fiscal year ended March 31, 2011, Sony recorded 3,612 million yen of interest expense andreversed 261 million yen of penalties. At March 31, 2011, Sony had recorded liabilities of 14,523 million yenand 4,407 million yen for the payments of interest and penalties, respectively.
During the fiscal year ended March 31, 2012, Sony reversed 1,336 million yen of interest expense and333 million yen of penalties. At March 31, 2012, Sony had recorded liabilities of 13,187 million yen and4,074 million yen for the payments of interest and penalties, respectively.
Sony operates in multiple jurisdictions throughout the world, and its tax returns are periodically audited byJapanese and foreign taxing authorities. As a result of audit settlements, the conclusion of current examinations,the expiration of the statute of limitations in several jurisdictions and other reevaluations of Sony’s tax positions,it is expected that the amount of unrecognized tax benefits will change in the next twelve months. Accordingly,Sony believes it is reasonably possible that its existing unrecognized tax benefits may be reduced by an amountup to 122,227 million yen within the next twelve months.
Sony remains subject to examinations by Japanese taxing authorities for tax years from 2005 through 2011,and by the U.S. and other foreign taxing authorities for tax years from 1998 through 2011.
F-79
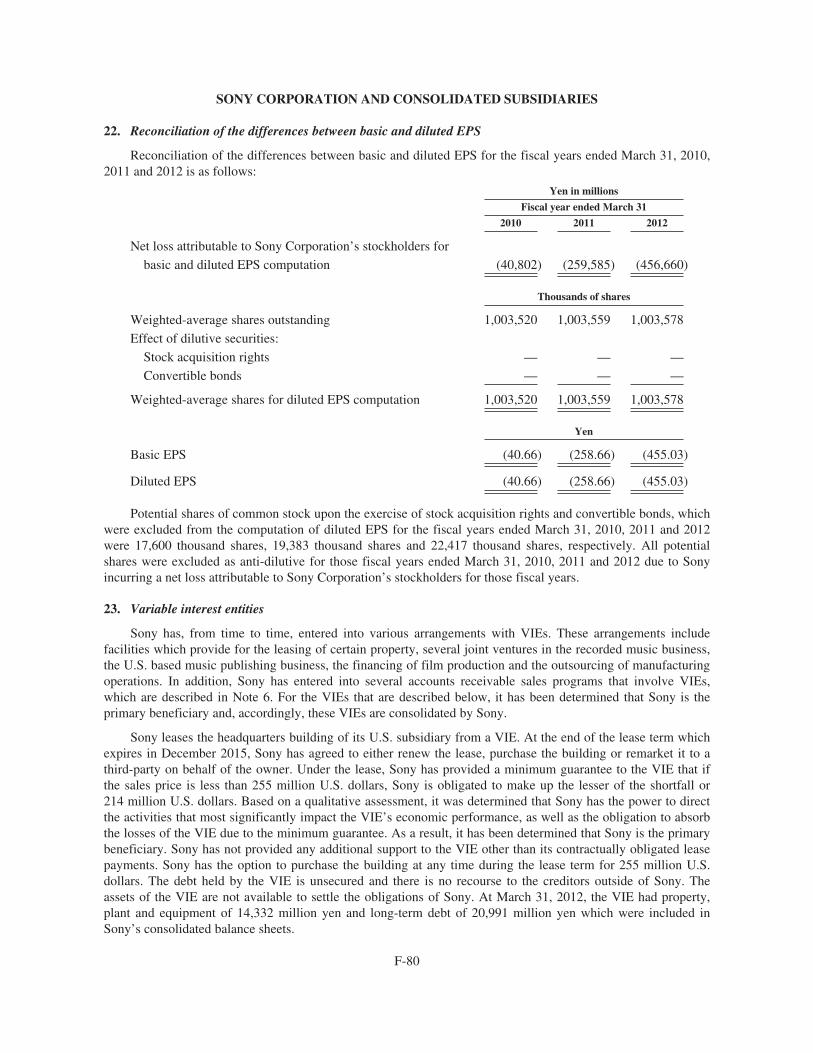
SONY CORPORATION AND CONSOLIDATED SUBSIDIARIES
22. Reconciliation of the differences between basic and diluted EPS
Reconciliation of the differences between basic and diluted EPS for the fiscal years ended March 31, 2010,2011 and 2012 is as follows:
Yen in millions
Fiscal year ended March 31
2010 2011 2012
Net loss attributable to Sony Corporation’s stockholders for
basic and diluted EPS computation (40,802) (259,585) (456,660)
Thousands of shares
Weighted-average shares outstanding 1,003,520 1,003,559 1,003,578
Effect of dilutive securities:
Stock acquisition rights — — —
Convertible bonds — — —
Weighted-average shares for diluted EPS computation 1,003,520 1,003,559 1,003,578
Yen
Basic EPS (40.66) (258.66) (455.03)
Diluted EPS (40.66) (258.66) (455.03)
Potential shares of common stock upon the exercise of stock acquisition rights and convertible bonds, whichwere excluded from the computation of diluted EPS for the fiscal years ended March 31, 2010, 2011 and 2012were 17,600 thousand shares, 19,383 thousand shares and 22,417 thousand shares, respectively. All potentialshares were excluded as anti-dilutive for those fiscal years ended March 31, 2010, 2011 and 2012 due to Sonyincurring a net loss attributable to Sony Corporation’s stockholders for those fiscal years.
23. Variable interest entities
Sony has, from time to time, entered into various arrangements with VIEs. These arrangements includefacilities which provide for the leasing of certain property, several joint ventures in the recorded music business,the U.S. based music publishing business, the financing of film production and the outsourcing of manufacturingoperations. In addition, Sony has entered into several accounts receivable sales programs that involve VIEs,which are described in Note 6. For the VIEs that are described below, it has been determined that Sony is theprimary beneficiary and, accordingly, these VIEs are consolidated by Sony.
Sony leases the headquarters building of its U.S. subsidiary from a VIE. At the end of the lease term whichexpires in December 2015, Sony has agreed to either renew the lease, purchase the building or remarket it to athird-party on behalf of the owner. Under the lease, Sony has provided a minimum guarantee to the VIE that ifthe sales price is less than 255 million U.S. dollars, Sony is obligated to make up the lesser of the shortfall or214 million U.S. dollars. Based on a qualitative assessment, it was determined that Sony has the power to directthe activities that most significantly impact the VIE’s economic performance, as well as the obligation to absorbthe losses of the VIE due to the minimum guarantee. As a result, it has been determined that Sony is the primarybeneficiary. Sony has not provided any additional support to the VIE other than its contractually obligated leasepayments. Sony has the option to purchase the building at any time during the lease term for 255 million U.S.dollars. The debt held by the VIE is unsecured and there is no recourse to the creditors outside of Sony. Theassets of the VIE are not available to settle the obligations of Sony. At March 31, 2012, the VIE had property,plant and equipment of 14,332 million yen and long-term debt of 20,991 million yen which were included inSony’s consolidated balance sheets.
F-80
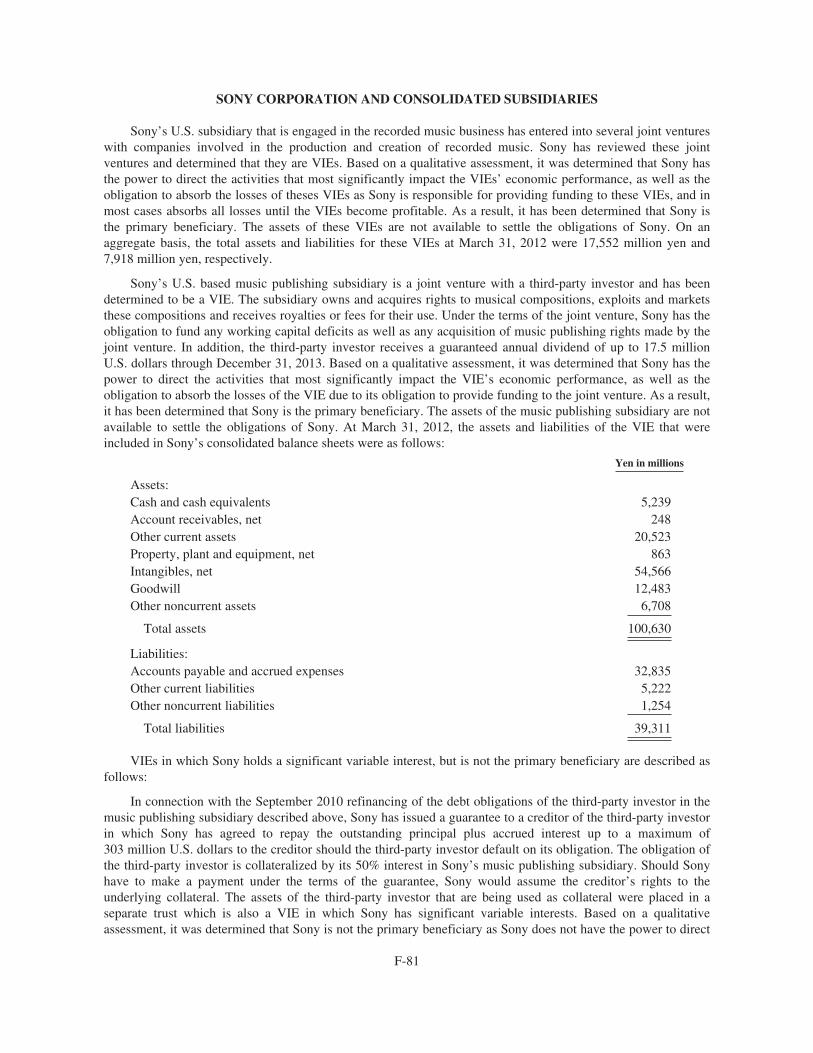
SONY CORPORATION AND CONSOLIDATED SUBSIDIARIES
Sony’s U.S. subsidiary that is engaged in the recorded music business has entered into several joint ventureswith companies involved in the production and creation of recorded music. Sony has reviewed these jointventures and determined that they are VIEs. Based on a qualitative assessment, it was determined that Sony hasthe power to direct the activities that most significantly impact the VIEs’ economic performance, as well as theobligation to absorb the losses of theses VIEs as Sony is responsible for providing funding to these VIEs, and inmost cases absorbs all losses until the VIEs become profitable. As a result, it has been determined that Sony isthe primary beneficiary. The assets of these VIEs are not available to settle the obligations of Sony. On anaggregate basis, the total assets and liabilities for these VIEs at March 31, 2012 were 17,552 million yen and7,918 million yen, respectively.
Sony’s U.S. based music publishing subsidiary is a joint venture with a third-party investor and has beendetermined to be a VIE. The subsidiary owns and acquires rights to musical compositions, exploits and marketsthese compositions and receives royalties or fees for their use. Under the terms of the joint venture, Sony has theobligation to fund any working capital deficits as well as any acquisition of music publishing rights made by thejoint venture. In addition, the third-party investor receives a guaranteed annual dividend of up to 17.5 millionU.S. dollars through December 31, 2013. Based on a qualitative assessment, it was determined that Sony has thepower to direct the activities that most significantly impact the VIE’s economic performance, as well as theobligation to absorb the losses of the VIE due to its obligation to provide funding to the joint venture. As a result,it has been determined that Sony is the primary beneficiary. The assets of the music publishing subsidiary are notavailable to settle the obligations of Sony. At March 31, 2012, the assets and liabilities of the VIE that wereincluded in Sony’s consolidated balance sheets were as follows:
Yen in millions
Assets:Cash and cash equivalents 5,239Account receivables, net 248Other current assets 20,523Property, plant and equipment, net 863Intangibles, net 54,566Goodwill 12,483Other noncurrent assets 6,708
Total assets 100,630
Liabilities:Accounts payable and accrued expenses 32,835Other current liabilities 5,222Other noncurrent liabilities 1,254
Total liabilities 39,311
VIEs in which Sony holds a significant variable interest, but is not the primary beneficiary are described asfollows:
In connection with the September 2010 refinancing of the debt obligations of the third-party investor in themusic publishing subsidiary described above, Sony has issued a guarantee to a creditor of the third-party investorin which Sony has agreed to repay the outstanding principal plus accrued interest up to a maximum of303 million U.S. dollars to the creditor should the third-party investor default on its obligation. The obligation ofthe third-party investor is collateralized by its 50% interest in Sony’s music publishing subsidiary. Should Sonyhave to make a payment under the terms of the guarantee, Sony would assume the creditor’s rights to theunderlying collateral. The assets of the third-party investor that are being used as collateral were placed in aseparate trust which is also a VIE in which Sony has significant variable interests. Based on a qualitativeassessment, it was determined that Sony is not the primary beneficiary as Sony does not have the power to direct
F-81
SONY CORPORATION AND CONSOLIDATED SUBSIDIARIES
the activities of the trust. The assets held by the trust consist solely of the third-party investor’s 50% ownershipinterest in the music publishing subsidiary. At March 31, 2012, the fair value of the assets held by the trustexceeded 303 million U.S. dollars.
Sony’s subsidiary in the Pictures segment entered into a joint venture agreement with a VIE to acquire theinternational distribution rights, as defined, to 12 pictures. The subsidiary is required to distribute these picturesinternationally, for contractually defined fees determined as percentages of gross receipts and is responsible forall distribution and marketing expenses, which are recouped from such distribution fees, each as defined. TheVIE was capitalized with total financing of 406 million U.S. dollars. Of this amount, 11 million U.S. dollars wascontributed by the subsidiary, 95 million U.S. dollars was provided by unrelated third-party investors and theremaining funding was provided through a 300 million U.S. dollar bank credit facility. Under the agreement, thesubsidiary’s 11 million U.S. dollars equity investment is the last equity to be repaid. Based on the factors above,it was previously determined that the subsidiary was the primary beneficiary as it had the power to direct theactivities of the VIE and was projected to absorb a significant amount of the losses or residual returns of the VIE.As of March 31, 2009, the bank credit facility had been terminated and the third-party investors have been repaidtheir 95 million U.S. dollar investment. On May 11, 2009, the subsidiary repurchased from the VIE theinternational distribution rights to the 12 pictures and the VIE received a participation interest in these films onidentical financial terms to those described above. As a result of repurchasing the international distribution rightsfrom the VIE, Sony determined that the subsidiary was no longer the primary beneficiary as it no longer had thepower to direct the activities of the VIE and was not projected to absorb a significant amount of the losses orresidual returns of the VIE. No gain or loss was recognized by the subsidiary on the deconsolidation of the VIE.As of March 31, 2012, the subsidiary’s balance sheet includes no film costs related to the internationaldistribution rights acquired from the VIE and 748 million yen of participation liabilities recorded within accountspayable, other and accrued expenses as well as other noncurrent liabilities due to the VIE. On April 11, 2012, thesubsidiary acquired the VIE’s participation interest for 22 million U.S. dollars. As a result of this acquisition, theVIE no longer has any financial interest in these pictures.
Sony’s subsidiary in the Pictures segment entered into two separate production/co-financing agreementswith VIEs to co-finance 19 films that were released over the 31 months ended July 31, 2008. The subsidiaryreceived 565 million U.S. dollars over the term of the agreements to fund the production or acquisition cost offilms (including fees and expenses). Under these agreements, the subsidiary is responsible for the marketing anddistribution of the product through its global distribution channels. The VIEs share in the net profits, as defined,of the films after the subsidiary recoups a distribution fee, its marketing and distribution expenses, and third-party participation and residual costs, each as defined. As the subsidiary did not have the power to direct theactivities of these VIEs, the subsidiary is not the primary beneficiary of either of the VIEs. At March 31, 2012,there were no amounts recorded on the subsidiary’s balance sheet that related to either of the VIEs other than theinvestors’ earned but unpaid share of the films’ net profits, as defined.
Additionally, on January 19, 2007, the subsidiary entered into a third production/co-financing agreementwith another VIE to co-finance a majority of the films submitted through March 2012. The subsidiary received acommitment from the VIE that it would fund up to 525 million U.S. dollars on a revolving basis to fund theproduction or acquisition cost of films (including fees and expenses). Under the agreement, the subsidiary isresponsible for the marketing and distribution of the product through its global distribution channels. The VIEshares in the net profits, as defined, of the films after the subsidiary recoups a distribution fee, its marketing anddistribution expenses, and third-party participation and residual costs, each as defined. As the subsidiary did nothave the power to direct the activities of the VIE, the subsidiary is not the primary beneficiary of the VIE. OnDecember 16, 2011, the subsidiary and the VIE agreed to modify the production/co-financing agreement (the“Modification”). Per the Modification, the VIE paid the subsidiary 20 million U.S. dollars and transferredselected rights in the films financed prior to the Modification (the “Previously Financed Films”) to thesubsidiary, including the VIE’s share in the net profits in the Previously Financed Films. In exchange, thesubsidiary released the VIE from its obligation to finance future films and the VIE received a participationinterest in the Previously Financed Films. As the subsidiary, after the Modification, continues to not have the
F-82
SONY CORPORATION AND CONSOLIDATED SUBSIDIARIES
power to direct the activities of the VIE, the subsidiary is not the primary beneficiary of the VIE. At March 31,2012, there were no amounts recorded on the subsidiary’s balance sheet that related to the VIE other than theVIE’s participation interest in the Previously Financed Films.
In January 2010, Sony sold 90.0% of its interest in a Mexican subsidiary which primarily manufacturedLCD televisions, as well as other assets including machinery and equipment of 4,520 million yen and inventoriesof 5,619 million yen, to a contract manufacturer. The continuing entity, which would perform this manufacturinggoing forward, is a VIE as it is thinly capitalized and dependent on funding from the parent entity. Based on aqualitative assessment, it was determined that Sony is not the primary beneficiary as Sony does not have thepower to direct the activities that most significantly impact the VIE’s economic performance nor does Sony havethe obligation to absorb the losses of the VIE. In connection with the sale of Sony’s controlling interest in thesubsidiary, Sony received 11,189 million yen and recorded a loss of 1,664 million yen during the fiscal yearended March 31, 2010. Concurrent with the sale, Sony entered into an agreement with the VIE and its parentcompany in which Sony agreed to purchase a significant share of the LCD televisions that Sony sells in certainmarkets, including the U.S. market. As of March 31, 2012, the amounts recorded on Sony’s consolidated balancesheets that relate to the VIE include receivables recorded within prepaid expenses and other current assets of10,295 million yen and accounts payable, trade of 18,830 million yen. Sony’s maximum exposure to losses isconsidered insignificant.
As described in Note 6, accounts receivable sales programs in Japan and in the Financial Services segmentalso involve VIEs that formerly met the criteria to be a QSPE. These VIEs are all special purpose entities of thesponsor banks. In addition, a counterparty of the accounts receivable transactions in the U.S. includes a VIE.Based on a qualitative assessment, Sony is not the primary beneficiary and therefore does not consolidate theseentities as Sony does not have the power to direct the activities, an obligation to absorb losses, or the right toreceive the residual returns of these VIEs. Sony’s maximum exposure to losses from these VIEs is consideredinsignificant.
As described in Note 25, in connection with the sale of the small- and medium-sized TFT LCD business,Sony will transfer to a third-party legal ownership of a certain subsidiary within the former small- and medium-sized TFT LCD business during the fiscal year ending March 31, 2013. As of March 31, 2012, this entity is aVIE. Based on a qualitative assessment, Sony is not the primary beneficiary and therefore does not consolidatethe entity after the sale as Sony does not have the power to direct the activities of the VIE nor does Sony have anobligation to absorb the losses or the right to receive the residual returns of this VIE. Sony’s maximum exposureto losses is considered insignificant.
24. Acquisitions
(1) Game Show Network acquisition
In April 2009, Sony sold a portion of its 50% ownership interest in GSN, which operates a U.S. cablenetwork and online business, to the other investor in GSN, which resulted in cash proceeds of 8,831 million yenand a gain of 8,322 million yen for the fiscal year ended March 31, 2010. The gain was recorded in otheroperating (income) expense, net.
In March 2011, Sony acquired an additional 5% equity interest in GSN from the successor in interest to theother investor (the “Current Investor”) for 4,849 million yen, resulting in Sony owning a 40% equity interest inGSN. As part of the acquisition, Sony obtained a controlling interest in GSN, including the ability to appoint themajority of representatives on the GSN management committee, control over approval of the budget for GSN andcontrol over the hiring, terminating, and setting compensation of the senior management of GSN. Thisacquisition will strengthen Sony’s presence in U.S. cable networks and Sony expects that it will allow GSN tofurther exploit and benefit from the light entertainment assets in the Pictures segment.
In addition to acquiring the additional 5% equity interest in GSN, Sony granted a put right to the CurrentInvestor and received a call right from the Current Investor for an additional 18% equity interest in GSN. The put
F-83
SONY CORPORATION AND CONSOLIDATED SUBSIDIARIES
right is exercisable during three windows starting on April 1 of 2012, 2013 and 2014 and lasting for 60 businessdays (each such period, a “Trigger Window”). In the event that GSN’s audited financial statements for the mostrecent completed calendar year are not available on April 1, the Trigger Window shall commence on the daywhen GSN’s audited financial statements are delivered to the Current Investor. As of May 31, 2012, GSN’saudited financial statements for the year ended December 31, 2011 have not been delivered to the CurrentInvestor. The exercise price of the put is calculated using a formula based on an agreed upon multiple of theearnings of GSN with a minimum price of 234 million U.S. dollars and a maximum price of 288 million U.S.dollars. Sony’s call right is exercisable only if the put is not exercised, and may be exercised for 60 business daysimmediately after the last put window has expired. The exercise price of the call is calculated using the sameformula as the put with a minimum price of 234 million U.S. dollars. A buy/sell provision also applies to theequity interests in GSN owned by Sony and the Current Investor and may be exercised annually for a 60 businessday window beginning April 1, 2015.
Prior to the March 2011 acquisition, Sony’s interest in GSN was accounted for under the equity method ofaccounting. As a result of Sony obtaining a controlling interest in GSN, Sony consolidated GSN using theacquisition method of accounting and recorded the fair value of the identifiable assets, liabilities assumed,redeemable noncontrolling interest, noncontrolling interest and residual goodwill of GSN. In accordance with theaccounting guidance for business combinations achieved in stages, Sony remeasured the 35% equity interest inGSN that it owned prior to the acquisition at a fair value of 33,940 million yen which resulted in the recognitionof a gain of 26,991 million yen recorded in other operating (income) expense, net.
F-84
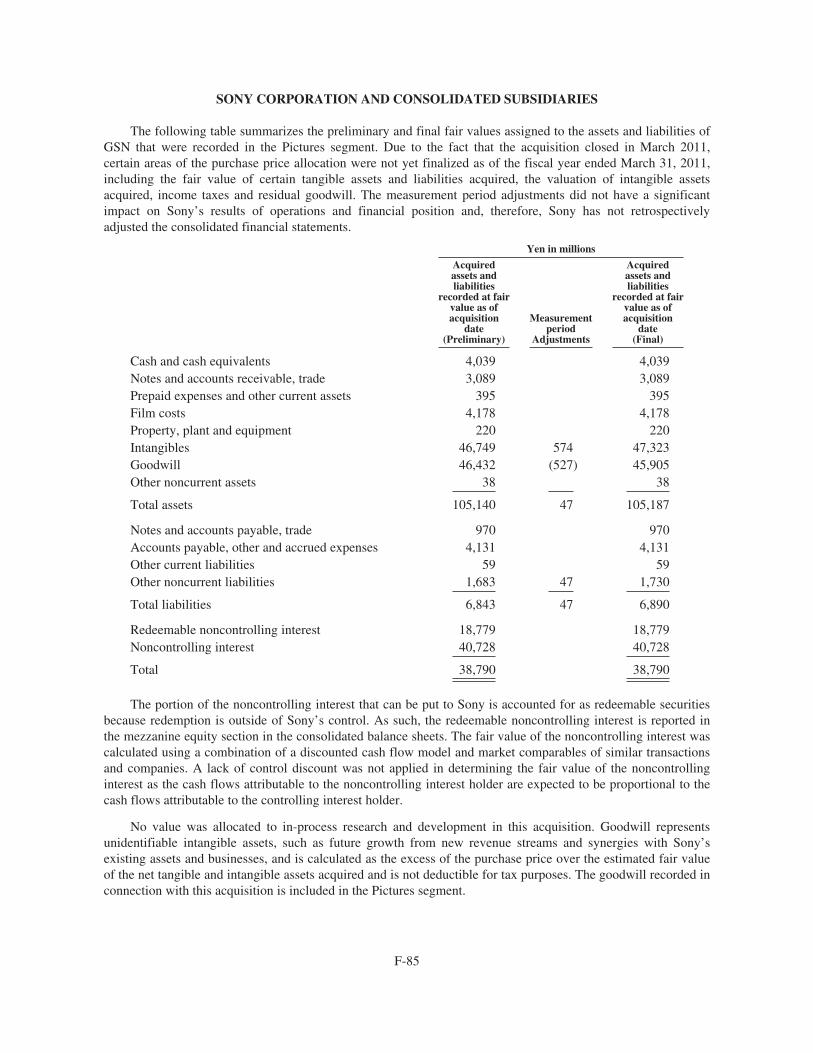
SONY CORPORATION AND CONSOLIDATED SUBSIDIARIES
The following table summarizes the preliminary and final fair values assigned to the assets and liabilities ofGSN that were recorded in the Pictures segment. Due to the fact that the acquisition closed in March 2011,certain areas of the purchase price allocation were not yet finalized as of the fiscal year ended March 31, 2011,including the fair value of certain tangible assets and liabilities acquired, the valuation of intangible assetsacquired, income taxes and residual goodwill. The measurement period adjustments did not have a significantimpact on Sony’s results of operations and financial position and, therefore, Sony has not retrospectivelyadjusted the consolidated financial statements.
Yen in millions
Acquiredassets andliabilities
recorded at fairvalue as ofacquisition
date(Preliminary)
Measurementperiod
Adjustments
Acquiredassets andliabilities
recorded at fairvalue as ofacquisition
date(Final)
Cash and cash equivalents 4,039 4,039Notes and accounts receivable, trade 3,089 3,089Prepaid expenses and other current assets 395 395Film costs 4,178 4,178Property, plant and equipment 220 220Intangibles 46,749 574 47,323Goodwill 46,432 (527) 45,905Other noncurrent assets 38 38
Total assets 105,140 47 105,187
Notes and accounts payable, trade 970 970Accounts payable, other and accrued expenses 4,131 4,131Other current liabilities 59 59Other noncurrent liabilities 1,683 47 1,730
Total liabilities 6,843 47 6,890
Redeemable noncontrolling interest 18,779 18,779Noncontrolling interest 40,728 40,728
Total 38,790 38,790
The portion of the noncontrolling interest that can be put to Sony is accounted for as redeemable securitiesbecause redemption is outside of Sony’s control. As such, the redeemable noncontrolling interest is reported inthe mezzanine equity section in the consolidated balance sheets. The fair value of the noncontrolling interest wascalculated using a combination of a discounted cash flow model and market comparables of similar transactionsand companies. A lack of control discount was not applied in determining the fair value of the noncontrollinginterest as the cash flows attributable to the noncontrolling interest holder are expected to be proportional to thecash flows attributable to the controlling interest holder.
No value was allocated to in-process research and development in this acquisition. Goodwill representsunidentifiable intangible assets, such as future growth from new revenue streams and synergies with Sony’sexisting assets and businesses, and is calculated as the excess of the purchase price over the estimated fair valueof the net tangible and intangible assets acquired and is not deductible for tax purposes. The goodwill recorded inconnection with this acquisition is included in the Pictures segment.
F-85
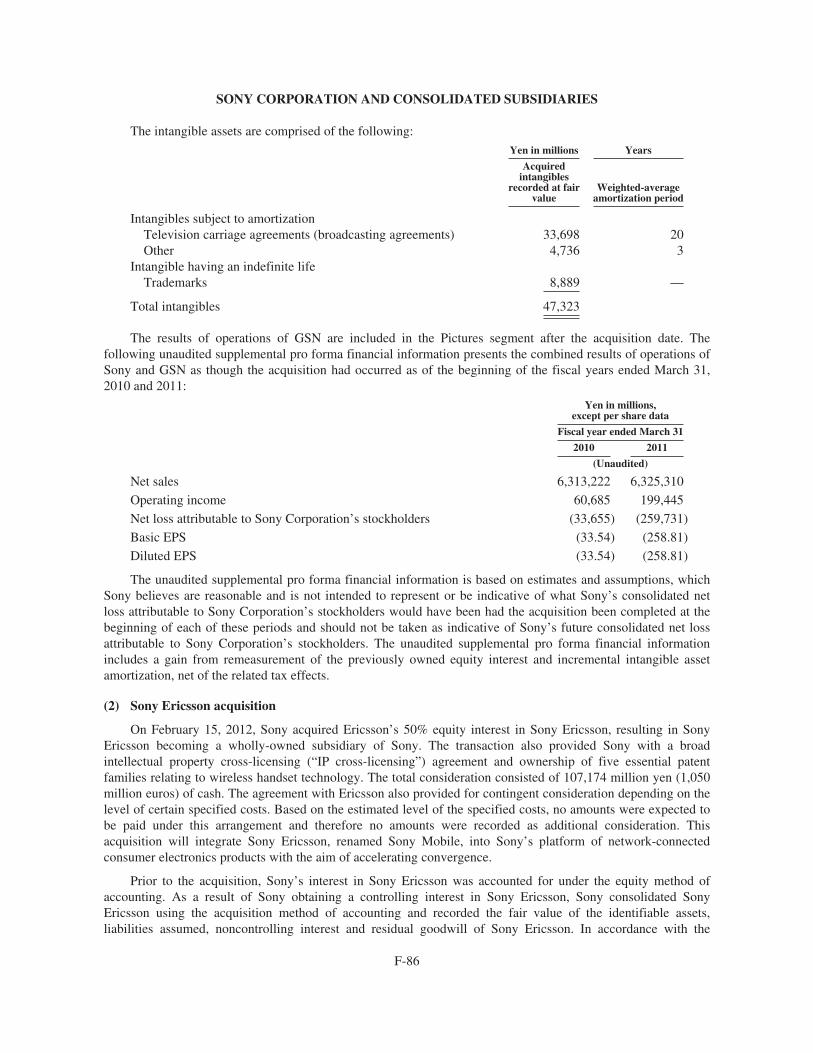
SONY CORPORATION AND CONSOLIDATED SUBSIDIARIES
The intangible assets are comprised of the following:Yen in millions Years
Acquiredintangibles
recorded at fairvalue
Weighted-averageamortization period
Intangibles subject to amortizationTelevision carriage agreements (broadcasting agreements) 33,698 20Other 4,736 3
Intangible having an indefinite lifeTrademarks 8,889 —
Total intangibles 47,323
The results of operations of GSN are included in the Pictures segment after the acquisition date. Thefollowing unaudited supplemental pro forma financial information presents the combined results of operations ofSony and GSN as though the acquisition had occurred as of the beginning of the fiscal years ended March 31,2010 and 2011:
Yen in millions,except per share data
Fiscal year ended March 31
2010 2011
(Unaudited)
Net sales 6,313,222 6,325,310
Operating income 60,685 199,445
Net loss attributable to Sony Corporation’s stockholders (33,655) (259,731)
Basic EPS (33.54) (258.81)
Diluted EPS (33.54) (258.81)
The unaudited supplemental pro forma financial information is based on estimates and assumptions, whichSony believes are reasonable and is not intended to represent or be indicative of what Sony’s consolidated netloss attributable to Sony Corporation’s stockholders would have been had the acquisition been completed at thebeginning of each of these periods and should not be taken as indicative of Sony’s future consolidated net lossattributable to Sony Corporation’s stockholders. The unaudited supplemental pro forma financial informationincludes a gain from remeasurement of the previously owned equity interest and incremental intangible assetamortization, net of the related tax effects.
(2) Sony Ericsson acquisition
On February 15, 2012, Sony acquired Ericsson’s 50% equity interest in Sony Ericsson, resulting in SonyEricsson becoming a wholly-owned subsidiary of Sony. The transaction also provided Sony with a broadintellectual property cross-licensing (“IP cross-licensing”) agreement and ownership of five essential patentfamilies relating to wireless handset technology. The total consideration consisted of 107,174 million yen (1,050million euros) of cash. The agreement with Ericsson also provided for contingent consideration depending on thelevel of certain specified costs. Based on the estimated level of the specified costs, no amounts were expected tobe paid under this arrangement and therefore no amounts were recorded as additional consideration. Thisacquisition will integrate Sony Ericsson, renamed Sony Mobile, into Sony’s platform of network-connectedconsumer electronics products with the aim of accelerating convergence.
Prior to the acquisition, Sony’s interest in Sony Ericsson was accounted for under the equity method ofaccounting. As a result of Sony obtaining a controlling interest in Sony Ericsson, Sony consolidated SonyEricsson using the acquisition method of accounting and recorded the fair value of the identifiable assets,liabilities assumed, noncontrolling interest and residual goodwill of Sony Ericsson. In accordance with the
F-86
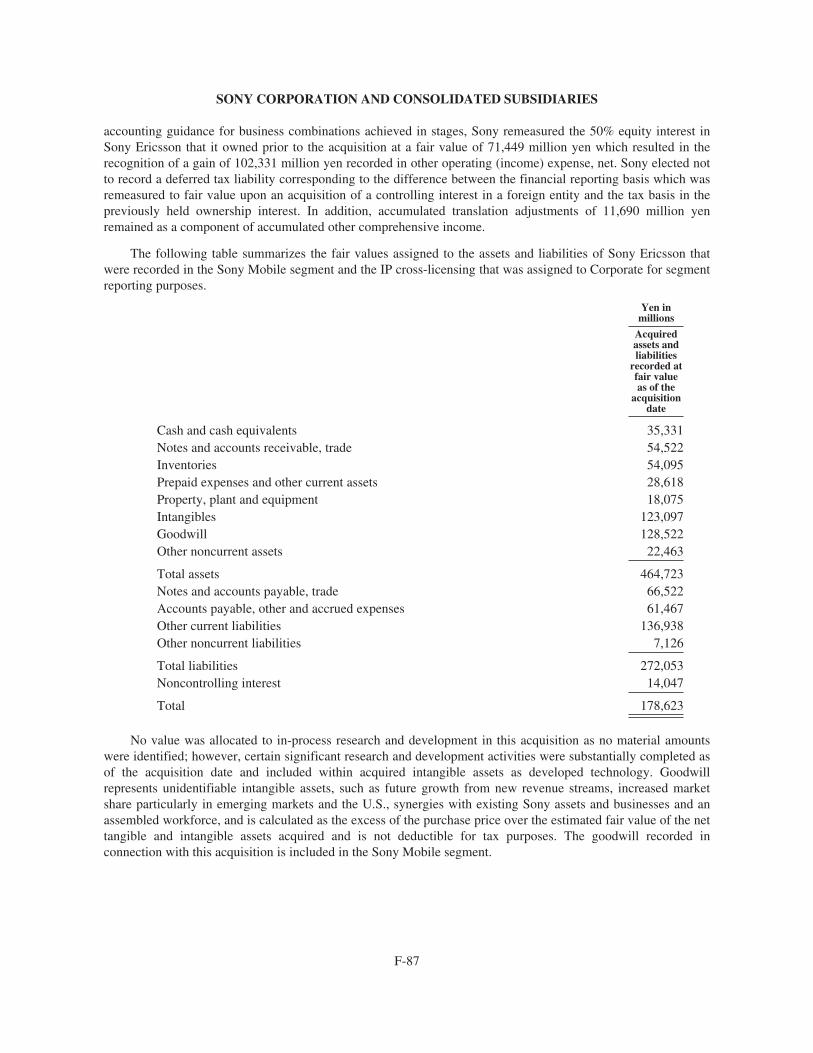
SONY CORPORATION AND CONSOLIDATED SUBSIDIARIES
accounting guidance for business combinations achieved in stages, Sony remeasured the 50% equity interest inSony Ericsson that it owned prior to the acquisition at a fair value of 71,449 million yen which resulted in therecognition of a gain of 102,331 million yen recorded in other operating (income) expense, net. Sony elected notto record a deferred tax liability corresponding to the difference between the financial reporting basis which wasremeasured to fair value upon an acquisition of a controlling interest in a foreign entity and the tax basis in thepreviously held ownership interest. In addition, accumulated translation adjustments of 11,690 million yenremained as a component of accumulated other comprehensive income.
The following table summarizes the fair values assigned to the assets and liabilities of Sony Ericsson thatwere recorded in the Sony Mobile segment and the IP cross-licensing that was assigned to Corporate for segmentreporting purposes.
Yen inmillions
Acquiredassets andliabilities
recorded atfair valueas of the
acquisitiondate
Cash and cash equivalents 35,331Notes and accounts receivable, trade 54,522Inventories 54,095Prepaid expenses and other current assets 28,618Property, plant and equipment 18,075Intangibles 123,097Goodwill 128,522Other noncurrent assets 22,463
Total assets 464,723Notes and accounts payable, trade 66,522Accounts payable, other and accrued expenses 61,467Other current liabilities 136,938Other noncurrent liabilities 7,126
Total liabilities 272,053Noncontrolling interest 14,047
Total 178,623
No value was allocated to in-process research and development in this acquisition as no material amountswere identified; however, certain significant research and development activities were substantially completed asof the acquisition date and included within acquired intangible assets as developed technology. Goodwillrepresents unidentifiable intangible assets, such as future growth from new revenue streams, increased marketshare particularly in emerging markets and the U.S., synergies with existing Sony assets and businesses and anassembled workforce, and is calculated as the excess of the purchase price over the estimated fair value of the nettangible and intangible assets acquired and is not deductible for tax purposes. The goodwill recorded inconnection with this acquisition is included in the Sony Mobile segment.
F-87

SONY CORPORATION AND CONSOLIDATED SUBSIDIARIES
The intangible assets are comprised of the following:
Yen in millions Years
Acquiredintangiblesrecorded atfair value
Weighted-averageamortization period
Intangibles subject to amortization
IP cross-licensing 60,834 6
Developed technology 24,599 9
Customer relationships 19,597 14
Trademarks 14,086 7
Other 3,981 7
Total intangibles 123,097
The following unaudited supplemental pro forma financial information presents the combined results ofoperations of Sony and Sony Ericsson as though the acquisition had occurred as of the beginning of the fiscalyear ended March 31, 2011:
Yen in millions,except per share data
Fiscal year ended March 31
2011 2012
(Unaudited)
Net sales 6,901,151 5,941,131
Operating income (loss) 231,895 (187,725)
Net loss attributable to Sony Corporation’s stockholders (226,038) (654,833)
Basic EPS (225.24) (652.50)
Diluted EPS (225.24) (652.50)
The unaudited supplemental pro forma financial information is based on estimates and assumptions, whichSony believes are reasonable and is not intended to represent or be indicative of what Sony’s consolidated netloss attributable to Sony Corporation’s stockholders would have been had the acquisition been completed at thebeginning of the fiscal year ended March 31, 2011 and should not be taken as indicative of Sony’s futureconsolidated net loss attributable to Sony Corporation’s stockholders. The unaudited supplemental pro formafinancial information includes:
• the elimination of equity in net income (loss) and consolidation of Sony Ericsson;
• the gain from remeasurement of the previously owned equity interest;
• incremental intangible asset amortization, net of the related tax effects;
• certain royalty adjustments; and
• additional debt issuance costs and interest expense, incurred in connection with the acquisition.
(3) Sony Semiconductor acquisition
On April 1, 2011, Sony Semiconductor Kyushu Corporation, a wholly-owned subsidiary of SonyCorporation, acquired from Toshiba Corporation (“Toshiba”) for 57,451 million yen semiconductor fabricationequipment and certain related assets. Sony Semiconductor Kyushu Corporation has subsequently changed itsname to Sony Semiconductor Corporation, effective November 1, 2011. Sony’s goal in acquiring the assets is tofurther strengthen its production capacity for CMOS image sensors.
F-88
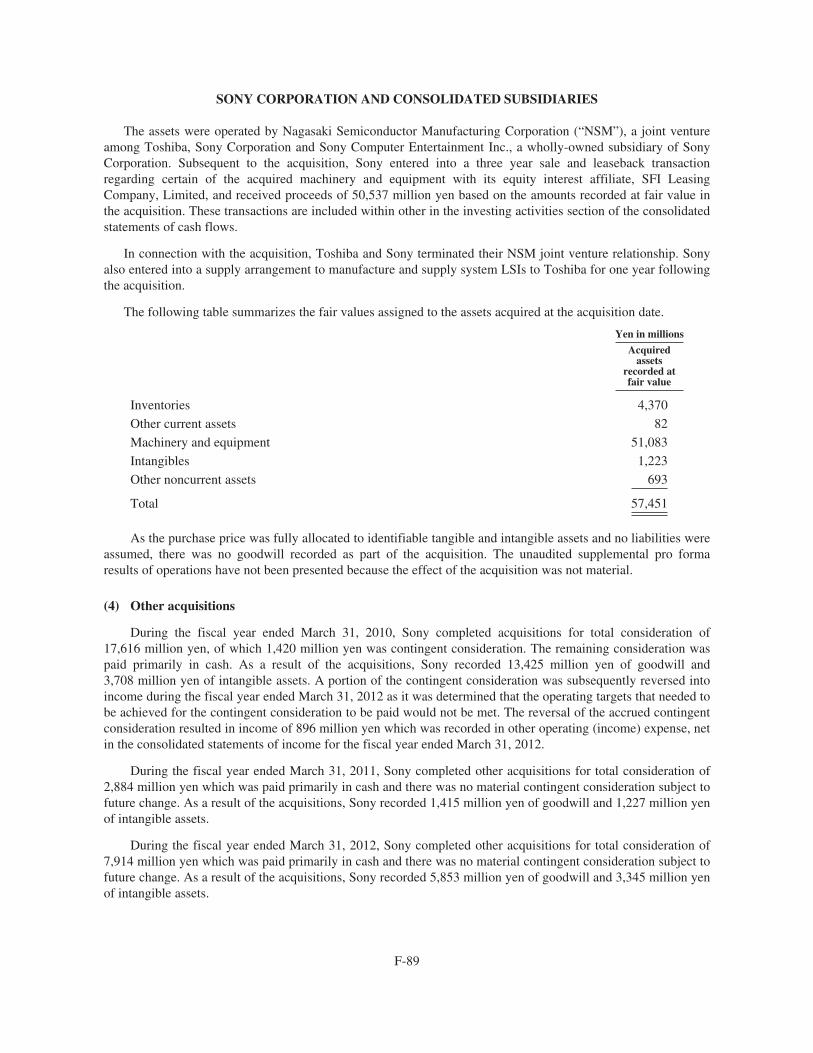
SONY CORPORATION AND CONSOLIDATED SUBSIDIARIES
The assets were operated by Nagasaki Semiconductor Manufacturing Corporation (“NSM”), a joint ventureamong Toshiba, Sony Corporation and Sony Computer Entertainment Inc., a wholly-owned subsidiary of SonyCorporation. Subsequent to the acquisition, Sony entered into a three year sale and leaseback transactionregarding certain of the acquired machinery and equipment with its equity interest affiliate, SFI LeasingCompany, Limited, and received proceeds of 50,537 million yen based on the amounts recorded at fair value inthe acquisition. These transactions are included within other in the investing activities section of the consolidatedstatements of cash flows.
In connection with the acquisition, Toshiba and Sony terminated their NSM joint venture relationship. Sonyalso entered into a supply arrangement to manufacture and supply system LSIs to Toshiba for one year followingthe acquisition.
The following table summarizes the fair values assigned to the assets acquired at the acquisition date.
Yen in millions
Acquiredassets
recorded atfair value
Inventories 4,370
Other current assets 82
Machinery and equipment 51,083
Intangibles 1,223
Other noncurrent assets 693
Total 57,451
As the purchase price was fully allocated to identifiable tangible and intangible assets and no liabilities wereassumed, there was no goodwill recorded as part of the acquisition. The unaudited supplemental pro formaresults of operations have not been presented because the effect of the acquisition was not material.
(4) Other acquisitions
During the fiscal year ended March 31, 2010, Sony completed acquisitions for total consideration of17,616 million yen, of which 1,420 million yen was contingent consideration. The remaining consideration waspaid primarily in cash. As a result of the acquisitions, Sony recorded 13,425 million yen of goodwill and3,708 million yen of intangible assets. A portion of the contingent consideration was subsequently reversed intoincome during the fiscal year ended March 31, 2012 as it was determined that the operating targets that needed tobe achieved for the contingent consideration to be paid would not be met. The reversal of the accrued contingentconsideration resulted in income of 896 million yen which was recorded in other operating (income) expense, netin the consolidated statements of income for the fiscal year ended March 31, 2012.
During the fiscal year ended March 31, 2011, Sony completed other acquisitions for total consideration of2,884 million yen which was paid primarily in cash and there was no material contingent consideration subject tofuture change. As a result of the acquisitions, Sony recorded 1,415 million yen of goodwill and 1,227 million yenof intangible assets.
During the fiscal year ended March 31, 2012, Sony completed other acquisitions for total consideration of7,914 million yen which was paid primarily in cash and there was no material contingent consideration subject tofuture change. As a result of the acquisitions, Sony recorded 5,853 million yen of goodwill and 3,345 million yenof intangible assets.
F-89
SONY CORPORATION AND CONSOLIDATED SUBSIDIARIES
No significant amounts have been allocated to in-process research and development and all of the entitiesdescribed above have been consolidated into Sony’s results of operations since their respective acquisition dates.Pro forma results of operations have not been presented because the effects of Sony Semiconductor and the otheracquisitions, individually and in aggregate, were not material.
25. Divestitures
(1) HBO Latin America and HBO Central Europe
In March 2010, Sony sold a portion of its investment and certain ancillary rights, which was included in thePictures segment, in its HBO Latin America venture, which owns and operates certain premium pay televisionbusinesses in Latin America, to the venture’s majority shareholder (“Majority Shareholder”). Sony accounted forthis sale in accordance with the accounting guidance for transfers and servicing. Prior to this transaction, Sonyowned approximately 29% of this venture, which was accounted for under the equity method, and, as a result ofthis transaction, Sony owned approximately 8% of this venture (the “Retained Interest”), which was accountedfor under the cost method.
As consideration for the transaction, Sony received cash proceeds of 19,424 million yen and received a putoption valued at 1,371 million yen and the sale resulted in a gain of 18,035 million yen for the fiscal year endedMarch 31, 2010. In November 2010, Sony notified the Majority Shareholder that Sony intended to exercise theput option. The purchase of the Retained Interest by the Majority Shareholder was completed in March 2011which resulted in cash proceeds of 5,285 million yen and a gain of 3,329 million yen for the fiscal year endedMarch 31, 2011.
In January 2010, in a separate transaction, Sony sold its entire investment, which was included in thePictures segment, in its HBO Central Europe joint venture, which owns and operates a premium pay televisionbusiness in Central Europe, to an affiliate of the Majority Shareholder. The sale resulted in cash proceeds of7,660 million yen and a gain of 3,957 million yen for the fiscal year ended March 31, 2010.
The above mentioned transactions and the other transactions which were not material individually and inaggregate were recorded in other operating (income) expense, net due to either the nature of the transaction or inconsideration of factors including the relationship to Sony’s core operations.
(2) Small- and medium-sized TFT LCD business
In March 2012, Sony sold the small- and medium-sized TFT LCD business, which was included in theProfessional, Device & Solutions segment, to Japan Display Inc. The sale proceeds are subject to the finalizationof certain post-closing conditions and adjustments. In connection with the sale, Sony will transfer legalownership of a certain subsidiary within the former small- and medium-sized TFT LCD business to JapanDisplay Inc. during the fiscal year ended March 31, 2013. As of March 31, 2012, this entity is a VIE, althoughSony is not the primary beneficiary and therefore does not consolidate the entity after the sale. Refer to Note 23.During the fiscal year ended March 31, 2012, Sony recorded an impairment loss of 19,187 million yen in otheroperating (income) expense, net in the consolidated statements of income, as the disposal group was classified asheld for sale and recorded at the lesser of carrying value or fair value. Following the sale, Sony purchased anequity interest in Japan Display Inc. which Sony accounts for under the cost method.
(3) S-LCD Corporation
In the fiscal year ended March 31, 2012, Sony sold all of its shares of S-LCD, the LCD panel manufacturingjoint venture. Refer to Note 5.
F-90
SONY CORPORATION AND CONSOLIDATED SUBSIDIARIES
(4) Chemical products business
During the fiscal year ended March 31, 2012, Sony entered into a memorandum of understanding with athird-party to sell the chemical products business, which is included in the Professional, Device & Solutionssegment. Sony classified certain assets and liabilities related to the business as held for sale as of March 31,2012, and anticipates completing the divestiture during the fiscal year ending March 31, 2013. No impairmentloss was recognized as a result of the held for sale classification. The assets and liabilities held for sale arecomprised of 14,756 million yen of current assets including accounts receivable and inventories, 29,182 millionyen of goodwill, 19,028 million yen of other noncurrent assets including property, plant and equipment,17,554 million yen of current liabilities including accounts payable and accrued expenses, and 2,657 million yenof noncurrent liabilities. The current and noncurrent assets and liabilities were reclassified to prepaid expensesand other current assets, other assets, other current liabilities and other liabilities in the consolidated balancesheets.
26. Collaborative arrangements
Sony’s collaborative arrangements primarily relate to arrangements entered into, through a subsidiary in thePictures segment, with one or more active participants to jointly finance, produce and/or distribute motion pictureor television product under which both the subsidiary and the other active participants share in the risks andrewards of ownership. These arrangements are referred to as co-production and distribution arrangements.
Sony typically records an asset for only the portion of the motion picture or television product it owns andfinances. Sony and the other participants typically distribute the product in different media or markets. Revenuesearned and expenses incurred for the media or markets in which Sony distributes the product are typicallyrecorded on a gross basis. Sony typically does not record revenues earned and expenses incurred when the otherparticipants distribute the product. Sony and the other participants typically share in the profits from thedistribution of the product in all media or markets. For motion picture product, if Sony is a net receiver of(1) Sony’s share of the profits from the media or markets distributed by the other participants less (2) the otherparticipants’ share of the profits from the media or markets distributed by Sony then the net amount is recordedas net sales. If Sony is a net payer then the net amount is recorded in cost of sales. For television product, Sonyrecords its share of the profits from the media or markets distributed by the other participants as sales, and theother participants’ share of the profits from the media or markets distributed by Sony as cost of sales.
For the years ended March 31, 2010, 2011 and 2012, 4,687 million yen, 4,866 million yen and 10,990 millionyen, respectively, were recorded as cost of sales for amounts owed to the other participants and 9,936 millionyen, 10,244 million yen and 14,625 million yen, respectively, were recorded as net sales for amounts due fromthe other participants in these collaborative arrangements.
27. Commitments, contingent liabilities and other
(1) Commitments:
A. Loan commitments
Subsidiaries in the Financial Services segment have entered into loan agreements with their customers inaccordance with the condition of the contracts. As of March 31, 2012, the total unused portion of the lines ofcredit extended under these contracts was 20,051 million yen. The aggregate amounts of future year-by-yearpayments for these loan commitments cannot be determined.
F-91
SONY CORPORATION AND CONSOLIDATED SUBSIDIARIES
B. Purchase commitments and other
Purchase commitments and other outstanding at March 31, 2012 amounted to 276,016 million yen. The majorcomponents of these commitments are as follows:
In the ordinary course of business, Sony makes commitments for the purchase of property, plant andequipment. As of March 31, 2012, such commitments outstanding were 35,725 million yen.
Certain subsidiaries in the Pictures segment have entered into agreements with creative talent for thedevelopment and production of motion pictures and television programming as well as agreements with thirdparties to acquire completed motion pictures, or certain rights therein, and to acquire the rights to broadcastcertain live action sporting events. These agreements cover various periods mainly within 5 years. As ofMarch 31, 2012, these subsidiaries were committed to make payments under such contracts of 117,187 millionyen.
Certain subsidiaries in the Music segment have entered into long-term contracts with recording artists andcompanies for the production and/or distribution of prerecorded music and videos. These contracts cover variousperiods mainly within 5 years. As of March 31, 2012, these subsidiaries were committed to make payments of41,853 million yen under such long-term contracts.
The schedule of the aggregate amounts of year-by-year payment of purchase commitments during the nextfive years and thereafter is as follows:
Fiscal year ending March 31 Yen in millions
2013 141,236
2014 55,209
2015 35,330
2016 23,281
2017 13,310
Later years 7,650
Total 276,016
In addition to the above, Sony has other commitments as follows:
On November 11, 2011, an investor group including Sony (collectively the “Group”) executed a definitiveagreement with Citigroup, Inc. (“Citi”) whereby the Group will acquire EMI Music Publishing from Citi for totalconsideration of 2.2 billion U.S. dollars. The transaction is subject to certain closing conditions, includingregulatory approvals. Upon the receipt of all necessary regulatory approvals and the resolution of all otherclosing conditions, Sony expects to invest approximately 325 million U.S. dollars and own approximately 38%of the newly formed entity that will ultimately acquire EMI Music Publishing from Citi, with an ability toincrease the investment and ownership up to 40%.
During the fiscal year ended March 31, 2012, there was a receipt of an advance payment from a commercialcustomer. As a result, as of March 31, 2012, Sony recorded 15,173 million yen in other current liabilities and35,404 million yen in other long-term liabilities based on anticipated delivery dates. The advance payment issubject to reimbursement under certain contingent conditions of the contract, including a downgrade of Sony’scredit rating by either S&P (lower than “BBB”) or Moody’s (lower than “Baa2”). The advance payment amountswill be reduced at the time of future product sales to the commercial customer.
F-92
SONY CORPORATION AND CONSOLIDATED SUBSIDIARIES
(2) Contingent liabilities:
Sony had contingent liabilities, including guarantees given in the ordinary course of business, whichamounted to 78,743 million yen at March 31, 2012. The major components of these contingent liabilities are asfollows:
As discussed in Note 23, Sony has agreed to repay the outstanding principal plus accrued interest up to amaximum of 303 million U.S. dollars to the creditor of the third-party investor of Sony’s U.S. based musicpublishing subsidiary should the third-party investor default on its obligation. The obligation of the third-partyinvestor is collateralized by its 50% interest in Sony’s music publishing subsidiary. Should Sony have to make apayment under the terms of the guarantee, Sony would assume the creditor’s rights to the underlying collateral.At March 31, 2012, the fair value of the collateral exceeded 303 million U.S. dollars.
In May 2011, Sony Corporation’s U.S. subsidiary, Sony Electronics Inc., received a subpoena from the U.S.Department of Justice (“DOJ”) Antitrust Division seeking information about its secondary batteries business.Sony understands that the DOJ and one agency outside the United States are investigating competition in thesecondary batteries market. Based on the current stage of the proceedings, it is not possible to estimate theamount of loss or range of possible loss, if any, that might result from adverse judgments, settlements or otherresolution of this matter.
Beginning earlier in 2011, the network services of PlayStation®Network, Qriocity™, Sony OnlineEntertainment LLC and websites of other subsidiaries came under cyber-attack. As of May 31, 2012, Sony hasnot received any confirmed reports of customer identity theft issues or misuse of credit cards from the cyber-attacks. However, in connection with certain of these matters, Sony has received inquiries from authorities in anumber of jurisdictions, including orders for reports issued by the Ministry of Economy, Trade and Industry ofJapan as well as the Financial Services Agency of Japan, formal and/or informal requests for information fromAttorneys General from a number of states in the United States and the U.S. Federal Trade Commission, variousU.S. congressional inquiries and others. Additionally, Sony Corporation and/or certain of its subsidiaries havebeen named in a number of purported class actions in certain jurisdictions, including the United States. Based onthe stage of these inquiries and proceedings, it is not possible to estimate the amount of loss or range of possibleloss, if any, that might result from adverse judgments, settlements or other resolution of these matters.
In October 2009, Sony Corporation’s U.S. subsidiary, Sony Optiarc America Inc., received a subpoena fromthe DOJ seeking information about its optical disk drive business. Sony understands that the DOJ and agenciesoutside the United States are investigating competition in optical disk drives. Subsequently, a number ofpurported class action lawsuits were filed in certain jurisdictions, including the United States, in which theplaintiffs allege that Sony Corporation and certain of its subsidiaries violated antitrust laws and seek recovery ofdamages and other remedies. Based on the current stage of these proceedings, it is not possible to estimate theamount of loss or range of possible loss, if any, that might result from adverse judgments, settlements or otherresolution of all of these matters.
In addition, Sony Corporation and certain of its subsidiaries are defendants or otherwise involved in otherpending legal and regulatory proceedings. However, based upon the information currently available, Sonycurrently believes that the outcome of such legal and regulatory proceedings would not have a material effect onSony’s consolidated financial statements.
(3) Redeemable noncontrolling interest:
As discussed in Note 24, in connection with the GSN transaction, Sony granted a put right to the CurrentInvestor for an additional 18% interest in GSN. The put right is exercisable during three windows starting onApril 1 of 2012, 2013 and 2014 and lasting for 60 business days (each such period, a “Trigger Window”). In theevent that GSN’s audited financial statements for the most recently completed calendar year are not available on
F-93
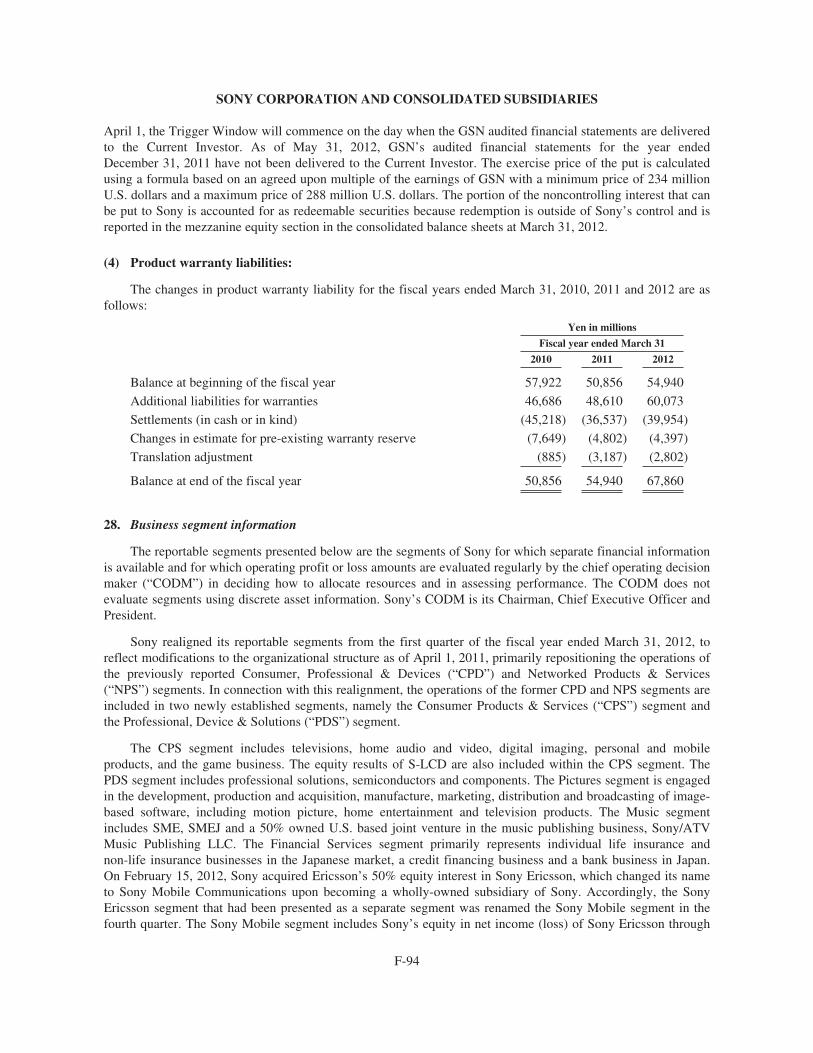
SONY CORPORATION AND CONSOLIDATED SUBSIDIARIES
April 1, the Trigger Window will commence on the day when the GSN audited financial statements are deliveredto the Current Investor. As of May 31, 2012, GSN’s audited financial statements for the year endedDecember 31, 2011 have not been delivered to the Current Investor. The exercise price of the put is calculatedusing a formula based on an agreed upon multiple of the earnings of GSN with a minimum price of 234 millionU.S. dollars and a maximum price of 288 million U.S. dollars. The portion of the noncontrolling interest that canbe put to Sony is accounted for as redeemable securities because redemption is outside of Sony’s control and isreported in the mezzanine equity section in the consolidated balance sheets at March 31, 2012.
(4) Product warranty liabilities:
The changes in product warranty liability for the fiscal years ended March 31, 2010, 2011 and 2012 are asfollows:
Yen in millions
Fiscal year ended March 31
2010 2011 2012
Balance at beginning of the fiscal year 57,922 50,856 54,940
Additional liabilities for warranties 46,686 48,610 60,073
Settlements (in cash or in kind) (45,218) (36,537) (39,954)
Changes in estimate for pre-existing warranty reserve (7,649) (4,802) (4,397)
Translation adjustment (885) (3,187) (2,802)
Balance at end of the fiscal year 50,856 54,940 67,860
28. Business segment information
The reportable segments presented below are the segments of Sony for which separate financial informationis available and for which operating profit or loss amounts are evaluated regularly by the chief operating decisionmaker (“CODM”) in deciding how to allocate resources and in assessing performance. The CODM does notevaluate segments using discrete asset information. Sony’s CODM is its Chairman, Chief Executive Officer andPresident.
Sony realigned its reportable segments from the first quarter of the fiscal year ended March 31, 2012, toreflect modifications to the organizational structure as of April 1, 2011, primarily repositioning the operations ofthe previously reported Consumer, Professional & Devices (“CPD”) and Networked Products & Services(“NPS”) segments. In connection with this realignment, the operations of the former CPD and NPS segments areincluded in two newly established segments, namely the Consumer Products & Services (“CPS”) segment andthe Professional, Device & Solutions (“PDS”) segment.
The CPS segment includes televisions, home audio and video, digital imaging, personal and mobileproducts, and the game business. The equity results of S-LCD are also included within the CPS segment. ThePDS segment includes professional solutions, semiconductors and components. The Pictures segment is engagedin the development, production and acquisition, manufacture, marketing, distribution and broadcasting of image-based software, including motion picture, home entertainment and television products. The Music segmentincludes SME, SMEJ and a 50% owned U.S. based joint venture in the music publishing business, Sony/ATVMusic Publishing LLC. The Financial Services segment primarily represents individual life insurance andnon-life insurance businesses in the Japanese market, a credit financing business and a bank business in Japan.On February 15, 2012, Sony acquired Ericsson’s 50% equity interest in Sony Ericsson, which changed its nameto Sony Mobile Communications upon becoming a wholly-owned subsidiary of Sony. Accordingly, the SonyEricsson segment that had been presented as a separate segment was renamed the Sony Mobile segment in thefourth quarter. The Sony Mobile segment includes Sony’s equity in net income (loss) of Sony Ericsson through
F-94
SONY CORPORATION AND CONSOLIDATED SUBSIDIARIES
February 15, 2012 and sales, operating revenue and operating income (loss) from February 16, 2012 throughMarch 31, 2012, as well as a gain of 102,331 million yen recorded on the remeasurement of Sony’s 50% equityinterest in Sony Ericsson at fair value upon obtaining control through the acquisition of Ericsson’s 50% equityinterest in Sony Ericsson. Refer to Note 24. All Other consists of various operating activities, including a mobilephone OEM business in Japan, So-net Entertainment Corporation, an Internet-related service business subsidiaryoperating mainly in Japan and the disc manufacturing business. Sony’s products and services are generallyunique to a single operating segment. In connection with the realignment, all prior period amounts in the segmentdisclosures have been restated to conform to the current fiscal year’s presentation.
F-95
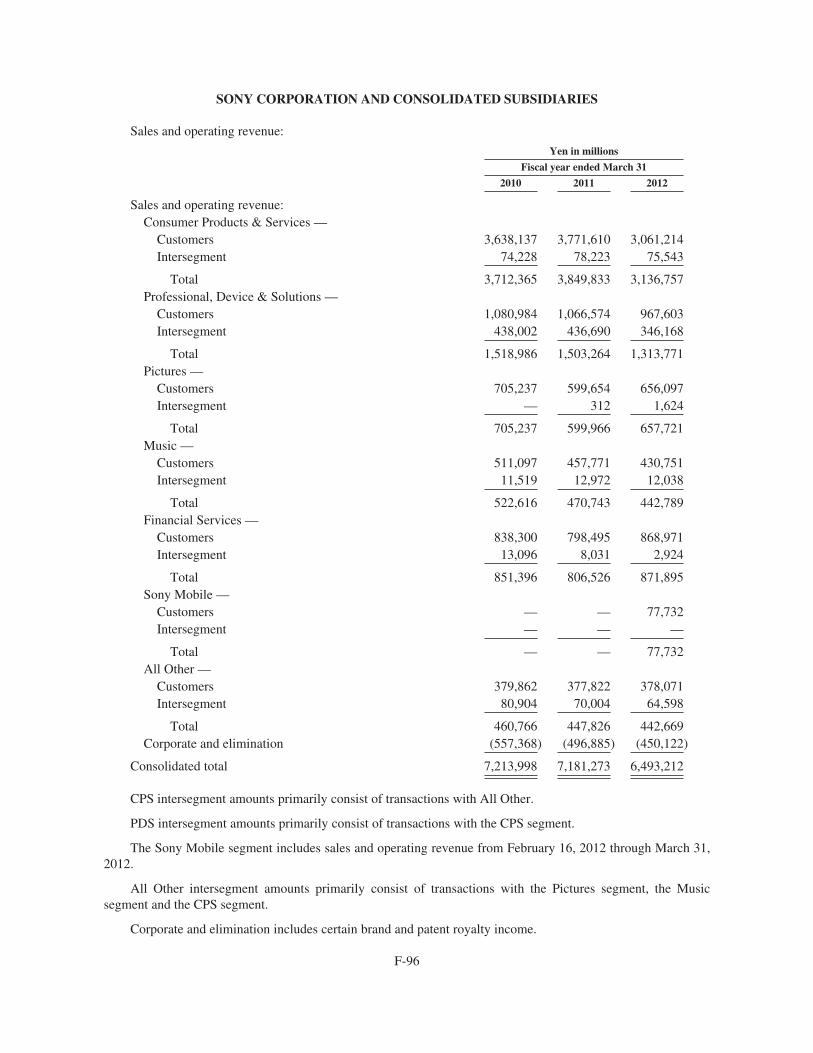
SONY CORPORATION AND CONSOLIDATED SUBSIDIARIES
Sales and operating revenue:
Yen in millions
Fiscal year ended March 31
2010 2011 2012
Sales and operating revenue:Consumer Products & Services —
Customers 3,638,137 3,771,610 3,061,214Intersegment 74,228 78,223 75,543
Total 3,712,365 3,849,833 3,136,757Professional, Device & Solutions —
Customers 1,080,984 1,066,574 967,603Intersegment 438,002 436,690 346,168
Total 1,518,986 1,503,264 1,313,771Pictures —
Customers 705,237 599,654 656,097Intersegment — 312 1,624
Total 705,237 599,966 657,721Music —
Customers 511,097 457,771 430,751Intersegment 11,519 12,972 12,038
Total 522,616 470,743 442,789Financial Services —
Customers 838,300 798,495 868,971Intersegment 13,096 8,031 2,924
Total 851,396 806,526 871,895Sony Mobile —
Customers — — 77,732Intersegment — — —
Total — — 77,732All Other —
Customers 379,862 377,822 378,071Intersegment 80,904 70,004 64,598
Total 460,766 447,826 442,669Corporate and elimination (557,368) (496,885) (450,122)
Consolidated total 7,213,998 7,181,273 6,493,212
CPS intersegment amounts primarily consist of transactions with All Other.
PDS intersegment amounts primarily consist of transactions with the CPS segment.
The Sony Mobile segment includes sales and operating revenue from February 16, 2012 through March 31,2012.
All Other intersegment amounts primarily consist of transactions with the Pictures segment, the Musicsegment and the CPS segment.
Corporate and elimination includes certain brand and patent royalty income.
F-96
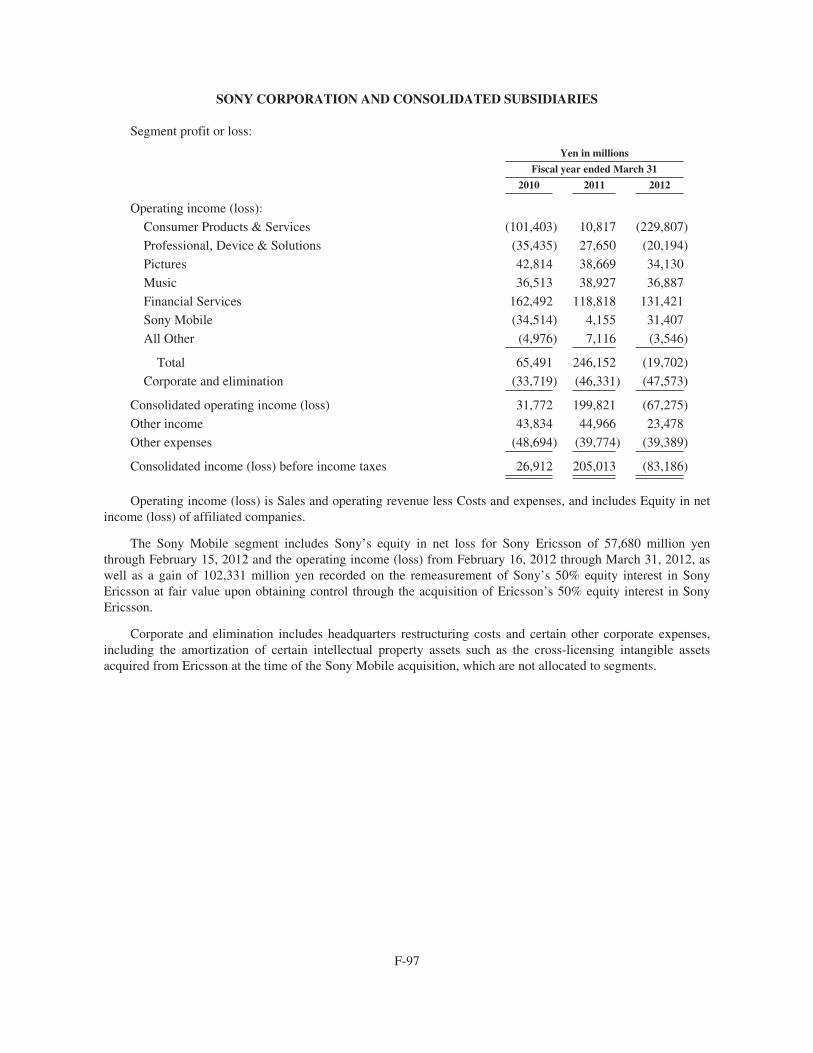
SONY CORPORATION AND CONSOLIDATED SUBSIDIARIES
Segment profit or loss:
Yen in millions
Fiscal year ended March 31
2010 2011 2012
Operating income (loss):
Consumer Products & Services (101,403) 10,817 (229,807)
Professional, Device & Solutions (35,435) 27,650 (20,194)
Pictures 42,814 38,669 34,130
Music 36,513 38,927 36,887
Financial Services 162,492 118,818 131,421
Sony Mobile (34,514) 4,155 31,407
All Other (4,976) 7,116 (3,546)
Total 65,491 246,152 (19,702)
Corporate and elimination (33,719) (46,331) (47,573)
Consolidated operating income (loss) 31,772 199,821 (67,275)
Other income 43,834 44,966 23,478
Other expenses (48,694) (39,774) (39,389)
Consolidated income (loss) before income taxes 26,912 205,013 (83,186)
Operating income (loss) is Sales and operating revenue less Costs and expenses, and includes Equity in netincome (loss) of affiliated companies.
The Sony Mobile segment includes Sony’s equity in net loss for Sony Ericsson of 57,680 million yenthrough February 15, 2012 and the operating income (loss) from February 16, 2012 through March 31, 2012, aswell as a gain of 102,331 million yen recorded on the remeasurement of Sony’s 50% equity interest in SonyEricsson at fair value upon obtaining control through the acquisition of Ericsson’s 50% equity interest in SonyEricsson.
Corporate and elimination includes headquarters restructuring costs and certain other corporate expenses,including the amortization of certain intellectual property assets such as the cross-licensing intangible assetsacquired from Ericsson at the time of the Sony Mobile acquisition, which are not allocated to segments.
F-97
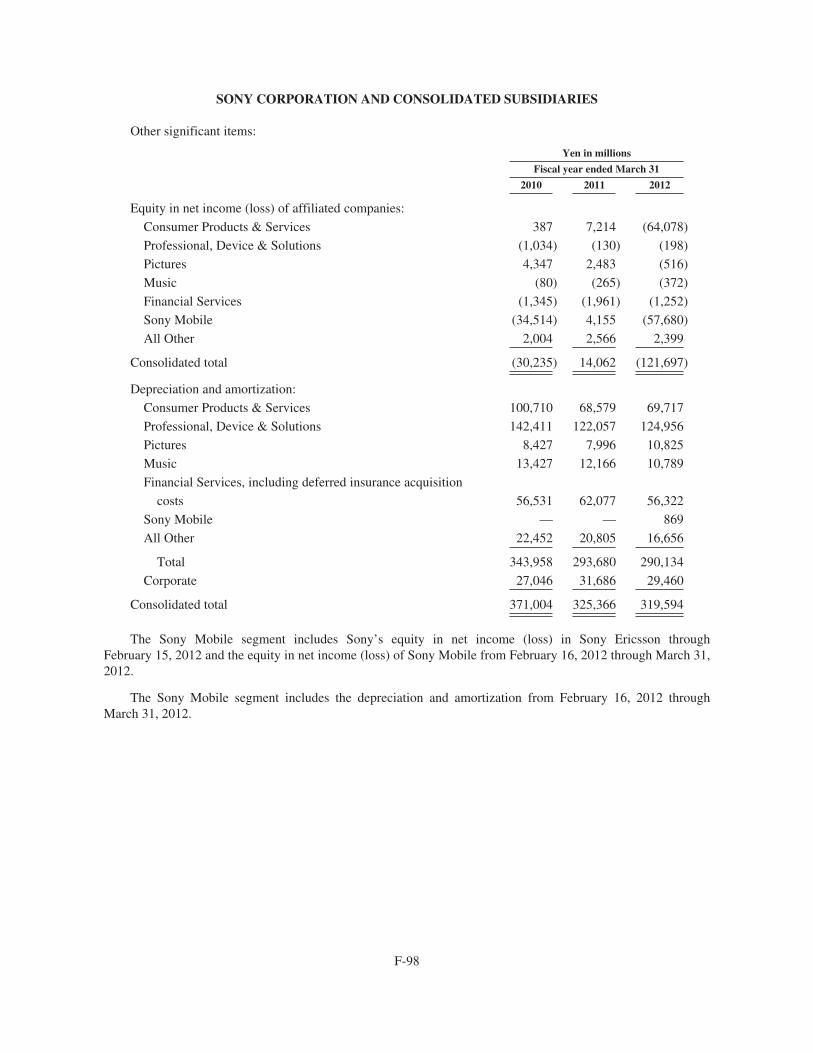
SONY CORPORATION AND CONSOLIDATED SUBSIDIARIES
Other significant items:
Yen in millions
Fiscal year ended March 31
2010 2011 2012
Equity in net income (loss) of affiliated companies:
Consumer Products & Services 387 7,214 (64,078)
Professional, Device & Solutions (1,034) (130) (198)
Pictures 4,347 2,483 (516)
Music (80) (265) (372)
Financial Services (1,345) (1,961) (1,252)
Sony Mobile (34,514) 4,155 (57,680)
All Other 2,004 2,566 2,399
Consolidated total (30,235) 14,062 (121,697)
Depreciation and amortization:
Consumer Products & Services 100,710 68,579 69,717
Professional, Device & Solutions 142,411 122,057 124,956
Pictures 8,427 7,996 10,825
Music 13,427 12,166 10,789
Financial Services, including deferred insurance acquisition
costs 56,531 62,077 56,322
Sony Mobile — — 869
All Other 22,452 20,805 16,656
Total 343,958 293,680 290,134
Corporate 27,046 31,686 29,460
Consolidated total 371,004 325,366 319,594
The Sony Mobile segment includes Sony’s equity in net income (loss) in Sony Ericsson throughFebruary 15, 2012 and the equity in net income (loss) of Sony Mobile from February 16, 2012 through March 31,2012.
The Sony Mobile segment includes the depreciation and amortization from February 16, 2012 throughMarch 31, 2012.
F-98
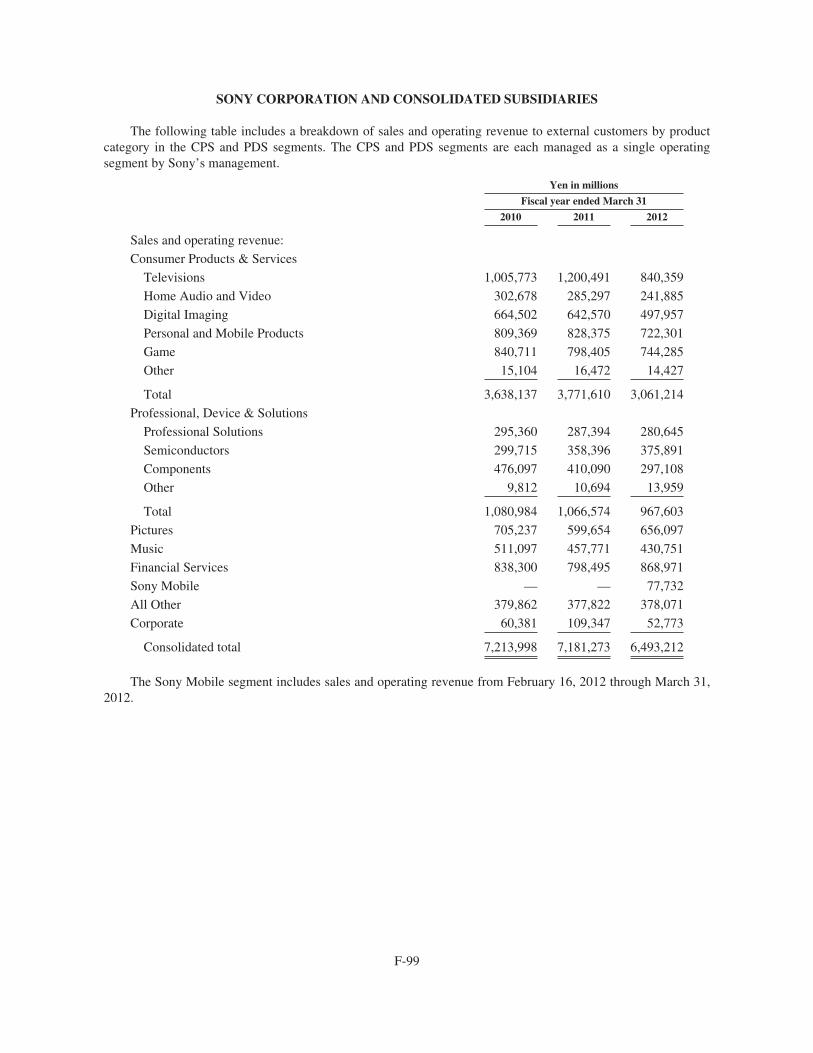
SONY CORPORATION AND CONSOLIDATED SUBSIDIARIES
The following table includes a breakdown of sales and operating revenue to external customers by productcategory in the CPS and PDS segments. The CPS and PDS segments are each managed as a single operatingsegment by Sony’s management.
Yen in millions
Fiscal year ended March 31
2010 2011 2012
Sales and operating revenue:
Consumer Products & Services
Televisions 1,005,773 1,200,491 840,359
Home Audio and Video 302,678 285,297 241,885
Digital Imaging 664,502 642,570 497,957
Personal and Mobile Products 809,369 828,375 722,301
Game 840,711 798,405 744,285
Other 15,104 16,472 14,427
Total 3,638,137 3,771,610 3,061,214
Professional, Device & Solutions
Professional Solutions 295,360 287,394 280,645
Semiconductors 299,715 358,396 375,891
Components 476,097 410,090 297,108
Other 9,812 10,694 13,959
Total 1,080,984 1,066,574 967,603
Pictures 705,237 599,654 656,097
Music 511,097 457,771 430,751
Financial Services 838,300 798,495 868,971
Sony Mobile — — 77,732
All Other 379,862 377,822 378,071
Corporate 60,381 109,347 52,773
Consolidated total 7,213,998 7,181,273 6,493,212
The Sony Mobile segment includes sales and operating revenue from February 16, 2012 through March 31,2012.
F-99
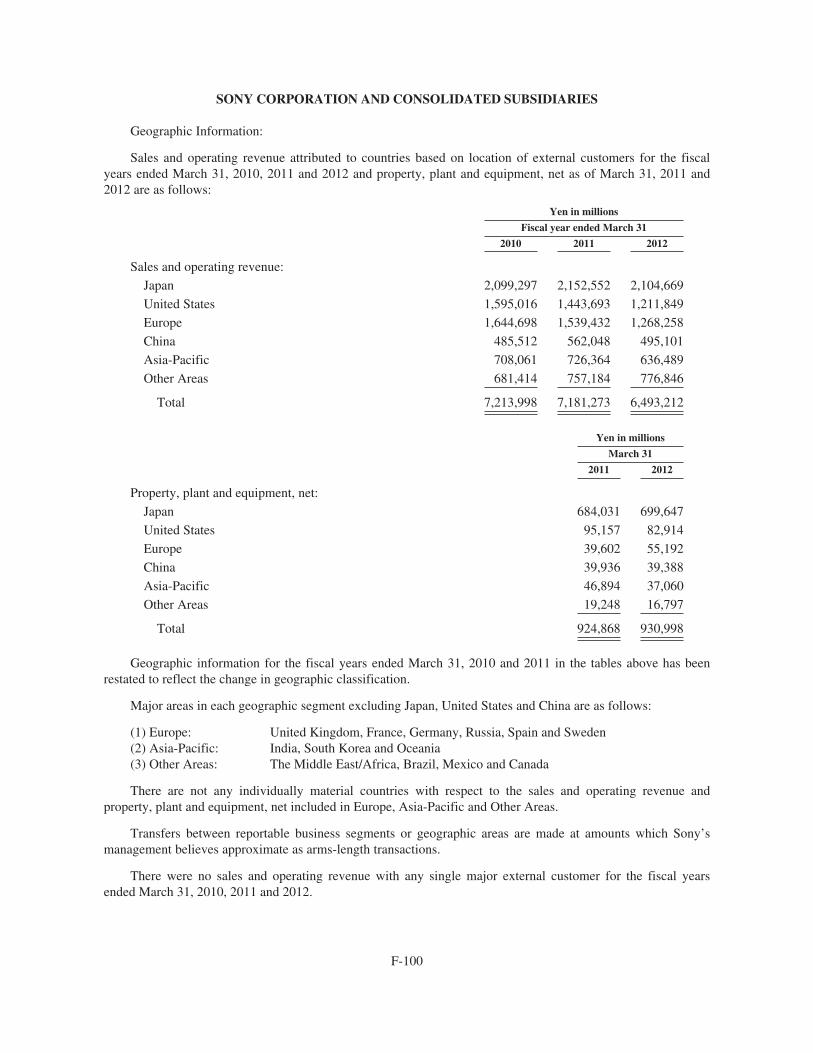
SONY CORPORATION AND CONSOLIDATED SUBSIDIARIES
Geographic Information:
Sales and operating revenue attributed to countries based on location of external customers for the fiscalyears ended March 31, 2010, 2011 and 2012 and property, plant and equipment, net as of March 31, 2011 and2012 are as follows:
Yen in millions
Fiscal year ended March 31
2010 2011 2012
Sales and operating revenue:
Japan 2,099,297 2,152,552 2,104,669
United States 1,595,016 1,443,693 1,211,849
Europe 1,644,698 1,539,432 1,268,258
China 485,512 562,048 495,101
Asia-Pacific 708,061 726,364 636,489
Other Areas 681,414 757,184 776,846
Total 7,213,998 7,181,273 6,493,212
Yen in millions
March 31
2011 2012
Property, plant and equipment, net:
Japan 684,031 699,647
United States 95,157 82,914
Europe 39,602 55,192
China 39,936 39,388
Asia-Pacific 46,894 37,060
Other Areas 19,248 16,797
Total 924,868 930,998
Geographic information for the fiscal years ended March 31, 2010 and 2011 in the tables above has beenrestated to reflect the change in geographic classification.
Major areas in each geographic segment excluding Japan, United States and China are as follows:
(1) Europe: United Kingdom, France, Germany, Russia, Spain and Sweden(2) Asia-Pacific: India, South Korea and Oceania(3) Other Areas: The Middle East/Africa, Brazil, Mexico and Canada
There are not any individually material countries with respect to the sales and operating revenue andproperty, plant and equipment, net included in Europe, Asia-Pacific and Other Areas.
Transfers between reportable business segments or geographic areas are made at amounts which Sony’smanagement believes approximate as arms-length transactions.
There were no sales and operating revenue with any single major external customer for the fiscal yearsended March 31, 2010, 2011 and 2012.
F-100
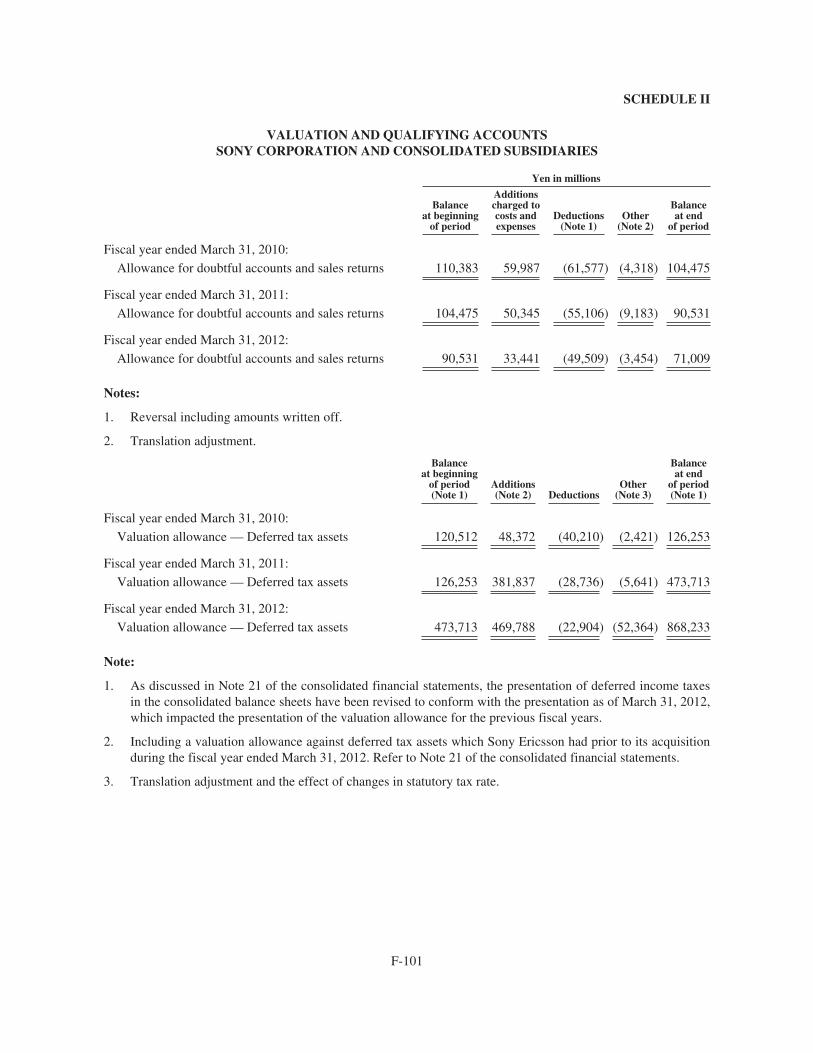
SCHEDULE II
VALUATION AND QUALIFYING ACCOUNTSSONY CORPORATION AND CONSOLIDATED SUBSIDIARIES
Yen in millions
Balanceat beginning
of period
Additionscharged tocosts andexpenses
Deductions(Note 1)
Other(Note 2)
Balanceat end
of period
Fiscal year ended March 31, 2010:
Allowance for doubtful accounts and sales returns 110,383 59,987 (61,577) (4,318) 104,475
Fiscal year ended March 31, 2011:
Allowance for doubtful accounts and sales returns 104,475 50,345 (55,106) (9,183) 90,531
Fiscal year ended March 31, 2012:
Allowance for doubtful accounts and sales returns 90,531 33,441 (49,509) (3,454) 71,009
Notes:
1. Reversal including amounts written off.
2. Translation adjustment.
Balanceat beginning
of period(Note 1)
Additions(Note 2) Deductions
Other(Note 3)
Balanceat end
of period(Note 1)
Fiscal year ended March 31, 2010:
Valuation allowance — Deferred tax assets 120,512 48,372 (40,210) (2,421) 126,253
Fiscal year ended March 31, 2011:
Valuation allowance — Deferred tax assets 126,253 381,837 (28,736) (5,641) 473,713
Fiscal year ended March 31, 2012:
Valuation allowance — Deferred tax assets 473,713 469,788 (22,904) (52,364) 868,233
Note:
1. As discussed in Note 21 of the consolidated financial statements, the presentation of deferred income taxesin the consolidated balance sheets have been revised to conform with the presentation as of March 31, 2012,which impacted the presentation of the valuation allowance for the previous fiscal years.
2. Including a valuation allowance against deferred tax assets which Sony Ericsson had prior to its acquisitionduring the fiscal year ended March 31, 2012. Refer to Note 21 of the consolidated financial statements.
3. Translation adjustment and the effect of changes in statutory tax rate.
F-101
[THIS PAGE IS INTENTIONALLY LEFT BLANK]

SONY MOBILE COMMUNICATIONS
Consolidated Financial Statements of Sony Mobile Communications AB
A-1

[THIS PAGE IS INTENTIONALLY LEFT BLANK]
A-2

SONY MOBILE COMMUNICATIONS
Table of contents
Consolidated Income Statements . . . . . . . . . . . . . . . . . . . . . . . . . . . . . . . . . . . . . . . . . . . . . . . . . . . . . . . . . . . A-4
Consolidated Balance Sheets . . . . . . . . . . . . . . . . . . . . . . . . . . . . . . . . . . . . . . . . . . . . . . . . . . . . . . . . . . . . . . A-5
Consolidated Cash Flow . . . . . . . . . . . . . . . . . . . . . . . . . . . . . . . . . . . . . . . . . . . . . . . . . . . . . . . . . . . . . . . . . . A-6
Notes to the Consolidated Financial Statements . . . . . . . . . . . . . . . . . . . . . . . . . . . . . . . . . . . . . . . . . . . . . . . . A-7
A-3
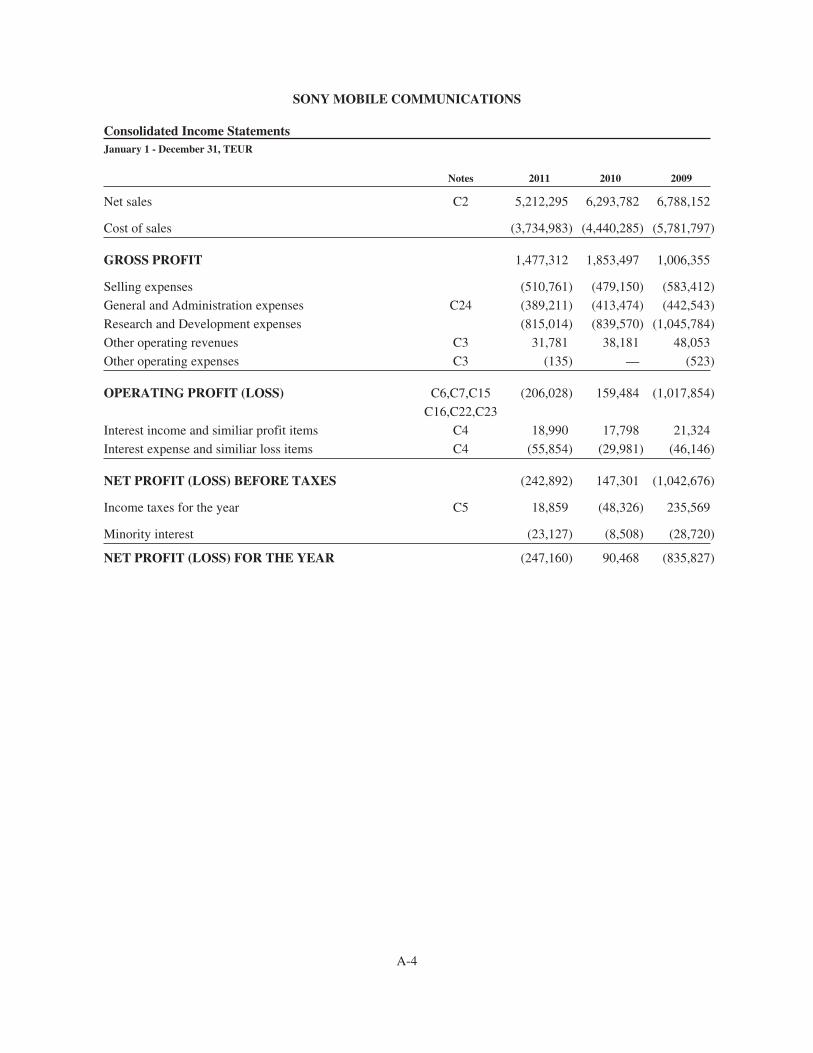
SONY MOBILE COMMUNICATIONS
Consolidated Income StatementsJanuary 1 - December 31, TEUR
Notes 2011 2010 2009
Net sales C2 5,212,295 6,293,782 6,788,152
Cost of sales (3,734,983) (4,440,285) (5,781,797)
GROSS PROFIT 1,477,312 1,853,497 1,006,355
Selling expenses (510,761) (479,150) (583,412)
General and Administration expenses C24 (389,211) (413,474) (442,543)
Research and Development expenses (815,014) (839,570) (1,045,784)
Other operating revenues C3 31,781 38,181 48,053
Other operating expenses C3 (135) — (523)
OPERATING PROFIT (LOSS) C6,C7,C15
C16,C22,C23
(206,028) 159,484 (1,017,854)
Interest income and similiar profit items C4 18,990 17,798 21,324
Interest expense and similiar loss items C4 (55,854) (29,981) (46,146)
NET PROFIT (LOSS) BEFORE TAXES (242,892) 147,301 (1,042,676)
Income taxes for the year C5 18,859 (48,326) 235,569
Minority interest (23,127) (8,508) (28,720)
NET PROFIT (LOSS) FOR THE YEAR (247,160) 90,468 (835,827)
A-4
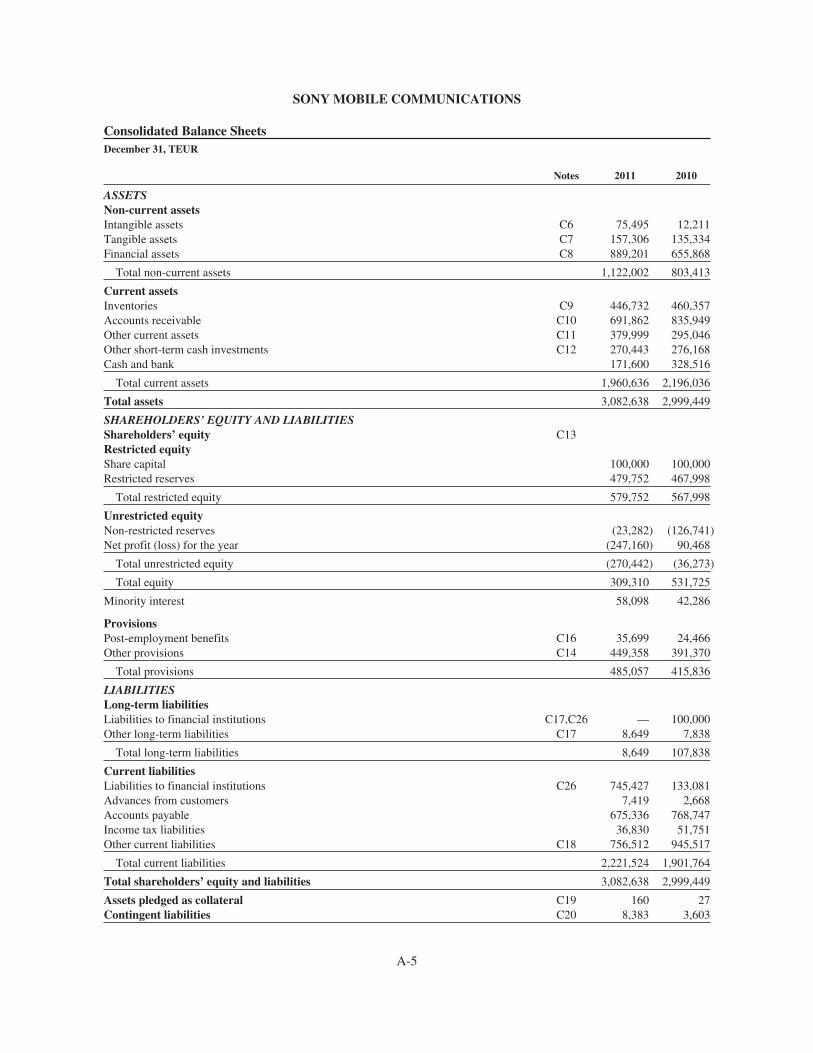
SONY MOBILE COMMUNICATIONS
Consolidated Balance SheetsDecember 31, TEUR
Notes 2011 2010
ASSETSNon-current assetsIntangible assets C6 75,495 12,211Tangible assets C7 157,306 135,334Financial assets C8 889,201 655,868
Total non-current assets 1,122,002 803,413
Current assetsInventories C9 446,732 460,357Accounts receivable C10 691,862 835,949Other current assets C11 379,999 295,046Other short-term cash investments C12 270,443 276,168Cash and bank 171,600 328,516
Total current assets 1,960,636 2,196,036
Total assets 3,082,638 2,999,449
SHAREHOLDERS’ EQUITY AND LIABILITIESShareholders’ equity C13Restricted equityShare capital 100,000 100,000Restricted reserves 479,752 467,998
Total restricted equity 579,752 567,998
Unrestricted equityNon-restricted reserves (23,282) (126,741)Net profit (loss) for the year (247,160) 90,468
Total unrestricted equity (270,442) (36,273)
Total equity 309,310 531,725
Minority interest 58,098 42,286
ProvisionsPost-employment benefits C16 35,699 24,466Other provisions C14 449,358 391,370
Total provisions 485,057 415,836
LIABILITIESLong-term liabilitiesLiabilities to financial institutions C17,C26 — 100,000Other long-term liabilities C17 8,649 7,838
Total long-term liabilities 8,649 107,838
Current liabilitiesLiabilities to financial institutions C26 745,427 133,081Advances from customers 7,419 2,668Accounts payable 675,336 768,747Income tax liabilities 36,830 51,751Other current liabilities C18 756,512 945,517
Total current liabilities 2,221,524 1,901,764
Total shareholders’ equity and liabilities 3,082,638 2,999,449
Assets pledged as collateral C19 160 27Contingent liabilities C20 8,383 3,603
A-5
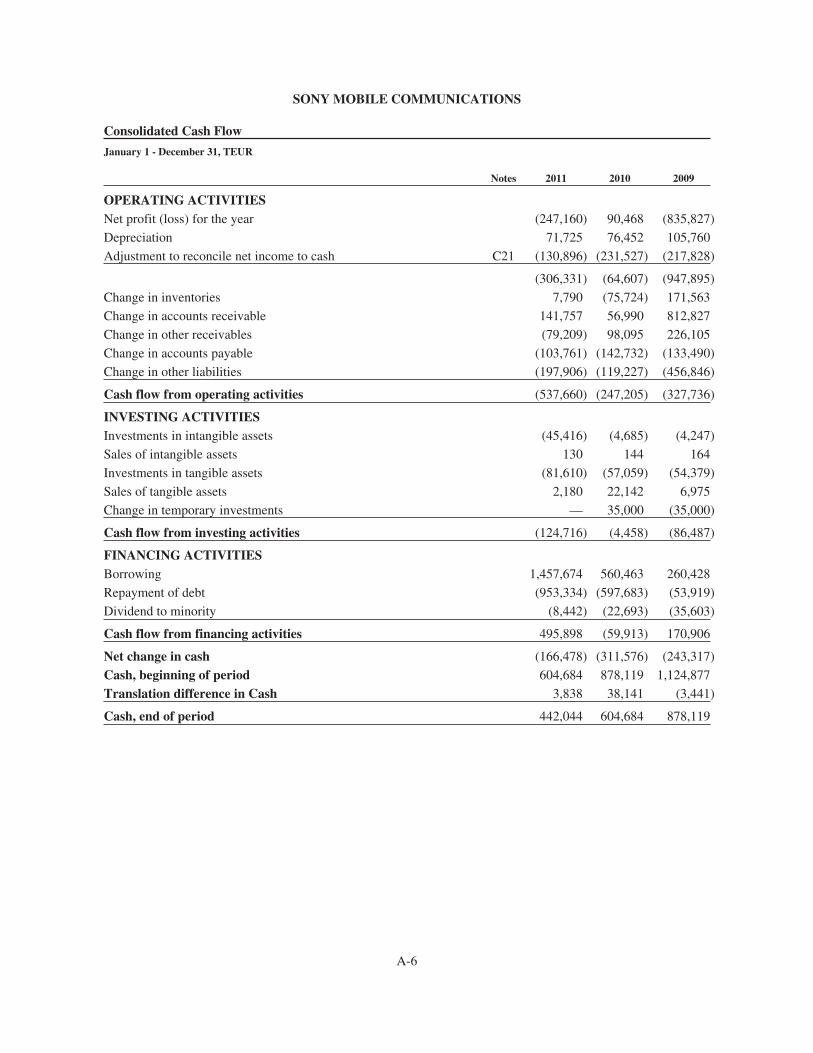
SONY MOBILE COMMUNICATIONS
Consolidated Cash Flow
January 1 - December 31, TEUR
Notes 2011 2010 2009
OPERATING ACTIVITIESNet profit (loss) for the year (247,160) 90,468 (835,827)
Depreciation 71,725 76,452 105,760
Adjustment to reconcile net income to cash C21 (130,896) (231,527) (217,828)
(306,331) (64,607) (947,895)
Change in inventories 7,790 (75,724) 171,563
Change in accounts receivable 141,757 56,990 812,827
Change in other receivables (79,209) 98,095 226,105
Change in accounts payable (103,761) (142,732) (133,490)
Change in other liabilities (197,906) (119,227) (456,846)
Cash flow from operating activities (537,660) (247,205) (327,736)
INVESTING ACTIVITIESInvestments in intangible assets (45,416) (4,685) (4,247)
Sales of intangible assets 130 144 164
Investments in tangible assets (81,610) (57,059) (54,379)
Sales of tangible assets 2,180 22,142 6,975
Change in temporary investments — 35,000 (35,000)
Cash flow from investing activities (124,716) (4,458) (86,487)
FINANCING ACTIVITIESBorrowing 1,457,674 560,463 260,428
Repayment of debt (953,334) (597,683) (53,919)
Dividend to minority (8,442) (22,693) (35,603)
Cash flow from financing activities 495,898 (59,913) 170,906
Net change in cash (166,478) (311,576) (243,317)
Cash, beginning of period 604,684 878,119 1,124,877
Translation difference in Cash 3,838 38,141 (3,441)
Cash, end of period 442,044 604,684 878,119
A-6
SONY MOBILE COMMUNICATIONS
Notes to the Consolidated Financial Statements
ContentsC1. Accounting Principles . . . . . . . . . . . . . . . . . . . . . . . . . . . . . . . . . . . . . . . . . . . . . . . . . . . . . . . . . . . . . A-8
C2. Net sales by market area . . . . . . . . . . . . . . . . . . . . . . . . . . . . . . . . . . . . . . . . . . . . . . . . . . . . . . . . . . . A-12
C3. Other operating revenues and other operating expenses . . . . . . . . . . . . . . . . . . . . . . . . . . . . . . . . . . . A-13
C4. Financial income and expenses . . . . . . . . . . . . . . . . . . . . . . . . . . . . . . . . . . . . . . . . . . . . . . . . . . . . . . A-13
C5. Taxes . . . . . . . . . . . . . . . . . . . . . . . . . . . . . . . . . . . . . . . . . . . . . . . . . . . . . . . . . . . . . . . . . . . . . . . . . . A-13
C6. Intangible assets . . . . . . . . . . . . . . . . . . . . . . . . . . . . . . . . . . . . . . . . . . . . . . . . . . . . . . . . . . . . . . . . . A-15
C7. Tangible assets . . . . . . . . . . . . . . . . . . . . . . . . . . . . . . . . . . . . . . . . . . . . . . . . . . . . . . . . . . . . . . . . . . A-16
C8. Financial assets . . . . . . . . . . . . . . . . . . . . . . . . . . . . . . . . . . . . . . . . . . . . . . . . . . . . . . . . . . . . . . . . . . A-17
C9. Inventory . . . . . . . . . . . . . . . . . . . . . . . . . . . . . . . . . . . . . . . . . . . . . . . . . . . . . . . . . . . . . . . . . . . . . . . A-17
C10. Accounts receivable . . . . . . . . . . . . . . . . . . . . . . . . . . . . . . . . . . . . . . . . . . . . . . . . . . . . . . . . . . . . . . A-17
C11. Other current assets . . . . . . . . . . . . . . . . . . . . . . . . . . . . . . . . . . . . . . . . . . . . . . . . . . . . . . . . . . . . . . . A-17
C12. Short term cash investments . . . . . . . . . . . . . . . . . . . . . . . . . . . . . . . . . . . . . . . . . . . . . . . . . . . . . . . . A-17
C13. Shareholders’ equity . . . . . . . . . . . . . . . . . . . . . . . . . . . . . . . . . . . . . . . . . . . . . . . . . . . . . . . . . . . . . . A-18
C14. Provisions . . . . . . . . . . . . . . . . . . . . . . . . . . . . . . . . . . . . . . . . . . . . . . . . . . . . . . . . . . . . . . . . . . . . . . A-18
C15. Restructuring costs . . . . . . . . . . . . . . . . . . . . . . . . . . . . . . . . . . . . . . . . . . . . . . . . . . . . . . . . . . . . . . . A-19
C16. Post-employment benefits . . . . . . . . . . . . . . . . . . . . . . . . . . . . . . . . . . . . . . . . . . . . . . . . . . . . . . . . . . A-19
C17. Long-term liabilities . . . . . . . . . . . . . . . . . . . . . . . . . . . . . . . . . . . . . . . . . . . . . . . . . . . . . . . . . . . . . . A-20
C18. Other current liabilities . . . . . . . . . . . . . . . . . . . . . . . . . . . . . . . . . . . . . . . . . . . . . . . . . . . . . . . . . . . . A-20
C19. Assets pledged as collateral . . . . . . . . . . . . . . . . . . . . . . . . . . . . . . . . . . . . . . . . . . . . . . . . . . . . . . . . . A-21
C20. Contingent liabilities . . . . . . . . . . . . . . . . . . . . . . . . . . . . . . . . . . . . . . . . . . . . . . . . . . . . . . . . . . . . . . A-21
C21. Adjustments to reconcile net income to cash . . . . . . . . . . . . . . . . . . . . . . . . . . . . . . . . . . . . . . . . . . . A-21
C22. Leasing . . . . . . . . . . . . . . . . . . . . . . . . . . . . . . . . . . . . . . . . . . . . . . . . . . . . . . . . . . . . . . . . . . . . . . . . A-21
C23. Wages, salaries and social security expenses . . . . . . . . . . . . . . . . . . . . . . . . . . . . . . . . . . . . . . . . . . . A-22
C24. Fees to auditors . . . . . . . . . . . . . . . . . . . . . . . . . . . . . . . . . . . . . . . . . . . . . . . . . . . . . . . . . . . . . . . . . . A-23
C25. Financial risks . . . . . . . . . . . . . . . . . . . . . . . . . . . . . . . . . . . . . . . . . . . . . . . . . . . . . . . . . . . . . . . . . . . A-23
C26. Liabilities to financial institutions . . . . . . . . . . . . . . . . . . . . . . . . . . . . . . . . . . . . . . . . . . . . . . . . . . . . A-24
C27. Group companies . . . . . . . . . . . . . . . . . . . . . . . . . . . . . . . . . . . . . . . . . . . . . . . . . . . . . . . . . . . . . . . . . A-25
C28. Post-closing events . . . . . . . . . . . . . . . . . . . . . . . . . . . . . . . . . . . . . . . . . . . . . . . . . . . . . . . . . . . . . . . A-25
C29. Reconciliation to accounting principles generally accepted in the United States . . . . . . . . . . . . . . . . A-25
A-7
SONY MOBILE COMMUNICATIONS
C1. Accounting Principles
The consolidated financial statements of Sony Mobile Communications AB and its subsidiaries are preparedin accordance with accounting principles generally accepted in Sweden, applying the Swedish Annual AccountsAct (ÅRL), the Swedish Accounting Standards Board’s recommendations (Bokföringsnämnden, BFN) and theRecommendation of the Swedish Financial Accounting Standards Council, RR 29 Remunerations to employees.The accounting principles are unchanged since last year. Figures in parentheses in the disclosures refer to 2010.
During 2011 Sony Mobile Communications was a joint venture between Sony Corporation (“Sony”) andTelefonaktiebolaget LM Ericsson (“Ericsson”). In October 2011, Sony agreed with Ericsson to acquireEricsson’s 50 percent equity interest in Sony Mobile Communications, making the joint venture a wholly-ownedsubsidiary of Sony. The equity transaction was completed in February 2012 and the company’s name waschanged from Sony Ericsson Mobile Communications AB to Sony Mobile Communications AB.
Principle of Consolidation
The consolidated financial statements include the accounts of the Parent Company and all subsidiaries inwhich the company has a voting majority. The intercompany transactions and internal profit have beeneliminated. The consolidated financial statements have been prepared in accordance with the purchase method,whereby consolidated stockholders’ equity includes equity earned only after acquisition. Minority interest in netearnings is reported in the consolidated income statement. Minority interest in the equity of subsidiaries isreported as a separate item in the consolidated balance sheet.
Translation of financial statements in foreign currency
Sony Mobile Communications’ results are presented in EUR which is the reporting currency and thefunctional currency of the parent company. The group has sales and cost of sales in a large number of currencies.For all companies, including subsidiary companies, the functional (business) currency is the currency in whichthe companies primarily generate and expend cash. Their financial statements plus goodwill related to suchcompanies are translated to EUR by translating assets and liabilities at the closing rate on the balance sheet dayand income statement items at average exchange rates, during the year, with translation adjustments reporteddirectly in consolidated equity.
Revenue recognition
Sales revenue is recorded upon the delivery of products according to contractual terms and representsamounts realized, excluding value-added tax, and is net of goods expected to be returned, trade discounts andallowances. Sales revenue is recognized with reference to all significant contractual terms when the product hasbeen delivered, when the revenue amount is fixed or determinable and when collection is reasonably assured.
Accruals for sales bonuses and similar items such as quarterly and yearly bonuses, quality bonus, co-opadvertising and stock protection are shown as deductions from gross sales to arrive at net sales.
For product and equipment sales, revenue recognition generally does not occur until the products orequipment have been shipped, risk of loss has transferred to the customer, and objective evidence exists thatcustomer acceptance provisions, if any, have been met. The Company records revenue when allowances fordiscounts, price protection, returns and customer incentives can be reliably estimated. Recorded revenues arereduced by these allowances. The Company bases its estimates on historical experience taking into considerationthe type of products sold, the type of customer, and the type of transaction specific in each arrangement.
Costs related to shipping and handlings are included in cost of sales in the Consolidated Income Statement.
A-8
SONY MOBILE COMMUNICATIONS
Research and development costs
Research and development costs are charged to expenses as incurred. Expenses related to the third partydevelopment of new platforms for mobile phones are capitalized as other non-current asset and are amortizedwhen the platforms are put into commercial use. Such costs are capitalized as intangible assets whentechnological feasibility has been established and when future economic benefits can be demonstrated.
Hedge accounting
The Group applies hedge accounting, by electing the fair value option in accordance with the SwedishAnnual Accounts Act 4:14, for financial instruments intended to hedge foreign currency exposures having afuture impact on results.
At the point in time at which the contract is established, the relationship between the hedging instrument andthe hedged item is documented, as well as the purpose of this risk management and the strategy for takingvarious hedging measures. The company also documents its assessment, both when the contract is entered intoand on an ongoing basis, as to whether the derivative used in the hedging transaction is effective in counteractingchanges in fair value or income statement effects, in terms of the hedged items in question.
The hedging is designed in such a manner as to ensure, to the greatest degree possible, its effectiveness. Thechanges in fair value for those derivative instruments which do not meet the conditions for hedge accounting arereported directly in the income statement.
Future foreign currency exposures are hedged primarily by forward cover agreements but also via currencyoptions. The effective portion of changes in the fair value of hedging instruments is recognized in equity. Anygain or loss relating to the ineffective portion is recognized in the income statement. Amounts accumulated inequity are recycled in the income statement in the periods in which the hedged item affects profit or loss, forexample, when the forecasted sale which is hedged takes place.
Intangible and tangible fixed assets
Intangible and tangible fixed assets are stated at cost less accumulated depreciation and impairment lossesas well as write-ups. Annual depreciation is reported as plan depreciation, generally using the straight linemethod with estimated useful lives ranging from 3 years up to 10 years for machineries and equipments.Intangible assets are amortized over a period ranging from 3 years up to 5 years or based on the contract’seconomic reality. Land improvements are amortized over 20 years. The costs of computer software developed orobtained for internal use are capitalized as intangible assets when technological feasibility has been establishedand when future economic benefits can be demonstrated.
Tooling
Tooling owned by Sony Mobile Communications but used in its manufacturing partners operations iscapitalized and amortized over the useful life of the tools.
Financial assets
Financial assets that are intended for long-term holding are accounted at acquisition value and impairment ismade if a permanent decrease in the value can be stated. These assets include strategic long-term investments inprivate companies over which Sony Mobile Communications does not have the ability to exercise significantinfluence.
A-9
SONY MOBILE COMMUNICATIONS
Impairment test of assets
Impairment tests are performed on a regular basis whenever there is an indication of possible impairment.An impairment loss is determined based on the amount by which the carrying value exceeds the fair value ofthose assets.
Leases
Leases on terms in which Sony Mobile Communications assumes substantially all the risks and rewards ofownership are classified as finance leases, i.e. the leased object is recognized as a non-current asset and the futureobligations for lease payments are recognized as current and non-current liabilities in the Balance Sheet. Uponinitial recognition, the leased asset is measured at an amount equal to the lower of its fair value and the presentvalue of the minimum lease payments. Subsequent to initial recognition, the asset is accounted for in accordancewith the accounting policy applicable to that asset, although the depreciation period would not exceed the leaseterm.
Leasing agreements which are not classified as financial leases are classified as operational leases, and theleased assets under such contracts are not recognized in the balance sheet. Costs under operating leases arerecognized in the Income Statement on a straight-line base over the term of the lease. Lease incentives receivedare recognized as an integral part of the total lease expense, over the term of the lease. Sony MobileCommunications has not identified any material financial leases for the reported periods.
Income tax
Reported income tax includes tax, which is to be paid or received, regarding the current year, adjustmentsconcerning the previous years’ current taxes and changes in deferred taxes.
All income tax liabilities and receivables are valued at their nominal amount according to the tax regulationsand are measured at the tax rate that is expected to be applied to the temporary differences when they arereversed, based on the tax laws that have been enacted or substantively enacted by the reporting date. Anadjustment of deferred tax asset/liability balances due to a change in the tax rate is recognized in the incomestatement unless it relates to a temporary difference earlier recognized directly in equity, in which case theadjustment is also recognized in equity.
In the case of items reported in the income statement, the related tax effects are also reported in the incomestatement. The tax effects of items that are accounted for directly against equity are also reported directly againstequity.
Deferred tax is calculated according to the balance sheet method on all temporary differences arisingbetween the reported value and the tax value of the assets and liabilities.
Deferred tax assets are recognized to the extent that is likely that future taxable profit will be available,against which the temporary difference can be utilized.
Receivables
Receivables with maturities greater than 12 months after balance sheet date are reported as fixed assets, andother receivables as current assets. Receivables are reported in the amounts at which they are expected to bereceived, on the basis of individual assessment.
Accounts Receivable
Accounts receivable are reported as current assets in the amounts at which they are expected to be receivednet of individual bad debt assessment.
A-10
SONY MOBILE COMMUNICATIONS
Inventories
Inventories, which include the cost of materials, labor and overheads, are measured at the lower of cost ornet realizable value on a first-in, first-out (FIFO) basis. Risk of obsolescence has been measured by estimatingmarket value based on future customer demand and customer acceptance of new products.
Borrowings
Borrowings are reported initially at fair value, net of transaction costs incurred. If the reported amountdiffers from the amount to be repaid at maturity date, then the difference is allocated as interest expense orinterest income over the tenor of the loan. In this manner, the initial amount reported agrees, at maturity date,with the amount to be repaid.
Financial liabilities first cease to be reported when they have been settled on the basis of repayment or whenrepayment has been waived.
All transactions are reported on settlement date.
Provisions
Provisions are made when there are legal or constructive obligations as a result of past events and when it isprobable that an outflow of resources will be required to settle the obligations and the amounts can be reliablyestimated. However, the actual outflow as a result of the obligation may differ from such estimate.
Warranty provisions include provisions for faulty products based on estimated return rates and costs. Thebest estimate is based on sales, contractual warranty periods and historical failure data of products sold.
Post-employment benefits
The Group has both defined benefit and defined contribution plans.
A defined contribution plan is a pension plan under which the Group pays fixed contributions into a separateentity. The Group has no legal or constructive obligations to pay further contributions. The contributions arerecognized as employee benefit expenses when they are due.
A defined benefit plan is a pension plan that defines an amount of pension benefit that an employee orformer employee will receive on retirement, usually dependent on one or more factors such as age, years ofservice and compensation. The Group is responsible for the fulfillment of the pension obligation.
The schemes are both funded and unfunded.
The liability or receivable recognized in the balance sheet in respect of defined benefit pension plans is thepresent value of the defined benefit obligation at the balance sheet date less the fair value of plan assets,unrecognized actuarial gains and losses and unrecognized past service cost.
Independent actuaries using the Projected Unit Credit Method calculate the defined benefit obligations andexpenses annually. This method indicates that past-service costs are amortized on a straight-line basis over thevesting period. The present value of the defined benefit obligation is determined by discontinuing the estimatedfuture cash outflows using interest rates of high-quality corporate bonds that are denominated in the currency inwhich the benefits will be paid, and that have terms to maturity approximating to the terms of the related pensionliability.
Actuarial gains and losses, arising from experience adjustments and changes in actuarial assumptions, to theextent theses exceed 10% of the pension obligations’ present value or the fair value of plan assets are charged orcredited to income over the employees’ expected average remaining period of service.
A-11
SONY MOBILE COMMUNICATIONS
The principle described above for defined benefit plans is applied in the consolidated financial statements.The Parent Company has pension commitments in Sweden for white collar workers secured through an insurancesolution with the insurance company Alecta. According to a statement issued by the Swedish Financial ReportingBoard (UFR 3), this constitutes a multi-employer plan and should be accounted for as a defined benefit plan, asprescribed in RR 29 and UFR 6. Alecta cannot, however, provide the information required for the accounting of adefined benefit plan, as described in UFR 6. The Alecta plan is therefore accounted for as a defined contributionplan as prescribed in UFR6.
Contingent liabilities
The Group records a Contingent liability when there is a possible obligation arising from past events, andwhose existence will be confirmed only by the occurrence or non-occurrence of one or more uncertain futureevents not wholly within the control of the entity. Contingent liabilities are also reported when there is a presentobligation arising from past events but are not recognized, as it is not probable that an outflow of resourcesembodying economic benefits will be required to settle the obligation, or when the amount of the obligationcannot be measured with sufficient reliability.
Statement of Cash Flow
Foreign subsidiaries’ transactions are translated at the average exchange rate of the period. Subsidiariespurchased and/or sold, net of cash acquired/sold, are reported as cash flow from investment activities and do notaffect reported cash flow from operations. Cash and cash equivalents consist of cash and bank and short termcash investments with a maturity less than three months. Bank deposits with an initial maturity over three monthsare not included in cash and cash equivalents. The statement of Cash Flow for 2009, 2010 and 2011 complieswith International Accounting Standards (IAS) No. 7.
Related party transactions
Transactions and balances related to Sony and Ericsson are classified as external items.
Disposition of earnings
Each year the Board of Directors assesses the parent company and the group’s results and financial positionin order to determine the appropriate disposition of earnings. This disposition, including any payment ofdividends, is based on a number of factors including: the latest profit and loss account, the parent company’sequity, the parent company’s and the group’s cash flows, the equity ratio and liquidity of the parent company andthe group after the proposed dividend in relation to the industry standards in which the parent company and thegroup conducts its business, and both the parent company’s and the group’s ability to fulfill both their short andlong-term obligations. The Board of Directors resolved that the accumulated deficit, EUR -327,246,174, whereofnet loss for the year EUR -215,631,869, will be carried forward.
C2. Net sales by market area
2011 2010 2009
Europe, Middle East & Africa 1,970,358 3,218,638 3,744,278
Americas 664,495 851,203 849,577
Asia Pacific 2,577,442 2,223,941 2,194,297
Total 5,212,295 6,293,782 6,788,152
A-12
SONY MOBILE COMMUNICATIONS
C3. Other operating revenues and other operating expenses
2011 2010 2009
Other operating revenuesGains on sales of intangible and tangible assets 231 4,731 146
Commissions, license fees and other operating 31,550 33,450 47,907
Total other operating revenues 31,781 38,181 48,053
Other operating expensesLosses on sales of intangible and tangible assets (135) — (523)
Total other operating expenses (135) — (523)
C4. Financial income and expenses
2011 2010 2009
Interest income and similar profit itemsInterest income external 14,631 13,498 16,909
Foreign exchange gains 3,193 1,824 2,363
Other financial income 1,166 2,477 2,052
Total 18,990 17,798 21,324
Interest expense and similar loss itemsInterest expenses external (45,568) (25,820) (36,264)
Foreign exchange losses (7,065) (1,935) (2,954)
Other financial expenses (3,221) (2,226) (6,929)
Total (55,854) (29,981) (46,146)
Financial Net (36,864) (12,183) (24,822)
C5. Taxes
Income statement
The following items are included in income taxes for the year:
2011 2010 2009
Current income taxes for the period (205,993) (79,657) (32,075)
Deferred tax income/ (-expense) related to temporary differences
and tax loss carry forwards 224,852 31,331 267,645
Income taxes for the period 18,859 (48,326) 235,569
A-13
SONY MOBILE COMMUNICATIONS
A reconciliation between actual tax income (-expense) for the year and the theoretical tax income (-expense)that would arise when applying statutory tax rate in Sweden, 26.3% on income before taxes is shown in the table:
2011 2010 2009
Income before taxes (242,892) 147,301 (1,042,676)
Tax rate in Sweden, 26.3% 63,881 (38,740) 273,653
Effect of foreign tax rates (14,517) (10,974) (8,938)
Current income taxes related to prior years (16,221) (79) (7,640)
Tax effect of expenses that are non deductible for tax purpose (19,884) (12,336) (16,942)
Tax effect of income that are non-taxable for tax purpose 7,830 13,024 3,619
Tax effect of changes in tax rates (2,230) 779 (7,923)
Change in valuation allowance — — (260)
Income taxes for the year 18,859 (48,326) 235,569
Balance sheet
Tax effect of temporary differences, including tax loss carry forward, has resulted in deferred tax assets asfollows:
2011 2010
Deferred tax assets 853,276 628,687
Deferred tax assets relate to temporary differences due to certain provisions such as warranty and scrapliabilities and tax losses carry forwards. Deferred tax assets are amounts recognized in countries where we expectto be able to generate corresponding taxable income in the future to benefit from tax reductions.
TEUR 694,376 (TEUR 460,650) of the deferred tax assets refers to tax loss carry-forwards and has beentested against future earning capacity. The deferred tax asset is valued at the full amount, given that the companybelieves that there are strong indications that future taxable profits will be available. These indicators include thefuture business plan and expected effects from the change in ownership. The value of the future taxable profitsmay differ with regard to future business environment and earnings capacity or changes in tax law.
The vast majority of the tax loss carry-forwards are related to countries with long or indefinite periods ofutilization, mainly Sweden where there is no limitation in time regarding tax loss carry forward.
A-14
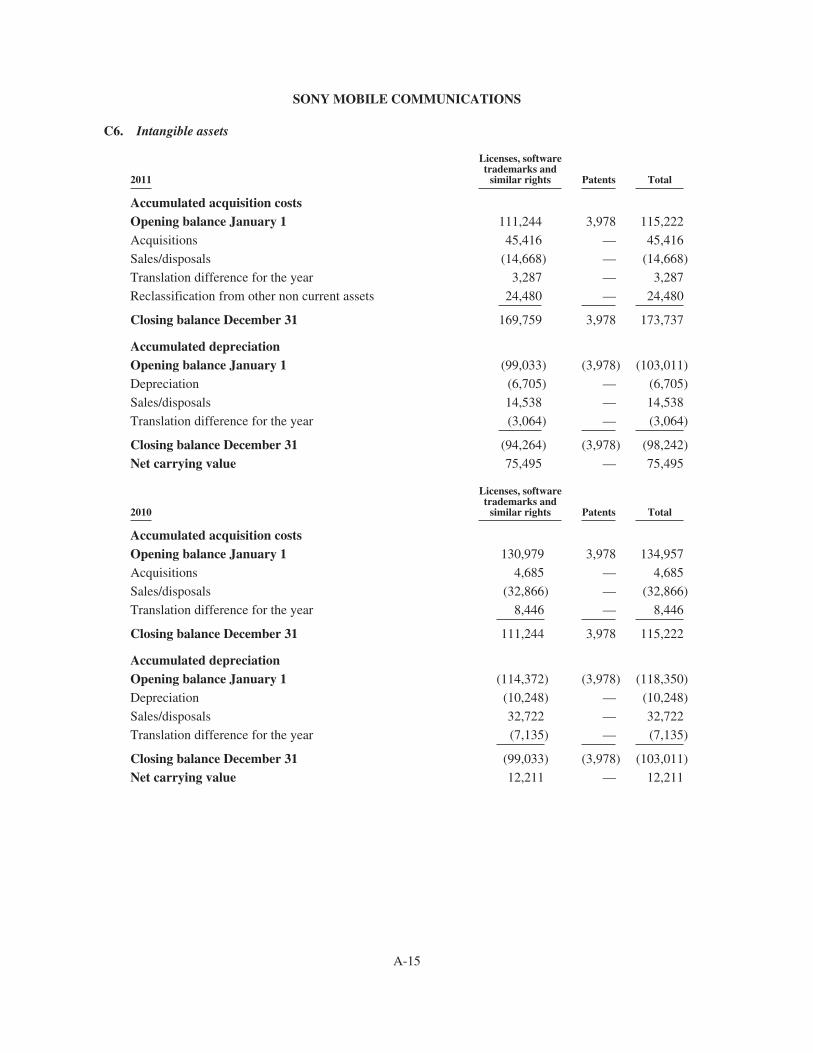
SONY MOBILE COMMUNICATIONS
C6. Intangible assets
2011
Licenses, softwaretrademarks and
similar rights Patents Total
Accumulated acquisition costsOpening balance January 1 111,244 3,978 115,222
Acquisitions 45,416 — 45,416
Sales/disposals (14,668) — (14,668)
Translation difference for the year 3,287 — 3,287
Reclassification from other non current assets 24,480 — 24,480
Closing balance December 31 169,759 3,978 173,737
Accumulated depreciationOpening balance January 1 (99,033) (3,978) (103,011)
Depreciation (6,705) — (6,705)
Sales/disposals 14,538 — 14,538
Translation difference for the year (3,064) — (3,064)
Closing balance December 31 (94,264) (3,978) (98,242)
Net carrying value 75,495 — 75,495
2010
Licenses, softwaretrademarks and
similar rights Patents Total
Accumulated acquisition costsOpening balance January 1 130,979 3,978 134,957
Acquisitions 4,685 — 4,685
Sales/disposals (32,866) — (32,866)
Translation difference for the year 8,446 — 8,446
Closing balance December 31 111,244 3,978 115,222
Accumulated depreciationOpening balance January 1 (114,372) (3,978) (118,350)
Depreciation (10,248) — (10,248)
Sales/disposals 32,722 — 32,722
Translation difference for the year (7,135) — (7,135)
Closing balance December 31 (99,033) (3,978) (103,011)
Net carrying value 12,211 — 12,211
A-15
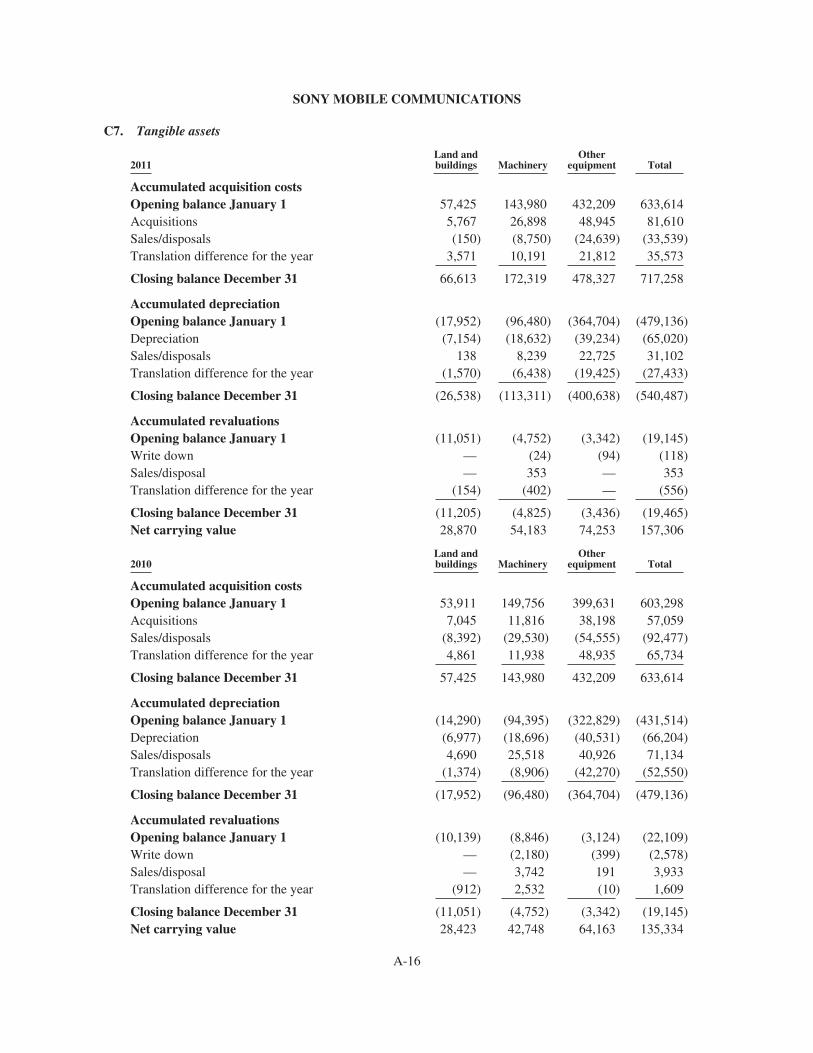
SONY MOBILE COMMUNICATIONS
C7. Tangible assets
2011Land andbuildings Machinery
Otherequipment Total
Accumulated acquisition costsOpening balance January 1 57,425 143,980 432,209 633,614Acquisitions 5,767 26,898 48,945 81,610Sales/disposals (150) (8,750) (24,639) (33,539)Translation difference for the year 3,571 10,191 21,812 35,573
Closing balance December 31 66,613 172,319 478,327 717,258
Accumulated depreciationOpening balance January 1 (17,952) (96,480) (364,704) (479,136)Depreciation (7,154) (18,632) (39,234) (65,020)Sales/disposals 138 8,239 22,725 31,102Translation difference for the year (1,570) (6,438) (19,425) (27,433)
Closing balance December 31 (26,538) (113,311) (400,638) (540,487)
Accumulated revaluationsOpening balance January 1 (11,051) (4,752) (3,342) (19,145)Write down — (24) (94) (118)Sales/disposal — 353 — 353Translation difference for the year (154) (402) — (556)
Closing balance December 31 (11,205) (4,825) (3,436) (19,465)Net carrying value 28,870 54,183 74,253 157,306
2010Land andbuildings Machinery
Otherequipment Total
Accumulated acquisition costsOpening balance January 1 53,911 149,756 399,631 603,298Acquisitions 7,045 11,816 38,198 57,059Sales/disposals (8,392) (29,530) (54,555) (92,477)Translation difference for the year 4,861 11,938 48,935 65,734
Closing balance December 31 57,425 143,980 432,209 633,614
Accumulated depreciationOpening balance January 1 (14,290) (94,395) (322,829) (431,514)Depreciation (6,977) (18,696) (40,531) (66,204)Sales/disposals 4,690 25,518 40,926 71,134Translation difference for the year (1,374) (8,906) (42,270) (52,550)
Closing balance December 31 (17,952) (96,480) (364,704) (479,136)
Accumulated revaluationsOpening balance January 1 (10,139) (8,846) (3,124) (22,109)Write down — (2,180) (399) (2,578)Sales/disposal — 3,742 191 3,933Translation difference for the year (912) 2,532 (10) 1,609
Closing balance December 31 (11,051) (4,752) (3,342) (19,145)Net carrying value 28,423 42,748 64,163 135,334
A-16
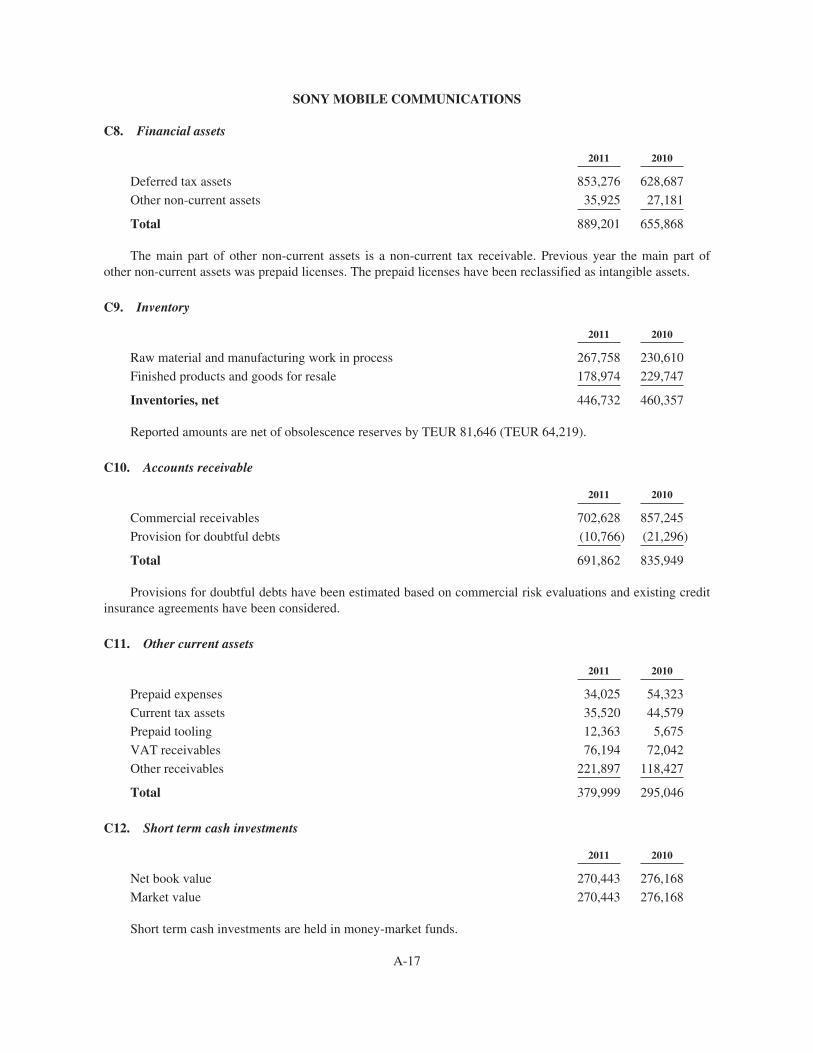
SONY MOBILE COMMUNICATIONS
C8. Financial assets
2011 2010
Deferred tax assets 853,276 628,687
Other non-current assets 35,925 27,181
Total 889,201 655,868
The main part of other non-current assets is a non-current tax receivable. Previous year the main part ofother non-current assets was prepaid licenses. The prepaid licenses have been reclassified as intangible assets.
C9. Inventory
2011 2010
Raw material and manufacturing work in process 267,758 230,610
Finished products and goods for resale 178,974 229,747
Inventories, net 446,732 460,357
Reported amounts are net of obsolescence reserves by TEUR 81,646 (TEUR 64,219).
C10. Accounts receivable
2011 2010
Commercial receivables 702,628 857,245
Provision for doubtful debts (10,766) (21,296)
Total 691,862 835,949
Provisions for doubtful debts have been estimated based on commercial risk evaluations and existing creditinsurance agreements have been considered.
C11. Other current assets
2011 2010
Prepaid expenses 34,025 54,323
Current tax assets 35,520 44,579
Prepaid tooling 12,363 5,675
VAT receivables 76,194 72,042
Other receivables 221,897 118,427
Total 379,999 295,046
C12. Short term cash investments
2011 2010
Net book value 270,443 276,168
Market value 270,443 276,168
Short term cash investments are held in money-market funds.
A-17
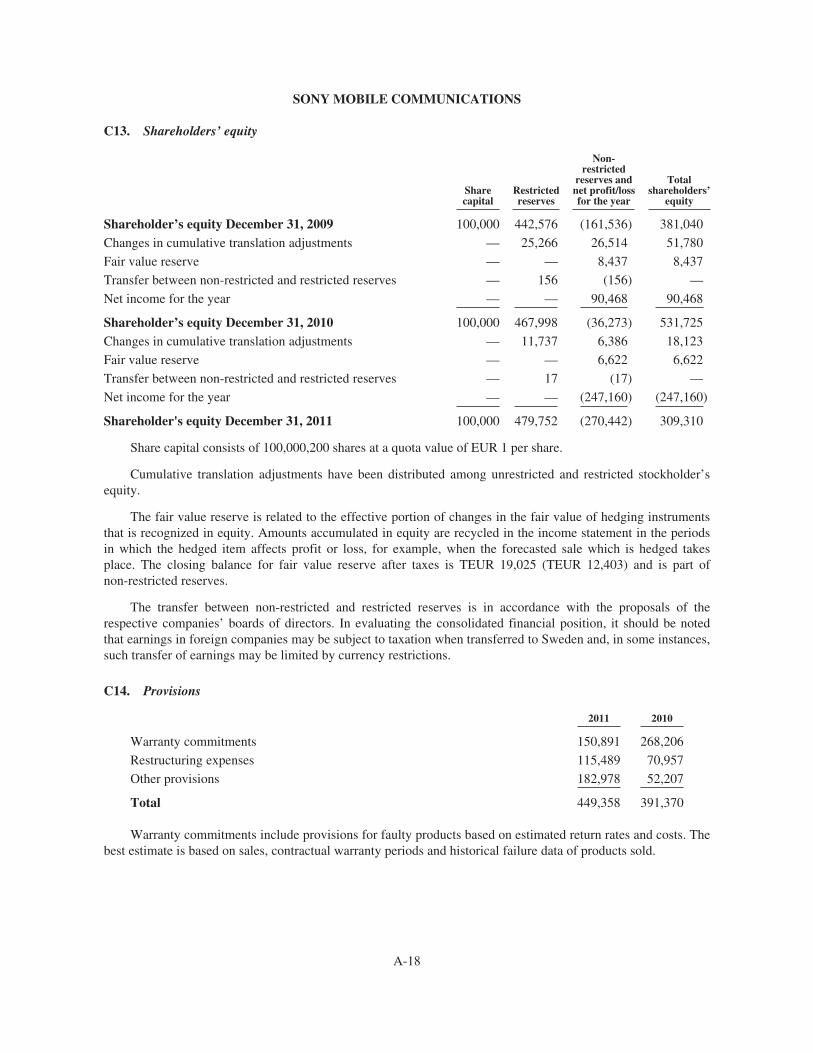
SONY MOBILE COMMUNICATIONS
C13. Shareholders’ equity
Sharecapital
Restrictedreserves
Non-restricted
reserves andnet profit/lossfor the year
Totalshareholders’
equity
Shareholder’s equity December 31, 2009 100,000 442,576 (161,536) 381,040
Changes in cumulative translation adjustments — 25,266 26,514 51,780
Fair value reserve — — 8,437 8,437
Transfer between non-restricted and restricted reserves — 156 (156) —
Net income for the year — — 90,468 90,468
Shareholder’s equity December 31, 2010 100,000 467,998 (36,273) 531,725
Changes in cumulative translation adjustments — 11,737 6,386 18,123
Fair value reserve — — 6,622 6,622
Transfer between non-restricted and restricted reserves — 17 (17) —
Net income for the year — — (247,160) (247,160)
Shareholder's equity December 31, 2011 100,000 479,752 (270,442) 309,310
Share capital consists of 100,000,200 shares at a quota value of EUR 1 per share.
Cumulative translation adjustments have been distributed among unrestricted and restricted stockholder’sequity.
The fair value reserve is related to the effective portion of changes in the fair value of hedging instrumentsthat is recognized in equity. Amounts accumulated in equity are recycled in the income statement in the periodsin which the hedged item affects profit or loss, for example, when the forecasted sale which is hedged takesplace. The closing balance for fair value reserve after taxes is TEUR 19,025 (TEUR 12,403) and is part ofnon-restricted reserves.
The transfer between non-restricted and restricted reserves is in accordance with the proposals of therespective companies’ boards of directors. In evaluating the consolidated financial position, it should be notedthat earnings in foreign companies may be subject to taxation when transferred to Sweden and, in some instances,such transfer of earnings may be limited by currency restrictions.
C14. Provisions
2011 2010
Warranty commitments 150,891 268,206
Restructuring expenses 115,489 70,957
Other provisions 182,978 52,207
Total 449,358 391,370
Warranty commitments include provisions for faulty products based on estimated return rates and costs. Thebest estimate is based on sales, contractual warranty periods and historical failure data of products sold.
A-18
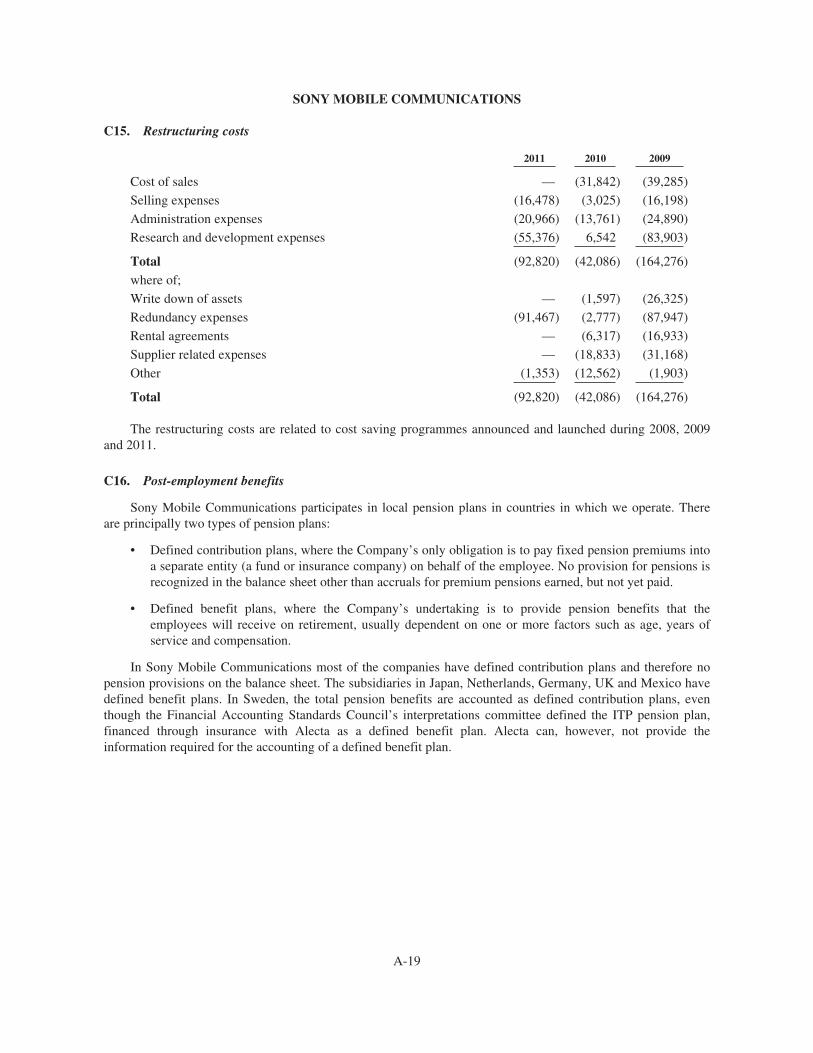
SONY MOBILE COMMUNICATIONS
C15. Restructuring costs
2011 2010 2009
Cost of sales — (31,842) (39,285)
Selling expenses (16,478) (3,025) (16,198)
Administration expenses (20,966) (13,761) (24,890)
Research and development expenses (55,376) 6,542 (83,903)
Total (92,820) (42,086) (164,276)
where of;
Write down of assets — (1,597) (26,325)
Redundancy expenses (91,467) (2,777) (87,947)
Rental agreements — (6,317) (16,933)
Supplier related expenses — (18,833) (31,168)
Other (1,353) (12,562) (1,903)
Total (92,820) (42,086) (164,276)
The restructuring costs are related to cost saving programmes announced and launched during 2008, 2009and 2011.
C16. Post-employment benefits
Sony Mobile Communications participates in local pension plans in countries in which we operate. Thereare principally two types of pension plans:
• Defined contribution plans, where the Company’s only obligation is to pay fixed pension premiums intoa separate entity (a fund or insurance company) on behalf of the employee. No provision for pensions isrecognized in the balance sheet other than accruals for premium pensions earned, but not yet paid.
• Defined benefit plans, where the Company’s undertaking is to provide pension benefits that theemployees will receive on retirement, usually dependent on one or more factors such as age, years ofservice and compensation.
In Sony Mobile Communications most of the companies have defined contribution plans and therefore nopension provisions on the balance sheet. The subsidiaries in Japan, Netherlands, Germany, UK and Mexico havedefined benefit plans. In Sweden, the total pension benefits are accounted as defined contribution plans, eventhough the Financial Accounting Standards Council’s interpretations committee defined the ITP pension plan,financed through insurance with Alecta as a defined benefit plan. Alecta can, however, not provide theinformation required for the accounting of a defined benefit plan.
A-19
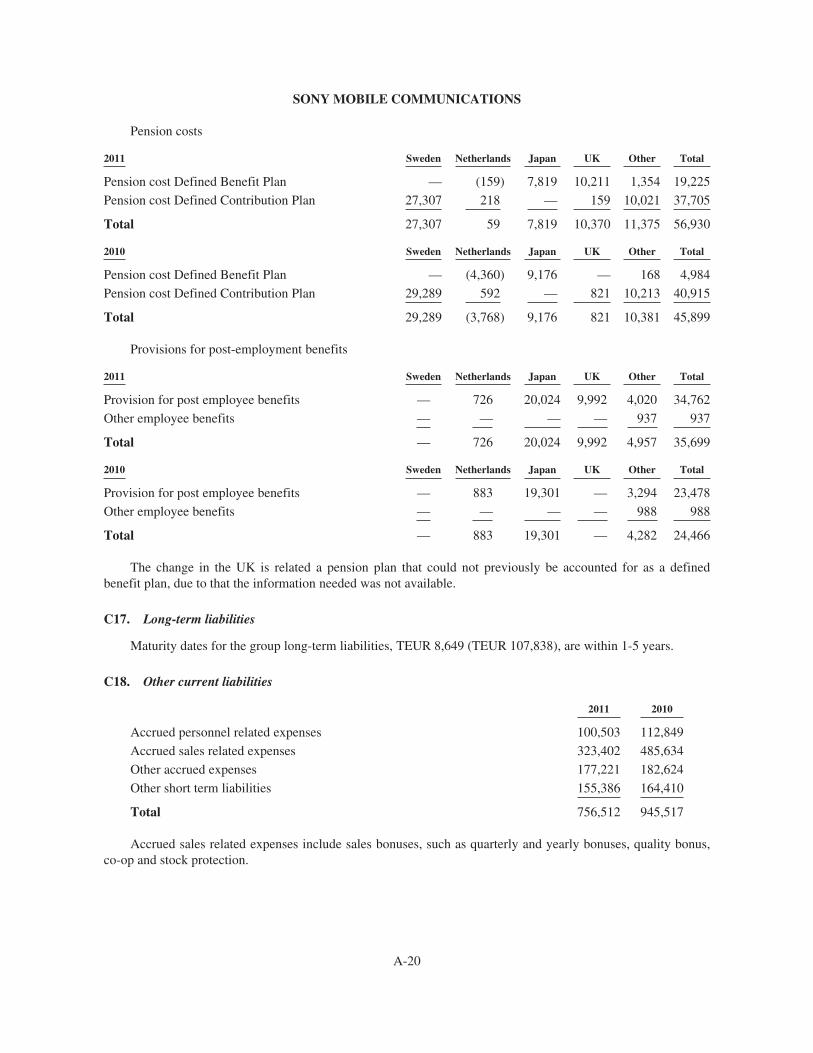
SONY MOBILE COMMUNICATIONS
Pension costs
2011 Sweden Netherlands Japan UK Other Total
Pension cost Defined Benefit Plan — (159) 7,819 10,211 1,354 19,225
Pension cost Defined Contribution Plan 27,307 218 — 159 10,021 37,705
Total 27,307 59 7,819 10,370 11,375 56,930
2010 Sweden Netherlands Japan UK Other Total
Pension cost Defined Benefit Plan — (4,360) 9,176 — 168 4,984
Pension cost Defined Contribution Plan 29,289 592 — 821 10,213 40,915
Total 29,289 (3,768) 9,176 821 10,381 45,899
Provisions for post-employment benefits
2011 Sweden Netherlands Japan UK Other Total
Provision for post employee benefits — 726 20,024 9,992 4,020 34,762
Other employee benefits — — — — 937 937
Total — 726 20,024 9,992 4,957 35,699
2010 Sweden Netherlands Japan UK Other Total
Provision for post employee benefits — 883 19,301 — 3,294 23,478
Other employee benefits — — — — 988 988
Total — 883 19,301 — 4,282 24,466
The change in the UK is related a pension plan that could not previously be accounted for as a definedbenefit plan, due to that the information needed was not available.
C17. Long-term liabilities
Maturity dates for the group long-term liabilities, TEUR 8,649 (TEUR 107,838), are within 1-5 years.
C18. Other current liabilities
2011 2010
Accrued personnel related expenses 100,503 112,849
Accrued sales related expenses 323,402 485,634
Other accrued expenses 177,221 182,624
Other short term liabilities 155,386 164,410
Total 756,512 945,517
Accrued sales related expenses include sales bonuses, such as quarterly and yearly bonuses, quality bonus,co-op and stock protection.
A-20
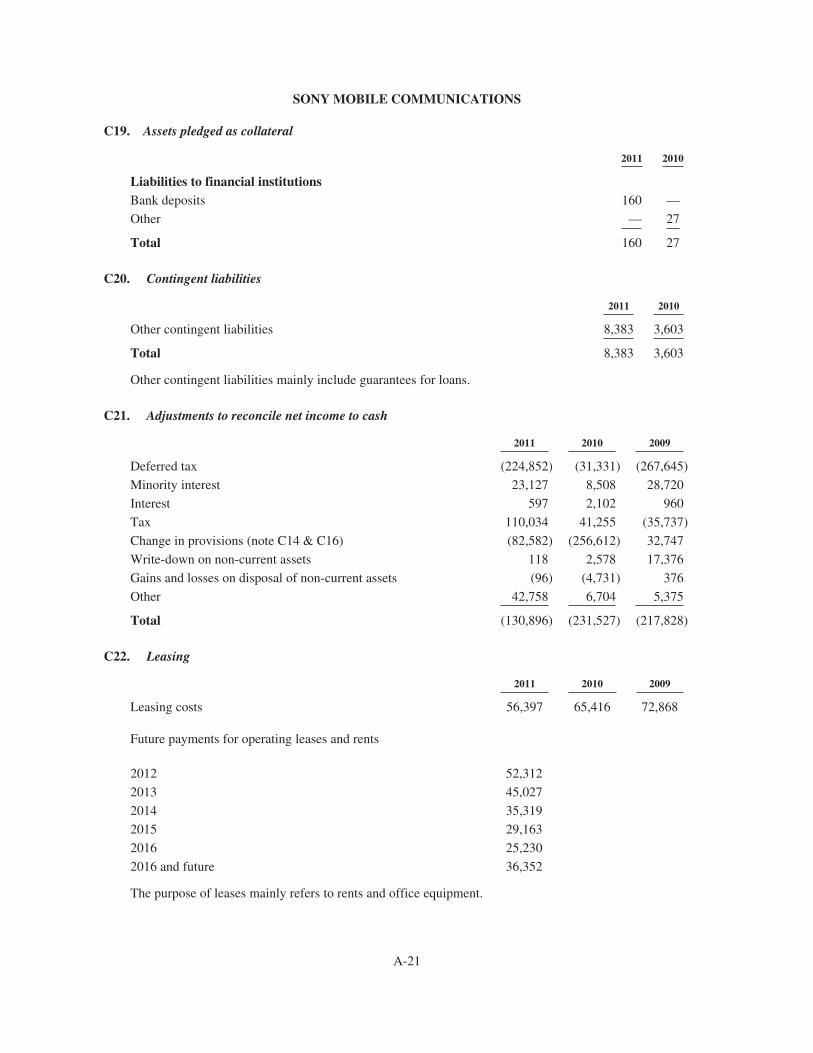
SONY MOBILE COMMUNICATIONS
C19. Assets pledged as collateral
2011 2010
Liabilities to financial institutionsBank deposits 160 —
Other — 27
Total 160 27
C20. Contingent liabilities
2011 2010
Other contingent liabilities 8,383 3,603
Total 8,383 3,603
Other contingent liabilities mainly include guarantees for loans.
C21. Adjustments to reconcile net income to cash
2011 2010 2009
Deferred tax (224,852) (31,331) (267,645)
Minority interest 23,127 8,508 28,720
Interest 597 2,102 960
Tax 110,034 41,255 (35,737)
Change in provisions (note C14 & C16) (82,582) (256,612) 32,747
Write-down on non-current assets 118 2,578 17,376
Gains and losses on disposal of non-current assets (96) (4,731) 376
Other 42,758 6,704 5,375
Total (130,896) (231,527) (217,828)
C22. Leasing
2011 2010 2009
Leasing costs 56,397 65,416 72,868
Future payments for operating leases and rents
2012 52,312
2013 45,027
2014 35,319
2015 29,163
2016 25,230
2016 and future 36,352
The purpose of leases mainly refers to rents and office equipment.
A-21
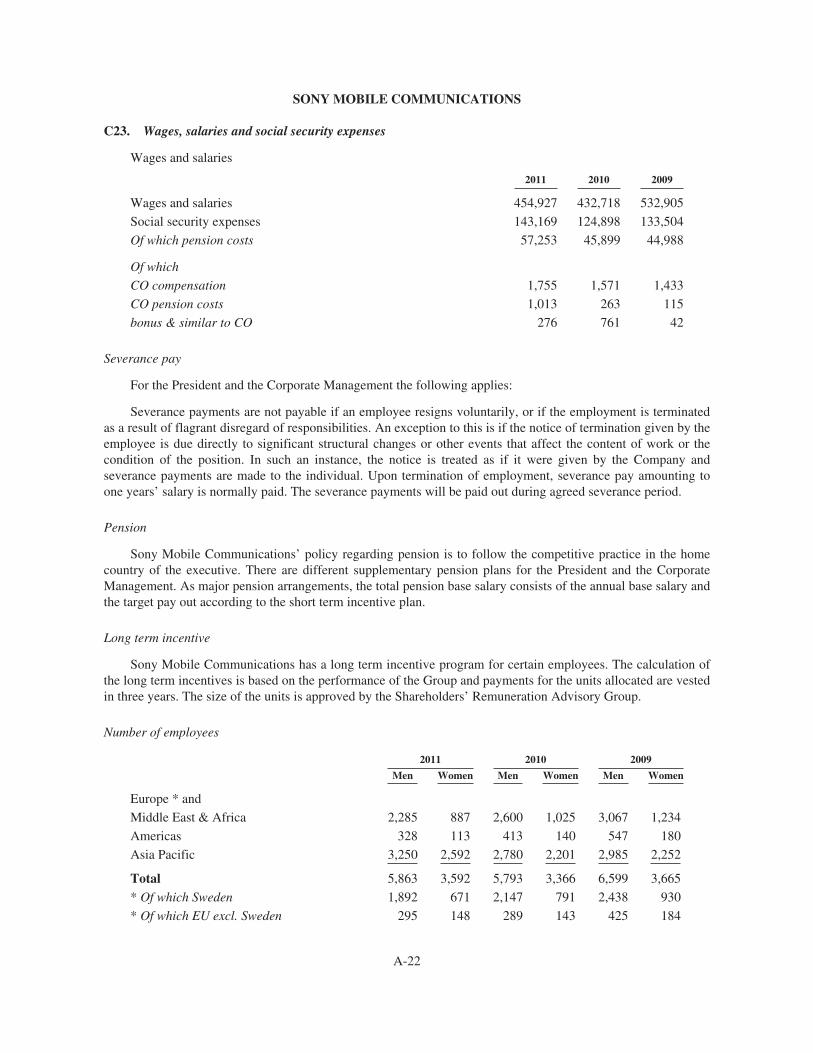
SONY MOBILE COMMUNICATIONS
C23. Wages, salaries and social security expenses
Wages and salaries
2011 2010 2009
Wages and salaries 454,927 432,718 532,905
Social security expenses 143,169 124,898 133,504
Of which pension costs 57,253 45,899 44,988
Of which
CO compensation 1,755 1,571 1,433
CO pension costs 1,013 263 115
bonus & similar to CO 276 761 42
Severance pay
For the President and the Corporate Management the following applies:
Severance payments are not payable if an employee resigns voluntarily, or if the employment is terminatedas a result of flagrant disregard of responsibilities. An exception to this is if the notice of termination given by theemployee is due directly to significant structural changes or other events that affect the content of work or thecondition of the position. In such an instance, the notice is treated as if it were given by the Company andseverance payments are made to the individual. Upon termination of employment, severance pay amounting toone years’ salary is normally paid. The severance payments will be paid out during agreed severance period.
Pension
Sony Mobile Communications’ policy regarding pension is to follow the competitive practice in the homecountry of the executive. There are different supplementary pension plans for the President and the CorporateManagement. As major pension arrangements, the total pension base salary consists of the annual base salary andthe target pay out according to the short term incentive plan.
Long term incentive
Sony Mobile Communications has a long term incentive program for certain employees. The calculation ofthe long term incentives is based on the performance of the Group and payments for the units allocated are vestedin three years. The size of the units is approved by the Shareholders’ Remuneration Advisory Group.
Number of employees
2011 2010 2009
Men Women Men Women Men Women
Europe * and
Middle East & Africa 2,285 887 2,600 1,025 3,067 1,234
Americas 328 113 413 140 547 180
Asia Pacific 3,250 2,592 2,780 2,201 2,985 2,252
Total 5,863 3,592 5,793 3,366 6,599 3,665
* Of which Sweden 1,892 671 2,147 791 2,438 930
* Of which EU excl. Sweden 295 148 289 143 425 184
A-22
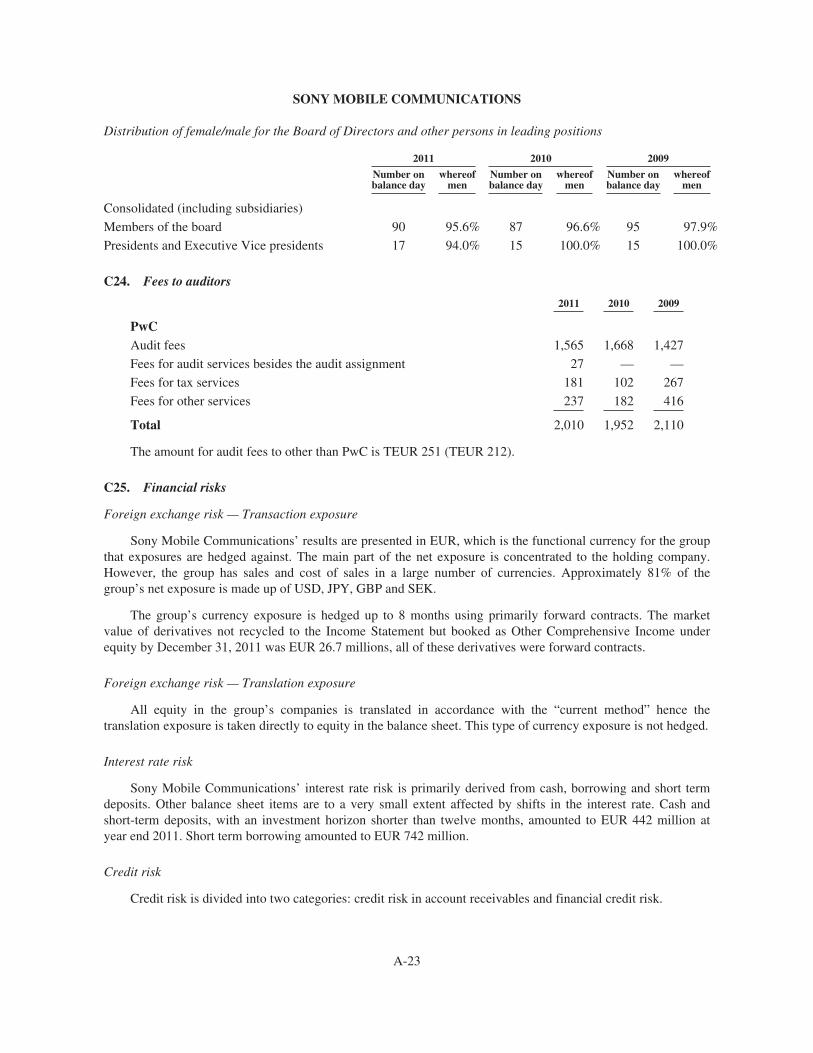
SONY MOBILE COMMUNICATIONS
Distribution of female/male for the Board of Directors and other persons in leading positions
2011 2010 2009
Number onbalance day
whereofmen
Number onbalance day
whereofmen
Number onbalance day
whereofmen
Consolidated (including subsidiaries)
Members of the board 90 95.6% 87 96.6% 95 97.9%
Presidents and Executive Vice presidents 17 94.0% 15 100.0% 15 100.0%
C24. Fees to auditors
2011 2010 2009
PwCAudit fees 1,565 1,668 1,427
Fees for audit services besides the audit assignment 27 — —
Fees for tax services 181 102 267
Fees for other services 237 182 416
Total 2,010 1,952 2,110
The amount for audit fees to other than PwC is TEUR 251 (TEUR 212).
C25. Financial risks
Foreign exchange risk — Transaction exposure
Sony Mobile Communications’ results are presented in EUR, which is the functional currency for the groupthat exposures are hedged against. The main part of the net exposure is concentrated to the holding company.However, the group has sales and cost of sales in a large number of currencies. Approximately 81% of thegroup’s net exposure is made up of USD, JPY, GBP and SEK.
The group’s currency exposure is hedged up to 8 months using primarily forward contracts. The marketvalue of derivatives not recycled to the Income Statement but booked as Other Comprehensive Income underequity by December 31, 2011 was EUR 26.7 millions, all of these derivatives were forward contracts.
Foreign exchange risk — Translation exposure
All equity in the group’s companies is translated in accordance with the “current method” hence thetranslation exposure is taken directly to equity in the balance sheet. This type of currency exposure is not hedged.
Interest rate risk
Sony Mobile Communications’ interest rate risk is primarily derived from cash, borrowing and short termdeposits. Other balance sheet items are to a very small extent affected by shifts in the interest rate. Cash andshort-term deposits, with an investment horizon shorter than twelve months, amounted to EUR 442 million atyear end 2011. Short term borrowing amounted to EUR 742 million.
Credit risk
Credit risk is divided into two categories: credit risk in account receivables and financial credit risk.
A-23
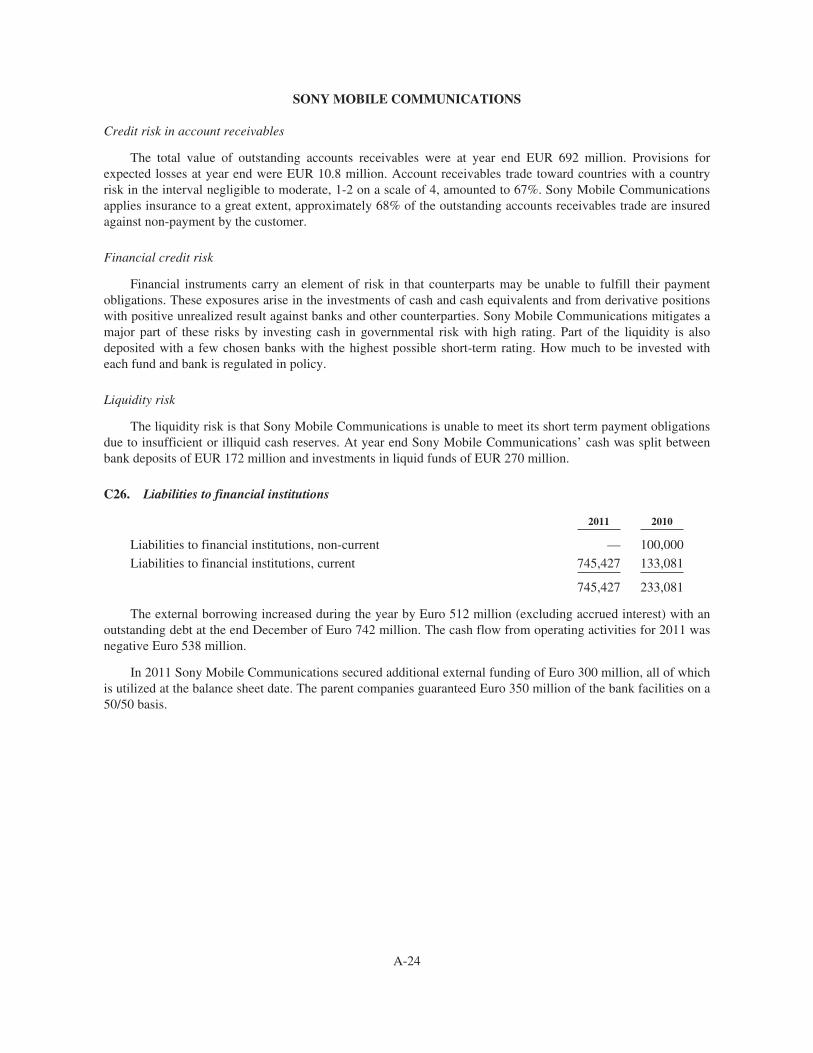
SONY MOBILE COMMUNICATIONS
Credit risk in account receivables
The total value of outstanding accounts receivables were at year end EUR 692 million. Provisions forexpected losses at year end were EUR 10.8 million. Account receivables trade toward countries with a countryrisk in the interval negligible to moderate, 1-2 on a scale of 4, amounted to 67%. Sony Mobile Communicationsapplies insurance to a great extent, approximately 68% of the outstanding accounts receivables trade are insuredagainst non-payment by the customer.
Financial credit risk
Financial instruments carry an element of risk in that counterparts may be unable to fulfill their paymentobligations. These exposures arise in the investments of cash and cash equivalents and from derivative positionswith positive unrealized result against banks and other counterparties. Sony Mobile Communications mitigates amajor part of these risks by investing cash in governmental risk with high rating. Part of the liquidity is alsodeposited with a few chosen banks with the highest possible short-term rating. How much to be invested witheach fund and bank is regulated in policy.
Liquidity risk
The liquidity risk is that Sony Mobile Communications is unable to meet its short term payment obligationsdue to insufficient or illiquid cash reserves. At year end Sony Mobile Communications’ cash was split betweenbank deposits of EUR 172 million and investments in liquid funds of EUR 270 million.
C26. Liabilities to financial institutions
2011 2010
Liabilities to financial institutions, non-current — 100,000
Liabilities to financial institutions, current 745,427 133,081
745,427 233,081
The external borrowing increased during the year by Euro 512 million (excluding accrued interest) with anoutstanding debt at the end December of Euro 742 million. The cash flow from operating activities for 2011 wasnegative Euro 538 million.
In 2011 Sony Mobile Communications secured additional external funding of Euro 300 million, all of whichis utilized at the balance sheet date. The parent companies guaranteed Euro 350 million of the bank facilities on a50/50 basis.
A-24
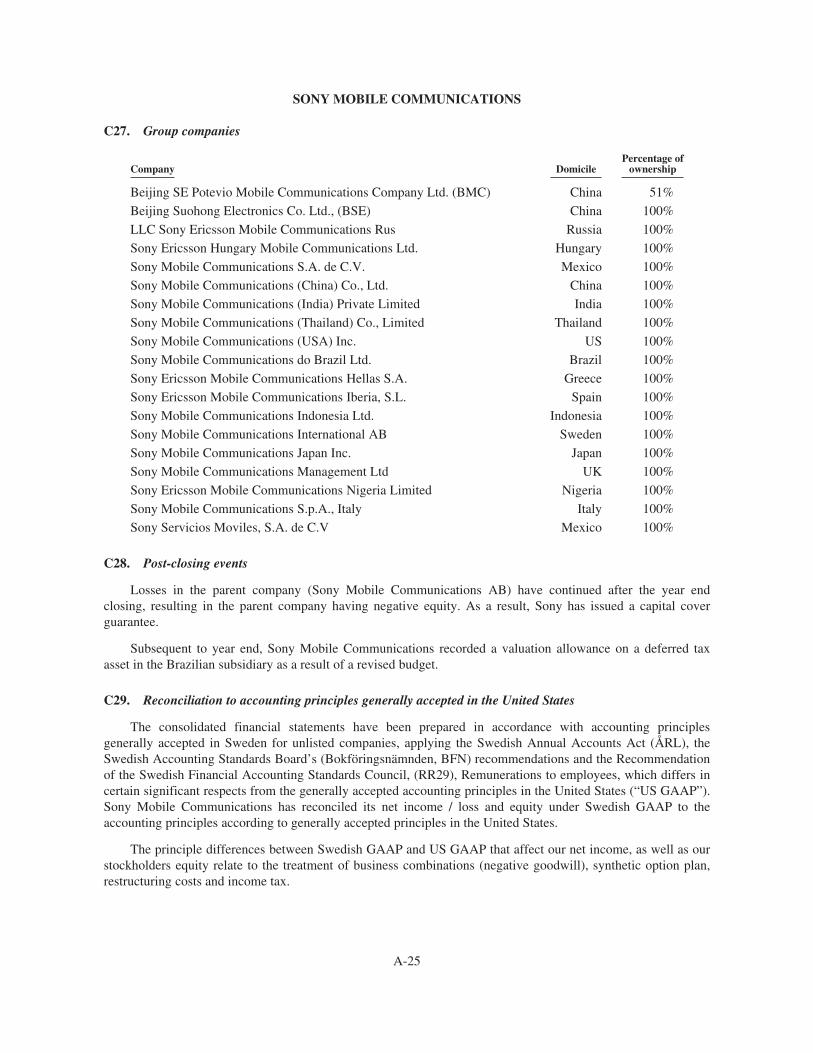
SONY MOBILE COMMUNICATIONS
C27. Group companies
Company DomicilePercentage of
ownership
Beijing SE Potevio Mobile Communications Company Ltd. (BMC) China 51%
Beijing Suohong Electronics Co. Ltd., (BSE) China 100%
LLC Sony Ericsson Mobile Communications Rus Russia 100%
Sony Ericsson Hungary Mobile Communications Ltd. Hungary 100%
Sony Mobile Communications S.A. de C.V. Mexico 100%
Sony Mobile Communications (China) Co., Ltd. China 100%
Sony Mobile Communications (India) Private Limited India 100%
Sony Mobile Communications (Thailand) Co., Limited Thailand 100%
Sony Mobile Communications (USA) Inc. US 100%
Sony Mobile Communications do Brazil Ltd. Brazil 100%
Sony Ericsson Mobile Communications Hellas S.A. Greece 100%
Sony Ericsson Mobile Communications Iberia, S.L. Spain 100%
Sony Mobile Communications Indonesia Ltd. Indonesia 100%
Sony Mobile Communications International AB Sweden 100%
Sony Mobile Communications Japan Inc. Japan 100%
Sony Mobile Communications Management Ltd UK 100%
Sony Ericsson Mobile Communications Nigeria Limited Nigeria 100%
Sony Mobile Communications S.p.A., Italy Italy 100%
Sony Servicios Moviles, S.A. de C.V Mexico 100%
C28. Post-closing events
Losses in the parent company (Sony Mobile Communications AB) have continued after the year endclosing, resulting in the parent company having negative equity. As a result, Sony has issued a capital coverguarantee.
Subsequent to year end, Sony Mobile Communications recorded a valuation allowance on a deferred taxasset in the Brazilian subsidiary as a result of a revised budget.
C29. Reconciliation to accounting principles generally accepted in the United States
The consolidated financial statements have been prepared in accordance with accounting principlesgenerally accepted in Sweden for unlisted companies, applying the Swedish Annual Accounts Act (ÅRL), theSwedish Accounting Standards Board’s (Bokföringsnämnden, BFN) recommendations and the Recommendationof the Swedish Financial Accounting Standards Council, (RR29), Remunerations to employees, which differs incertain significant respects from the generally accepted accounting principles in the United States (“US GAAP”).Sony Mobile Communications has reconciled its net income / loss and equity under Swedish GAAP to theaccounting principles according to generally accepted principles in the United States.
The principle differences between Swedish GAAP and US GAAP that affect our net income, as well as ourstockholders equity relate to the treatment of business combinations (negative goodwill), synthetic option plan,restructuring costs and income tax.
A-25
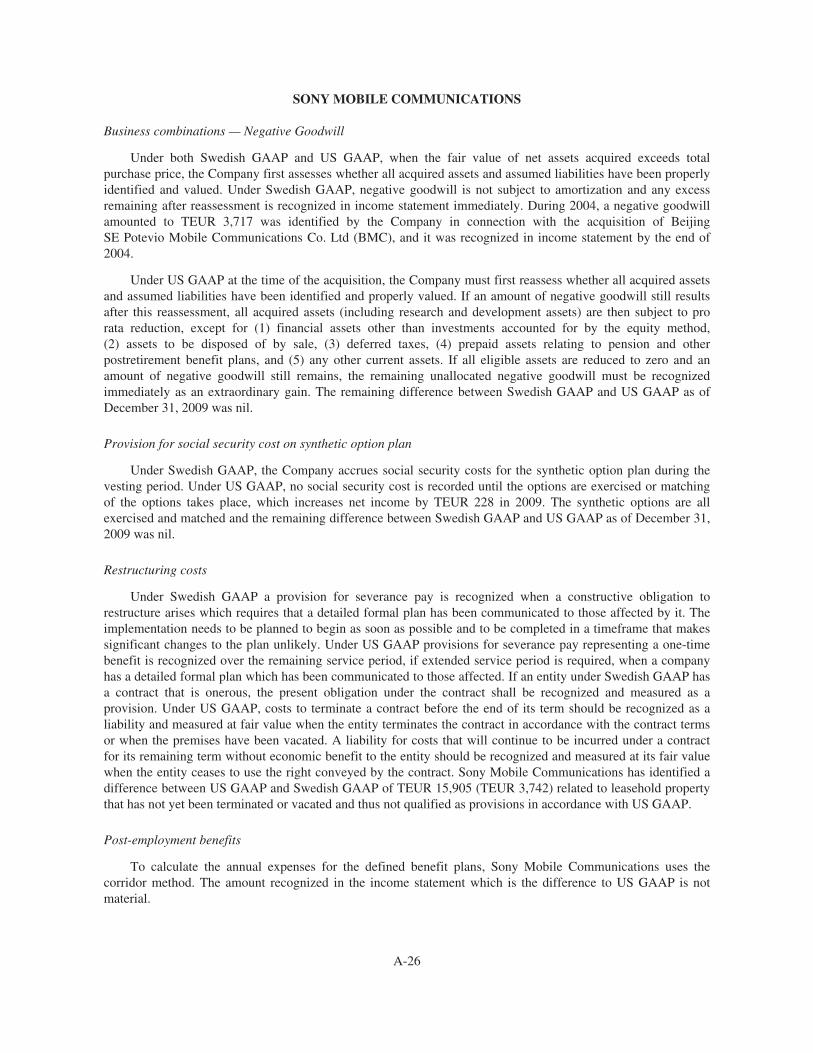
SONY MOBILE COMMUNICATIONS
Business combinations — Negative Goodwill
Under both Swedish GAAP and US GAAP, when the fair value of net assets acquired exceeds totalpurchase price, the Company first assesses whether all acquired assets and assumed liabilities have been properlyidentified and valued. Under Swedish GAAP, negative goodwill is not subject to amortization and any excessremaining after reassessment is recognized in income statement immediately. During 2004, a negative goodwillamounted to TEUR 3,717 was identified by the Company in connection with the acquisition of BeijingSE Potevio Mobile Communications Co. Ltd (BMC), and it was recognized in income statement by the end of2004.
Under US GAAP at the time of the acquisition, the Company must first reassess whether all acquired assetsand assumed liabilities have been identified and properly valued. If an amount of negative goodwill still resultsafter this reassessment, all acquired assets (including research and development assets) are then subject to prorata reduction, except for (1) financial assets other than investments accounted for by the equity method,(2) assets to be disposed of by sale, (3) deferred taxes, (4) prepaid assets relating to pension and otherpostretirement benefit plans, and (5) any other current assets. If all eligible assets are reduced to zero and anamount of negative goodwill still remains, the remaining unallocated negative goodwill must be recognizedimmediately as an extraordinary gain. The remaining difference between Swedish GAAP and US GAAP as ofDecember 31, 2009 was nil.
Provision for social security cost on synthetic option plan
Under Swedish GAAP, the Company accrues social security costs for the synthetic option plan during thevesting period. Under US GAAP, no social security cost is recorded until the options are exercised or matchingof the options takes place, which increases net income by TEUR 228 in 2009. The synthetic options are allexercised and matched and the remaining difference between Swedish GAAP and US GAAP as of December 31,2009 was nil.
Restructuring costs
Under Swedish GAAP a provision for severance pay is recognized when a constructive obligation torestructure arises which requires that a detailed formal plan has been communicated to those affected by it. Theimplementation needs to be planned to begin as soon as possible and to be completed in a timeframe that makessignificant changes to the plan unlikely. Under US GAAP provisions for severance pay representing a one-timebenefit is recognized over the remaining service period, if extended service period is required, when a companyhas a detailed formal plan which has been communicated to those affected. If an entity under Swedish GAAP hasa contract that is onerous, the present obligation under the contract shall be recognized and measured as aprovision. Under US GAAP, costs to terminate a contract before the end of its term should be recognized as aliability and measured at fair value when the entity terminates the contract in accordance with the contract termsor when the premises have been vacated. A liability for costs that will continue to be incurred under a contractfor its remaining term without economic benefit to the entity should be recognized and measured at its fair valuewhen the entity ceases to use the right conveyed by the contract. Sony Mobile Communications has identified adifference between US GAAP and Swedish GAAP of TEUR 15,905 (TEUR 3,742) related to leasehold propertythat has not yet been terminated or vacated and thus not qualified as provisions in accordance with US GAAP.
Post-employment benefits
To calculate the annual expenses for the defined benefit plans, Sony Mobile Communications uses thecorridor method. The amount recognized in the income statement which is the difference to US GAAP is notmaterial.
A-26
SONY MOBILE COMMUNICATIONS
Deferred Income Taxes
Deferred tax is calculated on US GAAP adjustments and the US GAAP balance sheet disclosure reflects thegross recognition of deferred tax assets and liabilities.
Valuation allowance
The income tax accounting guidance under US GAAP requires a valuation allowance to be applied to adeferred tax asset if realization of the underlying future tax benefits is not more likely than not. Under US GAAP,forming a conclusion that a valuation allowance is not needed is difficult when there is negative evidence such ascumulative losses in recent years. In those circumstances, US GAAP provides that the weight given to thepotential effect of negative and positive evidence should be commensurate with the extent to which it can beobjectively verified.
Sony Mobile Communications AB is in a three year cumulative loss position. There is however positiveevidence as well: Sony Mobile Communications AB has never had any losses or tax credits expiring unused, theloss carry forward period in Sweden is unlimited, prior to 2008, Sony Mobile Communications had a stronghistory of a number of years with profits and management’s financial projections support the future realization ofthe net deferred tax assets.
Management has concluded under US GAAP, that Sony Mobile Communications AB’s deferred tax assetscannot be considered more likely than not to be realized in the future years.
Under Swedish GAAP more emphasis has been put on the fact that the loss carry forward period in Swedenis unlimited and that the financial projections, made by management, support the future realization of the netdeferred tax assets and less emphasis is placed on the recent cumulative loss position. Although managementexpects positive impact on future earnings capacity when becoming a fully owned Sony subsidiary, it would notbe enough to overcome the negative evidence under US GAAP.
Management has concluded, under Swedish GAAP, that Sony Mobile Communications AB’s deferred taxassets are probable to be utilized in the future years.
Non-current and current assets
Swedish GAAP requires deferred tax assets to be classified as non-current assets on the balance sheet.Under US GAAP, deferred tax liabilities and assets are classified as current or non-current based on theclassification of the related asset or liability for financial reporting. A deferred tax liability or asset that is notrelated to an asset or liability for financial reporting, including deferred tax assets related to carry forwards, shallbe classified according to the expected reversal date of the temporary difference. The balance sheet shows adifference in non-current and current assets between Swedish GAAP and US GAAP which relates to theclassification of deferred tax assets.
Adjustment of net income, comprehensive income, equity and balance sheet items
Application of US GAAP as described above would have had the following effects on consolidated netincome.
A-27
SONY MOBILE COMMUNICATIONS
Adjustment of Net Income
2011 2010 2009
Net income per Swedish GAAP (247,160) 90,468 (835,827)
US GAAP adjustments before taxes:Business Combination — — 763
Synthetic Option Plan — — 228
Restructuring 12,163 (9,131) (2,624)
Tax effect of US GAAP adjustment (5,287) 2,412 595
Valuation allowance (653,516) — —
Net income in accordance with US GAAP (893,801) 83,749 (836,865)
Adjustments of stockholders’ equity
Adjustments of stockholders’ equity
2011 2010
Equity as reported per Swedish GAAP 309,310 531,725
US GAAP adjustments before taxes:Restructuring 15,905 3,742
Deferred tax effect of US GAAP adjustment (6,167) (880)
Valuation allowance (653,516) —
Stockholders’ equity in accordance with US GAAP (334,468) 534,587
Minority interest 58,098 42,286
Total equity in accordance with US GAAP (276,370) 576,873
Comprehensive income
2011 2010 2009
Net income in accordance with US GAAP (893,801) 83,749 (836,865)
Other comprehensive income
Gain/loss on cash flow hedges 9,070 11,373 1,409
Translation adjustment (34,586) 52,290 (1,409)
Deferred tax (2,448) (2,935) (355)
Total other comprehensive income (27,964) 60,728 (355)
Comprehensive income in accordance with US GAAP (921,765) 144,478 (837,220)
A-28
SONY MOBILE COMMUNICATIONS
Balance sheet items according to Swedish GAAP and US GAAP
Swedish GAAP US GAAP
Dec. 312011
Dec. 312010
Dec. 312011
Dec. 312010
Non-current assets 1,122,002 803,413 316,080 550,377
Current assets 1,960,636 2,196,036 2,106,874 2,448,191
Total Assets 3,082,638 2,999,449 2,422,954 2,998,569
Stockholders equity 309,310 531,725 (334,468) 534,587
Minority interest 58,098 42,286 58,098 42,286
Provisions 485,056 415,836 469,151 412,094
Non-current liabilities 8,649 107,838 8,649 107,838
Current liabilities 2,221,524 1,901,764 2,221,524 1,901,764
Total stockholders’ equity and liabilities 3,082,638 2,999,449 2,422,955 2,998,569
A-29
Report of Independent Auditors
To the Shareholder of Sony Mobile Communications AB:
We have audited the accompanying consolidated balance sheets of Sony Mobile Communications AB andits subsidiaries (formerly known as Sony Ericsson Mobile Communication AB) as of December 31, 2011 andDecember 31, 2010 and the related consolidated statements of income and of cash flows for each of the threeyears in the period ended December 31, 2011. These financial statements are the responsibility of the Company’smanagement. Our responsibility is to express an opinion on these financial statements based on our audits.
We conducted our audits in accordance with auditing standards generally accepted in the United States ofAmerica. Those standards require that we plan and perform the audit to obtain reasonable assurance aboutwhether the financial statements are free of material misstatement. An audit includes examining, on a test basis,evidence supporting the amounts and disclosures in the financial statements. An audit also includes assessing theaccounting principles used and significant estimates made by management, as well as evaluating the overallfinancial statement presentation. We believe that our audits provide a reasonable basis for our opinion.
In our opinion, the consolidated financial statements referred to above present fairly, in all material respects,the financial position of Sony Mobile Communications AB and its subsidiaries at December 31, 2011 andDecember 31, 2010 and the results of its operations and its cash flows for each of the three years in the periodended December 31, 2011 in conformity with accounting principles generally accepted in Sweden.
Accounting principles generally accepted in Sweden vary in certain significant respects from accountingprinciples generally accepted in the United States of America. Information relating to the nature and effect ofsuch differences is presented in Note C29 to the consolidated financial statements.
/s/ PricewaterhouseCoopers AB
Malmo, Sweden
June 15, 2012
A-30
Item 19. Exhibits
Documents filed as exhibits to this annual report:
12.1 302 Certification
12.2 302 Certification
13.1 906 Certification
15.1(a) Consent of PricewaterhouseCoopers Aarata
101 Interactive Data Files (XBRL-related documents)
SIGNATURES
Pursuant to the requirements of Section 12 of the Securities Exchange Act of 1934, the registrant herebycertifies that it meets all of the requirements for filing on Form 20-F/A and that it has duly caused and authorizedthe undersigned to sign this annual report on its behalf.
SONY CORPORATION(Registrant)
By: /s/ MASARU KATO
(Signature)Masaru KatoExecutive Vice President and Chief FinancialOfficer
Date: July 20, 2012
Exhibit 12.1
Certification Pursuant to Section 302 of the Sarbanes-Oxley Act of 2002
I, Kazuo Hirai, Chief Executive Officer and President, certify that:
1. I have reviewed this annual report on Form 20-F/A of Sony Corporation;
2. Based on my knowledge, this report does not contain any untrue statement of a material fact or omit to state amaterial fact necessary to make the statements made, in light of the circumstances under which such statementswere made, not misleading with respect to the period covered by this report;
3. Based on my knowledge, the financial statements, and other financial information included in this report, fairlypresent in all material respects the financial condition, results of operations and cash flows of the company as of,and for, the periods presented in this report;
4. The company’s other certifying officer and I are responsible for establishing and maintaining disclosurecontrols and procedures (as defined in Exchange Act Rules 13a-15(e) and 15d-15(e)) and internal control overfinancial reporting (as defined in Exchange Act Rules 13a-15(f) and 15d-15(f)) for the company and have:
(a) Designed such disclosure controls and procedures, or caused such disclosure controls and procedures to bedesigned under our supervision, to ensure that material information relating to the company, including itsconsolidated subsidiaries, is made known to us by others within those entities, particularly during the period inwhich this report is being prepared;
(b) Designed such internal control over financial reporting, or caused such internal control over financialreporting to be designed under our supervision, to provide reasonable assurance regarding the reliability offinancial reporting and the preparation of financial statements for external purposes in accordance with generallyaccepted accounting principles;
(c) Evaluated the effectiveness of the company’s disclosure controls and procedures and presented in this reportour conclusions about the effectiveness of the disclosure controls and procedures, as of the end of the periodcovered by this report based on such evaluation; and
(d) Disclosed in this report any change in the company’s internal control over financial reporting that occurredduring the period covered by the annual report that has materially affected, or is reasonably likely to materiallyaffect, the company’s internal control over financial reporting; and
5. The company’s other certifying officer and I have disclosed, based on our most recent evaluation of internalcontrol over financial reporting, to the company’s auditors and the audit committee of the company’s board ofdirectors (or persons performing the equivalent functions):
(a) All significant deficiencies and material weaknesses in the design or operation of internal control overfinancial reporting which are reasonably likely to adversely affect the company’s ability to record, process,summarize and report financial information; and
(b) Any fraud, whether or not material, that involves management or other employees who have a significant rolein the company’s internal control over financial reporting.
/s/ Kazuo Hirai
Date: July 20, 2012Kazuo Hirai
Chief Executive Officer and President
Exhibit 12.2
Certification Pursuant to Section 302 of the Sarbanes-Oxley Act of 2002
I, Masaru Kato, Executive Vice President and Chief Financial Officer, certify that:
1. I have reviewed this annual report on Form 20-F/A of Sony Corporation;
2. Based on my knowledge, this report does not contain any untrue statement of a material fact or omit to state amaterial fact necessary to make the statements made, in light of the circumstances under which such statementswere made, not misleading with respect to the period covered by this report;
3. Based on my knowledge, the financial statements, and other financial information included in this report, fairlypresent in all material respects the financial condition, results of operations and cash flows of the company as of,and for, the periods presented in this report;
4. The company’s other certifying officer and I are responsible for establishing and maintaining disclosurecontrols and procedures (as defined in Exchange Act Rules 13a-15(e) and 15d-15(e)) and internal control overfinancial reporting (as defined in Exchange Act Rules 13a-15(f) and 15d-15(f)) for the company and have:
(a) Designed such disclosure controls and procedures, or caused such disclosure controls and procedures to bedesigned under our supervision, to ensure that material information relating to the company, including itsconsolidated subsidiaries, is made known to us by others within those entities, particularly during the period inwhich this report is being prepared;
(b) Designed such internal control over financial reporting, or caused such internal control over financialreporting to be designed under our supervision, to provide reasonable assurance regarding the reliability offinancial reporting and the preparation of financial statements for external purposes in accordance with generallyaccepted accounting principles;
(c) Evaluated the effectiveness of the company’s disclosure controls and procedures and presented in this reportour conclusions about the effectiveness of the disclosure controls and procedures, as of the end of the periodcovered by this report based on such evaluation; and
(d) Disclosed in this report any change in the company’s internal control over financial reporting that occurredduring the period covered by the annual report that has materially affected, or is reasonably likely to materiallyaffect, the company’s internal control over financial reporting; and
5. The company’s other certifying officer and I have disclosed, based on our most recent evaluation of internalcontrol over financial reporting, to the company’s auditors and the audit committee of the company’s board ofdirectors (or persons performing the equivalent functions):
(a) All significant deficiencies and material weaknesses in the design or operation of internal control overfinancial reporting which are reasonably likely to adversely affect the company’s ability to record, process,summarize and report financial information; and
(b) Any fraud, whether or not material, that involves management or other employees who have a significant rolein the company’s internal control over financial reporting.
/s/ Masaru Kato
Date: July 20, 2012Masaru Kato
Executive Vice President and Chief Financial Officer
Exhibit 13.1
Certification Pursuant to Section 906 of the Sarbanes-Oxley Act of 2002
Pursuant to Section 906 of the Sarbanes-Oxley Act of 2002 (subsections (a) and (b) of Section 1350,Chapter 63 of Title 18, United States Code), each of the undersigned officers of Sony Corporation (the“Company”), does hereby certify, to such officer’s knowledge, that:
The Annual Report on Form 20-F/A for the fiscal year ended March 31, 2012 (the “Form 20-F”) of theCompany fully complies with the requirements of Section 13(a) or 15(d) of the Securities Exchange Act of 1934and information contained in the Form 20-F fairly presents, in all material respects, the financial condition andresults of operations of the Company.
/s/ Kazuo Hirai
Kazuo HiraiChief Executive Officer and President
/s/ Masaru Kato
Masaru KatoExecutive Vice President and Chief Financial Officer
Date: July 20, 2012
Exhibit 15.1(a)
CONSENT OF INDEPENDENT REGISTERED PUBLIC ACCOUNTING FIRM
We hereby consent to the incorporation by reference in the Registration Statements on Form S-8(No. 333-11756, 333-13334, 333-14150, 333-85348, 333-104172, 333-114158, 333-123687, 333-129808, 333-138765, 333-147402, 333-155448, 333-163616, 333-170714 and 333-178115) of Sony Corporation of our reportdated May 31, 2012 relating to the financial statements, financial statement schedule and the effectiveness ofinternal control over financial reporting, which appears in this Annual Report on this Amendment No. 1 on Form20-F/A.
/s/ PricewaterhouseCoopers AarataTokyo, JapanJuly 20, 2012