Embed Size (px)
Citation preview

Sonoma County Department of Agriculture/Weights & Measures133 Aviation Boulevard, Suite 110, Santa Rosa, CA 95403
Phone: (707) 565-2371 Fax: (707) 565-3850Website: www.sonomacounty.ca.gov/AWM
Vision A thriving agricultural industry, healthy community, environment, and economy
Mission To promote and protect agriculture, the health and safety of our community, environment,
and the economy through education and the enforcement of laws and regulations
Agricultural Commissioner/Sealer of Weights & Measures Tony Linegar
Assistant Agricultural Commissioner Sue Ostrom
Chief Deputy Agricultural Commissioner Pete Albers
Chief Deputy Sealer of Weights & Measures Fernando Vasquez
Deputy Agricultural Commissioner Dan Curtin – Priscilla Lane – Andrew Smith
Senior Agricultural Biologist / Standards Specialist Michael Barrett – Travis Howard – Alex McVicker Paul Turano
Agricultural Biologist / Standards Specialist Jordan Ash – Pierpaolo Aymar – Colleen Boe Jessica Cassatt – John Guardino – Beverly Hammond David Jagdeo – Thomas LeClere – Katy McCoy Greg Peters – Daniella Reagan – Cody Wilson
Senior Agricultural Program Assistant
Vineyard Erosion Engineering Technician John Bishop
Environmental Specialist Shelley Janek
Administrative Services O�cer Gina Lehl
Administrative Aide Michelle Johnson
Department Analyst Esther Martinez
Administrative Sta� Jen Charter – Mary Halasz – Collene Hoaglin Sonja Moug – Nina Reeser
Agricultural Program Assistant Anna Ashbeck – Kyle Bradford – David Burtis Kristina Cassidy – Lloyd Cook – Brian Coverston Kim Covington – Kelly Dabney – Christina David
SONOMA COUNTSONOMA COUNTCROP REPORTCROP REPORT
YY


DEPARTMENT OF AGRICULTURE/WEIGHTS & MEASURES
Tony Linegar Agricultural Commissioner
Sealer of Weights & Measures
133 Aviation Blvd., Suite 110 Santa Rosa, CA 95403-8279
(707) 565-2371 Fax (707) 565-3850
sonomacounty.ca.gov/AWM
Karen Ross, Secretary California Department of Food and Agriculture
and
The Honorable Board of Supervisors of Sonoma County: Susan Gorin – First District, Vice Chair James Gore – Fourth District David Rabbitt – Second District, Chair Lynda Hopkins – Fifth District Shirlee Zane – Third District
It is my privilege to present the 2018 Sonoma County Crop Report as prepared pursuant to Section 2279 of the California Food and Agricultural Code. The reported total value for 2018 was $1,106,662,100, which represents a 24% increase from our 2017 value of $894,182,900 and is the first time in history that the gross value of agricultural commodities produced in Sonoma County has exceeded one billion dollars. This report reflects the gross production values, not the net income or costs of production and marketing.
The 2018 winegrape growing season was long and close to ideal with mild temperatures, cool evenings, and dry weather which allowed the crop to fully mature, producing a heavy crop with good flavor and balance. Early October saw a small amount of rain, which initially caused some panic but quickly dried out with timely breezes and warmer temperatures. The value per ton for winegrapes increased by 0.4% to $2,818 per ton. Additionally, tonnage saw a large jump of 34% from 2017 to 275,977 tons. As a result, total winegrape value increased 34.3% compared to 2017 at $777,675,300. This bumper crop was the largest winegrape crop ever harvested in Sonoma County, surpassing the 2013 crop, which had held that distinction by 5,000 tons.
Apples saw a significant increase from 2017 in fresh Gravensteins and late apples. Extended bloom time, more chill hours, and less rain during bloom saw apple tonnage increase by 6% from 2017. Apple prices per ton increased by 3% because of continued demand and premium prices for Gravenstein and organic apples. Overall value of apples increased by 10% compared to 2017.
The value of livestock and poultry products increased slightly by 2% compared to 2017. This increase is largely due to a 20% increase in milk production, despite a 7% decrease in milk value per unit. Wool production increased 17.8% from 2017.
Nursery product value was up 42.6% from 2017. This is attributed to an increase of 74.2% in ornamental sales, and a 27% increase in deciduous fruit and nut trees, cacti, and houseplants. Demand for nursery stock has risen locally as homes are rebuilt and landscapes are replaced, which has been augmented by more water availability as drought conditions have subsided. Increased sales can also be attributed to the opening of a new, large wholesale nursery in the county, as well as the expansion of some existing nurseries.
This year’s crop report honors Sonoma County dairies, highlighting the history and evolution of the dairy industry over the years.
I would like to extend my gratitude and appreciation to all of the agricultural producers whose participation made this report possible. A sincere thank you to Pierpaolo Aymar, Agricultural Biologist, who collected and compiled these statistics, as well as the outstanding staff of the Department of Agriculture/Weights & Measures who contributed to the production of this report.
Respectfully submitted,
Tony Linegar Agricultural Commissioner/Sealer of Weights & Measures
1

2
Photo by Samantha Harmon

TABLE OF CONTENTSLetter to Board of Supervisors 1
Sonoma County Dairy: Evolving with the Times 4
Million Dollar Crops and Nursery Products 8
Winegrape Production — Reds 10
Winegrape Production — Whites 11
Fruit and Nut Summary 12
Apple Production 13
Vegetable, Field Crop, and Apiary Production 14
Livestock and Poultry 17
Recapitulation, Timber, and Fisheries 18
Commodity Exports 19
Agriculture Division Summary 20
Land Stewardship Division Summary 22
Weights & Measures Division Summary 24
Sonoma County Farmers’ Markets 27
Winning Ag Days Essay 28
Department of Agriculture/Weights & Measures Staff 29
3

SONOMA COUNTY DAIRYEVOLVING WITH THE TIMES
In the 1800’s when Mexican land grants were being divided, immigrants that had come to America from Portugal, Italy, Switzerland, and other European countries were able to purchase land they could call their own. Many migrated north of San Francisco, attracted by the mild climate, abundant water, and the verdant, rolling coastal hills of Sonoma County. They recognized that this area would be an ideal place to raise cows and grow their crops.
Early dairymen in Sonoma County usually owned 10-15 cows, or as many as they could milk by hand. Back in those days, the most common breeds were Guernseys and Jerseys, with milk high in butterfat. Milk in the early part of the century was used to make butter and cheese due to the lack of refrigeration. Sonoma County’s butter and cheese were transported to the San Francisco market by schooner down the Petaluma River and later by the North Pacific Railroad.
In 1850, most of the butter and cheese came into San Francisco by ship from Boston, New York, and Chile. The long sea voyage had a detrimental effect on the quality. Local production of cheese at that time depended on milk from Mexican beef cattle. Production was limited but commanded a high price for that day of $1.50 a pound for butter and $0.40 a pound for cheese. The demand increased rapidly with the large influx of people migrating west for the gold rush. Encouraged by such high prices, ranchers imported milk cows to increase local production. By 1860, California had 100,000 milk cows with production focused around areas of high populations in Sacramento and San Francisco. It was at this time that Sonoma County began establishing its reputation for producing quality agricultural products – a reputation that stands to this day.
At one time, there were 800 dairy ranches in Sonoma County. At the turn of the century, as the emphasis shifted from butter and cheese to fluid milk, the majority of Sonoma County dairies moved to the familiar black and white cow known as the Holstein. Holsteins were valued because they were known to be good producers of fluid milk.
4

5
Photo by Petaluma Creamery

As the dairy industry evolved in Sonoma County, there were some significant events that helped shape its future. One of the most significant was the establishment of the Petaluma Cooperative Creamery in 1913, which began to convert raw milk into value added products under the Clover brand in 1916. In the 1950’s under the leadership of Gene Benedetti, Clover expanded into new markets and further developed the brand with the edition of their mascot, “Clo the Cow” in 1969.
Tragedy struck the dairy industry on August 22, 1975 when the Petaluma Cooperative Creamery was destroyed by the largest fire in Petaluma’s history. Although the creamery did not rebuild, in 1977 Gene Benedetti partnered with Al Stornetta who had a Jersey herd and a small glass bottling facility outside of Napa. That was the beginning of Clover Stornetta Farms. In 1991, Clover Stornetta opened its new, state of the art milk processing facilities in Petaluma and went on to become pioneers in the organic dairy market in 1999. Gene would be succeeded by his son, Dan, and eventually his grandson, Marcus, who runs the business today.
For many years, milk production was the number one agricultural commodity in Sonoma County until it fell second to winegrapes in 1987. Dairy farmers in Sonoma County are a very resourceful and adaptive group of people that have evolved their operations in response to a shifting marketplace. Over the past 10-15 years as prices for conventional milk began to fall, many Sonoma County dairy producers began shifting to organic production. Organic milk prices are generally much higher than prices paid per hundredweight for conventional milk. Sometimes organic milk prices are as much as twice that of conventional milk, but are partially offset by increased production costs in an organic operation. Nonetheless, the switch to organic has kept many Sonoma County dairy producers in business.
In addition to switching to organic, many have diversified their operations by planting winegrapes or producing value added products such as butter and cheese.
In 1990, Sonoma County residents created the Sonoma County Agricultural Preservation and Open Space District (District) to permanently protect the greenbelts, scenic viewsheds, farms and ranches, and natural areas of Sonoma County. Through this effort, the District has protected six currently active dairies covering 1,900 acres, and an additional 2,700 acres that provide pasture and heifer replacement services, ensuring that these agricultural lands remain a part of the working landscape of Sonoma County in perpetuity.
Today, there are a total of 56 licensed cow dairies remaining in Sonoma County, 47 of which are certified organic. In addition, Sonoma County also has three sheep dairies, four goat dairies, and one water buffalo dairy that specializes in producing mozzarella cheese, bringing the total number of licensed dairies to 64. The challenges facing Sonoma County dairies today largely revolve around an oversupply of organic milk. Many larger dairies around the state converted to organic in recent years, flooding the market with organic milk and driving prices down. This has been compounded by an expansion of plant based milk alternative products, which have taken up more shelf space in grocery stores. Despite all of the challenges facing today’s dairy producers in Sonoma County, they continue to show their resilience by diversifying, being innovative, and producing more value added products so they can stay on the land and pass down their heritage to the next generation.
6
7
Photo by Petaluma CreameryPhoto by Petaluma Creamery
Photo by Tara Firma by Farms by Cindi Stephan
Photo by Clover Stornetta Farms
Photo by Petaluma Creamery
Photo by Clover Stornetta Farms

MILLION DOLLAR CROPS AND NURSERY PRODUCTS
MIL
LIO
N D
OLL
AR
CRO
PS1 Winegrapes - All $777,675,300
2 Milk $141,249,300
3 Miscellaneous Livestock and Poultry $41,027,300
4 Miscellaneous Livestock and Poultry Products $38,930,800
5 Cattle and Calves $20,727,500
6 Nursery - Ornamentals $20,406,500
7 Nursery - Miscellaneous $18,121,900
8 Sheep and Lambs $11,279,700
9 Vegetables $8,383,100
10 Nursery - Cut Flowers $6,145,800
11 Nursery - Bedding Plants $5,635,900
12 Apples - Late Varieties $2,419,200
13 Rye and Oat Silage Crops $1,494,200
14 Apples - Gravenstein $1,247,900
15 Rye and Oat Hay Crops $1,200,200
Product
Ornamentals
Bedding Plants
Christmas Trees
Cut Flowers
Miscellaneous Products (a)
TOTAL VALUENU
RSER
Y PR
OD
UC
TS
Year
2018201720182017201820172018201720182017
20182017
Quanity
1,671,6001,060,968
228,153150,240
3,5012,575
Unit
plantplantflatflat
unitsunits
Total
$20,406,500$11,717,200$5,635,900$5,078,500$198,100$209,400
$6,145,800$4,174,900
$18,121,900$14,230,800
$50,508,200$35,410,800
(a) includes grapevines, deciduous fruit and nut trees, liners, bulbs, forest seedlings, house plants, orchids, cacti, herbaceous perennials, dried flowers, turf, and wreaths.
8

MILLION DOLLAR CROPS AND NURSERY PRODUCTS
9
Photo by Singing Frog Farms
9

WINEGRAPE PRODUCTION - REDS
Varietal
Cabernet Franc
Cabernet Sauvignon
Carignane
Grenache
Malbec
Mataro/ Mouvedere
Merlot
Petite Sirah
Petit Verdot
Pinot Noir
Sangiovese
Syrah-Shiraz
Zinfandel
TOTAL ALL REDSincluding other reds
Year
20182017
20182017
20182017
20182017
20182017
20182017
20182017
20182017
20182017
20182017
20182017
20182017
20182017
20182017
Non-Bearing
10.635.6
642.3530.4
9.70.0
12.18.0
9.311.3
0.90.9
10.222.6
2.04.2
18.69.9
880.0423.8
0.00.0
3.78.5
24.416.9
1,956.41,658.8
Bearing
565.0565.0
12,505.112,530.9
162.7162.7
150.2153.8
536.0536.0
40.641.6
3,940.83,978.8
685.3688.8
284.3284.3
13,383.613,414.3
211.4316.5
1,557.81,571.7
4,946.64,976.9
39,842.039,996.5
Total Value
$6,537,200$4,610,700
$177,322,500$132,580,200
$1,080,100$694,200
$2,810,800$2,630,000
$7,800,800$5,024,100
$700,400$458,000
$30,394,700$22,327,400
$9,124,300$7,370,000
$4,420,600$2,890,200
$220,538,700$169,953,700
$2,651,200$2,200,900
$11,003,200$8,940,800
$48,800,400$38,706,200
$527,994,600$401,762,100
Total
575.6600.6
13,147.413,061.3
172.4162.7
162.3161.8
545.3548.3
41.542.5
3,951.04,001.4
687.3693.0
302.9294.2
14,263.613,838.1
211.4316.5
1,561.51,580.2
4,971.04,993.9
41,798.441,655.3
Tons
1,832.61,382.4
56,948.243,157.9
406.9260.4
929.0854.7
2,695.11,700.8
216.4158.2
15,492.011,611.1
2,954.52,536.3
1,324.8915.6
58,005.243,439.1
1,070.2916.8
3,966.93,216.5
15,730.612,874.5
163,575.2124,787.5
$/Ton
$3,567.17$3,335.31
$3,113.75$3,071.98
$2,654.55$2,665.76
$3,025.64$3,076.99
$2,894.42$2,953.95
$3,236.82$2,895.20
$1,961.96$1,922.95
$3,088.27$2,905.75
$3,336.84$3,156.58
$3,802.05$3,912.46
$2,477.26$2,400.63
$2,773.75$2,779.67
$3,102.26$3,006.42
$3,227.84$3,219.57
RED VARIETIES TOP 13 BY VALUE - LISTED ALPHABETICALLY
Acreage Production
10
Photo by Department Staff

WINEGRAPE PRODUCTION - REDS
Varietal
Chardonnay
Gewürztraminer
Muscat Blanc/ Muscat Canelli
Pinot Blanc
Pinot Gris
Roussanne
Sauvignon Blanc
Semillon
Viognier
White Reisling
TOTAL ALL WHITESincluding other whites
TOTAL WINEGRAPESincluding all reds and whites
Year
20182017
20182017
20182017
20182017
20182017
20182017
20182017
20182017
20182017
20182017
20182017
20182017
Non-Bearing
566.6353.5
0.00.0
0.00.0
0.00.0
4.24.0
0.00.0
46.7106.0
0.60.6
1.20.7
0.00.0
931.4835.5
2,887.82,494.3
Bearing
15,884.515,906.9
121.1121.1
14.415.4
66.066.0
397.6468.2
30.630.6
2,711.52,645.9
92.098.7
236.6242.0
51.066.5
20,052.219,975.1
59,894.259,971.6
Total Value
$209,033,600$142,579,100
$529,200$451,600
$233,100$307,000
$728,100$518,800
$3,026,000$2,704,500
$365,000$332,900
$33,928,100$27,475,000
$1,044,400$921,700
$1,805,400$1,288,800
$467,000$438,200
$254,556,100$179,971,700
$777,675,300$578,312,900
Total
16,451.116,260.4
121.1121.1
14.415.4
66.066.0
401.8472.2
30.630.6
2,758.22,751.9
92.699.3
237.8242.7
51.066.5
20,983.620,810.6
62,782.062,465.9
Tons
88,311.661,052.3
258.4241.7
113.0131.9
339.4241.7
1,670.01,498.8
124.6102.1
18,918.015,815.2
477.0430.9
691.7500.9
195.3198.0
112,401.781,309.7
275,976.9206,097.2
$/Ton
$2,367.00$2,335.36
$2,047.81$1,868.51
$2,063.11$2,327.32
$2,145.20$2,146.29
$1,811.98$1,804.43
$2,929.74$3,260.35
$1,793.43$1,737.25
$2,189.56$2,138.82
$2,610.02$2,572.92
$2,391.29$2,213.34
$2,264.70$2,213.41
$2,817.90$2,806.02
Acreage Production
WINEGRAPE PRODUCTION - WHITES
WHITE VARIETIES TOP 10 BY VALUE - LISTED ALPHABETICALLY
11

Crop
Apples (all)
Fresh
Processed (a)
Grapes (wine)
Olives
Miscellaneous (b)
TOTALFRU
IT A
ND
NU
T SU
MM
ARY
Year
20182017
20182017
20182017
20182017
20182017
20182017
20182017
Bearing Acres
2,1662,190
59,89459,972
381381
Tons/Acre
4.163.87
4.613.44
Total
$3,667,100$3,336,600
$777,675,300$578,312,900
$678,000$893,800
$411,300$422,300
$782,431,700$582,965,600
(a) includes canned, juice, cider, and vinegar.(b) includes bush-berries, cane-berries, stone fruits, pears, kiwi, tree nuts, strawberries, figs, etc.
TotalTons
9,0078,471
275,977206,097
$/Ton
$407$394
$2,817$2,806
DollarValue
$1,125,992$721,000
$2,537,317$2,615,700
300,000
250,000
200,000
150,000
100,000
50,000
0
2001 2002 2003 2004 2005 2006 2007 2008 2009 2010 2011 2012 2013 2014 2015 2016 2017 2018
White Varieties Red Varieties
TONS OF SONOMA COUNTY GRAPES CRUSHED 2001-2018
12
FRUIT AND NUT SUMMARY
Photo by Cindi Stephan

APP
LE P
ROD
UC
TIO
N
Crop
Gravenstein
Fresh
Processed (a)
Late Apples
Fresh
Processed (a)
TOTAL
Year
20182017
20182017
20182017
20182017
20182017
20182017
20182017
BearingAcres
684704
1,4821,486
2,1662,190
Tons/Acre
4.053.78
4.213.91
4.163.87
Total
$1,247,900$1,092,600
$2,419,200$2,244,000
$3,667,100$3,336,600
TotalTons
2,7732,663
30879
2,4652,584
6,2355,807
380290
5,8555,517
9,0078,471
$/Ton
$450$410
$1,324$1,248
$341$385
$388$386
$1,890$2,142
$290$294
$407$394
DollarValue
$407,792$98,991
$839,367$993,626
$718,200$621,962
$1,697,950$1,621,998
(a) includes canned, juice, vinegar, and cider.
35,000
30,000
25,000
20,000
15,000
10,000
5,000
0
Gravenstein All Other
TONS OF APPLES PRODUCED 2007-2018
13
FRUIT AND NUT SUMMARY APPLE PRODUCTION
2007 2008 2009 2010 2011 2012 2013 2014 2015 2016 2017 2018

14
APIARY PRODUCTS
Total Value (a) 2018 $422,000 2017 $231,000
(a) includes honey, wax, and hives rented for pollination
VEGETABLES
FIELD CROPS
Harvested Crop Year Acreage Dollar Value
Miscellaneous 2018 427 $8,383,100Vegetables (a) 2017 441 $8,448,200
(a) includes crucifers, squash, melons, mushrooms, potatoes, peppers, tomatoes, sprouts, lettuces, hops, etc.
Crop
Hay, Rye and Oat
Hay, Volunteer
Green Chop (a)
Oats, Grain
Silage, Corn (a)
Silage, Rye and Oat (a)
Straw
Miscellaneous (b)
Pasture (c)
Rangeland (c)
TOTAL
Year
20182017
20182017
20182017
20182017
20182017
20182017
20182017
20182017
20182017
20182017
20182017
Harvested Acreage
3,3464,756
780883
1,8161,260
716428
140124
4,8865,015
6,4627,506
312,257315,412
330,403335,383
Tons/Acre
3.52.0
1.43.5
7.04.9
1.31.0
21.427.6
6.1412.1
Total
$1,200,200$1,048,500
$211,800$427,400
$375,100$175,400
$247,400$91,300
$180,000$170,400
$1,494,200$2,995,100
$231,000$99,300
$393,000$223,300
$594,500$683,000
$6,332,600$6,396,600
$11,259,800$12,310,300
Total Tons
11,6529,531
1,8583,053
12,6286,155
976407
3,0003,423
46,98660,876
Unit
tonton
tonton
tonton
tonton
tonton
tonton
acreacre
acreacre
$/Unit
$103.00$110.00
$114.00$140.00
$29.70$28.50
$253.50$224.30
$60.00$49.77
$31.80$49.20
$92.00$91.00
$20.28$20.28
(a) much of the green chop and silage is not sold but used on the farm - value determined by its feed equivalent.(b) includes alfalfa, barley, safflower, wheat, vetch, Sudan, etc.(c) average potential grazing value per acre of forage.
VEGETABLE, FIELD CROP, AND APIARY PRODUCTION
Photo by Redwood Hill Farm Capracopia

VEGETABLE, FIELD CROP, AND APIARY PRODUCTION
15
Photo by Cindi Stephan
Photo by Cindi Stephan
Photo by Tara Firma Farms
Photo by Clover Stornetta Farms
15
Photo by Redwood Hill Farm Capracopia
Photo by Kendall Jackson Estate by Samantha Harmon

16
Photo by Tara Firma Farms

Livestock
Cattle/Calves
Sheep/Lambs
Hogs
Miscellaneous (a)
TOTAL
Year
20182017
20182017
20182017
20182017
20182017
Number of Head
32,61132,442
58,62552,296
1,8231,658
Live Weight
167,036165,892
70,71963,085
4,5594,144
Unit
cwt.cwt.
cwt.cwt.
cwt.cwt.
$/Unit
$124.09$123.00
$159.50$152.61
$72.00$62.91
Total
$20,727,500$20,404,700
$11,279,700$9,627,400
$328,200$260,700
$41,027,300$47,354,900
$73,362,700$77,647,700
LIVESTOCK AND POULTRY
(a) includes chicks, pullets, fryers, roasters, ducks, turkey poults, turkeys, rabbits, goats, etc.
Item
Milk, OrganicMilk, ConventionalTotal Milk
Milk, MarketMilk, ManufacturingTotal Milk
Wool
Miscellaneous (a)
TOTAL
Year
201820182018
201720172017
20182017
20182017
20182017
Production
4,650,456986,020
5,636,476
4,663,0133,798
4,666,811
143,158121,485
Unit
cwt.cwt.cwt.
cwt.cwt.cwt.
lb.lb.
$/Unit
$27.39$14.07
$29.42$32.91
$0.80$0.90
Total
$127,376,000$13,873,300
$141,249,300
$137,185,800$125,000
$137,310,800
$114,500$109,300
$38,930,800$39,749,200
$180,294,600$177,169,300
LIVESTOCK AND POULTRY PRODUCTS
(a) includes market duck eggs, turkey hatching eggs, chicken eggs for consumption, egg by-products, and feathers.
LIVESTOCK AND POULTRY INVENTORY
Item Number
Cattle/Calves (all)* 87,000 Milk cows and heifers (2 years and older) 30,500 Beef cows and heifers (2 years and older) 13,489Sheep/Lambs (all) 44,737Hogs 1,823Laying Hens, Pullets, and Broilers 2,369,657Goats 3,246
* Number of head as of January 1, 2019.17
LIVESTOCK AND POULTRY

18
Year2018
2017
Production19,926,000
14,875,000
Unitboard feet
board feet
Value (a)$8,872,044
$8,109,678
TIM
BER
HA
RVES
T
(a) value of timber immediately before cutting.Source: www.boe.ca.gov/proptaxes/timbertax.htm. Informational only.
CO
MM
ERC
IAL
FISH
LA
ND
ING
S
Source: https://www.wildlife.ca.gov/Fishing/Commercial/Landings#260041493-2016Data listed is most recent information available for commercial fisheries.Informational only.
Species
Crab, Dungeness
Salmon, Chinook
Rockfish, all
Halibut, California
Miscellaneous
Sablefish
Lingcod
Tuna, Albacore
Cabezon
TOTAL
Year
20172016
20172016
20172016
20172016
20172016
20172016
20172016
20172016
20172016
20172016
Pounds
2,775,0673,932,567
130,670103,638
9,9239,004
2,1282,965
338,101234,356
169,907176,056
5,3428,532
12,7055,109
025
3,443,9334,472,252
Value
$10,768,150$12,184,460
$1,199,936$790,271
$18,106$16,711
$15,624$19,245
$347,682$217,655
$579,043$620,185
$20,746$33,568
$299,908$9,752
$0$202
$13,249,195$13,892,049
Apiary Products
Vegetable Crops
Field Crops
Nursery Products
Livestock and Poultry
Livestock and Poultry Products
Fruit and Nut Crops
TOTAL VALUE
REC
API
TULA
TIO
N
2017
$231,000
$8,448,200
$12,310,300
$35,410,800
$77,647,700
$177,169,300
$582,965,600
$894,182,900
2018
$422,000
$8,383,100
$11,259,800
$50,508,200
$73,362,700
$180,294,600
$782,431,700
$1,106,662,100
% Change
82.7%
-0.8%
-8.5%
42.6%
-5.5%
1.8%
34.2%
23.8%
RECAPITULATION, TIMBER, AND FISHERIES
Photo by Steve Knudsen
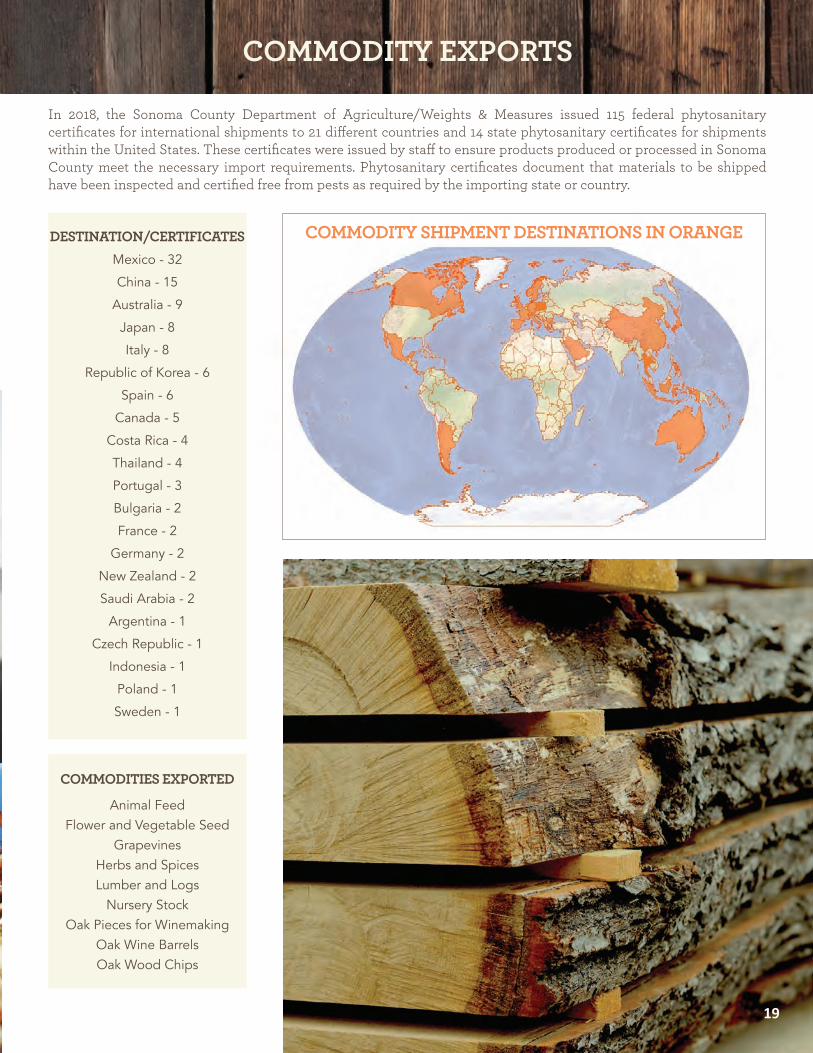
In 2018, the Sonoma County Department of Agriculture/Weights & Measures issued 115 federal phytosanitary certificates for international shipments to 21 different countries and 14 state phytosanitary certificates for shipments within the United States These certificates were issued by staff to ensure products produced or processed in Sonoma County meet the necessary import requirements Phytosanitary certificates document that materials to be shipped have been inspected and certified free from pests as required by the importing state or country
DESTINATION/CERTIFICATESMexico - 32
China - 15
Australia - 9
Japan - 8
Italy - 8
Republic of Korea - 6
Spain - 6
Canada - 5
Costa Rica - 4
Thailand - 4
Portugal - 3
Bulgaria - 2
France - 2
Germany - 2
New Zealand - 2
Saudi Arabia - 2
Argentina - 1
Czech Republic - 1
Indonesia - 1
Poland - 1
Sweden - 1
COMMODITIES EXPORTED
Animal Feed Flower and Vegetable Seed
GrapevinesHerbs and Spices Lumber and Logs
Nursery StockOak Pieces for Winemaking
Oak Wine Barrels Oak Wood Chips
COMMODITY SHIPMENT DESTINATIONS IN ORANGE
15
RECAPITULATION, TIMBER, AND FISHERIES COMMODITY EXPORTS
19
Agriculture is one of the main industries in Sonoma County and it provides a very significant base to the county’s economy The Department accomplishes the promotion and protection of agriculture through educational outreach and enforcement of federal, state, and county regulations
PEST DETECTION TRAPPING PROGRAMOur Division trappers search for pests not known to occur in California The purpose of this program is to detect the presence of pests before they become established over an area so large that eradicating the pest is no longer feasible In 2018, 7,265 traps were placed for the detection of exotic insect pests including Mediterranean, Oriental, and Melon Fruit Flies, Gypsy Moth, Japanese beetle, European Grapevine Moth, and Asian Citrus Psyllid The traps were serviced 88,750 times
The Division also placed 507 traps in nurseries and urban areas for the detection of Glassy-Winged Sharpshooter (GWSS), and serviced those traps 4,944 times There were no GWSS detected in our traps in 2018
PEST EXCLUSION PROGRAMThe goal of our Pest Exclusion Program is to prevent the introduction and spread of exotic weeds, plant diseases, insect pests, or animal pests, which might be harmful to Sonoma County agriculture and our environment To accomplish this goal, the Division inspects incoming plant shipments and rejects infested plant material Staff visit shipping point terminals in the county daily to inspect packages, incoming plant material from out-of-state, nursery stock at nurseries, and vines for vineyard plantings Additionally, inspections are conducted on incoming shipments at feed mills and outdoor household articles from areas known to be infested with Gypsy Moth A total of 587 premise visits occurred in 2018, during which 9,698 shipments of plant material were inspected 34 shipments of plant material were rejected for violations of state and federal quarantines To prevent the spread of GWSS into Sonoma County, Division staff inspected 1,612 shipments of nursery stock arriving from infested counties within California
PESTICIDE USE ENFORCEMENT PROGRAMThe Division performed 126 inspections related to commercial and agricultural pesticide use in Sonoma County These inspections included in-progress inspections of the applicator and application equipment, post-application field worker safety inspections, and employee safety inspections at headquarters to review records and storage areas
In 2018, the Division issued 177 private applicator certificates, 623 operator identification numbers and restricted material permits for agricultural pesticide use, reviewed 187 notices of intent for restricted materials, registered 288 agricultural or structural pest control businesses, 68 pest control advisors, 99 farm labor contractors, and completed 30 investigations for suspected pesticide illnesses or complaints
16
AGRICULTURE DIVISION SUMMARY
20

21
EXOTIC/INVASIVE PEST SPECIES INTERCEPTEDLight Brown Apple Moth Elongate Hemlock Scale Sudden Oak DeathEpiphyas postvittana Fiorinia externa Phytophthora ramorumVine Mealybug Red Imported Fire Ant Quack grassPlanococcus ficus Solenopsis invicta Elymus repensRapacious Panther Ant Tropical Tramp Ant Gall Forming ThripsPachycondyla harpax Monomorium subopacum Androthrips spp.S American Leaf-Cutter Ant Carpenter Ant Tropical AntAtta spp. Camponotus spp. Technomyrmex spp.
In 2018, the Agriculture Division:• Inspected over 3 2 million chicken eggs for defects via representative sampling
• Issued 115 federal phytosanitary documents for international shipments and 14 state phytosanitary documents for domestic shipments to promote the movement of Sonoma County agriculture commodities
• Diverted 23,700 pounds of plastic containers from the landfill through the Division’s two recycling events with approximately 130 participating growers
• Surveyed over 1,100 Sonoma County producers in preparation for the 2018 Agricultural Crop Report
• Conducted 18 continuing education sessions reaching over 730 attendees
• Inspected 105 nursery growing areas, totaling more than 275 acres
• Inspected 26 shipments of household articles for the presence of Gypsy Moth
• Issued 126 certified producer certificates and 24 farmers’ market certificates for a total of 27 certified farmers’ markets
• Conducted investigations on five organic operators in the county, performed site inspections on 14 organic producers, inspected 32 organic producers at certified farmers’ markets, and collected 10 samples of organic produce for residue testing
ORGANIC PRODUCTION Beginning January 1, 2017, changes to the Organic Food and Farming Act no longer require organic registrants in California to provide detailed commodity information and acreage to the state upon initial registration or during renewal Before these changes, the state and its counties had been collecting detailed information on specific crop commodities, their acreage, and associated value This allowed counties to evaluate the contribution of organic agriculture to the overall county economy and to ascertain the ratio of organic to conventional acreage The total production acreage is now reported by registrant rather than by commodity Due to these changes, the Department can only report on the total organic acreage farmed in Sonoma County There are 297 organic registrants farming approximately 56,972 acres throughout the county This acreage figure may be inflated as much of this acreage experiences multiple cropping cycles per year For more information on the Organic Food and Farming Act, please visit the California Department of Food and Agriculture’s State Organic Program website at https://www cdfa ca gov/is/i_&_c/organic html
TRANSGENIC CONTAMINATION PREVENTION ORDINANCEThe Transgenic Contamination Prevention Ordinance (GMO Ordinance) took effect November 9, 2016 The purpose of the GMO Ordinance is to protect Sonoma County’s native plants, trees, and animals from transgenic contamination by genetically engineered organisms, sometimes referred to as “GMOs ” The GMO Ordinance assigns our Department as the enforcement agency and makes it unlawful for any person, partnership, corporation, or entity of any kind to propagate, cultivate, raise, or grow genetically engineered organisms in the unincorporated portions of Sonoma County In 2018, there were no complaints or investigations conducted related to the GMO Ordinance
AGRICULTURE DIVISION SUMMARY

The Land Stewardship Division oversees the issuance of vineyard and orchard development permits, agricultural grading and drainage permits, frost protection system registrations within the Russian River watershed, enforces county-wide riparian corridor protections, and serves on the Sonoma County Project Review and Advisory Committee
In 2018, the Land Stewardship Division:• Used the newly created Land Steward’s Guide to Vineyard and Orchard Erosion Control as an aid to help educate
property owners and managers control erosion in areas affected by the Sonoma Complex fires of 2017
• Worked with Regional Water Quality Control Boards and stakeholders to streamline process by which new vineyards in Sonoma Creek watershed can be in compliance with both local and state regulations
• Reviewed a total of 180 vineyard/orchard development projects representing a 10% increase in projects from 2017 Of the 71 new projects, 37 were Level I and 34 were Level II Of the 109 replant projects, 91 were Level I and 18 were Level II
• Regulated 498 frost protection systems within the Russian River watershed, including registering three new systems
VINEYARD AND ORCHARD DEVELOPMENTThe Vineyard Erosion and Sediment Control Ordinance (VESCO) was originally adopted by the Sonoma County Board of Supervisors in 2000 Prior to developing and planting or replanting a vineyard or orchard, an application and plans are reviewed for approval by the Department of Agriculture/Weights & Measures The purpose of the ordinance is to assist in preventing soil erosion and to protect water quality and other natural resources
Through the administration of VESCO standards, the dedicated Division staff ensure that vineyards and orchards are developed in a manner that minimizes erosion and protects sensitive habitats The Division is also working with local Regional Water Quality Control Boards to help the agricultural community meet upcoming State Water Board requirements by leveraging ongoing practices designed to protect water quality
LAND STEWARDSHIP DIVISION SUMMARY
22
Photo by Google Earth
Photo by Department Staff

New Replants
PROJECTS SUBMITTED
Year2006200720082009201020112012201320142015201620172018
Projects49456124101935412538384937
Acreage544419
1,15715082132327580307278434836302
Projects1321272013811232215222234
Acreage1511152723777586589467321117306253523
Projects781009757516750807668727391
Acreage785
1,0011,1101,046783769633
1,2421,546680
1,128949
1,231
Projects6445044775132018
Acreage472222880
1503510810394301226272
Total62668844232746644753607171
Total695534
1,429527157218916
1,047628395740
1,089825
Total84104101625171548783738593109
Total832
1,0231,1321,134783919668
1,3501,649774
1,4291,1751,503
Projects1461701891067498100151130126145164180
Acreage1,5271,5572,5611,661940
1,1371,5842,3972,2771,1692,1692,2642,328
Level I Level II Projects Acreage Level I Level II Projects Acreage
Total
23
LAND STEWARDSHIP DIVISION SUMMARY
1,800
1,600
1,400
1,200
1,000
800
600
400
200
02006 2007 2008 2009 2010 2011 2012 2013 2014 2015 2016 2017 2018
New Projects Replant Projects New Acreage Replant Acreage
ACREAGE AND PROJECTS PER YEAR 2006-2018
180
160
140
120
100
80
60
40
20
0
Acr
es
Num
ber o
f Pro
ject
s

24
The Weights & Measures Division is committed to protecting the economic wellbeing of Sonoma County residents by preserving their confidence in the accuracy of the weighing and measuring instruments, product-labeling standards, pricing standards, and business practices in our local economy The Division protects the economic interest of Sonoma County buyers and sellers by enforcing state and local laws, and through administering the following programs
DEVICE INSPECTION PROGRAMLocal consumers purchase many essential goods and services over “commercial devices ” A commercial device is by law defined as “…any approved device used in determination of the weight, measure, or count of any commodity or thing which is sold on the basis of weight, measure, or count upon which determination of a charge for service is based ” The accuracy and proper application of these devices is crucial in ensuring fairness in the marketplace Division staff registers and inspects all commercial devices used in Sonoma County In 2018, the Division registered over 34,525 commercial devices and inspected 11,830 of these devices
PRICE VERIFICATION PROGRAMIn 2006, Sonoma County enacted a county ordinance requiring the registration of local retailers that use an automated point-of-sale system used to determine the prices they charge at the register (commonly called “scanners”) Division staff conducts annual price verification inspections at these retailers to determine if they are meeting the pricing accuracy standards set forth in the ordinance Retailers that overcharge their customers fail the inspection and are subject to administrative penalties and re-inspections
PACKAGED COMMODITIES PROGRAMUnder the Federal Fair Packaging and Labeling Act, packaged commodities offered for sale are required to conform to labeling standards Packaged products must contain a label that identifies three main things: the identity of the commodity that declares the contents in the package, a responsibility statement that identifies who packaged the commodity, and a quantity statement that declares how much product is in the package These three basic labeling requirements allow consumers to make value comparisons Division staff audits packaged commodities at local retailers to determine the packer’s compliance with labeling requirements and to ensure that the net weight statement accurately reflects the quantity
PETROLEUM PROGRAMTo guard against false or misleading advertisement claims or ambiguous product labeling, the Division ensures that local service station owners selling retail motor fuels comply with state advertising and labeling laws Labeling at the fuel dispenser must clearly identify the product, grades, octane, gallon price, and computed price
CONSUMER COMPLAINTSIn 2018, the Division investigated over 60 consumer complaints filed with our office These consumer complaints included reported price overcharges at local retailers, short firewood deliveries, short-measured bulk deliveries of gardening soils and landscaping materials, and improper utility billing at local mobile home parks
WEIGHTS & MEASURES DIVISION SUMMARY

21
WEIGHTS & MEASURES DIVISION SUMMARY
25
In 2018, the Weights & Measures Division:• Registered over 1,700 local businesses and commercial device owners operating over 34,000 commercial
devices 11,830 of these devices were inspected, including:
- 2,634 retail fuel meters - 567 utility electric meters - 320 winery dormant scales
- 1,170 grocery store scales - 16 livestock scales - 170 farm market scales
- 1,334 utility water meters - 54 winery vehicle scales - 83 taxi meters
- 647 utility gas meters - 134 winery crane scales
• Performed over 800 price verification inspections at local retailers
• Price checked 20,965 items of which 1 6% of items were over-charged
• Issued 101 notices of violation against retailers for over-charging errors
• Issued 39 administrative penalties against retailers for failing price accuracy inspections
Photo by Department Staff
25

26
Photo by Bohemian Creamery by Dawn Heumann
26

27
BODEGA BAY2255 Highway 1May – OctoberSunday, 10:00 am – 2:00 pm
COTATILa Plaza ParkJune – AugustThursday, 4:30 pm – 7:30 pm
FORESTVILLE6990 Front StreetJune – September Tuesday, 4:00 pm – 7:30 pm
GUERNEVILLE - RUSSIAN RIVER16290 5th StreetJune – September Thursday, 3:00 pm – 7:00 pm
HEALDSBURGVine Street and North StreetMay – NovemberSaturday, 8:30 am – 12:00 pmPlaza Street and Healdsburg AvenueMay – SeptemberTuesday, 9:00 am – 1:00 pm
OCCIDENTAL - BOHEMIANMain Street b/w 1st and 3rd StreetJune – October Friday, 4:00 pm – 7:30 pm
PETALUMA - EAST SIDELucchesi ParkJanuary – December Tuesday, 10:00 am – 1:30 pm
PETALUMA - EVENING2nd Street b/w B and D StreetJune – August Wednesday, 4:30 pm – 8:00 pm
PETALUMA - WALNUT PARKWalnut ParkMay – November Saturday, 2:00 pm – 5:00 pm
ROHNERT PARK500 City Center DriveJune – August Friday, 5:00 pm – 8:00 pm
SANTA ROSA - COMMUNITY1351 Maple AvenueJanuary – December Wednesday and Saturday8:30 am – 1:00 pm
SANTA ROSA - DOWNTOWN600 and 700 blocks of 4th StreetMay – August Wednesday, 5:00 pm – 8:30 pm
SANTA ROSA - OAKMONTOakmont Drive and White Oak DriveJanuary – December Saturday, 9:00 am – 12:00 pm
SANTA ROSA - ORIGINAL50 Mark West Springs RoadJanuary – December Wednesday and Saturday8:30 am – 1:00 pm
SANTA ROSA - WIC1450 Guerneville RoadJuly – September Thursday, 8:30 am – 1:00 pm
SEBASTOPOL6901 McKinley StreetJanuary – DecemberSunday, 10:00 am – 1:30 pm
SONOMA - SONOMA VALLEYArnold FieldJanuary – December Friday, 9:00 am – 12:30 pm
SONOMA - THE SPRINGSBoyes Boulevard at Highway 12June – DecemberSunday, 10:00 am – 2:00 pm
SONOMA - VALLEY OF THE MOONSonoma Town PlazaMay – September Tuesday, 5:30 pm – Dusk
WINDSORWindsor Town GreenApril – December Sunday, 10:00 am – 1:00 pm May – SeptemberThursday, 5:00 pm – 8:00 pm
SONOMA COUNTY FARMERS’ MARKETS

28
FIT BITS FOR COWSBy Rya Culley
Proctor Terrace Elementary
3rd Grade Class
There are many cool ways that technology helps farmers. One way technology helps farmers is using fitbits to help cows. Cows can wear trackers around their neck or attached to their ear. Trackers allow farmers to manage large numbers of animals from their phone or computer. Fitbits use monitors to track the cow’s activity and temperature. Trackers can also monitor how many steps an animal takes, milk production, weight, and how much she chews. The data is gotten through the cloud in text messaged back to the farmer so they can better detect disease.
Fitbits can help farmers spot sick animals sooner. Trackers help farmers detect when a cow becomes sick and allows the farmer to separate the sick animals from the healthy ones. If they are put all together then the healthy ones would get sick too. Fitbits help farmers make sure their cows stay healthy.
Ag Days is a Sonoma County tradition The Sonoma County Farm Bureau sponsors the annual two day event, which is a celebration of Sonoma County agriculture and the rich heritage that continues to define a way of life for Sonoma County residents Ag Days offer an opportunity for thousands of schoolchildren to learn about farming and where their food comes from, allowing them to connect with the farms and ranches that blanket the county An essay writing contest is one of many farm-themed contests held each year, including posters, murals, scarecrow building, and farm photography Following is the winning Ag Days Essay The 2018 theme was Technology on the Farm
WINNING AG DAYS ESSAY

29
Vision A thriving agricultural industry, healthy community, environment, and economy
Mission To promote and protect agriculture, the health and safety of our community, environment,
and the economy through education and the enforcement of laws and regulations
Agricultural Commissioner/Sealer of Weights & Measures Tony Linegar
Assistant Agricultural Commissioner Sue Ostrom
Chief Deputy Agricultural Commissioner Pete Albers
Chief Deputy Sealer of Weights & Measures Fernando Vasquez
Deputy Agricultural Commissioner Dan Curtin – Priscilla Lane – Andrew Smith
Senior Agricultural Biologist / Standards Specialist Michael Barrett – Travis Howard – Alex McVicker Paul Turano
Agricultural Biologist / Standards Specialist Jordan Ash – Pierpaolo Aymar – Colleen Boe Jessica Cassatt – John Guardino – Beverly Hammond David Jagdeo – Thomas LeClere – Katy McCoy Greg Peters – Daniella Reagan – Cody Wilson
Senior Agricultural Program Assistant Maggie Furlong
Wildlife Specialist Jeff Furlong – Justin Felton
Agriculture & Vineyard Conservation Coordinator Andy Casarez
Vineyard Erosion Engineering Technician John Bishop
Environmental Specialist Shelley Janek
Administrative Services Officer Gina Lehl
Administrative Aide Michelle Johnson
Department Analyst Esther Martinez
Administrative Staff Jen Charter – Mary Halasz – Collene Hoaglin Sonja Moug – Nina Reeser
Agricultural Program Assistant Anna Ashbeck – Kyle Bradford – David Burtis Kristina Cassidy – Lloyd Cook – Brian Coverston Kim Covington – Kelly Dabney – Christina David Janice Griffin – Rachel Horton – Bryan O’Malley Noah Macchia – Jeff Menacho – Michelle Nozzari Rich Svetlecic – Tim Van Deren – Jody Vent Ben Walker – Connor Wirtz
Assistant Agricultural CommissionerSue Ostrom
Chief Deputy Agricultural CommissionerPete Albers
Chief Deputy Sealer of Weights & MeasuresFernando Vasquez
Deputy Agricultural CommissionerDan Curtin Priscilla Lane Andrew Smith Paul Turano
Senior Agricultural Biologist / Senior Standards SpecialistMichael Barrett Travis Howard Alex McVicker
Agricultural Biologist / Standards SpecialistJordan Ash Pierpaolo Aymar Colleen BoeJessica Cassatt John Guardino Beverly HammondDavid Jagdeo Thomas LeClere Katy McCoyGreg Peters Daniella Reagan Cody Wilson
Senior Agricultural Program AssistantMaggie Furlong
Wildlife SpecialistJeff Furlong Gary Johnson
Agriculture & Vineyard Conservation CoordinatorAndy Casarez
Vineyard Erosion Engineering TechnicianJohn Bishop
Environmental SpecialistShelley Janek
Administrative Services OfficerGina Lehl
Administrative AideMichelle Johnson
Department AnalystEsther Martinez
Administrative Support StaffJen Charter Mary Halasz Collene HoaglinSonja Moug Nina Reeser
Agricultural Program AssistantAnna Ashbeck Nick Billesback Kyle BradfordDavid Burtis Kristina Cassidy Lloyd CookBrian Coverston Kim Covington Kelly DabneyChristina David Janice Griffin Colby HillsRachel Horton Lynn Krausmann Jeff MenachoNoah Macchia Bryan O’Malley Taylor RamosRich Svetlecic Tim Van Deren Jody VentConnor Wirtz
VISIONA thriving agricultural industry, healthy community, environment, and economy
MISSIONTo promote and protect agriculture, the health and safety of our community, environment,
and the economy through education and the enforcement of laws and regulations
AGRICULTURAL COMMISSIONER / SEALER OF WEIGHTS & MEASURESTony Linegar
WINNING AG DAYS ESSAY DEPARTMENT STAFF

Sonoma County Department of Agriculture/Weights & Measures133 Aviation Boulevard, Suite 110, Santa Rosa, CA 95403
Phone: (707) 565-2371 Fax: (707) 565-3850Website: www.sonomacounty.ca.gov/AWM
Vision A thriving agricultural industry, healthy community, environment, and economy
Mission To promote and protect agriculture, the health and safety of our community, environment,
and the economy through education and the enforcement of laws and regulations
Agricultural Commissioner/Sealer of Weights & Measures Tony Linegar
Assistant Agricultural Commissioner Sue Ostrom
Chief Deputy Agricultural Commissioner Pete Albers
Chief Deputy Sealer of Weights & Measures Fernando Vasquez
Deputy Agricultural Commissioner Dan Curtin – Priscilla Lane – Andrew Smith
Senior Agricultural Biologist / Standards Specialist Michael Barrett – Travis Howard – Alex McVicker Paul Turano
Agricultural Biologist / Standards Specialist Jordan Ash – Pierpaolo Aymar – Colleen Boe Jessica Cassatt – John Guardino – Beverly Hammond David Jagdeo – Thomas LeClere – Katy McCoy Greg Peters – Daniella Reagan – Cody Wilson
Senior Agricultural Program Assistant
Vineyard Erosion Engineering Technician John Bishop
Environmental Specialist Shelley Janek
Administrative Services O�cer Gina Lehl
Administrative Aide Michelle Johnson
Department Analyst Esther Martinez
Administrative Sta� Jen Charter – Mary Halasz – Collene Hoaglin Sonja Moug – Nina Reeser
Agricultural Program Assistant Anna Ashbeck – Kyle Bradford – David Burtis Kristina Cassidy – Lloyd Cook – Brian Coverston Kim Covington – Kelly Dabney – Christina David
SONOMA COUNTYSONOMA COUNTYCROP REPORTCROP REPORT