Embed Size (px)
Citation preview

Characterizing!Sonic!Anisotropy!for!Geomechanics!and!Geophysics!Applications:!
Case!Study!in!Forties!Field,!UK
Donald!Keir!(Apache),!Adam!Donald*,!Andrea!Paxton,!Ed!Knight!(Schlumberger)
DEVEX!Conference!May!13th ,!2009

Presentation!Outline
• Motivation
• Background
• Workflow
• Single!well!analysis
• Multi"well!analysis
• Conclusions
Forties!Field

Development!of!Mature!Fields• Reducing!drilling!costs!– losses,!pack"offs,!NPT
• Optimum!well!placement!– target!selection!using!seismic!
Wellbore!Stability!Predictions Seismic!Interpretation
0.7!!!!!!!!!!!!!Mud!Weight!!!!!!!!!!!2.2
PP Collapse Losses

Reducing!Uncertainties
• Low!confidence!in!well!–seismic!ties!&!AVO!analysis
• Drilling!challenges!for!landing!casing!above!reservoir!
• Sonic!logs!required!for!input!to!geomechanical &!geophysical models
• Initial!observation!by!petrophysics!is!inconsistentDT!compressional!&!DT!shear
Inclination (degrees)0 16 30 46 60 76 8060
80
100
120
140
180
DT
(us/
ft)
DT!Compressional!displays!decreasing!slowness!with!wellbore!inclination!across!9!wells!in!the!Sele!
Formation!from!the!Forties!Field
Multi"well!comparison
Red!– 1!Degree
Green!– 41!Degrees
Blue!– 61!Degrees
Fast Direction
Slow
Dire
ctio
n
Anisotropy!in!Shale:!Geophysics
Input!to!AVO!analysis,!seismic!calibration
Sele!Fm
Balder!Fm
FortiesAbandonmentUnit
Require!Thomsen!parameters:
!"#$"#%
140!!!!!!!!!DT!!!!!!!!!!!40
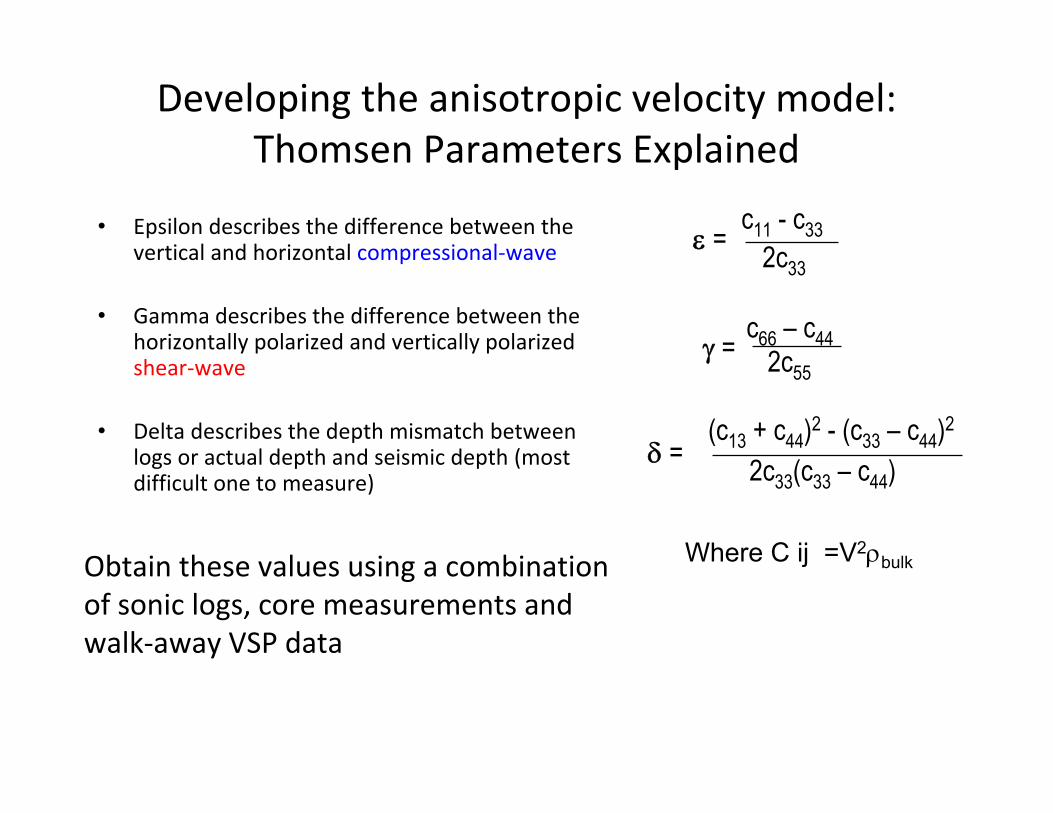
Developing!the!anisotropic!velocity!model:!Thomsen!Parameters!Explained
• Epsilon!describes!the!difference!between!the!vertical!and!horizontal!compressional"wave!
• Gamma!describes!the!difference!between!the!horizontally!polarized!and!vertically!polarized!shear"wave
• Delta!describes!the!depth!mismatch!between!logs!or!actual!depth!and!seismic!depth!(most!difficult!one!to!measure)
! =c11 - c33
2c33
% =c66 – c44
2c55
$ =(c13 + c44)
2 - (c33 – c44)2
2c33(c33 – c44)
Where C ij =V2&bulkObtain!these!values!using!a!combination!of!sonic!logs,!core!measurements!and!walk"away!VSP!data

Anisotropy!in!Shale:!GeomechanicsSonic!DT’s!are!affected!by!
bedding!planes
Brevik et al., 2007, TLE
Computation!of!rock!mechanical!properties!vary!with!orientation
Strength
UCS
Stiffness
Young’s!Modulus
Poisson’s!Ratio

Integrated!Project!Workflow
• Single!well!study– Determine!anisotropy!parameters!from!full!core,!sonic!&!VSP!measurements
• Multi"well!study– Integrate!field!wide!compressional!and!shear!data!to!calibrate!parameters!and!account!for!field!heterogeneity
• Correct!all!logs!in!the!field!for!anisotropy!effects!in!Sele!and!input!to!geomechanical!and!geophysical!models
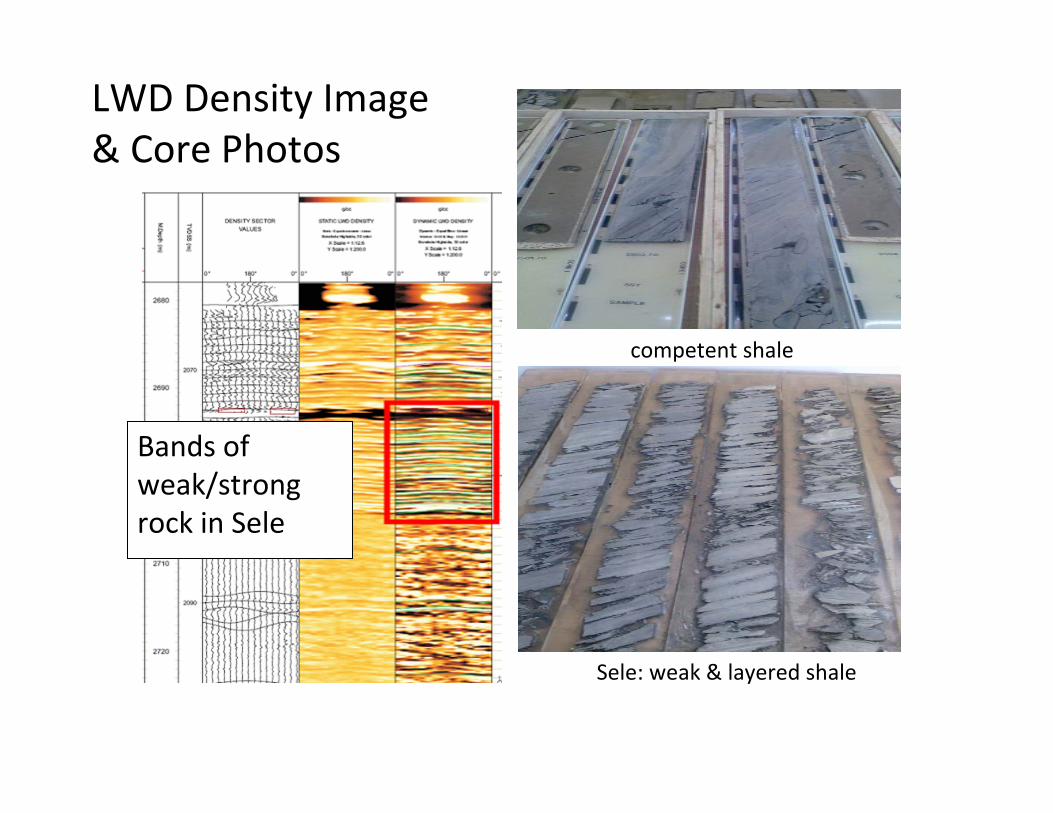
Bands!of!weak/strong!rock!in!Sele
competent!shale
Sele:!weak!&!layered!shale
LWD!Density!Image!&!Core!Photos
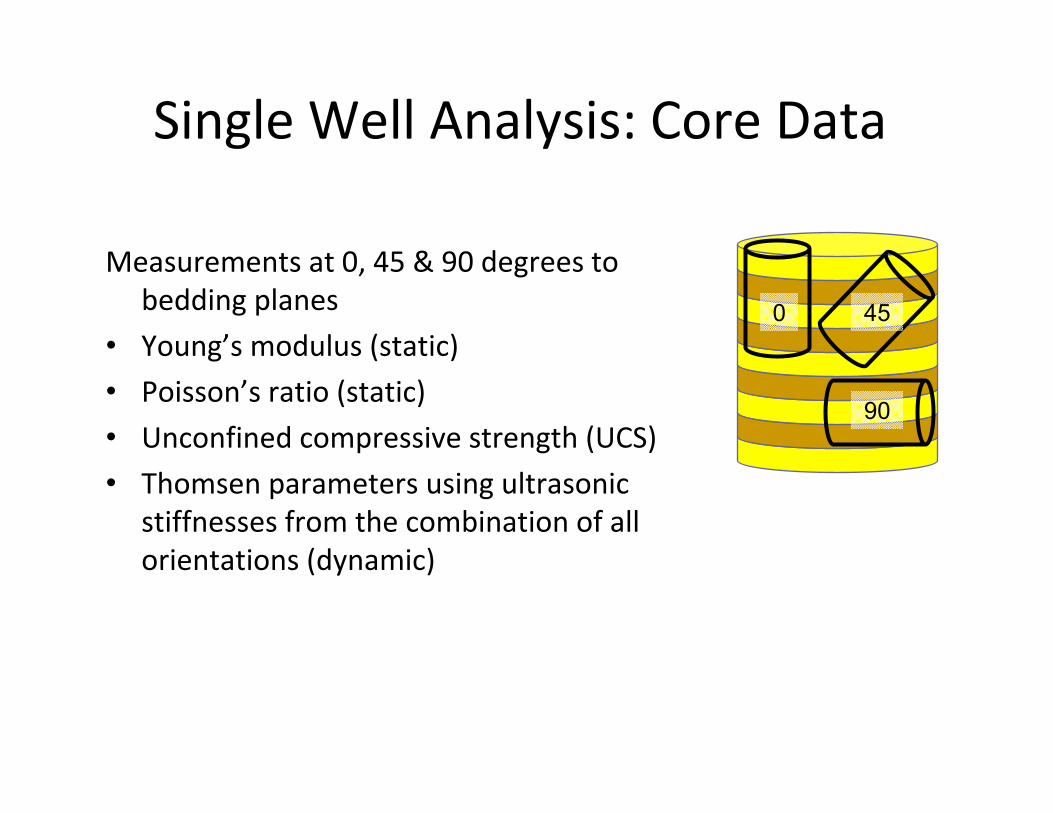
Single!Well!Analysis:!Core!Data
Measurements!at!0,!45!&!90!degrees!to!bedding!planes
• Young’s!modulus!(static)
• Poisson’s!ratio!(static)
• Unconfined!compressive!strength!(UCS)
• Thomsen!parameters!using!ultrasonic!stiffnesses!from!the!combination!of!all!orientations!(dynamic)
0 45
90

Ultrasonic!Core!Data:!!"#% &!$
• Comparison!with!published!core!data!for!reference
0.3200.140.272702
"0.0140.190.232699
"0.2160.130.112696
$%!Depth!(mD)
Taken!from!Sayers!(2005),!Geophysical!Prospecting
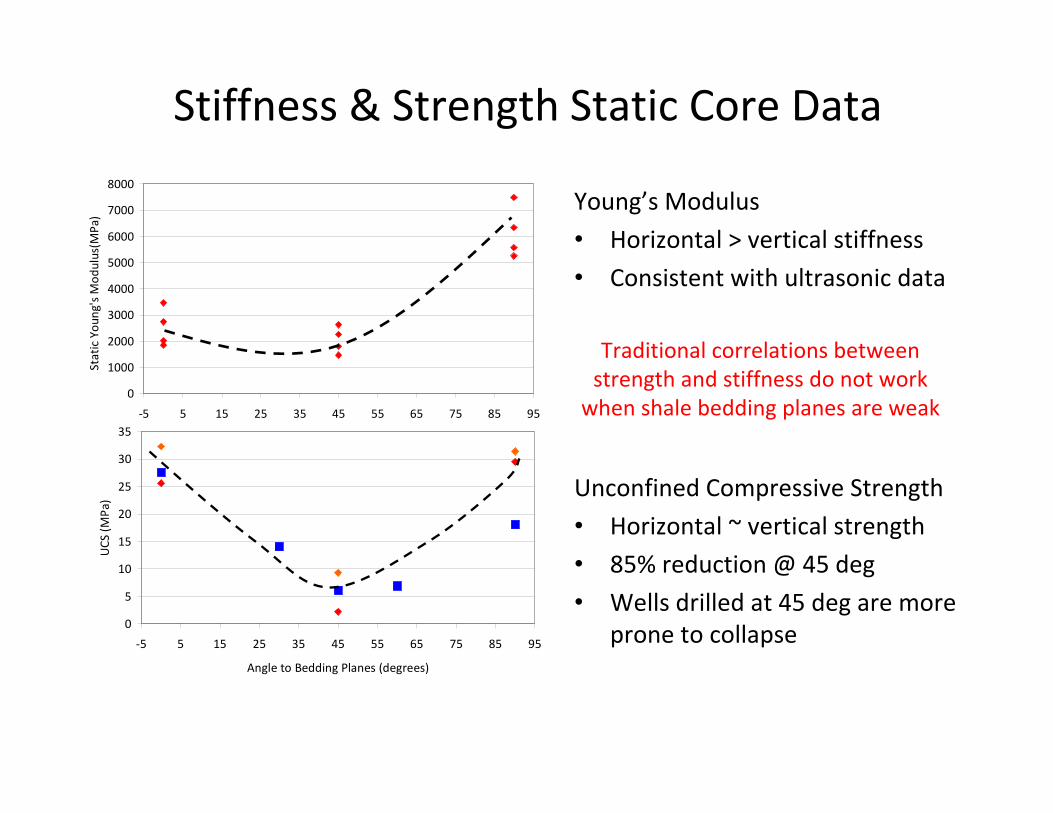
Stiffness!&!Strength!Static!Core!Data
0
1000
2000
3000
4000
5000
6000
7000
8000
"5 5 15 25 35 45 55 65 75 85 95
Orientation!to!Bedding
Static!You
ng's!M
odulus(M
Pa)
0
5
10
15
20
25
30
35
"5 5 15 25 35 45 55 65 75 85 95
Angle!to!Bedding!Planes!(degrees)
UCS!(M
Pa)
Unconfined!Compressive!Strength
• Horizontal!~!vertical!strength
• 85%!reduction!@!45!deg
• Wells!drilled!at!45!deg!are!more!prone!to!collapse
Young’s!Modulus
• Horizontal!>!vertical!stiffness
• Consistent!with!ultrasonic!data
Traditional!correlations!between!strength!and!stiffness!do!not!work!when!shale!bedding!planes!are!weak

3D!Anisotropy!from!Sonic:!%• Shear!derived!from!dipole!
and!Stoneley!waveforms
• DT!shear!measured!along!borehole!axis!&!rotated!to!bedding!plane!axis
• C66!~!SH &!C44!~!SV!% =!0.6!"0.7
Higher!than!ultrasonic!core!values,!difference!associated!to!stress!effects!
Sele!Fm.!C66>C44

Multi"Offset!VSP:!! &!$
• Slowness!/!Polarization!Inversion
• Best!fit!model! =!0.254$ =!0.006
Consistent!with!ultrasonic!core!values

Multi"well!Study!Workflow
1. Identify!all!logs!with!processed!compressional!(125)!&!shear!(9)2. Take!average!shear!and!compressional!slowness!across!the!Sele!Fm3. Plot!slowness!(P&S)!against!relative!dip!with!anisotropic!velocity!model!
(Norris!&!Sinha,!1993)4. Calibrate!the!anisotropy!parameters!(!"#$"#%)!using!the!multi"well!data5. Apply!the!calibrated!parameters!and!apply!to!all!logs!to!obtain!P&S!
values!for!vertically!propagating!waves
Example!of!phase!slowness!curves!for!the!Bakken!Shale!formation
Illustrates!variation!in!SV,!SH &!P!slownesses!as!a!function!of!relative!dip

Forties!Bravo!Platform:!Compressional!Phase!DT
! =!0.28,!$ =!0!using!multi"well!data
! =!0.254,!$ =!0.006!using!VSP!data
! =!0.21,!$ =!0.03!using!average!core!data
High!confidence!in!! and!$ for!Bravo!platform
Same!method!applied!across!field!with!similar!results
80
90
100
110
120
130
140
150
160
0 10 20 30 40 50 60 70 80 90 100
Relative!dip!(degrees)
Ave
rage
!DT!Co
mpression
al!(u
s/ft)
Average DTc’s in Sele
Anisotropic DTc Velocity Model

Forties!Field:!P!&!S!Phase!Slownesses
• Multi"well!calibration!of!% ~!0.7!for!9!wells
• Consistent!with!shear!sonic!log!from!Bravo
• Lower!confidence!with!shear!due!to!lower!data!concentration!&!extrinsic!effects!such!as!stress!
Phase Slowness Curves
50
100
150
200
250
300
350
0 10 20 30 40 50 60 70 80 90
Relative dip (degrees)
Aver
age
shea
r slo
wne
ss (u
s/ft)
100
115
130
145
160
175
190
Ave
rage
com
pres
sion
al s
low
ness
(u
s/ft)
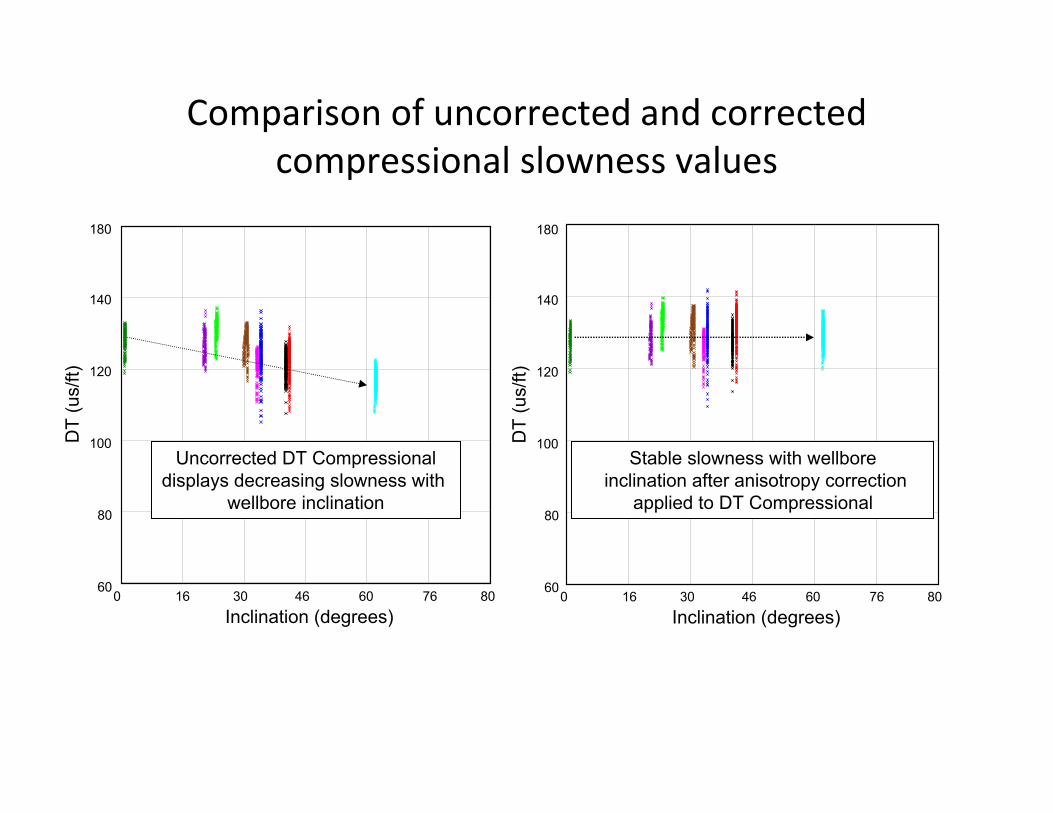
Comparison!of!uncorrected!and!corrected!compressional!slowness!values
Inclination (degrees)0 16 30 46 60 76 80
60
80
100
120
140
180
DT
(us/
ft)
Uncorrected DT Compressionaldisplays decreasing slowness with
wellbore inclination
180
DT
(us/
ft)
Inclination (degrees)0 16 30 46 60 76 80
60
80
100
120
140
Stable slowness with wellboreinclination after anisotropy correction
applied to DT Compressional

Summary
• Combination!of!single!&!multi"well!data!to!develop!a!field!wide!anisotropic!velocity!model!for!the!Sele!Fm
• Compressional!data!well!constrained,!more!uncertainty!with!the!shear!data
• Update!calibration!of!seismic!ties!and!refine!wellbore!stability!models

Acknowledgements
• Thanks!to!Apache!for!permission!to!publish
• Klaas Koster,!Brett!McIntyre!with!Apache!
• Wes!Martin!at!TerraTek!in!Salt!Lake!City,!US
• Tom!O’Rourke,!Anzar Syed,!Chang!Liu!with!Schlumberger


![BRAE-FORTIES PIPELINE SYSTEM PIPELINE LIQUIDS … · 2017-12-12 · Brae-Forties PLTA Section 1 August 2012 AGREEMENT FOR THE TRANSPORTATION OF [FIELD X] PIPELINE LIQUIDS . THIS AGREEMENT](https://img.pdfslide.us/doc/110x75/5cebc41a88c993886b8d440a/brae-forties-pipeline-system-pipeline-liquids-2017-12-12-brae-forties-plta.jpg)