Embed Size (px)
Citation preview
Annual Report
Sona Koyo Steering Systems Ltd.
2010~11

1
Contents
Chairman's LetterVice Chairman & Managing Director's LetterBoard of DirectorsManagement Discussion and AnalysisCorporate Governance ReportAdditional Shareholder InformationDirectors' ReportAuditors' ReportFinancialsAuditors' Report (Consolidated)Financials (Consolidated)
246816293741446970
Chairman’s Letter
3
Dear Shareholders,
In 2010-11, Sona Koyo Steering Systems Ltd. realized another milestone in its history by surpassing the Rs 1000 crore mark and achieved a Sales Turnover of Rs 1032 crore. With all its subsidiary Companies now commencing full year production, Sona Koyo Group on a consolidated basis posted a Sales Turnover of Rs 1203 crore. This reflects a 21% growth in sales on standalone basis and 41% on consolidated basis. The group also recorded higher net profit of Rs 44.63 crore on consolidated basis. Your company is committed to exceed Customer expectations by consistently providing high quality products. Management focus towards improving capacity utilization and value addition per employee, supported by strong market demand has helped the Company to achieve significant growth in turnover and profitability.
The global economy continues to recover at a slow pace than the forecast, while the emerging markets are beating the forecast growth. India is witnessing excellent growth and is expected to be a 5 million passenger vehicle market by 2015. India is now home to all the major Global Automotive Companies, which provide the Indian Automotive Components Companies good opportunities for growth. The auto component industry will epand both due to growth in domestic demand as well as International demand for its Indian OEMs.
India is most likely to be one of the fastest growing automobile markets, and perhaps the third largest, in terms of domestic market volumes, by 2020. The growth trajectory in automobiles in India was high, in double digits, during the past decade partly because of the acceleration in economic growth, and partly, because of favourable factors such as increasing finance penetration and rising consumer aspirations. The same factors are likely to continue to drive more than 10 per cent growth in cars, utility vehicles, light commercial vehicles, and scooters over the next 10 years. As per SIAM estimates, the sector is expected to grow at 15%-16% in FY-12 despite being impacted by factors like high inflation, rising raw material costs, increase in interest rates and fuel prices. Government’s bolstered steps for the infrastructure development will continue to support the economic growth and employment opportunities in the Indian Economy.
Other developments in the Automobile sector include gradual shift of production facilities from high-cost regions in North America and European Union to lower-cost regions such as China, India and South America. The Asian countries, especially China and India, are expected to account for 40% of growth in the auto industry over the next five to seven years. Cost & Efficiency optimization shall be the key words. The Automakers have started to reduce the number of technological platforms with a greater diversity of models produced from each platform in order to remain cost competitive.
There is also a shift for “green” cars, which will not only mean increased use of alternative energy sources but also “lightweighting” of components. A majority of the systems are becoming “electronic” for the same reason. Increasing fuel prices and concerns over global warming have focussed attention on the auto industry which has resulted in efforts towards either relying less on traditional fossil fuels or using renewable sources of energy. It is likely that “green” cars will
represent up to a third of total global sales in developed auto markets and up to 20% in urban areas of emerging auto markets by 2020.
Your company is the leader in the “Electronic Power Steering (EPS)” in India and our partners JTEKT are not only the global leaders in the steering business, but also the number 1 Electronic Steering Systems provider in the world. Thus the creation of Sona Koyo’s subsidiary, JSAI, is an important strategic decision your Company took. I am very pleased to say that our partnership with JTEKT is progressing very well on other fronts, too. JTEKT is supporting Sona Koyo, for example, with technical experts to improve productivity and quality.
In order to improve quality, reduce costs, and increase value addition, your Company is exploring options of backward integration. One such project already initiated by the Company is to set up Aluminium Die Casting Plant at a new location in Malpura, near Dharuhera. The Company has also decided to set up facilities for in-sourcing which essentially involves in-house machining of certain key components. Capex outlay of Rs. 50 crore has been earmarked for these new projects. In view of the exponential growth that the Industry is witnessing, a big challenge that the Automotive Industry is facing today is the development of tier 2 & tier 3 suppliers for quality and productivity. Sona Koyo is leading a major Indo-Japanese program called VSME (Visionary Small & Medium Enterprises), which is supported by JICA & NMCC. This program is aimed at upgrading the entire supply chain, beginning with tier 3 and tier 2 suppliers, and creating a win-win relationship between suppliers and customers in this chain.
I am certain that these efforts of optimizing the supply chain will benefit your Company not only in short-term, but also for years to come.
I take this opportunity to thank our partners; JTEKT, Maruti Suzuki and Fuji Kiko, our customers; Maruti Suzuki, Mahindra & Mahindra, Tata Motors, Hyundai, Mando India, Fiat India, Toyota Kirloskar, General Motors, and Renault-Nissan India, our bankers; State Bank of India, Corporation Bank, Standard Chartered Bank, Exim Bank, Yes Bank, Kotak Mahindra Bank, Allahabad Bank, Indian Bank and State Bank of Hyderabad, and our employees for their continued support and confidence in our management.
Finally I thank all the shareholders of our company for your faith in the management and the future of Sona Koyo.
Dr. Surinder KapurChairman
Vice-Chairman & Managing Director’s Letter
5
Dear Shareholders,
The automotive industry continued its strong growth momentum in 2010-11 with auto sector sales growing at 26% YoY. The passenger vehicles segment outperformed the sector with healthy growth of 29% YoY in the same period driven by ballooning spending power, easier financing and a wider choice of models in an economy growing at nearly 8%-9% annually. As per SIAM estimates, such high growth rates in the sector are expected to moderate to 15%-16% in FY12 mostly because of high inflation, rising raw material prices, increase in interest rates and fuel prices.
The auto sector will continue to grow at a healthy pace in FY12 driven on the back of unabated demand from tier II and tier III cities. At the same time entry of global automakers like Volkswagon and Audi will further boost the upmarket car segment. India will continue to attract global car manufacturers to set up and improve the manufacturing base in India due to its ever-increasing large pool of technically qualified manpower as well as its ability to offer cost effective value engineering solutions. Favorable demography and presence of the world’s largest middle class with disposable income resulting in higher affordability will provide necessary impetus to the automobile sector in India.
India’s passenger car and commercial vehicle manufacturing industry is the seventh largest in the world, with an annual production of more than 3.7 million units in 2010. According to recent reports, India is set to overtake Brazil to become the sixth largest passenger vehicle producer in the world, growing 16-18 per cent to sell around three million units in the course of 2011-12. According to the Society of Indian Automobile Manufacturers, annual car sales are projected to increase to 5 million vehicles by 2015 and north of 9 million by 2020.
During 2010-11 the domestic market witnessed new launches by almost all the OEM’s. 'Cruze' by General Motors, 'Aria' by Tata Motors, 'Alto K-10' by Maruti Suzuki and the much awaited and acclaimed 'Etios' from Toyota to name a few, apart from launches in small commercial vehicles. Tata 'Nano', the small car wonder which could not live up to the market expectations saw sales zoom to levels of 10,000 cars in Mar 2011 on the back of a renewed marketing effort by the company.
Sona has maintained its leadership position because of its ability to offer innovative solutions to the customers right from design to manufacturing to complete assemblies. The present product portfolio comprises of Manual and Hydraulic Steering Gears, Manual and Electronic Steering Column as well as Intermediate Shafts. The Company’s products are made to global quality standards and performance. In its efforts to venture into new market segments Sona has started supplying Manual Columns for heavy commercial vehicles even though the focus segments remains passenger cars and utility vehicles.
Sona, at the operating levels, improved its Capacity Utilization by producing 4,983,580 units under the Steering and Column Assembly group as compared to 4,257,385 units produced last year (an increase of 17%). A new Manufacturing facility at Sanand started commercial production in the last quarter after overcoming the challenges faced in the relocation of civil structure from Singur, West Bengal. At the Financial front, the Company decided to divest non strategic investments where management participation of Sona was limited. At the same
time, the Company increased investment in its subsidiary Company engaged in the Sheet Metal business. New capital expenditures were met out of operating cash flows and as a result the Company reported a better debt equity position at the end of the year.
Access to International technology through our Technology Partner and Shareholder JTEKT Corporation, Japan has helped the Company to deliver quality products acceptable to our customers. With their help, Sona has successfully localized part of the technology and this has helped to bring the Import content down from 33% to 18% of total material cost. With the help of the In-house R&D efforts, Sona has now developed the EPAM (Electronic Power Assist Module) for off highway vehicle applications. Facilities to manufacture EPAM have been set up at the Dharuhera Plant and supplies have been made for pilot production. Sona is now preparing for mass production in FY12.
In FY11, the Company initiated a major HR initiative to make Sona an employer of choice. This was aimed at strengthening leadership competencies by conducting classroom sessions involving experts to share different leadership strategies. This new initiative also involved a detailed study of Job Description at various levels in the organization, define Competencies for all levels of management, and run an assessment centre with an eye on the future organization structure and a Customer Facing Orgaization. This initiative also included a separate session to refresh and reinforce our basic beliefs i.e. “Respect for the individual”. “Service to the Customer”, and “Excellence in the Pursuit of our Goals”. We trust that the Group Vision and Mission is underpinned by its Values and Core Beliefs and also believe that a strong and enduring value system differentiate Sona from its competitors.
Another initiative taken by the Company was to upgrade its IT infrastructure during the year. The Oracle ERP application used by the Company for Financial Accounting, Material Management and Sales & Distribution Management was upgraded from Release 11i to Release 12 with IBM acting as Implementation partner for this exercise. In addition, the Company has set up PPMS (Product Profitability Management System) with the help of 3CiT. These initiatives shall deliver robust financial controls, streamlined processes, and reduced operating costs.
The coming pages will give you an in-depth view of the market, market challenges and various factors that impact our business. I would like to thank the Management Board of the Company for their continued support and guidance in steering the Company forward.
We look forward to yet another successful year ahead; and I take this opportunity to convey my sincere thanks for your continued support.
Sunjay KapurVice Chairman & Managing Director
6
Board of Directors
7
BOARD OF DIRECTORS
COMPANY SECRETARY
EXECUTIVE MANAGEMENT
OPERATING MANAGEMENT
TECHNICAL PARTNERS
JTEKT Corporation, JapanMando Corporation, KoreaFuji Autotech AB, Sweden
Dr. Surinder KapurChairman
Mr. Sunjay KapurVice Chairman & Managing Director
Mr. K. M. DeshmukhDy. Managing Director
Mr. Hiroyuki MiyazakiNominee of JTEKT Corporation, Japan
Mr. Kazuhiko AyabeNominee of Maruti Suzuki India Limited
Mr. Jug Mohan KapurMr. B. L. PassiMr. Ramesh SuriMr. Ravi BhoothalingamMr. P. K. ChadhaLt. Gen. (Retd) Shamsher Singh MehtaDr. Rakesh Mohan
Mr. Sudhir Chopra
Dr. Surinder KapurMr. Sunjay KapurMr. K. M. DeshmukhMr. P. V. Prabhu ParrikerMr. Sudhir ChopraMr. Sunder Rajan
Mr. Sunjay KapurMr. K. M. DeshmukhMr. Sudhir ChopraMr. Sunder RajanMr. A. FujimotoMr. A. D. RaoMr. Rajiv ChananaMr. P. P. GajpalMr. Manoj SharmaMr. Deepak AroraMr. Shyamal Saha
M/s S P Puri & Co.Chartered Accountants4/18, Asaf Ali RoadNew Delhi 110 002
Karvy Computershare Pvt. Ltd.105-108, Arunachal Building,19, Barakhamba Road,New Delhi 110 001
UGF-6, Indraprakash,21, Barakhamba Road,New Delhi 110 001
State Bank of IndiaStandard Chartered BankCorporation BankState Bank of HyderabadEXIM BankAllahabad BankIndian BankYes Bank Ltd.Kotak Mahindra Bank Ltd.
1) 38/6, NH-8, Delhi-Jaipur Road, Gurgaon 122 002 (Haryana)2) P. O. Box 14, Chennai-Bangalore Highway, Sriperumbudur, Distt. Chinglepet 602 1053) Plot No. 32, Industrial Area Ph II Dharuhera, Distt. Rewari (Haryana)4) Plot No. D9, TML Vendor Park, Survey No. 1, Village Northcotepura, Sanand, Ahmedabad (Gujarat)
AUDITORS
BANKERS
REGISTRAR AND TRANSFER AGENT
REGISTERED OFFICE
WORKS
8
Management Discussion and Analysis
Market Scenario
2010-11 started in an environment of incipient domestic recovery amidst uncertainty about the state of the global economy, a perception that was reinforced with the precipitation of the Greek sovereign debt crisis a few weeks later. Throughout the year, the goal of Reserve Bank of India’s monetary policy was to nurture the recovery in the face of persistent global uncertainty while trying to contain the spillover of supply-side inflation.
The Indian economy is estimated to have grown by 8.6 per cent during 2010-11. Agricultural growth was above trend, following a good monsoon. The index of industrial production (IIP), which grew by 10.4 per cent during the first half of 2010-11, moderated subsequently, bringing down the overall growth for April-February 2010-11 to 7.8 per cent.
The global economy during the first quarter of 2011 continued with the momentum of late 2010. The global manufacturing purchasing managers’ index (PMI) for February 2011 was close to a record high, while the global services PMI recorded its fastest pace of expansion in almost five years. International trade performed much better as compared with last year but the month-on-month momentum remained uneven. Clearly, global recovery, as a whole, still looks fragile and uneven. However, consumer confidence in major countries, which improved during January-February 2011, moderated in March 2011 on the back of higher oil prices. GDP growth in the US, which was strong at 3.1 per cent in Q4 of 2010, slipped to 1.8 per cent.
At present, uncertainty over the pace of international growth, and even its durability, has increased. Inflationary pressures are building in virtually every region. As per current research, the world’s largest economy, the United States, will be hard pressed to move beyond a 2.5 – 3% annualized growth range in the absence of renewed stimulus. The world’s third largest economy, Japan, has probably slipped back into recession, albeit temporarily. Prospects for most European countries are limited by the spreading sovereign debt related strains in the southern peripheral countries, and the increasing bailout costs that the northern countries, such as Germany, are assuming.
The aftershocks emanating from Japan’s earthquake are increasingly being felt around the globe in the form of reduced manufacturing, particularly for automobiles and technology products. The disruption to supply chains have effectively reduced global auto assemblies by about 11% YoY in April 2011, a sharp reversal from an 8% YoY increase prior to the tsunami in Japan. The greatest impact is in the Asia-Pacific region, where Japanese parts have the largest import penetration in the world’s biggest car-producing region.
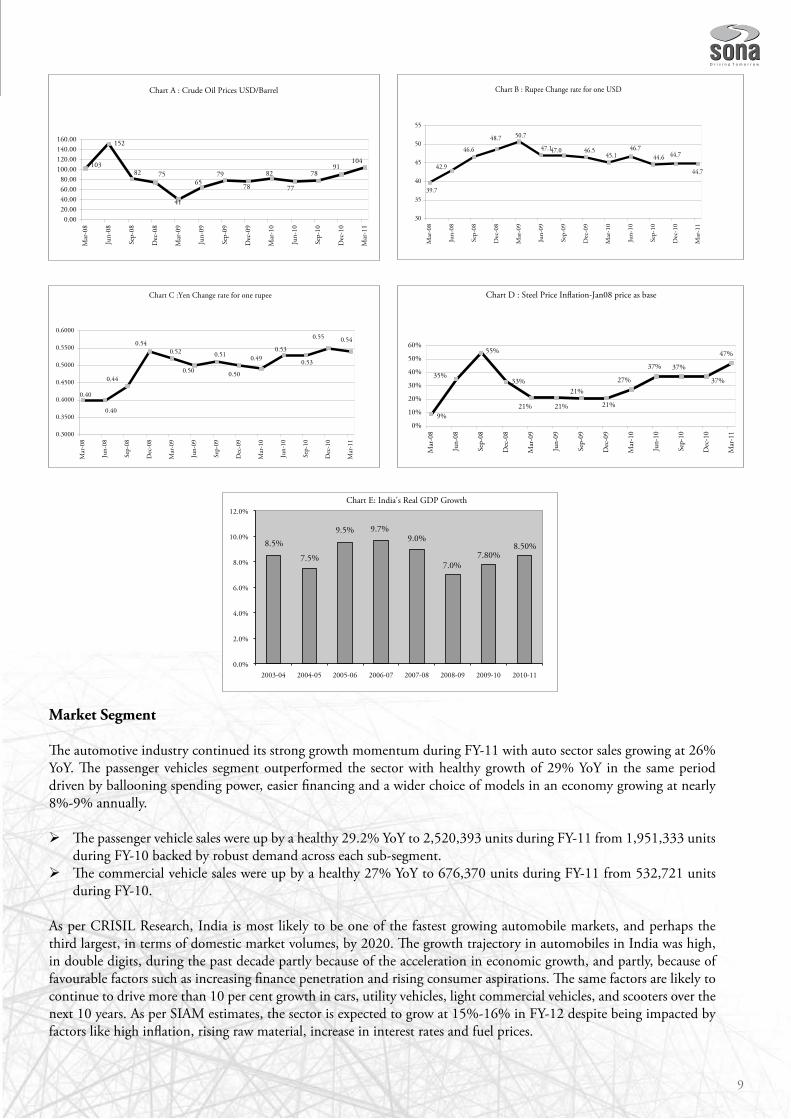
The Brent crude price surged from an average of US$ 75 a barrel during May-September 2010 to US$ 123 a barrel by April 2011. The International Monetary Fund (IMF), in its April 2011, World Economic Outlook (WEO), has assumed US$ 107 a barrel for the full year 2011. Since February 2011, oil prices have come under further pressure on account of apprehensions about supply disruptions due to political developments in the Middle East and North African (MENA) region. The demand for oil is expected to increase with the possibility of Japan substituting some of its shut-in nuclear power capacity with oil-based generation, combined with higher energy usage once reconstruction gets underway. Steel prices also continued to show upward movement throughout the year (refer Chart A & D).
On the Financial front, with the exception of a brief period of May- August 2010, when Rupee depreciated against US$, due to the European debt crisis, the pressure this fiscal has been on rupee to appreciate. Going forward factors like robust capital flows due to the slow economic recovery in other parts of the world, rising interest-rate differential in the wake of the RBI’s monetary tightening and Weak US$ due to ultra-low US interest rates are likely to exert upward pressure on the Rupee.
As 8.5-9.0 per cent average annual GDP growth has now become a new benchmark for India to assess its growth performance, it would require special efforts to achieve the same in view of current scenario. As per CRISIL estimates, the GDP is expected to grow at 8.3 per cent in 2011-12, as the rising cost of credit would slow industrial growth to 8.2 per cent and agriculture growth, despite a normal monsoon, would decline due to a higher base.
9
Market Segment
The automotive industry continued its strong growth momentum during FY-11 with auto sector sales growing at 26% YoY. The passenger vehicles segment outperformed the sector with healthy growth of 29% YoY in the same period driven by ballooning spending power, easier financing and a wider choice of models in an economy growing at nearly 8%-9% annually.
The passenger vehicle sales were up by a healthy 29.2% YoY to 2,520,393 units during FY-11 from 1,951,333 units during FY-10 backed by robust demand across each sub-segment. The commercial vehicle sales were up by a healthy 27% YoY to 676,370 units during FY-11 from 532,721 units during FY-10.
As per CRISIL Research, India is most likely to be one of the fastest growing automobile markets, and perhaps the third largest, in terms of domestic market volumes, by 2020. The growth trajectory in automobiles in India was high, in double digits, during the past decade partly because of the acceleration in economic growth, and partly, because of favourable factors such as increasing finance penetration and rising consumer aspirations. The same factors are likely to continue to drive more than 10 per cent growth in cars, utility vehicles, light commercial vehicles, and scooters over the next 10 years. As per SIAM estimates, the sector is expected to grow at 15%-16% in FY-12 despite being impacted by factors like high inflation, rising raw material, increase in interest rates and fuel prices.
Chart C :Yen Change rate for one rupee
0.40
0.40
0.44
0.540.52
0.50
0.51
0.50
0.490.53
0.53
0.55 0.54
0.3000
0.3500
0.4000
0.4500
0.5000
0.5500
0.6000
Mar
-08
Jun-
08
Sep-
08
Dec
-08
Mar
-09
Jun-
09
Sep-
09
Dec
-09
Mar
-10
Jun-
10
Sep-
10
Dec
-10
Mar
-11
Chart B : Rupee Change rate for one USD
39.7
42.9
46.6
48.7 50.7
47.147.0 46.545.1
46.744.6 44.7
44.7
30
35
40
45
50
55
Mar
-08
Jun-
08
Sep-
08
Dec
-08
Mar
-09
Jun-
09
Sep-
09
Dec
-09
Mar
-10
Jun-
10
Sep-
10
Dec
-10
Mar
-11
Chart A : Crude Oil Prices USD/Barrel
152
10382 75
41
6579
78
82
77
7891
104
0.0020.0040.0060.0080.00
100.00120.00140.00160.00
Mar
-08
Jun-
08
Sep-
08
Dec
-08
Mar
-09
Jun-
09
Sep-
09
Dec
-09
Mar
-10
Jun-
10
Sep-
10
Dec
-10
Mar
-11
Chart D : Steel Price In�ation-Jan08 price as base
33%
9%
35%
55%
21% 21%
21%
21%
27%
37% 37%
37%
47%
0%
10%
20%
30%
40%
50%
60%
Mar
-08
Jun-
08
Sep-
08
Dec
-08
Mar
-09
Jun-
09
Sep-
09
Dec
-09
Mar
-10
Jun-
10
Sep-
10
Dec
-10
Mar
-11
8.5%
7.5%
9.5% 9.7% 9.0%
7.0% 7.80%
8.50%
0.0%
2.0%
4.0%
6.0%
8.0%
10.0%
12.0%
2003-04 2004-05 2005-06 2006-07 2007-08 2008-09 2009-10 2010-11
Chart E: India's Real GDP Growth
10
The Indian Automobile industry is going to transition from one where a few players dominated each vehicle segment to a more intensely competitive market. This will increase product development and marketing costs and have an impact on profitability of manufacturers. The second big challenge, especially for the personal vehicle makers, is to tap rural consumers, in terms of product development, marketing and distribution. The third will be continued policy uncertainties related to regulations such as emission norms which affect production and capacity planning. Despite these challenges, it is expected that support from the Government shall continue to be available for this sector. This is evident from the fact that in the revenue budget there was no change in the existing excise duty (10%) on all vehicles, sans the large cars. Further the increase in allocation towards infrastructure development by 23% to Rs 2140 billion (over 48% of total plan allocation) in FY 2011-12 is a welcome move.
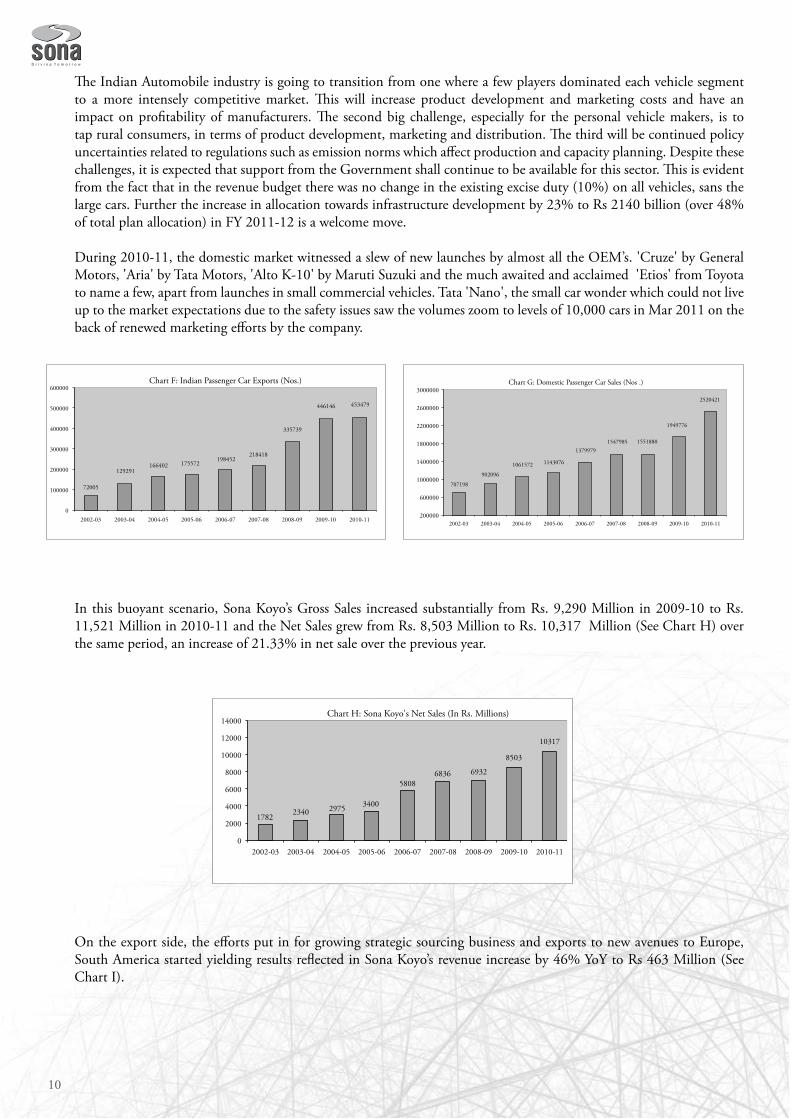
During 2010-11, the domestic market witnessed a slew of new launches by almost all the OEM’s. 'Cruze' by General Motors, 'Aria' by Tata Motors, 'Alto K-10' by Maruti Suzuki and the much awaited and acclaimed 'Etios' from Toyota to name a few, apart from launches in small commercial vehicles. Tata 'Nano', the small car wonder which could not live up to the market expectations due to the safety issues saw the volumes zoom to levels of 10,000 cars in Mar 2011 on the back of renewed marketing efforts by the company.
In this buoyant scenario, Sona Koyo’s Gross Sales increased substantially from Rs. 9,290 Million in 2009-10 to Rs. 11,521 Million in 2010-11 and the Net Sales grew from Rs. 8,503 Million to Rs. 10,317 Million (See Chart H) over the same period, an increase of 21.33% in net sale over the previous year.
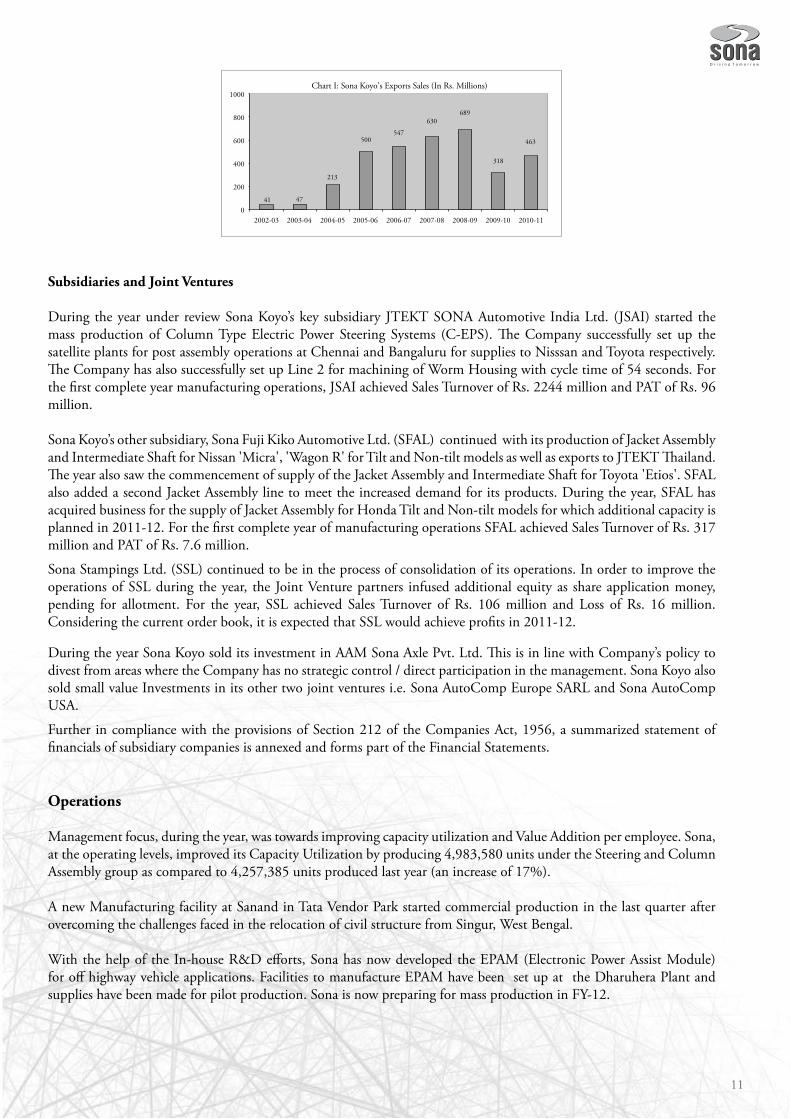
On the export side, the efforts put in for growing strategic sourcing business and exports to new avenues to Europe, South America started yielding results reflected in Sona Koyo’s revenue increase by 46% YoY to Rs 463 Million (See Chart I).
72005
129291 166402 175572
198452 218418
335739
446146 453479
0
100000
200000
300000
400000
500000
600000
2002-03 2003-04 2004-05 2005-06 2006-07 2007-08 2008-09 2009-10 2010-11
Chart F: Indian Passenger Car Exports (Nos.)
707198
902096
1061572 1143076
1379979 1547985 1551880
1949776
2520421
200000
600000
1000000
1400000
1800000
2200000
2600000
3000000
2002-03 2003-04 2004-05 2005-06 2006-07 2007-08 2008-09 2009-10 2010-11
Chart G: Domestic Passenger Car Sales (Nos .)
1782 2340 2975 3400
5808 6836 6932
8503
10317
0
2000
4000
6000
8000
10000
12000
14000
2002-03 2003-04 2004-05 2005-06 2006-07 2007-08 2008-09 2009-10 2010-11
Chart H: Sona Koyo's Net Sales (In Rs. Millions)
11
Subsidiaries and Joint Ventures
During the year under review Sona Koyo’s key subsidiary JTEKT SONA Automotive India Ltd. (JSAI) started the mass production of Column Type Electric Power Steering Systems (C-EPS). The Company successfully set up the satellite plants for post assembly operations at Chennai and Bangaluru for supplies to Nisssan and Toyota respectively. The Company has also successfully set up Line 2 for machining of Worm Housing with cycle time of 54 seconds. For the first complete year manufacturing operations, JSAI achieved Sales Turnover of Rs. 2244 million and PAT of Rs. 96 million.
Sona Koyo’s other subsidiary, Sona Fuji Kiko Automotive Ltd. (SFAL) continued with its production of Jacket Assembly and Intermediate Shaft for Nissan 'Micra', 'Wagon R' for Tilt and Non-tilt models as well as exports to JTEKT Thailand. The year also saw the commencement of supply of the Jacket Assembly and Intermediate Shaft for Toyota 'Etios'. SFAL also added a second Jacket Assembly line to meet the increased demand for its products. During the year, SFAL has acquired business for the supply of Jacket Assembly for Honda Tilt and Non-tilt models for which additional capacity is planned in 2011-12. For the first complete year of manufacturing operations SFAL achieved Sales Turnover of Rs. 317 million and PAT of Rs. 7.6 million.
Sona Stampings Ltd. (SSL) continued to be in the process of consolidation of its operations. In order to improve the operations of SSL during the year, the Joint Venture partners infused additional equity as share application money, pending for allotment. For the year, SSL achieved Sales Turnover of Rs. 106 million and Loss of Rs. 16 million. Considering the current order book, it is expected that SSL would achieve profits in 2011-12.
During the year Sona Koyo sold its investment in AAM Sona Axle Pvt. Ltd. This is in line with Company’s policy to divest from areas where the Company has no strategic control / direct participation in the management. Sona Koyo also sold small value Investments in its other two joint ventures i.e. Sona AutoComp Europe SARL and Sona AutoComp USA.
Further in compliance with the provisions of Section 212 of the Companies Act, 1956, a summarized statement of financials of subsidiary companies is annexed and forms part of the Financial Statements.
Operations
Management focus, during the year, was towards improving capacity utilization and Value Addition per employee. Sona, at the operating levels, improved its Capacity Utilization by producing 4,983,580 units under the Steering and Column Assembly group as compared to 4,257,385 units produced last year (an increase of 17%).
A new Manufacturing facility at Sanand in Tata Vendor Park started commercial production in the last quarter after overcoming the challenges faced in the relocation of civil structure from Singur, West Bengal.
With the help of the In-house R&D efforts, Sona has now developed the EPAM (Electronic Power Assist Module) for off highway vehicle applications. Facilities to manufacture EPAM have been set up at the Dharuhera Plant and supplies have been made for pilot production. Sona is now preparing for mass production in FY-12.
41 47
213
500 547
630 689
318
463
0
200
400
600
800
1000
2002-03 2003-04 2004-05 2005-06 2006-07 2007-08 2008-09 2009-10 2010-11
Chart I: Sona Koyo's Exports Sales (In Rs. Millions)
12
Profitability & Competitiveness Improvement
Sona Koyo achieved 21% growth in sales turnover to reach Rs. 10317 million. Sona Koyo is committed to exceed Customer expectations by consistently providing high quality products. Management focus towards improving capacity utilization and Value Addition per employee, supported by strong market demand, helped the Company to achieve significant growth in turnover and profitability. Sona Koyo was able to make a PAT of Rs. 374 million in FY-11, a significant increase over PAT of Rs. 216 million made in FY-10.
Sona Koyo has continued with its efforts to improve the level of localization of various imported parts. This has helped to bring the Import content down from 33% to 18% of total material cost. Various VA/VE activities were initiated along with active participation with Suppliers to improve efficiency of operations. All of these factors resulted in an overall reduction in material cost from 75% in FY-10 to 73% in FY-11.
To improve manpower efficiency, Sona Koyo initiated a major HR exercise during the year involving a detailed study of Job Description at various levels in the organization, define Competencies for all levels of management, and run an assessment centre with an eye on the future organization structure and a Customer Facing Organization.
Another initiative towards competitiveness improvement was to upgrade IT infrastructure during the year. The Oracle ERP application used by the Company for Financial Accounting, Material Management and Sales & Distribution Management was upgraded from Release 11i to Release 12 with IBM acting as Implementation partner for this exercise. In addition, the Company has set up PPMS (Product Profitability Management System) with the help of 3CiT. These initiatives shall deliver robust financial controls, streamlined processes, and reduced operating costs.
Awards and Recognition
Sona Koyo once again achieved recognition of its excellence. Sona Koyo was awarded, by Maruti Suzuki, Excellence Award under the categories of “Research & Development” and “Tier 2 Up-gradation”. Sona Koyo was also awarded with “Best Award for Quality< 2PPM” by EZ-Go in October, 2011.
Supply Chain Management:
Sona Koyo continues to build and maintain sustainable relationships with it’s supply chain particularly in relation to long-term strategic direction of the business. Vendor management is critical to Sona Koyo, as nearly 73 percent of the Net Sales is currently made up of material cost. Sona Koyo continues to be benefited from the restructured and rationalized Supply Chain Team for better optimization of resources and increased customer focus.
Market growth in FY-11, led to serious supply constraints as Tier II suppliers could not foresee investment requirements to increase production capacity and improve technology. This resulted into difficulties in meeting customer requirements as well as payment of premium freight despite establishing strong logistic controls. This has prompted the Company to seriously explore options of backward integration for implementation in FY-12.
Sona Koyo has also decided to participate in the VSME (Visionary Small & Medium Enterprises) project under Visionary Leaders for Manufacturing (VLFM) Programme run by CII, JICA (Japan International Co operation Agency, Japan) and NMCC (National Manufacturing Competitiveness Council, Government of India) under the Indo-Japan Cooperation Agreement 2006. The faculty for the programme includes Chief Advisor, Professor Shoji Shiba – an international expert in TQM and Breakthrough management. This program is directed towards improving the technical and operational efficiency of our suppliers. Sona Koyo technical team will work directly with the selected suppliers to help them improve efficiency of their manufacturing operations and achieve technological changes.
13
Research and Development (R&D)
Sona Koyo has been awarded an international patent (US 7,789,191) titled “Electric Power Assist Module for Steering System”. This is the second international patent that Sona Koyo has secured in the United States. This invention of EPAM is indeed revolutionary for off-highway vehicles segment and has a huge market potential in the farm equipments segment.
Electric Power Assist Module (EPAM) developed for off road application is ready for production. The concept has been designed and developed for EPAM for farm equipments. The prototype has been developed and testing at customer end is in progress. Initial feedback from customer is encouraging. Variants of EPAM for different types of vehicles with unique features and low cost are being developed for ease of mounting with desired performance.
Outlook
The automotive industry remains one of the highest revenue-earning industries in India contributing majorly to India’s GDP, providing direct and indirect employment to millions of people. The market outlook for the industry remains promising with demand across the car segments. India continues to consolidate its position on the global front and now accounts for 5% of global auto production, up from 1.4% at the beginning of 2000. The investment in the industry is expected to be up to USD 17bn in fresh capacity over the next four years and the investment in automotive components is expected to be USD 12bn over the next six years driven by strong technological capability and availability of trained manpower at competitive prices. As per Industry estimates, growth rate in the Auto sector is expected to moderate to 15%-16% in FY-12 mostly because of high inflation, rising raw material prices, increase in interest rates and fuel prices. However an expanding middle class population, growing earning power, industrial development and Government’s focus to build infrastructure, the demand for passenger cars and commercial vehicles shall continue to grow.
Other developments in the Automobile sector will include gradual shift of production facilities from high-cost regions in North America and European Union to lower-cost regions such as China, India and South America. The Asian countries especially China and India are expected to account for 40% of growth in the auto industry over the next five to seven years. Cost & Efficiency optimization shall be the key words.
Risks and Concerns
The Company is exposed to external and internal risks associated with the business. The operations of the Company are directly dependent on the growth of Indian automotive industry. General economic conditions impact the automotive industry, and, in turn, the operations of Sona Koyo as well. To counter these risks, the Company continues to broaden its product portfolio, increase customer profile and geographic reach.
The Company is exposed to strong competitive pressures both domestic and overseas. Sona Koyo’s close customer relationships, ability to provide higher level of engineering, design support and relentless drive for improvement gives it a competitive edge. The Company is also exposed to financial risk from changes in interest rates, foreign exchange rates and commodity prices. The Company also faces challenges with regard to fast changing technology, reducing life cycle of new vehicles, supply constraints from Tier II suppliers, sustaining cost efficiencies brought into the system and planning capacity expansion in the wake of changing demand patterns.
Risk management is reviewed by the Audit Committee, which reviews the Company’s management activities on a regular basis in addition to monitoring for any new risks that may arise due to changes in the external or business environments. While the possibility of negative impact due to one or more of such risks can not be totally ruled out, the Company proactively takes conscious and reasonable steps, making efforts to mitigate the significant risks that may affect it.
14
Financial Review
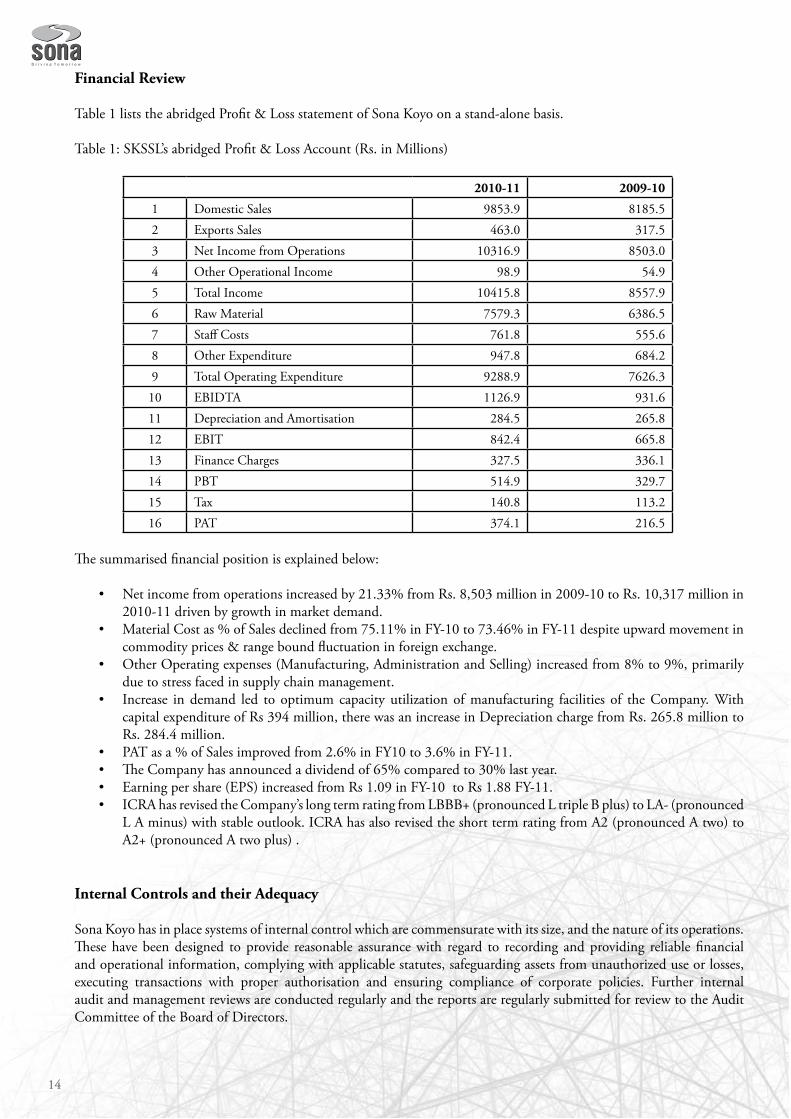
Table 1 lists the abridged Profit & Loss statement of Sona Koyo on a stand-alone basis.
Table 1: SKSSL’s abridged Profit & Loss Account (Rs. in Millions)
2010-11 2009-10
1 Domestic Sales 9853.9 8185.52 Exports Sales 463.0 317.53 Net Income from Operations 10316.9 8503.04 Other Operational Income 98.9 54.95 Total Income 10415.8 8557.96 Raw Material 7579.3 6386.57 Staff Costs 761.8 555.68 Other Expenditure 947.8 684.29 Total Operating Expenditure 9288.9 7626.310 EBIDTA 1126.9 931.611 Depreciation and Amortisation 284.5 265.812 EBIT 842.4 665.813 Finance Charges 327.5 336.114 PBT 514.9 329.715 Tax 140.8 113.216 PAT 374.1 216.5
The summarised financial position is explained below:
Net income from operations increased by 21.33% from Rs. 8,503 million in 2009-10 to Rs. 10,317 million in •2010-11 driven by growth in market demand.Material Cost as % of Sales declined from 75.11% in FY-10 to 73.46% in FY-11 despite upward movement in •commodity prices & range bound fluctuation in foreign exchange. Other Operating expenses (Manufacturing, Administration and Selling) increased from 8% to 9%, primarily •due to stress faced in supply chain management.Increase in demand led to optimum capacity utilization of manufacturing facilities of the Company. With •capital expenditure of Rs 394 million, there was an increase in Depreciation charge from Rs. 265.8 million to Rs. 284.4 million.PAT as a % of Sales improved from 2.6% in FY10 to 3.6% in FY-11.•The Company has announced a dividend of 65% compared to 30% last year.•Earning per share (EPS) increased from Rs 1.09 in FY-10 to Rs 1.88 FY-11.•ICRA has revised the Company’s long term rating from LBBB+ (pronounced L triple B plus) to LA- (pronounced •L A minus) with stable outlook. ICRA has also revised the short term rating from A2 (pronounced A two) to A2+ (pronounced A two plus) .
Internal Controls and their Adequacy
Sona Koyo has in place systems of internal control which are commensurate with its size, and the nature of its operations. These have been designed to provide reasonable assurance with regard to recording and providing reliable financial and operational information, complying with applicable statutes, safeguarding assets from unauthorized use or losses, executing transactions with proper authorisation and ensuring compliance of corporate policies. Further internal audit and management reviews are conducted regularly and the reports are regularly submitted for review to the Audit Committee of the Board of Directors.
15
Sona Koyo’s Audit Committee reviews all audit reports submitted by the internal auditors; follows up on the implementation of various recommendations; meets the Company’s statutory auditors to ascertain their views on the adequacy of internal control systems; and keeps the Company’s Board of Directors informed of major observations from time to time.
Sustainability
The Sona Group continues to map it’s carbon and water foot prints. Sona Koyo has set the target for 5% reduction in its energy consumption, a 10% cut in carbon emissions, 5% cut in water consumption using in-house innovative ways for reduction and reuse of it’s resources. The Company has also initiated a huge tree-plantation drive, to off-set it’s carbon footprint.
In the social space, the adoption of ITI Nagina continues to throw up education and employment opportunities for unemployed youth. The institute has set up a Centre of Excellence under the guidelines of the Government of Haryana and is currently training batches of over 150 students. With a placement record of 75% over 4 years, its students are finding their way to many industry players which include OEMs, Tier I and Tier II Companies.
At Begumpur Khatola Sona Koyo continues to support education and health initiatives for the local community.
Cautionary Statement
Statements in this Management Discussion and Analysis describing the Company’s objectives, projections, estimates and expectations maybe (forward looking statements) within the meaning of applicable laws and regulations. Actual results might differ substantially or materially from those expressed or implied. Important developments that could affect the Company’s operations include a down trend in the automobile sector, significant changes in the political and economic environment in India, exchange rate fluctuations, tax laws, litigation, labour relations and interest cost.
16
Corporate Governanace Report
CORPORATE GOVERNANCE
Sona Koyo Steering Systems Limited remains committed to high standards of corporate governance. The Company believes that appropriate disclosure procedures, transparent accounting policies, strong and independent Board practices and highest levels of ethical standards are critical to enhance and retain investor’s trust and generate sustainable corporate growth. It is the conviction with that Sona has set in place systems, procedures and standards that are promoting good corporate governance standards within the Company.
The Securities and Exchange Board of India (SEBI) regulates corporate governance practices of companies listed on the Indian Stock Exchanges. These regulations are notified under Clause 49 of the Listing Agreements of all the Stock Exchanges in the country. This Clause specifies the standards that Indian companies have to meet and the disclosures that they have to make, with regard to corporate governance. SEBI has amended the provisions of Clause 49 of the Listing Agreement from time to time, thereby enhancing the scope of Corporate Governance practices for listed Companies. Your Company has established systems and procedures to comply with the provisions of the ‘Code of Corporate Governance’ and is complying with the same in its letter and spirit.
This section, along with the sections on Additional Shareholder Information and Management Discussion and Analysis, reports Sona’s compliance with Clause 49 of the Listing Agreement.
BOARD OF DIRECTORS
a) Composition of the Board
The Board of Directors of your Company is having optimum combination of executive and non-executive directors. As on 31st March 2011, the Board of Sona consisted of twelve Directors. The Chairman, the Vice Chairman & Managing Director and the Deputy Managing Director are the Executive Directors of the Company. The remaining nine Directors are non-executive Directors, of which six are independent Directors.
JTEKT Corporation, Japan (JTEKT), the financial and technical collaborator of Sona, has nominated a non-executive Director on the Board of the Company. Maruti Suzuki India Limited (MSIL), which is the co-promoter of Sona as well as its major customer, has also nominated one non-executive Director on the Board of the Company.
b) Number of Board Meetings
In the year ended 31st March 2011, Sona held four Board meetings on 30th April, 2010, 27th July, 2010, 29th October, 2010 and 28th January, 2011. The maximum time gap between any two Board Meetings during the year was less than four months.
c) Directors’ attendance record and directorships held
See Table 1 for details.
17
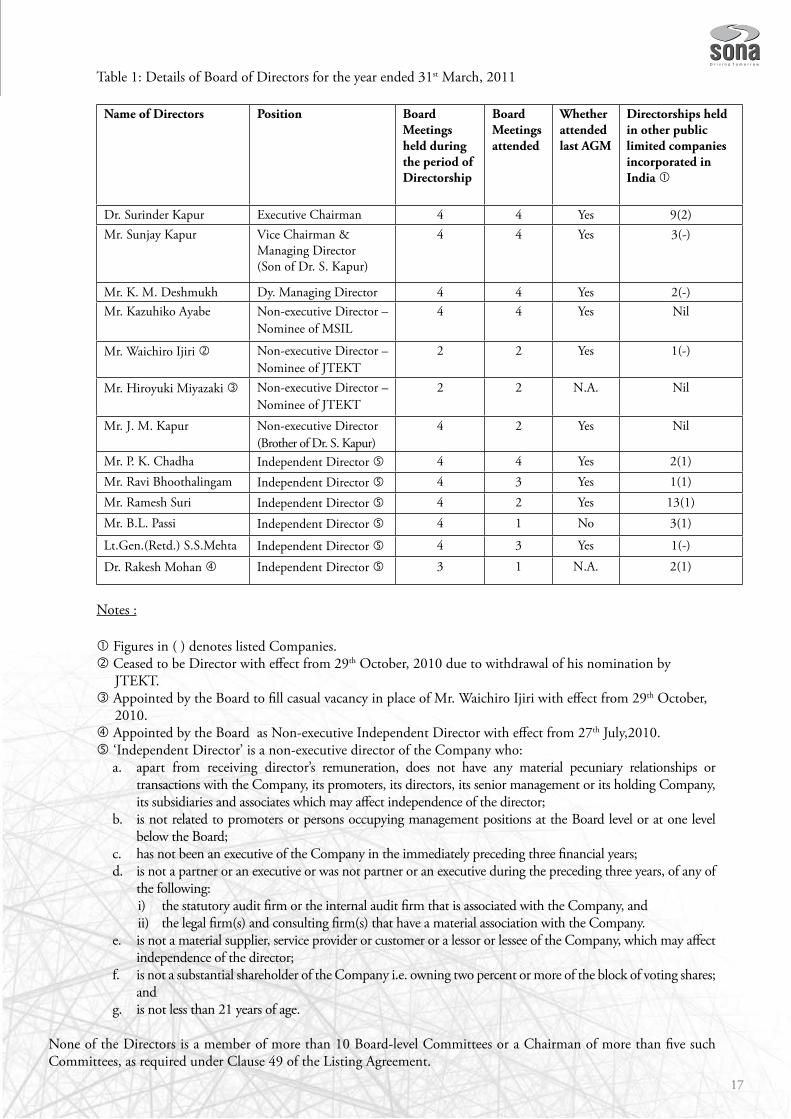
Table 1: Details of Board of Directors for the year ended 31st March, 2011
Name of Directors Position Board Meetings held during the period of Directorship
Board Meetings attended
Whether attended last AGM
Directorships held in other public limited companies incorporated in India
Dr. Surinder Kapur Executive Chairman 4 4 Yes 9(2)Mr. Sunjay Kapur Vice Chairman &
Managing Director(Son of Dr. S. Kapur)
4 4 Yes 3(-)
Mr. K. M. Deshmukh Dy. Managing Director 4 4 Yes 2(-)Mr. Kazuhiko Ayabe Non-executive Director –
Nominee of MSIL4 4 Yes Nil
Mr. Waichiro Ijiri Non-executive Director – Nominee of JTEKT
2 2 Yes 1(-)
Mr. Hiroyuki Miyazaki Non-executive Director – Nominee of JTEKT
2 2 N.A. Nil
Mr. J. M. Kapur Non-executive Director(Brother of Dr. S. Kapur)
4 2 Yes Nil
Mr. P. K. Chadha Independent Director 4 4 Yes 2(1)Mr. Ravi Bhoothalingam Independent Director 4 3 Yes 1(1)Mr. Ramesh Suri Independent Director 4 2 Yes 13(1)Mr. B.L. Passi Independent Director 4 1 No 3(1)
Lt.Gen.(Retd.) S.S.Mehta Independent Director 4 3 Yes 1(-)
Dr. Rakesh Mohan Independent Director 3 1 N.A. 2(1)
Notes :
Figures in ( ) denotes listed Companies. Ceased to be Director with effect from 29th October, 2010 due to withdrawal of his nomination by JTEKT. Appointed by the Board to fill casual vacancy in place of Mr. Waichiro Ijiri with effect from 29th October,
2010. Appointed by the Board as Non-executive Independent Director with effect from 27th July,2010. ‘Independent Director’ is a non-executive director of the Company who:
apart from receiving director’s remuneration, does not have any material pecuniary relationships or a. transactions with the Company, its promoters, its directors, its senior management or its holding Company, its subsidiaries and associates which may affect independence of the director;is not related to promoters or persons occupying management positions at the Board level or at one level b. below the Board;has not been an executive of the Company in the immediately preceding three financial years;c. is not a partner or an executive or was not partner or an executive during the preceding three years, of any of d. the following:
the statutory audit firm or the internal audit firm that is associated with the Company, andi) the legal firm(s) and consulting firm(s) that have a material association with the Company.ii)
is not a material supplier, service provider or customer or a lessor or lessee of the Company, which may affect e. independence of the director;is not a substantial shareholder of the Company i.e. owning two percent or more of the block of voting shares; f. andis not less than 21 years of age.g.
None of the Directors is a member of more than 10 Board-level Committees or a Chairman of more than five such Committees, as required under Clause 49 of the Listing Agreement.
18
d) Information supplied to the Board
Among others, this includes:
Annual operating plans and budgets and any updates.1. Capital budgets and any updates.2. Quarterly results of the Company and its operating divisions or business segments.3. Minutes of meetings of Audit Committee and other Committees of the Board.4. The information on recruitment and remuneration of senior officers just below the Board level, including 5. appointment or removal of Chief Financial Officer and the Company Secretary.Show cause, demand, prosecution notices and penalty notices, which are materially important.6. Fatal or serious accidents, dangerous occurrences, any material effluent or pollution problems.7. Any material default in financial obligations to and by the Company, or substantial non-payment for goods 8. sold by the Company.Any issue, which involves possible public or product liability claims of substantial nature, including any 9. judgement or order which, may have passed strictures on the conduct of the Company or taken an adverse view regarding another enterprise that can have negative implications on the Company.Details of any joint venture or collaboration agreement.10. Transactions that involve substantial payment towards goodwill, brand equity or intellectual property.11. Significant labour problems and their proposed solutions. Any significant development in Human Resources/12. Industrial Relations front like signing of wage agreement, implementation of Voluntary Retirement Scheme etc.Sale, of material nature, of investments, subsidiaries, assets, which is not in normal course of business.13. Quarterly details of foreign exchange exposures and the steps taken by management to limit the risks of 14. adverse exchange rate movement, if material.Non-compliance of any regulatory, statutory or listing requirements and shareholders service such as non-15. payment of dividend, delay in share transfer etc.
The Board periodically reviews compliance reports of all laws applicable to the Company, prepared by the Company as well as steps taken by the Company to rectify instances of non-compliances.
e) Directors with significant related party transactions, pecuniary or business relationship with the Company
The Company has business transactions at prevailing market prices and terms with Pune Heat Treat (P) Ltd., a Company in which the wife of Sona’s Chairman has a majority shareholding. The Company supplies components to Maruti Suzuki India Limited, the co-promoter of the Company and pays royalty, technical know-how fees and other charges to JTEKT for extending technology for manufacturing various auto components. All transactions are conducted at arm’s length and at prevailing market prices. None of these transactions involve a conflict with the financial interests of Sona. The details of related party transactions are given in Schedule 18(20) to the Annual Accounts of the Company.
f ) Remuneration of Directors: Sitting Fees, Salary, Perquisites and Commission
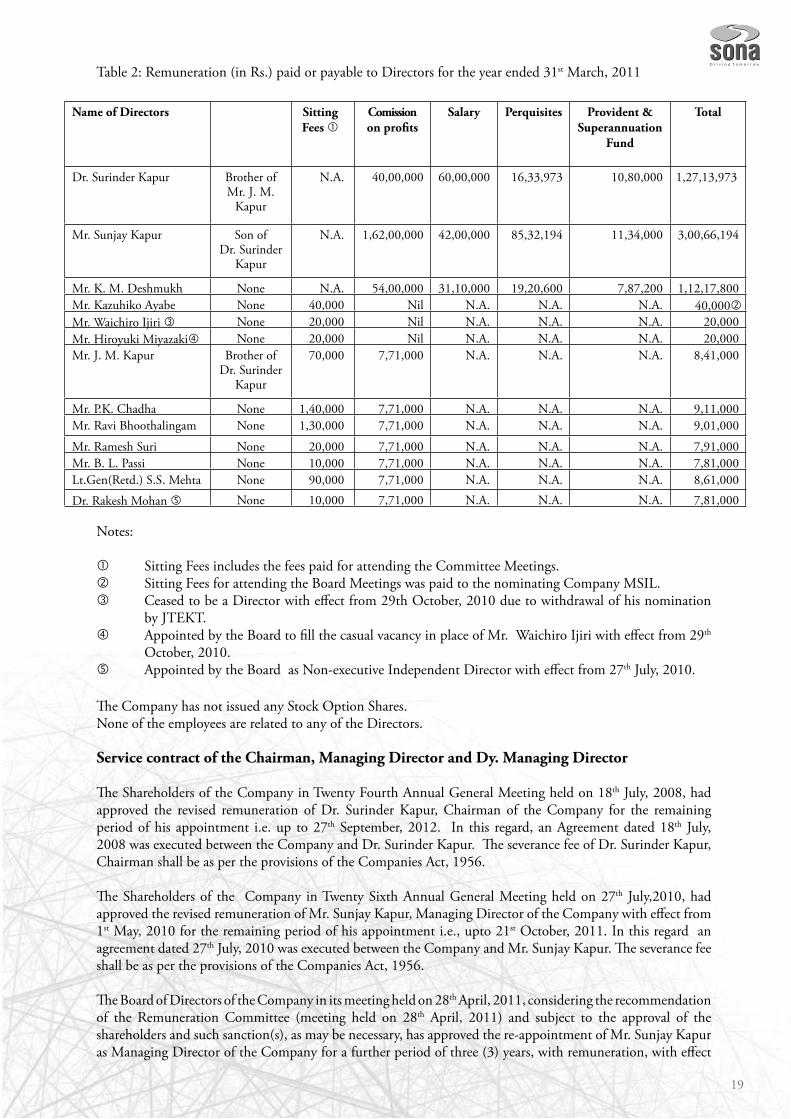
Table 2 gives the details of the remuneration package of Directors and their relationships with each other.
19
Table 2: Remuneration (in Rs.) paid or payable to Directors for the year ended 31st March, 2011
Name of Directors Sitting Fees
Comission on profits
Salary Perquisites Provident & Superannuation
Fund
Total
Dr. Surinder Kapur Brother ofMr. J. M.
Kapur
N.A. 40,00,000 60,00,000 16,33,973 10,80,000 1,27,13,973
Mr. Sunjay Kapur Son ofDr. Surinder
Kapur
N.A. 1,62,00,000 42,00,000 85,32,194 11,34,000 3,00,66,194
Mr. K. M. Deshmukh None N.A. 54,00,000 31,10,000 19,20,600 7,87,200 1,12,17,800Mr. Kazuhiko Ayabe None 40,000 Nil N.A. N.A. N.A. 40,000Mr. Waichiro Ijiri None 20,000 Nil N.A. N.A. N.A. 20,000Mr. Hiroyuki Miyazaki None 20,000 Nil N.A. N.A. N.A. 20,000Mr. J. M. Kapur Brother of
Dr. Surinder Kapur
70,000 7,71,000 N.A. N.A. N.A. 8,41,000
Mr. P.K. Chadha None 1,40,000 7,71,000 N.A. N.A. N.A. 9,11,000Mr. Ravi Bhoothalingam None 1,30,000 7,71,000 N.A. N.A. N.A. 9,01,000
Mr. Ramesh Suri None 20,000 7,71,000 N.A. N.A. N.A. 7,91,000Mr. B. L. Passi None 10,000 7,71,000 N.A. N.A. N.A. 7,81,000Lt.Gen(Retd.) S.S. Mehta None 90,000 7,71,000 N.A. N.A. N.A. 8,61,000
Dr. Rakesh Mohan None 10,000 7,71,000 N.A. N.A. N.A. 7,81,000
Notes:
Sitting Fees includes the fees paid for attending the Committee Meetings. Sitting Fees for attending the Board Meetings was paid to the nominating Company MSIL.
Ceased to be a Director with effect from 29th October, 2010 due to withdrawal of his nomination by JTEKT.
Appointed by the Board to fill the casual vacancy in place of Mr. Waichiro Ijiri with effect from 29th October, 2010.
Appointed by the Board as Non-executive Independent Director with effect from 27th July, 2010.
The Company has not issued any Stock Option Shares. None of the employees are related to any of the Directors.
Service contract of the Chairman, Managing Director and Dy. Managing Director
The Shareholders of the Company in Twenty Fourth Annual General Meeting held on 18th July, 2008, had approved the revised remuneration of Dr. Surinder Kapur, Chairman of the Company for the remaining period of his appointment i.e. up to 27th September, 2012. In this regard, an Agreement dated 18th July, 2008 was executed between the Company and Dr. Surinder Kapur. The severance fee of Dr. Surinder Kapur, Chairman shall be as per the provisions of the Companies Act, 1956.
The Shareholders of the Company in Twenty Sixth Annual General Meeting held on 27th July,2010, had approved the revised remuneration of Mr. Sunjay Kapur, Managing Director of the Company with effect from 1st May, 2010 for the remaining period of his appointment i.e., upto 21st October, 2011. In this regard an agreement dated 27th July, 2010 was executed between the Company and Mr. Sunjay Kapur. The severance fee shall be as per the provisions of the Companies Act, 1956.
The Board of Directors of the Company in its meeting held on 28th April, 2011, considering the recommendation of the Remuneration Committee (meeting held on 28th April, 2011) and subject to the approval of the shareholders and such sanction(s), as may be necessary, has approved the re-appointment of Mr. Sunjay Kapur as Managing Director of the Company for a further period of three (3) years, with remuneration, with effect
20
from 22nd October, 2011. The resolution for the re-appointment of Mr. Sunjay Kapur is mentioned at Serial No. 9 of the Notice of the Annual General Meeting.
The Board of Directors of the Company in its meeting held on 29th October, 2010, considering the recommendation of Remuneration Committee (meeting held on 28th October, 2010) and subject to the approval of the Shareholders and such sanction(s), as may be necessary, has approved the revision in the remuneration payable to Mr K.M. Deshmukh, Dy. Managing Director of the Company, effective from 1st November, 2011. The resolution for revision in remuneration payable to Mr. K.M. Deshmukh, Dy. Managing Director of the Company, is mentioned at Serial No. 8 of the Notice of the Annual General Meeting.
Basis for compensation payment to the Independent / Non-executive Directors
The Shareholders of the Company in its Annual General Meeting held on 18th July, 2008, subject to the approval of the Central Government, pursuant to the provisions of Section 198, 309, 310 and other applicable provisions, if any, of the Companies Act, 1956, have approved payment and distribution of commission not exceeding 1 per cent of the net profits of the Company calculated in accordance with the provisions of Section 349 and 350 of the Companies Act, 1956, amongst the Directors or any of them or some of them other than the Managing Director / Whole-time Director(s) of the Company, as may be determined by the Board of Directors. The Government of India, Ministry of Finance, Department of Company Affairs vide its letter no. SRN/A 45890209/3/2009-CL.VII dated 4th June, 2009 has granted its approval to the above.
Accordingly, the Board of Directors of the Company in its meeting held on 28th April, 2011 has decided to pay Rs. 7,71,000/- each to the independent directors / non-executive directors (except Nominee Directors), by way of commission, out of the net profits for the Financial Year ended 31st March, 2011 of the Company.
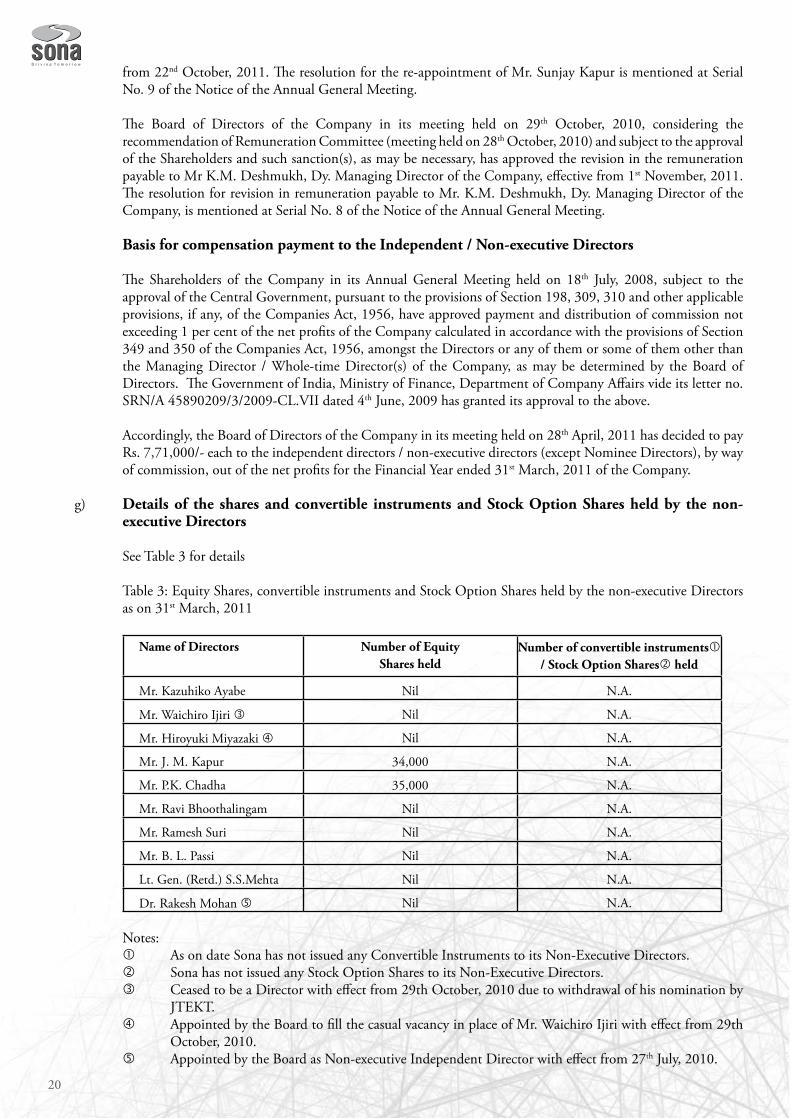
g) Details of the shares and convertible instruments and Stock Option Shares held by the non-executive Directors
See Table 3 for details
Table 3: Equity Shares, convertible instruments and Stock Option Shares held by the non-executive Directors as on 31st March, 2011
Name of Directors Number of Equity Shares held
Number of convertible instruments / Stock Option Shares held
Mr. Kazuhiko Ayabe Nil N.A.
Mr. Waichiro Ijiri Nil N.A.
Mr. Hiroyuki Miyazaki Nil N.A.
Mr. J. M. Kapur 34,000 N.A.
Mr. P.K. Chadha 35,000 N.A.
Mr. Ravi Bhoothalingam Nil N.A.
Mr. Ramesh Suri Nil N.A.
Mr. B. L. Passi Nil N.A.
Lt. Gen. (Retd.) S.S.Mehta Nil N.A.
Dr. Rakesh Mohan Nil N.A.
Notes: As on date Sona has not issued any Convertible Instruments to its Non-Executive Directors. Sona has not issued any Stock Option Shares to its Non-Executive Directors. Ceased to be a Director with effect from 29th October, 2010 due to withdrawal of his nomination by
JTEKT. Appointed by the Board to fill the casual vacancy in place of Mr. Waichiro Ijiri with effect from 29th
October, 2010. Appointed by the Board as Non-executive Independent Director with effect from 27th July, 2010.
21
h) Committees of the Board
i) Audit Committee
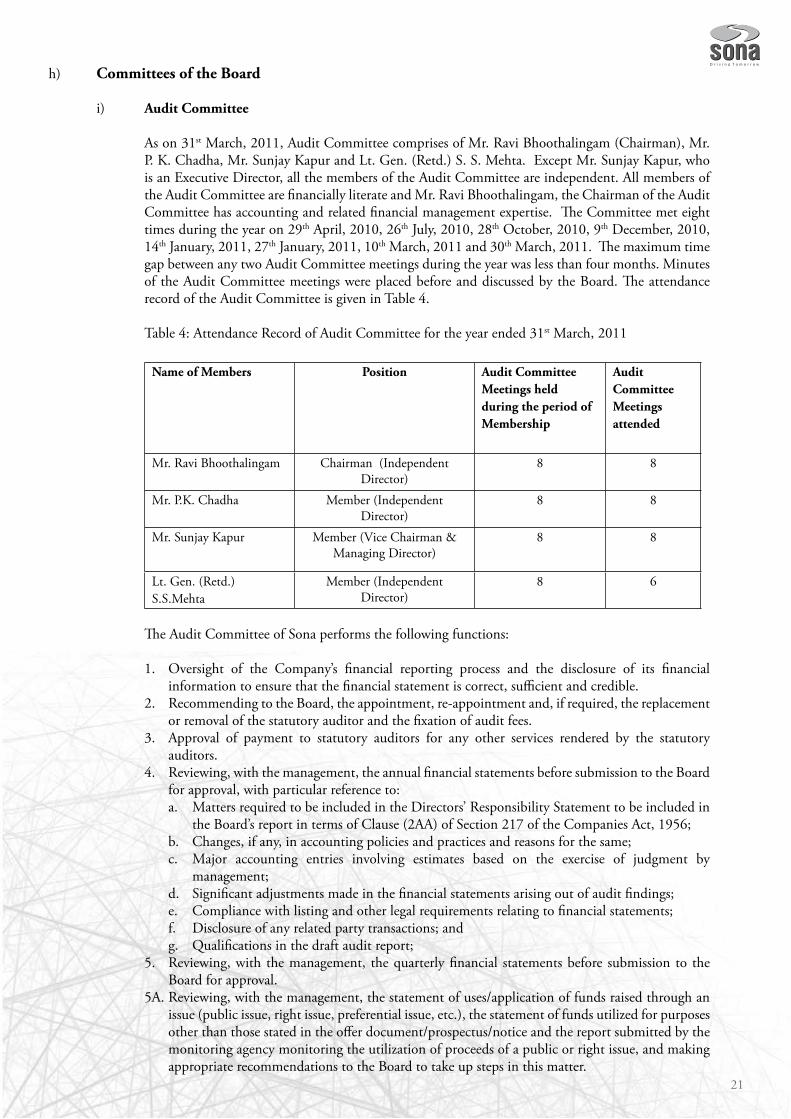
As on 31st March, 2011, Audit Committee comprises of Mr. Ravi Bhoothalingam (Chairman), Mr. P. K. Chadha, Mr. Sunjay Kapur and Lt. Gen. (Retd.) S. S. Mehta. Except Mr. Sunjay Kapur, who is an Executive Director, all the members of the Audit Committee are independent. All members of the Audit Committee are financially literate and Mr. Ravi Bhoothalingam, the Chairman of the Audit Committee has accounting and related financial management expertise. The Committee met eight times during the year on 29th April, 2010, 26th July, 2010, 28th October, 2010, 9th December, 2010, 14th January, 2011, 27th January, 2011, 10th March, 2011 and 30th March, 2011. The maximum time gap between any two Audit Committee meetings during the year was less than four months. Minutes of the Audit Committee meetings were placed before and discussed by the Board. The attendance record of the Audit Committee is given in Table 4.
Table 4: Attendance Record of Audit Committee for the year ended 31st March, 2011
Name of Members Position Audit Committee Meetings held during the period of Membership
Audit Committee Meetings attended
Mr. Ravi Bhoothalingam Chairman (Independent Director)
8 8
Mr. P.K. Chadha Member (Independent Director)
8 8
Mr. Sunjay Kapur Member (Vice Chairman & Managing Director)
8 8
Lt. Gen. (Retd.) S.S.Mehta
Member (Independent Director)
8 6
The Audit Committee of Sona performs the following functions:
Oversight of the Company’s financial reporting process and the disclosure of its financial 1. information to ensure that the financial statement is correct, sufficient and credible.Recommending to the Board, the appointment, re-appointment and, if required, the replacement 2. or removal of the statutory auditor and the fixation of audit fees.Approval of payment to statutory auditors for any other services rendered by the statutory 3. auditors.Reviewing, with the management, the annual financial statements before submission to the Board 4. for approval, with particular reference to:
Matters required to be included in the Directors’ Responsibility Statement to be included in a. the Board’s report in terms of Clause (2AA) of Section 217 of the Companies Act, 1956;Changes, if any, in accounting policies and practices and reasons for the same;b. Major accounting entries involving estimates based on the exercise of judgment by c. management;Significant adjustments made in the financial statements arising out of audit findings;d. Compliance with listing and other legal requirements relating to financial statements;e. Disclosure of any related party transactions; andf. Qualifications in the draft audit report;g.
Reviewing, with the management, the quarterly financial statements before submission to the 5. Board for approval.
5A. Reviewing, with the management, the statement of uses/application of funds raised through an issue (public issue, right issue, preferential issue, etc.), the statement of funds utilized for purposes other than those stated in the offer document/prospectus/notice and the report submitted by the monitoring agency monitoring the utilization of proceeds of a public or right issue, and making appropriate recommendations to the Board to take up steps in this matter.
22
6. Reviewing, with the management, performance of statutory and internal auditors, adequacy of the internal control systems.Reviewing the adequacy of internal audit function, if any, including the structure of the internal 7. audit department, staffing and seniority of the official heading the department, reporting structure coverage and frequency of internal audit. Discussion with Internal Auditors any significant findings and follow up thereon.8. Reviewing the findings of any internal investigations by the Internal Auditors into matters where 9. there is suspected fraud or irregularity or a failure of internal control systems of a material nature and reporting the matter to the Board.Discussion with Statutory Auditors before the audit commences, about the nature and scope of 10. audit as well as post-audit discussion to ascertain any area of concern.To look into the reasons for substantial defaults in the payment to the depositors, debenture 11. holders, shareholders (in case of non payment of declared dividends) and creditors.To review the functioning of the Whistle Blower Mechanism, in case same is existing. 12. Carrying out any other function as is mentioned in the terms of reference of the Audit 13. Committee.
The Audit Committee of Sona reviews the following information:
Management discussion and analysis of financial condition and results of operations;1. Statement of significant related party transactions (as defined by the Audit Committee) submitted 2. by management;Management letters / letters of internal control weaknesses issued by the Statutory Auditors;3. Internal audit reports relating to internal control weaknesses; and4. The appointment, removal and terms of remuneration of the Chief Internal Auditor.5.
The Audit Committee is also empowered with the following powers:
To investigate any activity within its terms of reference; 1. To seek any information it requires from any employee;2. To obtain outside legal or other independent professional advice; and 3. To secure attendance of outsiders with relevant expertise, if considered necessary.4.
The Audit Committee is also apprised on information with regard to related party transactions, by being presented:
A statement in summary form of transactions with related parties in the ordinary course of 1. business; Details of material individual transactions with related parties which are not in the normal course 2. of business; Details of material individual transactions with related parties or others, which are not on an arm’s 3. length basis together with Management’s justification for the same.
The Chairman of the Audit Committee was present at the last Annual General Meeting to answer shareholders’ queries. The Audit Committee is regularly apprised of the various follow-up actions taken on the direction of the Audit Committee. Mr. Sudhir Chopra, Company Secretary of Sona, is the Secretary to the Committee. The Audit Committee regularly invites such executives as it considers appropriate, including the head of the finance function, the head of internal audit and the representative of the statutory auditors, to be present at the meetings of the Committee.
ii) Shareholders / Investors Grievance Committee
The ‘Shareholders / Investors Grievance Committee’ comprises of Dr. Surinder Kapur, Chairman and Mr. J. M. Kapur, Non-Executive Director. The Committee looks into the redressal of shareholders’ and investors’ complaints related to transfer of shares, non-receipt of balance sheet, non-receipt of dividend and ensure expeditious share transfer process. Minutes of the Shareholders/Investors Grievance Committee meetings were placed before and discussed by the Board. The Committee met four times during the year on 3rd April, 2010, 7th July, 2010, 7th October, 2010 and 7th January, 2011. The attendance record of the ‘Shareholders / Investors Grievance Committee’ is presented in Table 5:
23
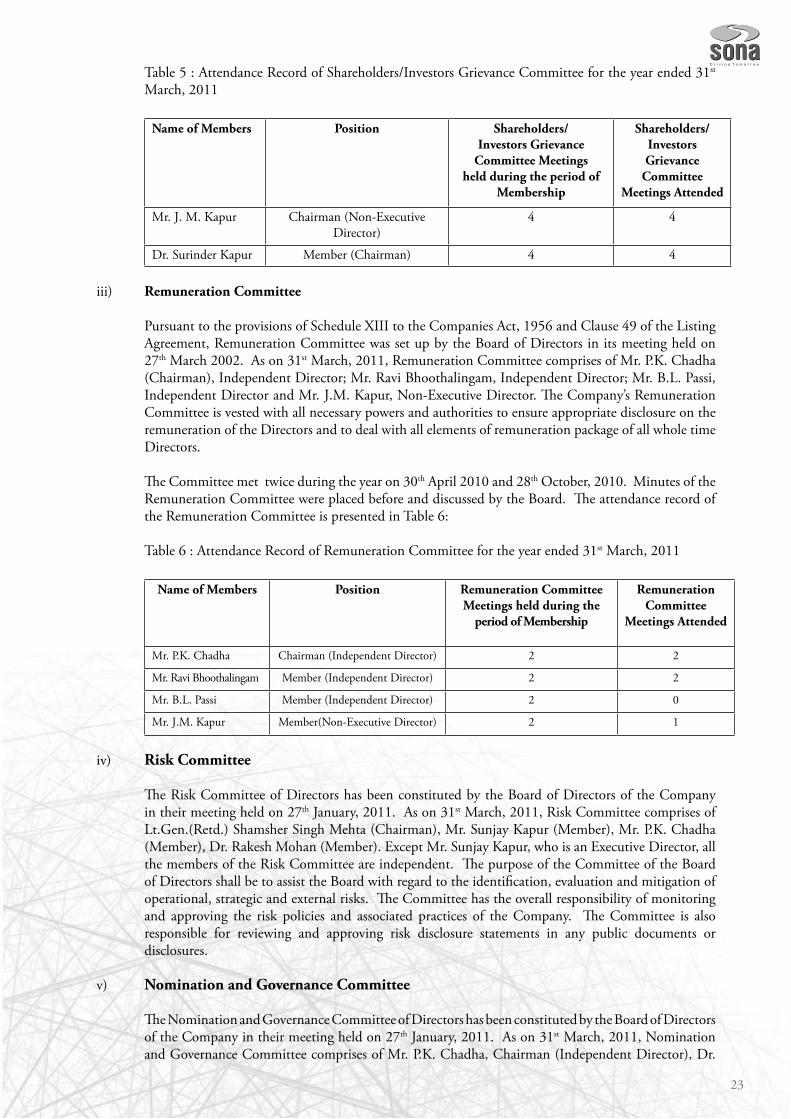
Table 5 : Attendance Record of Shareholders/Investors Grievance Committee for the year ended 31st March, 2011
Name of Members Position Shareholders/Investors Grievance
Committee Meetings held during the period of
Membership
Shareholders/Investors Grievance
Committee Meetings Attended
Mr. J. M. Kapur Chairman (Non-Executive Director)
4 4
Dr. Surinder Kapur Member (Chairman) 4 4
iii) Remuneration Committee
Pursuant to the provisions of Schedule XIII to the Companies Act, 1956 and Clause 49 of the Listing Agreement, Remuneration Committee was set up by the Board of Directors in its meeting held on 27th March 2002. As on 31st March, 2011, Remuneration Committee comprises of Mr. P.K. Chadha (Chairman), Independent Director; Mr. Ravi Bhoothalingam, Independent Director; Mr. B.L. Passi, Independent Director and Mr. J.M. Kapur, Non-Executive Director. The Company’s Remuneration Committee is vested with all necessary powers and authorities to ensure appropriate disclosure on the remuneration of the Directors and to deal with all elements of remuneration package of all whole time Directors.
The Committee met twice during the year on 30th April 2010 and 28th October, 2010. Minutes of the Remuneration Committee were placed before and discussed by the Board. The attendance record of the Remuneration Committee is presented in Table 6:
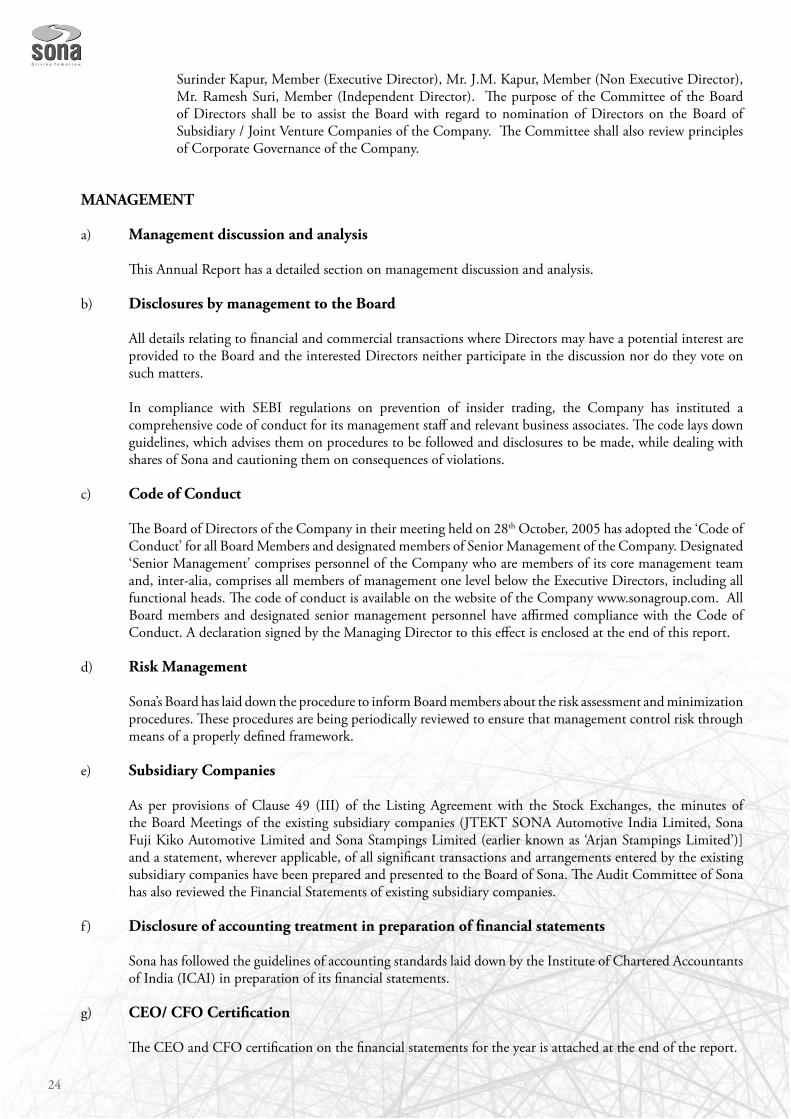
Table 6 : Attendance Record of Remuneration Committee for the year ended 31st March, 2011
Name of Members Position Remuneration Committee Meetings held during the
period of Membership
Remuneration Committee
Meetings Attended
Mr. P.K. Chadha Chairman (Independent Director) 2 2
Mr. Ravi Bhoothalingam Member (Independent Director) 2 2
Mr. B.L. Passi Member (Independent Director) 2 0
Mr. J.M. Kapur Member(Non-Executive Director) 2 1
iv) Risk Committee
The Risk Committee of Directors has been constituted by the Board of Directors of the Company in their meeting held on 27th January, 2011. As on 31st March, 2011, Risk Committee comprises of Lt.Gen.(Retd.) Shamsher Singh Mehta (Chairman), Mr. Sunjay Kapur (Member), Mr. P.K. Chadha (Member), Dr. Rakesh Mohan (Member). Except Mr. Sunjay Kapur, who is an Executive Director, all the members of the Risk Committee are independent. The purpose of the Committee of the Board of Directors shall be to assist the Board with regard to the identification, evaluation and mitigation of operational, strategic and external risks. The Committee has the overall responsibility of monitoring and approving the risk policies and associated practices of the Company. The Committee is also responsible for reviewing and approving risk disclosure statements in any public documents or disclosures.
v) Nomination and Governance Committee
The Nomination and Governance Committee of Directors has been constituted by the Board of Directors of the Company in their meeting held on 27th January, 2011. As on 31st March, 2011, Nomination and Governance Committee comprises of Mr. P.K. Chadha, Chairman (Independent Director), Dr.
24
Surinder Kapur, Member (Executive Director), Mr. J.M. Kapur, Member (Non Executive Director), Mr. Ramesh Suri, Member (Independent Director). The purpose of the Committee of the Board of Directors shall be to assist the Board with regard to nomination of Directors on the Board of Subsidiary / Joint Venture Companies of the Company. The Committee shall also review principles of Corporate Governance of the Company.
MANAGEMENT
a) Management discussion and analysis
This Annual Report has a detailed section on management discussion and analysis.
b) Disclosures by management to the Board
All details relating to financial and commercial transactions where Directors may have a potential interest are provided to the Board and the interested Directors neither participate in the discussion nor do they vote on such matters.
In compliance with SEBI regulations on prevention of insider trading, the Company has instituted a comprehensive code of conduct for its management staff and relevant business associates. The code lays down guidelines, which advises them on procedures to be followed and disclosures to be made, while dealing with shares of Sona and cautioning them on consequences of violations.
c) Code of Conduct
The Board of Directors of the Company in their meeting held on 28th October, 2005 has adopted the ‘Code of Conduct’ for all Board Members and designated members of Senior Management of the Company. Designated ‘Senior Management’ comprises personnel of the Company who are members of its core management team and, inter-alia, comprises all members of management one level below the Executive Directors, including all functional heads. The code of conduct is available on the website of the Company www.sonagroup.com. All Board members and designated senior management personnel have affirmed compliance with the Code of Conduct. A declaration signed by the Managing Director to this effect is enclosed at the end of this report.
d) Risk Management
Sona’s Board has laid down the procedure to inform Board members about the risk assessment and minimization procedures. These procedures are being periodically reviewed to ensure that management control risk through means of a properly defined framework.
e) Subsidiary Companies
As per provisions of Clause 49 (III) of the Listing Agreement with the Stock Exchanges, the minutes of the Board Meetings of the existing subsidiary companies (JTEKT SONA Automotive India Limited, Sona Fuji Kiko Automotive Limited and Sona Stampings Limited (earlier known as ‘Arjan Stampings Limited’)] and a statement, wherever applicable, of all significant transactions and arrangements entered by the existing subsidiary companies have been prepared and presented to the Board of Sona. The Audit Committee of Sona has also reviewed the Financial Statements of existing subsidiary companies.
f ) Disclosure of accounting treatment in preparation of financial statements
Sona has followed the guidelines of accounting standards laid down by the Institute of Chartered Accountants of India (ICAI) in preparation of its financial statements.
g) CEO/ CFO Certification
The CEO and CFO certification on the financial statements for the year is attached at the end of the report.
25
SHAREHOLDERS
a) Disclosures regarding appointment or re-appointment of Directors.
Pursuant to the Articles of Association of Sona, at every Annual General Meeting of the Company, one-third of the rotational Directors retire by rotation or if their number is not three or a multiple of three, the number nearest to one-third retire from office.
Accordingly, Mr. B.L. Passi, Mr. J.M. Kapur and Mr. Ravi Bhoothalingam shall retire at the forthcoming Annual General Meeting of the Company and being eligible, offer themselves for re-appointment.
During the year, the Board of Directors of Sona in their meeting held on 27th July, 2010 appointed Dr. Rakesh Mohan as Additional Director of the Company.
The Board of Directors in their meeting held on 28th April, 2011 have approved the re-appointment of Mr. Sunjay Kapur as Managing Director of the Company for a further period of three years, with remuneration, with effect from 22nd October, 2011.
The brief resumes of the Directors seeking appointment / re-appointment and details of their shareholding in the Company are as follows:
Mr. B.L. Passi• (75 years), has over 44 years of experience in the field of finance, automobile trade, transportation and agriculture. Mr. Passi is one of the largest automobile distributors in the country. He had served on the Boards and sub-committees of nationalized banks like the Bank of India and Central Bank of India. He was also a member of the Board of Directors of Rajasthan State Industrial & Mineral Development Corporation Limited and served as a member of the New Delhi Municipal Committee (NDMC) and Chairman of Projects Negotiations and Tender Sub Committee of NDMC. He serves on Board of Directors of companies like Tata Housing & Development Co. Limited and Banares Hotels Limited. Mr. B. L. Passi does not hold any Equity Shares of the Company.
Mr. J.M. Kapur• (69 years), has been on the Board of the Company since May, 1994. He possesses vast knowledge and experience in the field of trade and business. He has led the Kapur family business in the area of jewellery retail, estate development and management since, 1961 and possesses vast expertise in these areas. He serves on the Board of Sumish Finance and Investment Co. Pvt. Ltd., Maa Estate Pvt. Ltd. and Jyoti Arn Associates Pvt. Ltd. Mr. J.M. Kapur holds 34,000 nos. of Equity Shares of the Company.
Mr. Ravi Bhoothalingam• (65 years), is Chief Executive of Manas Advisory, a Consultancy practice focusing on change management, travel and tourism. Until 30th June 2001 he was President of The Oberoi Group of Hotels and in this capacity responsible for the operations of the Group Worldwide, consisting of thirty-two hotels, flight catering units and luxury cruise ships in six countries across Asia. Prior to joining The Oberoi Group, he was Head of Personnel Worldwide with BAT plc, U.K, Managing Director of VST Industries Ltd. and Director ITC Limited. He serves on the Board of Dr. Reddy’s Laboratories Ltd. He is Chairman of Shareholders’ Grievance Committee and Investment Committee and Member of Nomination, Governance & Compensation Committee, Management Committee and Audit Committee of Dr. Reddy’s Laboratories Ltd. Mr. Bhoothalingam does not hold any Equity Shares of the Company.
Dr. Rakesh Mohan• (63 years) Dr. Rakesh Mohan is Non Resident Senior Research Fellow of Stanford Centre for International Development, Stanford University. He has been Deputy Governor of the Reserve Bank of India for many years (2005-2009 and 2002-2004) and held senior positions in the Government of India including Secretary, Department of Economic Affairs (2004-2005) as well as Chief Economic Advisor to the Government of India (2001-2002), Director General of National Council for Applied Economic Research, and Chief Executive of Indian Council for Research and International Economic Relations. As the Economic Adviser to the Government of India in the Ministry of Industry (1988-1996) he played a major role in the formulation of the new Industrial, Trade and Foreign Investment Policy.
26
Dr. Rakesh Mohan is well known and respected internationally for his extensive work in the areas of economic reforms and liberalization, industrial economics, urban economics, infrastructure studies, economic regulation, monetary policy and the financial sector. He has been advisor / member on the Board of many key bodies working to enhance economic cooperation nationally and internationally, and promoting sound regulation and transparency in economic and industrial activity. Lately he also co-chaired the G20 Working Group ’Enhancing Sound Regulations and Strengthening Transparency’. He serves on the Board of Nestle India Limited, DSP Blackrock Investment Managers Private Limited and Tata Autocomp Systems Limited. He does not hold any Equity Shares of the Company.
Mr. Sunjay Kapur• (39 years), is a graduate in Business Administration from Buckingunham University, U.K., with major in Business Strategy and Human Relations. Mr. Sunjay Kapur had worked with TRW, USA, a world-renowned name in Automotive Industry. In TRW, USA he had gained experience by working on Shop Floor and was exposed to real problems faced by a worker working on the Shop Floor. Mr. Sunjay Kapur has been associated with the Company from April 1996 to March, 2004 in the capacity of an employee. The Board of Directors of the Company appointed Mr. Sunjay Kapur as an Additional Director of the Company in its meeting held on 12th April, 2004. Mr. Sunjay Kapur serves on the Board of Sona Okegawa Precision Forgings Limited, Sona Mobility Services Limited, Sona e-Design & Technologies Limited, Sona Autocomp Holding Private Limited and SONA BLW Prazisionsschmiede GmbH, Germany. He is member of Audit Committee and Remuneration Committee of Sona Okegawa Precision Forgings Limited. He holds the position of Chairman of the Audit Committee and Remuneration Committee of Sona Mobility Services Limited. Mr. Sunjay Kapur is holding 3300 nos. of Equity Shares of the Company
b) Communication to Shareholders
All important information relating to the Company and its performance, including quarterly financial results and shareholding pattern are posted on the web-site www.sonagroup.com. The web-site also displays all official press releases and presentation to analysts made by the Company.
The quarterly, half-yearly and annual results of the Company’s performance are published in newspapers namely ‘Business Standard’ (English) and ‘Business Standard’ (Hindi).
c) Investor Grievances
As mentioned earlier in this section, the Company has constituted a Shareholders' / Investors' Grievances Committee for redressing shareholders’ and investors’ complaints. The status of complaints is reported to the Board of Directors in their meetings. Mr. Sudhir Chopra, Company Secretary, is the Compliance Officer.
Pursuant to sub clause (f ) of Clause 47 of the Listing Agreement, which requires all the Listed Companies to designate an e-mail id of the grievance redressal division/compliance officer exclusively for the purpose of registering complaints by investors, the Company has created an e-mail id i.e. [email protected].
d) Share Transfer
M/s. Karvy Computershare Pvt. Ltd. (Karvy), the Registrar and Transfer Agent of the Company conducts all share transfers and related matters both for physical transfer of Securities as well as de-materialisation / re-materialisation of Securities. Karvy is registered with the SEBI as a Category 1 Registrar.
e) Details of non-compliance
The Company has complied with all the requirements of regulatory authorities and no penalties or strictures were imposed on the Company by any stock exchange or SEBI or any statutory authority on any matter related to capital market during the last 3 years.
27
f ) General Body Meeting
Details of the last three Annual General Meetings are given in Table 7.
Table 7: Date, time and venue of the last three Annual General Meetings
Financial Year (Ended) Date Time Venue
31st March 2008 18th July, 2008 10:00 A.M. Air Force AuditoriumSubroto ParkNew Delhi-110 010.
31st March 2009 31st July, 2009 10:00 A.M. Air Force AuditoriumSubroto ParkNew Delhi-110 010.
31st March 2010 27th July 2010 10.00 A.M. Air Force AuditoriumSubroto ParkNew Delhi-110 010.
g) Special Resolutions
In the ensuing 27th Annual General Meeting of the Company to be held on 2nd August, 2011, the shareholders’ consent is being sought by way of Special Resolution for:
Revision in the remuneration payable to Mr. K.M. Deshmukh, Dy. Managing Director of the •Company.Re-appointment of Mr. Sunjay Kapur as Managing Director of the Company.•
The details of Special Resolutions passed in the previous three Annual General Meetings of the Company are as under:
26th Annual General Meeting held on 27th July, 2010
Revision in the remuneration payable to Mr. Sunjay Kapur, Managing Director of the Company. •
25th Annual General Meeting held on 31st July, 2009
Appointment of Mr. Sunjay Kapur as Managing Director of the Company.•
24th Annual General Meeting held on 18th July, 2008
Remuneration to non-wholetime director.•Amendment in Memorandum and Articles of Association consequent upon sub-division of shares.•
h) Postal ballots
Section 192A of the Companies Act, 1956, read with Para 4 of the Companies (Passing of Resolution by Postal Ballot) Rules, 2001 provides certain matters to be passed by the Company through Postal Ballot only.
At the ensuing Annual General Meeting to be held on 2nd August, 2011 there is no matter proposed to be passed by the Company, which requires Postal Ballot. Also, there was no matter passed through Postal Ballots at the 26th Annual General Meeting of the Company.
28
COMPLIANCE
Mandatory requirements
Sona is compliant with the applicable mandatory requirements of Clause 49 of the Listing Agreement.
Adoption of non-mandatory requirements
Although it is not mandatory as per Clause 49 of the Listing Agreement, a Remuneration Committee of the Board is in place. Details of the Remuneration Committee have been provided under the Section ‘Remuneration Committee’.
Auditors’ certificate on Corporate Governance
As required by Clause 49 of the Listing Agreement, the Auditors’ Certificate is given below :
AUDITORS’ CERTIFICATE ON COMPLIANCE WITH THE CONDITIONS OF CORPORATE GOVERNANCE UNDER CLAUSE 49 OF THE LISTING AGREEMENT
The Member ofSONA KOYO STEERING SYSTEMS LIMITED
We have examined the compliance of the conditions of Corporate Governance by SONA KOYO STEERING SYSTEMS LIMITED (“the Company”) for the year ended 31st March 2011 as stipulated in Clause 49 of the Listing Agreement of the Company with Stock Exchanges.
The compliance of conditions of Corporate Governance is the responsibility of the management. Our examination was limited to a review of procedures and implementation thereof, adopted by the Company for ensuring the compliance of the conditions of Corporate Governance as stipulated in the said Clause. It is neither an audit nor an expression of opinion on the financial statements of the Company.
In our opinion and to the best of our information and according to the explanations given to us and based upon the representations made by the directors and the management, we certify that the Company has complied with the conditions of Corporate Governance as stipulated in Clause 49 of the above-mentioned Listing Agreement except Clause 49 1A of the said Listing Agreement for the period 1st April, 2010 to 27th July, 2010.
We further state that such compliance is neither an assurance as to the future viability of the Company nor the efficiency or effectiveness with which the management has conducted the affairs of the Company.
For S.P. Puri & Co.Chartered Accountants
(FRN : 001152N)Place : New DelhiDated : 28th April, 2011 (Rajiv Puri- Partner)
Membership No. 84318
29
ANNUAL GENERAL MEETING
Date : 2nd August, 2011
Venue : The Air Force Auditorium Subroto Park New Delhi 110 010.
Time : 10.00 A.M.
FINANCIAL CALENDAR
Financial year : 1st April to 31st March.
For the year ended 31st March, 2011, results were announced on:
30• th April, 2010 : First Quarter27• th July, 2010 : Second Quarter29• th October, 2011 : Third Quarter28• th January, 2011 : Annual
BOOK CLOSURE
The dates of book closure are from 26th July, 2011 to 2nd August, 2011 inclusive of both days.
DIVIDEND RATE
A 65 per cent dividend on Equity Share Capital was recommended on 28th April, 2011 and subject to approval from the shareholders at the Annual General Meeting, will be paid between 10th August, 2011 to 16th August, 2011.
LISTING
The Company’s Equity Shares are listed on Bombay Stock Exchange Limited and National Stock Exchange of India Limited.
STOCK CODES
Table 1: Stock Codes
Name of the Stock Exchanges Stock Code
Bombay Stock Exchange Limited 520057
National Stock Exchange of India Limited SONASTEER
The ISIN Number of Sona (or demat number) on both NSDL and CDSL is INE643A01035
STOCK DATA
Table 2 gives the monthly high and low prices and volumes of Equity Shares of Sona at Bombay Stock Exchange Ltd. (BSE) and National Stock Exchange of India Limited (NSE) for the year ended 31st March, 2011.
Additional Shareholder Information
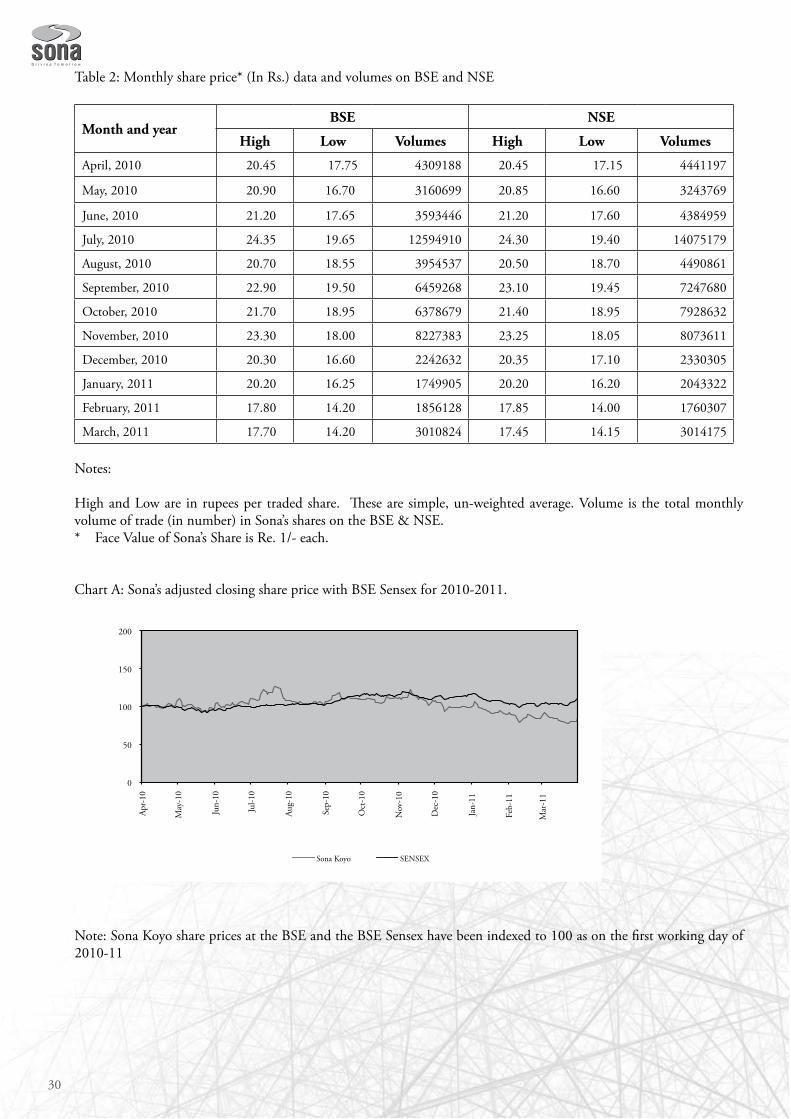
30
Table 2: Monthly share price* (In Rs.) data and volumes on BSE and NSE
Month and yearBSE NSE
High Low Volumes High Low Volumes
April, 2010 20.45 17.75 4309188 20.45 17.15 4441197
May, 2010 20.90 16.70 3160699 20.85 16.60 3243769
June, 2010 21.20 17.65 3593446 21.20 17.60 4384959
July, 2010 24.35 19.65 12594910 24.30 19.40 14075179
August, 2010 20.70 18.55 3954537 20.50 18.70 4490861
September, 2010 22.90 19.50 6459268 23.10 19.45 7247680
October, 2010 21.70 18.95 6378679 21.40 18.95 7928632
November, 2010 23.30 18.00 8227383 23.25 18.05 8073611
December, 2010 20.30 16.60 2242632 20.35 17.10 2330305
January, 2011 20.20 16.25 1749905 20.20 16.20 2043322
February, 2011 17.80 14.20 1856128 17.85 14.00 1760307
March, 2011 17.70 14.20 3010824 17.45 14.15 3014175
Notes:
High and Low are in rupees per traded share. These are simple, un-weighted average. Volume is the total monthly volume of trade (in number) in Sona’s shares on the BSE & NSE.* Face Value of Sona’s Share is Re. 1/- each.
Chart A: Sona’s adjusted closing share price with BSE Sensex for 2010-2011.
Note: Sona Koyo share prices at the BSE and the BSE Sensex have been indexed to 100 as on the first working day of 2010-11
0
50
100
150
200
Apr-
10
May
-10
Jun-
10
Jul-1
0
Aug-
10
Sep-
10
Oct
-10
Nov
-10
Dec
-10
Jan-
11
Feb-
11
Mar
-11
Sona Koyo SENSEX
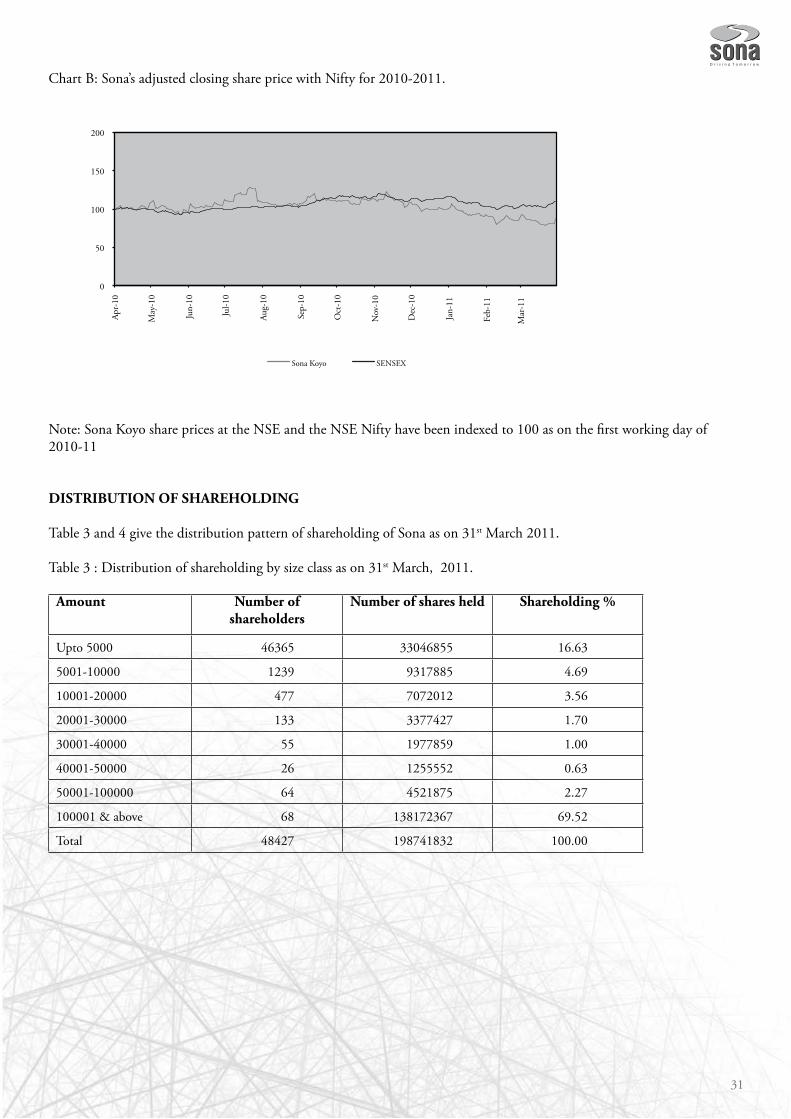
31
Chart B: Sona’s adjusted closing share price with Nifty for 2010-2011.
Note: Sona Koyo share prices at the NSE and the NSE Nifty have been indexed to 100 as on the first working day of 2010-11
DISTRIBUTION OF SHAREHOLDING
Table 3 and 4 give the distribution pattern of shareholding of Sona as on 31st March 2011.
Table 3 : Distribution of shareholding by size class as on 31st March, 2011.
Amount Number of shareholders
Number of shares held Shareholding %
Upto 5000 46365 33046855 16.63
5001-10000 1239 9317885 4.69
10001-20000 477 7072012 3.56
20001-30000 133 3377427 1.70
30001-40000 55 1977859 1.00
40001-50000 26 1255552 0.63
50001-100000 64 4521875 2.27
100001 & above 68 138172367 69.52
Total 48427 198741832 100.00
0
50
100
150
200
Apr-
10
May
-10
Jun-
10
Jul-1
0
Aug-
10
Sep-
10
Oct
-10
Nov
-10
Dec
-10
Jan-
11
Feb-
11
Mar
-11
Sona Koyo SENSEX
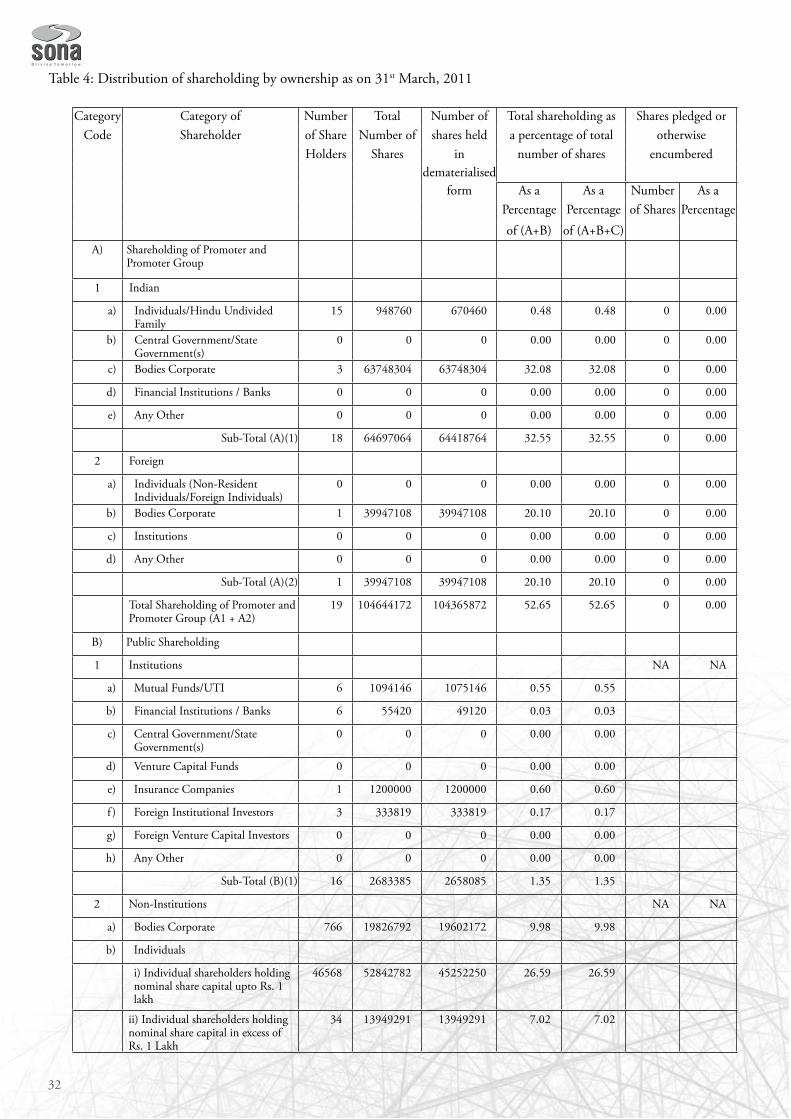
32
Table 4: Distribution of shareholding by ownership as on 31st March, 2011
Category Category of Number Total Number of Total shareholding as Shares pledged orCode Shareholder of Share Number of shares held a percentage of total otherwise
Holders Shares in number of shares encumbereddematerialised
form As a As a Number As aPercentage Percentage of Shares Percentageof (A+B) of (A+B+C)
A) Shareholding of Promoter and Promoter Group
1 Indian
a) Individuals/Hindu Undivided Family
15 948760 670460 0.48 0.48 0 0.00
b) Central Government/State Government(s)
0 0 0 0.00 0.00 0 0.00
c) Bodies Corporate 3 63748304 63748304 32.08 32.08 0 0.00
d) Financial Institutions / Banks 0 0 0 0.00 0.00 0 0.00
e) Any Other 0 0 0 0.00 0.00 0 0.00
Sub-Total (A)(1) 18 64697064 64418764 32.55 32.55 0 0.00
2 Foreign
a) Individuals (Non-Resident Individuals/Foreign Individuals)
0 0 0 0.00 0.00 0 0.00
b) Bodies Corporate 1 39947108 39947108 20.10 20.10 0 0.00
c) Institutions 0 0 0 0.00 0.00 0 0.00
d) Any Other 0 0 0 0.00 0.00 0 0.00
Sub-Total (A)(2) 1 39947108 39947108 20.10 20.10 0 0.00
Total Shareholding of Promoter and Promoter Group (A1 + A2)
19 104644172 104365872 52.65 52.65 0 0.00
B) Public Shareholding
1 Institutions NA NA
a) Mutual Funds/UTI 6 1094146 1075146 0.55 0.55
b) Financial Institutions / Banks 6 55420 49120 0.03 0.03
c) Central Government/State Government(s)
0 0 0 0.00 0.00
d) Venture Capital Funds 0 0 0 0.00 0.00
e) Insurance Companies 1 1200000 1200000 0.60 0.60
f ) Foreign Institutional Investors 3 333819 333819 0.17 0.17
g) Foreign Venture Capital Investors 0 0 0 0.00 0.00
h) Any Other 0 0 0 0.00 0.00
Sub-Total (B)(1) 16 2683385 2658085 1.35 1.35
2 Non-Institutions NA NA
a) Bodies Corporate 766 19826792 19602172 9.98 9.98
b) Individuals
i) Individual shareholders holding nominal share capital upto Rs. 1 lakh
46568 52842782 45252250 26.59 26.59
ii) Individual shareholders holding nominal share capital in excess of Rs. 1 Lakh
34 13949291 13949291 7.02 7.02
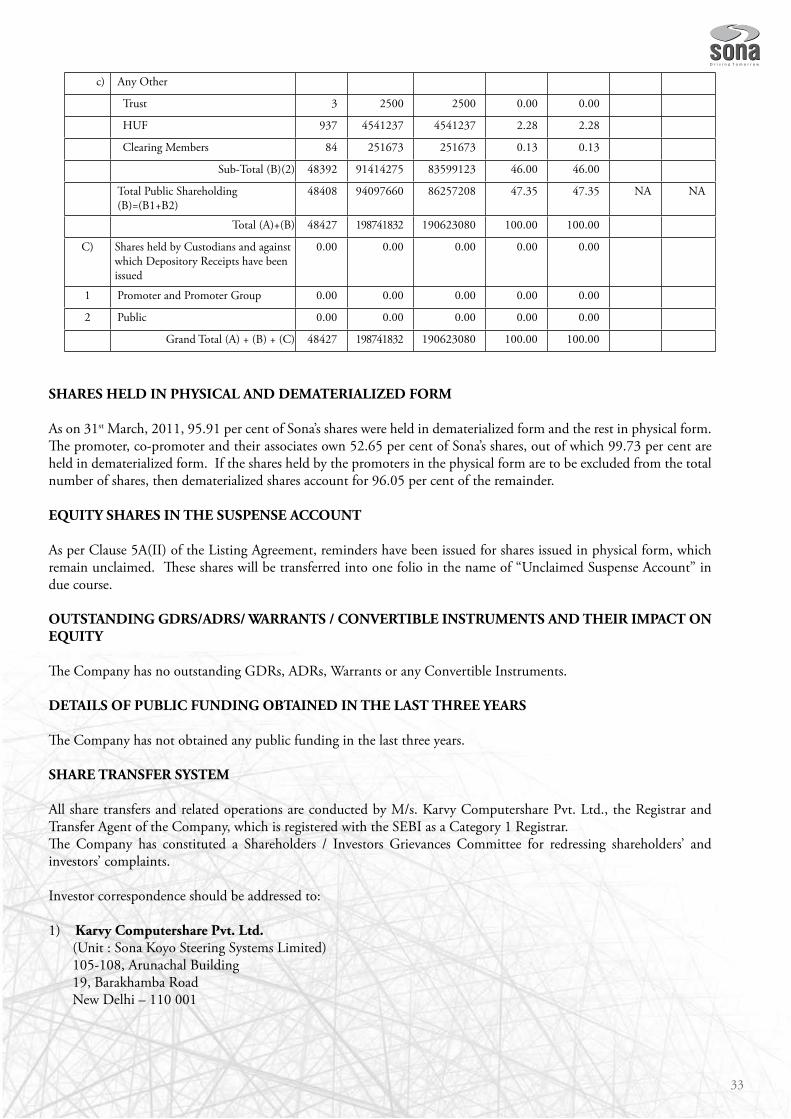
33
c) Any Other
Trust 3 2500 2500 0.00 0.00
HUF 937 4541237 4541237 2.28 2.28
Clearing Members 84 251673 251673 0.13 0.13
Sub-Total (B)(2) 48392 91414275 83599123 46.00 46.00
Total Public Shareholding (B)=(B1+B2)
48408 94097660 86257208 47.35 47.35 NA NA
Total (A)+(B) 48427 198741832 190623080 100.00 100.00
C) Shares held by Custodians and against which Depository Receipts have been issued
0.00 0.00 0.00 0.00 0.00
1 Promoter and Promoter Group 0.00 0.00 0.00 0.00 0.00
2 Public 0.00 0.00 0.00 0.00 0.00
Grand Total (A) + (B) + (C) 48427 198741832 190623080 100.00 100.00
SHARES HELD IN PHYSICAL AND DEMATERIALIZED FORM
As on 31st March, 2011, 95.91 per cent of Sona’s shares were held in dematerialized form and the rest in physical form. The promoter, co-promoter and their associates own 52.65 per cent of Sona’s shares, out of which 99.73 per cent are held in dematerialized form. If the shares held by the promoters in the physical form are to be excluded from the total number of shares, then dematerialized shares account for 96.05 per cent of the remainder.
EQUITY SHARES IN THE SUSPENSE ACCOUNT
As per Clause 5A(II) of the Listing Agreement, reminders have been issued for shares issued in physical form, which remain unclaimed. These shares will be transferred into one folio in the name of “Unclaimed Suspense Account” in due course.
OUTSTANDING GDRS/ADRS/ WARRANTS / CONVERTIBLE INSTRUMENTS AND THEIR IMPACT ON EQUITY
The Company has no outstanding GDRs, ADRs, Warrants or any Convertible Instruments.
DETAILS OF PUBLIC FUNDING OBTAINED IN THE LAST THREE YEARS
The Company has not obtained any public funding in the last three years.
SHARE TRANSFER SYSTEM
All share transfers and related operations are conducted by M/s. Karvy Computershare Pvt. Ltd., the Registrar and Transfer Agent of the Company, which is registered with the SEBI as a Category 1 Registrar. The Company has constituted a Shareholders / Investors Grievances Committee for redressing shareholders’ and investors’ complaints.
Investor correspondence should be addressed to:
1) Karvy Computershare Pvt. Ltd.(Unit : Sona Koyo Steering Systems Limited)105-108, Arunachal Building 19, Barakhamba RoadNew Delhi – 110 001
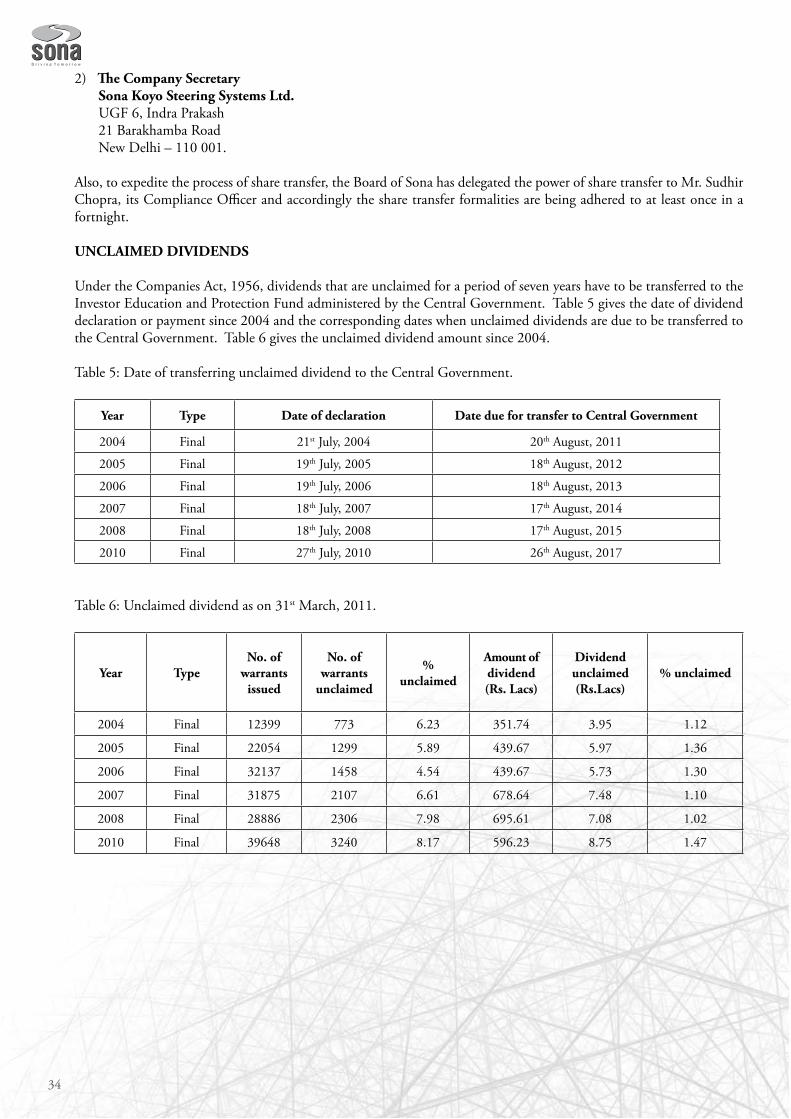
34
2) The Company Secretary Sona Koyo Steering Systems Ltd.UGF 6, Indra Prakash 21 Barakhamba RoadNew Delhi – 110 001.
Also, to expedite the process of share transfer, the Board of Sona has delegated the power of share transfer to Mr. Sudhir Chopra, its Compliance Officer and accordingly the share transfer formalities are being adhered to at least once in a fortnight.
UNCLAIMED DIVIDENDS
Under the Companies Act, 1956, dividends that are unclaimed for a period of seven years have to be transferred to the Investor Education and Protection Fund administered by the Central Government. Table 5 gives the date of dividend declaration or payment since 2004 and the corresponding dates when unclaimed dividends are due to be transferred to the Central Government. Table 6 gives the unclaimed dividend amount since 2004.
Table 5: Date of transferring unclaimed dividend to the Central Government.
Year Type Date of declaration Date due for transfer to Central Government
2004 Final 21st July, 2004 20th August, 2011
2005 Final 19th July, 2005 18th August, 2012
2006 Final 19th July, 2006 18th August, 2013
2007 Final 18th July, 2007 17th August, 2014
2008 Final 18th July, 2008 17th August, 2015
2010 Final 27th July, 2010 26th August, 2017
Table 6: Unclaimed dividend as on 31st March, 2011.
Year TypeNo. of
warrants issued
No. of warrants
unclaimed
% unclaimed
Amount of dividend (Rs. Lacs)
Dividend unclaimed (Rs.Lacs)
% unclaimed
2004 Final 12399 773 6.23 351.74 3.95 1.12
2005 Final 22054 1299 5.89 439.67 5.97 1.36
2006 Final 32137 1458 4.54 439.67 5.73 1.30
2007 Final 31875 2107 6.61 678.64 7.48 1.10
2008 Final 28886 2306 7.98 695.61 7.08 1.02
2010 Final 39648 3240 8.17 596.23 8.75 1.47
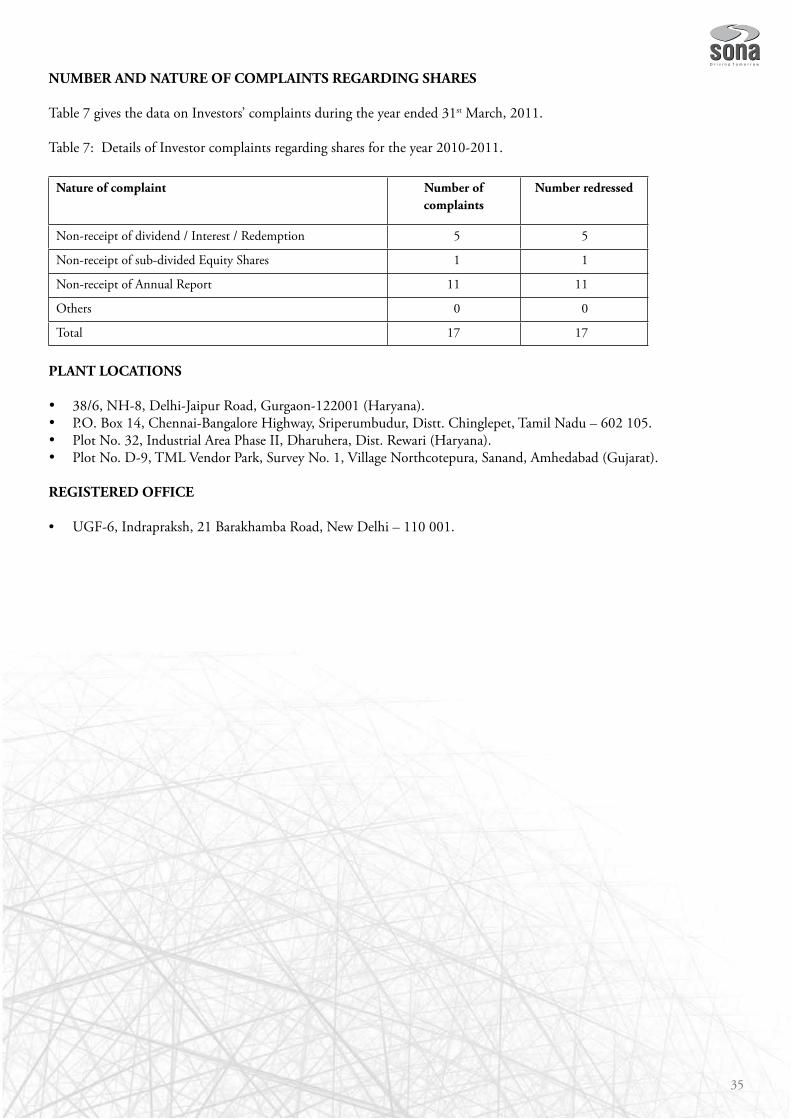
35
NUMBER AND NATURE OF COMPLAINTS REGARDING SHARES
Table 7 gives the data on Investors’ complaints during the year ended 31st March, 2011.
Table 7: Details of Investor complaints regarding shares for the year 2010-2011.
Nature of complaint Number of complaints
Number redressed
Non-receipt of dividend / Interest / Redemption 5 5
Non-receipt of sub-divided Equity Shares 1 1
Non-receipt of Annual Report 11 11
Others 0 0
Total 17 17
PLANT LOCATIONS
38/6, NH-8, Delhi-Jaipur Road, Gurgaon-122001 (Haryana).•P.O. Box 14, Chennai-Bangalore Highway, Sriperumbudur, Distt. Chinglepet, Tamil Nadu – 602 105.•Plot No. 32, Industrial Area Phase II, Dharuhera, Dist. Rewari (Haryana).•Plot No. D-9, TML Vendor Park, Survey No. 1, Village Northcotepura, Sanand, Amhedabad (Gujarat).•
REGISTERED OFFICE
• UGF-6, Indrapraksh, 21 Barakhamba Road, New Delhi – 110 001.
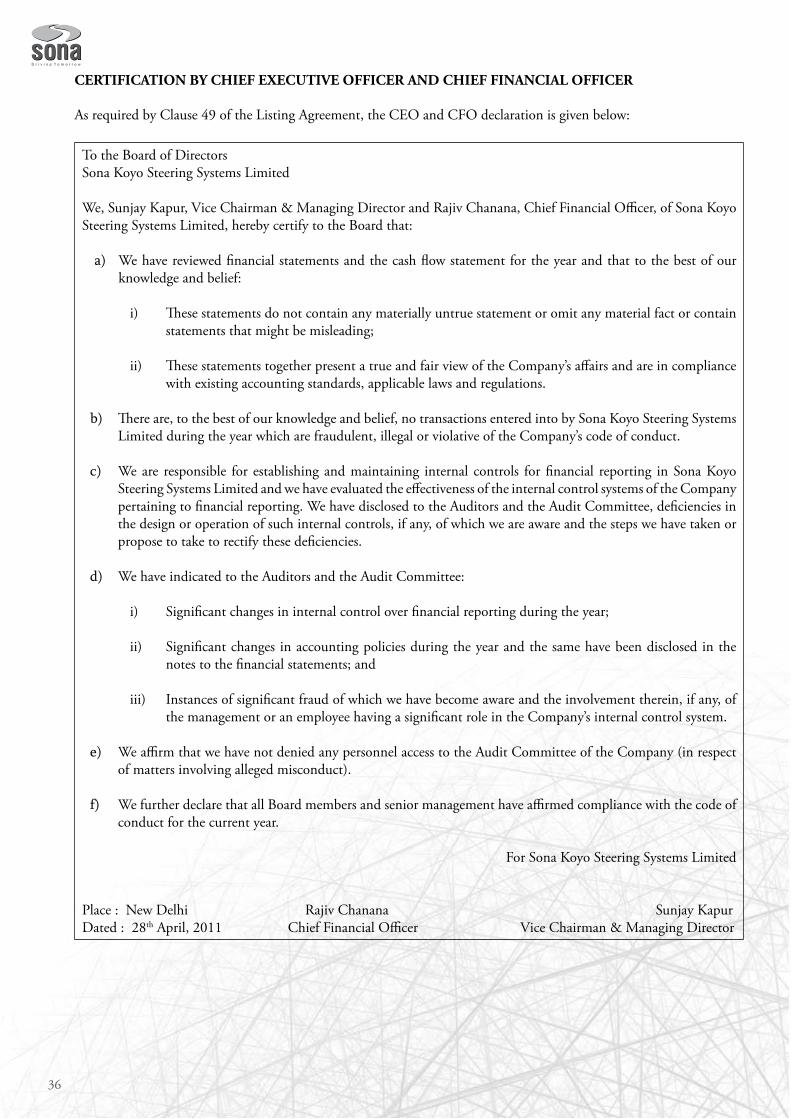
36
CERTIFICATION BY CHIEF EXECUTIVE OFFICER AND CHIEF FINANCIAL OFFICER
As required by Clause 49 of the Listing Agreement, the CEO and CFO declaration is given below:
To the Board of DirectorsSona Koyo Steering Systems Limited
We, Sunjay Kapur, Vice Chairman & Managing Director and Rajiv Chanana, Chief Financial Officer, of Sona Koyo Steering Systems Limited, hereby certify to the Board that:
We have reviewed financial statements and the cash flow statement for the year and that to the best of our a) knowledge and belief:
These statements do not contain any materially untrue statement or omit any material fact or contain i) statements that might be misleading;
These statements together present a true and fair view of the Company’s affairs and are in compliance ii) with existing accounting standards, applicable laws and regulations.
There are, to the best of our knowledge and belief, no transactions entered into by Sona Koyo Steering Systems b) Limited during the year which are fraudulent, illegal or violative of the Company’s code of conduct.
We are responsible for establishing and maintaining internal controls for financial reporting in Sona Koyo c) Steering Systems Limited and we have evaluated the effectiveness of the internal control systems of the Company pertaining to financial reporting. We have disclosed to the Auditors and the Audit Committee, deficiencies in the design or operation of such internal controls, if any, of which we are aware and the steps we have taken or propose to take to rectify these deficiencies.
We have indicated to the Auditors and the Audit Committee:d)
Significant changes in internal control over financial reporting during the year;i)
Significant changes in accounting policies during the year and the same have been disclosed in the ii) notes to the financial statements; and
Instances of significant fraud of which we have become aware and the involvement therein, if any, of iii) the management or an employee having a significant role in the Company’s internal control system.
We affirm that we have not denied any personnel access to the Audit Committee of the Company (in respect e) of matters involving alleged misconduct).
We further declare that all Board members and senior management have affirmed compliance with the code of f) conduct for the current year.
For Sona Koyo Steering Systems Limited
Place : New Delhi Rajiv Chanana Sunjay Kapur Dated : 28th April, 2011 Chief Financial Officer Vice Chairman & Managing Director
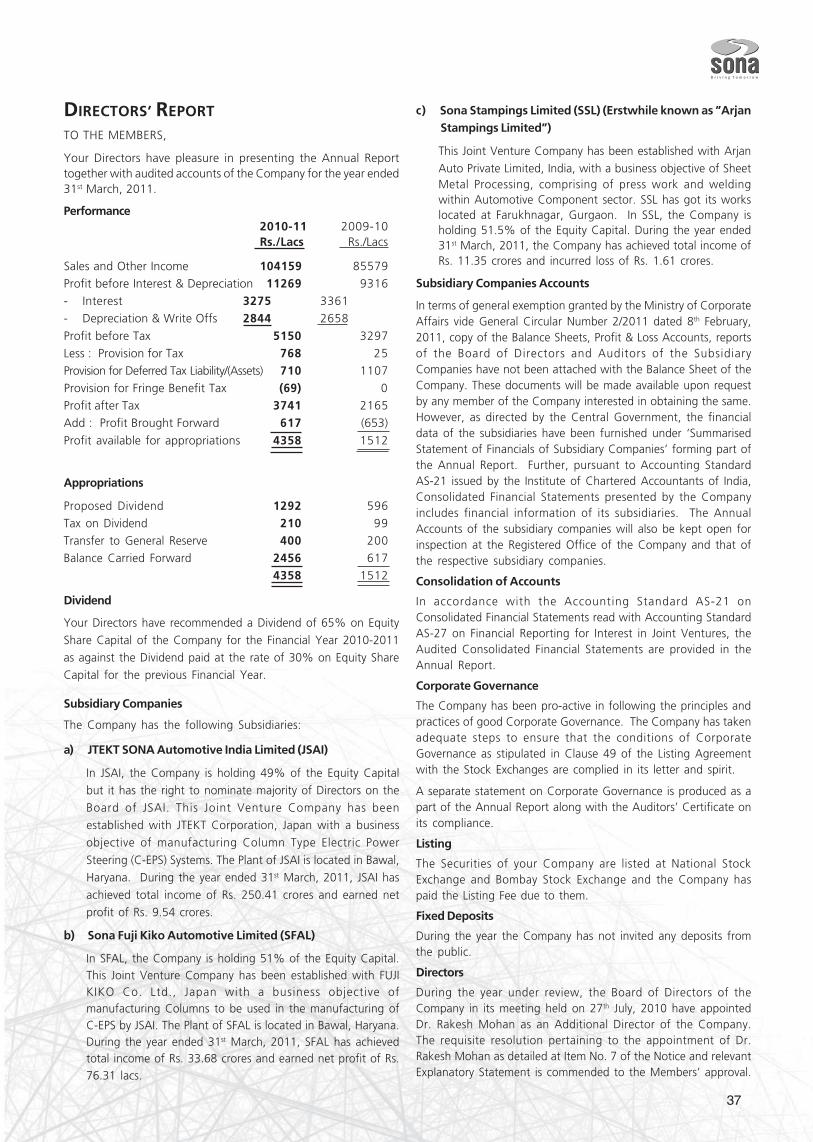
37
DIRECTORS’ REPORT
TO THE MEMBERS,
Your Directors have pleasure in presenting the Annual Reporttogether with audited accounts of the Company for the year ended31st March, 2011.
Performance2010-11 2009-10Rs./Lacs Rs./Lacs
Sales and Other Income 104159 85579
Profit before Interest & Depreciation 11269 9316
- Interest 3275 3361
- Depreciation & Write Offs 2844 2658
Profit before Tax 5150 3297
Less : Provision for Tax 768 25
Provision for Deferred Tax Liability/(Assets) 710 1107
Provision for Fringe Benefit Tax (69) 0
Profit after Tax 3741 2165
Add : Profit Brought Forward 617 (653)
Profit available for appropriations 4358 1512
Appropriations
Proposed Dividend 1292 596
Tax on Dividend 210 99
Transfer to General Reserve 400 200
Balance Carried Forward 2456 617
4358 1512
Dividend
Your Directors have recommended a Dividend of 65% on Equity
Share Capital of the Company for the Financial Year 2010-2011
as against the Dividend paid at the rate of 30% on Equity Share
Capital for the previous Financial Year.
Subsidiary Companies
The Company has the following Subsidiaries:
a) JTEKT SONA Automotive India Limited (JSAI)
In JSAI, the Company is holding 49% of the Equity Capital
but it has the right to nominate majority of Directors on the
Board of JSAI. This Joint Venture Company has been
established with JTEKT Corporation, Japan with a business
objective of manufacturing Column Type Electric Power
Steering (C-EPS) Systems. The Plant of JSAI is located in Bawal,
Haryana. During the year ended 31st March, 2011, JSAI has
achieved total income of Rs. 250.41 crores and earned net
profit of Rs. 9.54 crores.
b) Sona Fuji Kiko Automotive Limited (SFAL)
In SFAL, the Company is holding 51% of the Equity Capital.This Joint Venture Company has been established with FUJIKIKO Co. Ltd., Japan with a business objective ofmanufacturing Columns to be used in the manufacturing ofC-EPS by JSAI. The Plant of SFAL is located in Bawal, Haryana.During the year ended 31st March, 2011, SFAL has achievedtotal income of Rs. 33.68 crores and earned net profit of Rs.76.31 lacs.
c) Sona Stampings Limited (SSL) (Erstwhile known as ”ArjanStampings Limited”)
This Joint Venture Company has been established with Arjan
Auto Private Limited, India, with a business objective of SheetMetal Processing, comprising of press work and weldingwithin Automotive Component sector. SSL has got its workslocated at Farukhnagar, Gurgaon. In SSL, the Company isholding 51.5% of the Equity Capital. During the year ended31st March, 2011, the Company has achieved total income ofRs. 11.35 crores and incurred loss of Rs. 1.61 crores.
Subsidiary Companies Accounts
In terms of general exemption granted by the Ministry of CorporateAffairs vide General Circular Number 2/2011 dated 8th February,2011, copy of the Balance Sheets, Profit & Loss Accounts, reportsof the Board of Directors and Auditors of the SubsidiaryCompanies have not been attached with the Balance Sheet of theCompany. These documents will be made available upon requestby any member of the Company interested in obtaining the same.However, as directed by the Central Government, the financialdata of the subsidiaries have been furnished under ‘SummarisedStatement of Financials of Subsidiary Companies’ forming part ofthe Annual Report. Further, pursuant to Accounting StandardAS-21 issued by the Institute of Chartered Accountants of India,Consolidated Financial Statements presented by the Companyincludes financial information of its subsidiaries. The AnnualAccounts of the subsidiary companies will also be kept open forinspection at the Registered Office of the Company and that ofthe respective subsidiary companies.
Consolidation of Accounts
In accordance with the Accounting Standard AS-21 onConsolidated Financial Statements read with Accounting StandardAS-27 on Financial Reporting for Interest in Joint Ventures, theAudited Consolidated Financial Statements are provided in theAnnual Report.
Corporate Governance
The Company has been pro-active in following the principles andpractices of good Corporate Governance. The Company has takenadequate steps to ensure that the conditions of CorporateGovernance as stipulated in Clause 49 of the Listing Agreementwith the Stock Exchanges are complied in its letter and spirit.
A separate statement on Corporate Governance is produced as apart of the Annual Report along with the Auditors’ Certificate onits compliance.
Listing
The Securities of your Company are listed at National StockExchange and Bombay Stock Exchange and the Company haspaid the Listing Fee due to them.
Fixed Deposits
During the year the Company has not invited any deposits fromthe public.
Directors
During the year under review, the Board of Directors of theCompany in its meeting held on 27th July, 2010 have appointedDr. Rakesh Mohan as an Additional Director of the Company.The requisite resolution pertaining to the appointment of Dr.Rakesh Mohan as detailed at Item No. 7 of the Notice and relevantExplanatory Statement is commended to the Members’ approval.
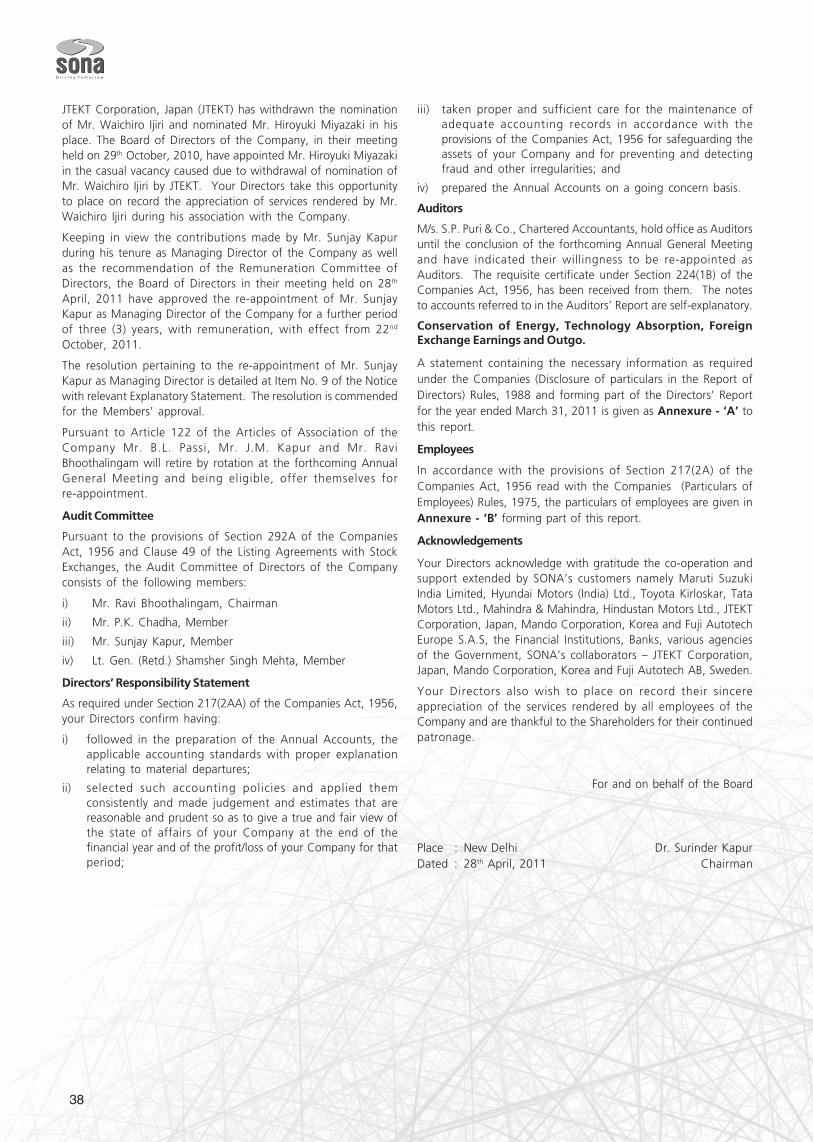
38
JTEKT Corporation, Japan (JTEKT) has withdrawn the nominationof Mr. Waichiro Ijiri and nominated Mr. Hiroyuki Miyazaki in hisplace. The Board of Directors of the Company, in their meetingheld on 29th October, 2010, have appointed Mr. Hiroyuki Miyazakiin the casual vacancy caused due to withdrawal of nomination ofMr. Waichiro Ijiri by JTEKT. Your Directors take this opportunityto place on record the appreciation of services rendered by Mr.Waichiro Ijiri during his association with the Company.
Keeping in view the contributions made by Mr. Sunjay Kapurduring his tenure as Managing Director of the Company as wellas the recommendation of the Remuneration Committee ofDirectors, the Board of Directors in their meeting held on 28th
April, 2011 have approved the re-appointment of Mr. SunjayKapur as Managing Director of the Company for a further periodof three (3) years, with remuneration, with effect from 22nd
October, 2011.
The resolution pertaining to the re-appointment of Mr. SunjayKapur as Managing Director is detailed at Item No. 9 of the Noticewith relevant Explanatory Statement. The resolution is commendedfor the Members’ approval.
Pursuant to Article 122 of the Articles of Association of theCompany Mr. B.L. Passi, Mr. J.M. Kapur and Mr. RaviBhoothalingam will retire by rotation at the forthcoming AnnualGeneral Meeting and being eligible, offer themselves forre-appointment.
Audit Committee
Pursuant to the provisions of Section 292A of the CompaniesAct, 1956 and Clause 49 of the Listing Agreements with StockExchanges, the Audit Committee of Directors of the Companyconsists of the following members:
i) Mr. Ravi Bhoothalingam, Chairman
ii) Mr. P.K. Chadha, Member
iii) Mr. Sunjay Kapur, Member
iv) Lt. Gen. (Retd.) Shamsher Singh Mehta, Member
Directors’ Responsibility Statement
As required under Section 217(2AA) of the Companies Act, 1956,your Directors confirm having:
i) followed in the preparation of the Annual Accounts, theapplicable accounting standards with proper explanationrelating to material departures;
ii) selected such accounting policies and applied themconsistently and made judgement and estimates that arereasonable and prudent so as to give a true and fair view ofthe state of affairs of your Company at the end of thefinancial year and of the profit/loss of your Company for thatperiod;
iii) taken proper and sufficient care for the maintenance ofadequate accounting records in accordance with theprovisions of the Companies Act, 1956 for safeguarding theassets of your Company and for preventing and detectingfraud and other irregularities; and
iv) prepared the Annual Accounts on a going concern basis.
Auditors
M/s. S.P. Puri & Co., Chartered Accountants, hold office as Auditorsuntil the conclusion of the forthcoming Annual General Meetingand have indicated their willingness to be re-appointed asAuditors. The requisite certificate under Section 224(1B) of theCompanies Act, 1956, has been received from them. The notesto accounts referred to in the Auditors’ Report are self-explanatory.
Conservation of Energy, Technology Absorption, ForeignExchange Earnings and Outgo.
A statement containing the necessary information as requiredunder the Companies (Disclosure of particulars in the Report ofDirectors) Rules, 1988 and forming part of the Directors’ Reportfor the year ended March 31, 2011 is given as Annexure - ‘A’ tothis report.
Employees
In accordance with the provisions of Section 217(2A) of theCompanies Act, 1956 read with the Companies (Particulars ofEmployees) Rules, 1975, the particulars of employees are given inAnnexure - ‘B’ forming part of this report.
Acknowledgements
Your Directors acknowledge with gratitude the co-operation andsupport extended by SONA’s customers namely Maruti SuzukiIndia Limited, Hyundai Motors (India) Ltd., Toyota Kirloskar, TataMotors Ltd., Mahindra & Mahindra, Hindustan Motors Ltd., JTEKTCorporation, Japan, Mando Corporation, Korea and Fuji AutotechEurope S.A.S, the Financial Institutions, Banks, various agenciesof the Government, SONA’s collaborators – JTEKT Corporation,Japan, Mando Corporation, Korea and Fuji Autotech AB, Sweden.
Your Directors also wish to place on record their sincereappreciation of the services rendered by all employees of theCompany and are thankful to the Shareholders for their continuedpatronage.
For and on behalf of the Board
Place : New Delhi Dr. Surinder KapurDated : 28th April, 2011 Chairman
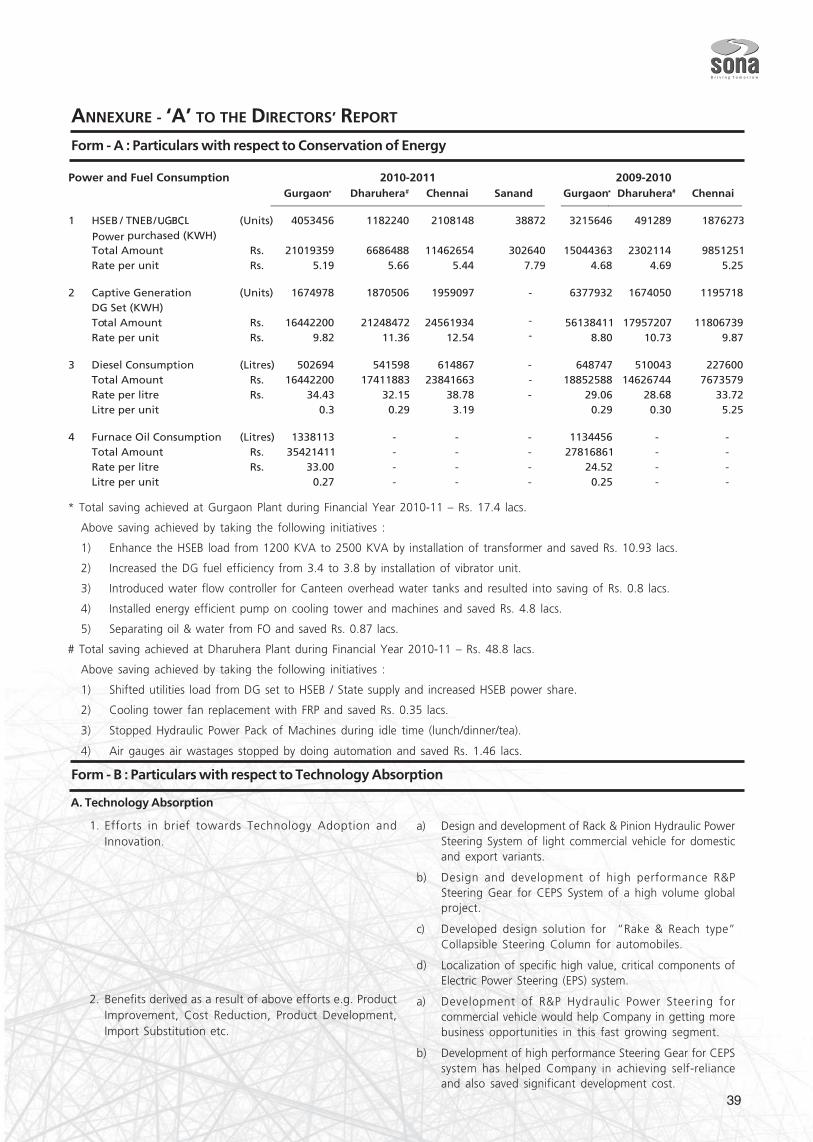
39
ANNEXURE - ‘A’ TO THE DIRECTORS’ REPORT
Form - A : Particulars with respect to Conservation of Energy
* Total saving achieved at Gurgaon Plant during Financial Year 2010-11 – Rs. 17.4 lacs.
Above saving achieved by taking the following initiatives :
1) Enhance the HSEB load from 1200 KVA to 2500 KVA by installation of transformer and saved Rs. 10.93 lacs.
2) Increased the DG fuel efficiency from 3.4 to 3.8 by installation of vibrator unit.
3) Introduced water flow controller for Canteen overhead water tanks and resulted into saving of Rs. 0.8 lacs.
4) Installed energy efficient pump on cooling tower and machines and saved Rs. 4.8 lacs.
5) Separating oil & water from FO and saved Rs. 0.87 lacs.
# Total saving achieved at Dharuhera Plant during Financial Year 2010-11 – Rs. 48.8 lacs.
Above saving achieved by taking the following initiatives :
1) Shifted utilities load from DG set to HSEB / State supply and increased HSEB power share.
2) Cooling tower fan replacement with FRP and saved Rs. 0.35 lacs.
3) Stopped Hydraulic Power Pack of Machines during idle time (lunch/dinner/tea).
4) Air gauges air wastages stopped by doing automation and saved Rs. 1.46 lacs.
A. Technology Absorption
1. Efforts in brief towards Technology Adoption andInnovation.
2. Benefits derived as a result of above efforts e.g. ProductImprovement, Cost Reduction, Product Development,Import Substitution etc.
a) Design and development of Rack & Pinion Hydraulic PowerSteering System of light commercial vehicle for domesticand export variants.
b) Design and development of high performance R&PSteering Gear for CEPS System of a high volume globalproject.
c) Developed design solution for “Rake & Reach type”Collapsible Steering Column for automobiles.
d) Localization of specific high value, critical components ofElectric Power Steering (EPS) system.
a) Development of R&P Hydraulic Power Steering forcommercial vehicle would help Company in getting morebusiness opportunities in this fast growing segment.
b) Development of high performance Steering Gear for CEPSsystem has helped Company in achieving self-relianceand also saved significant development cost.
Form - B : Particulars with respect to Technology Absorption
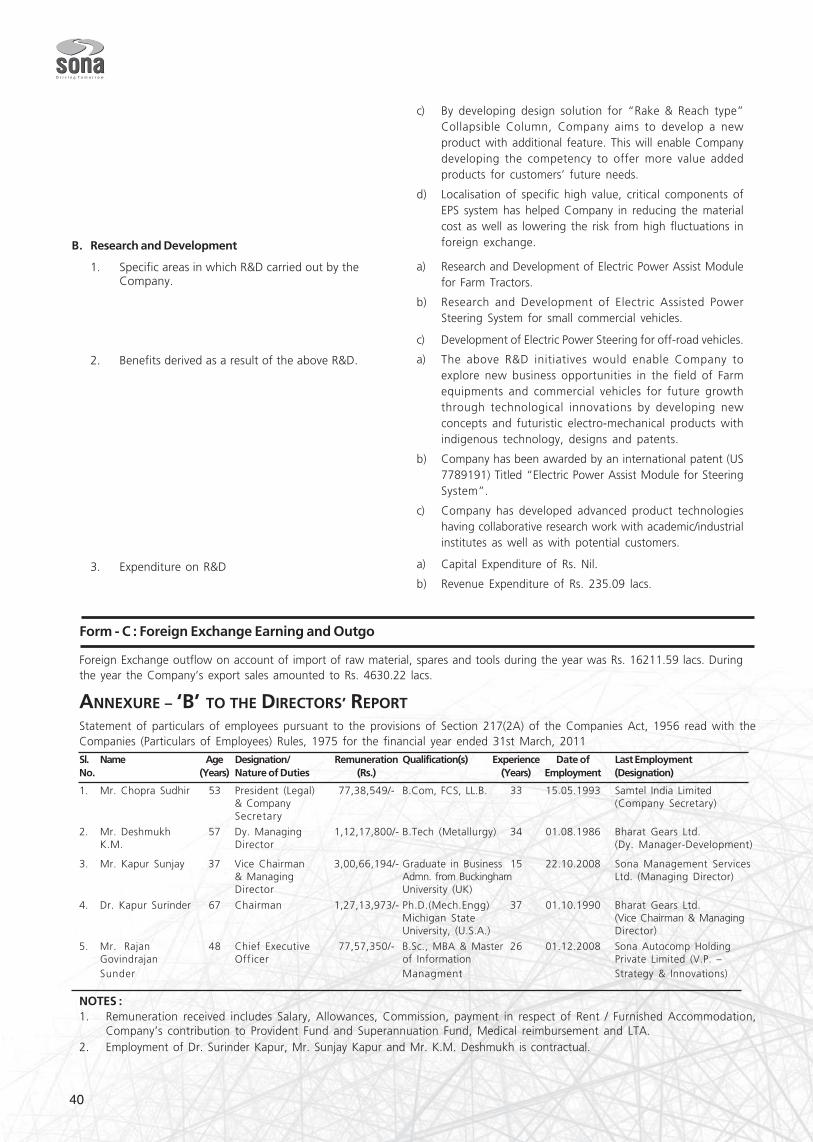
40
a) Research and Development of Electric Power Assist Modulefor Farm Tractors.
b) Research and Development of Electric Assisted PowerSteering System for small commercial vehicles.
c) Development of Electric Power Steering for off-road vehicles.
a) The above R&D initiatives would enable Company toexplore new business opportunities in the field of Farmequipments and commercial vehicles for future growththrough technological innovations by developing newconcepts and futuristic electro-mechanical products withindigenous technology, designs and patents.
b) Company has been awarded by an international patent (US7789191) Titled “Electric Power Assist Module for SteeringSystem”.
c) Company has developed advanced product technologieshaving collaborative research work with academic/industrialinstitutes as well as with potential customers.
a) Capital Expenditure of Rs. Nil.
b) Revenue Expenditure of Rs. 235.09 lacs.
Form - C : Foreign Exchange Earning and Outgo
Foreign Exchange outflow on account of import of raw material, spares and tools during the year was Rs. 16211.59 lacs. Duringthe year the Company’s export sales amounted to Rs. 4630.22 lacs.
ANNEXURE – ‘B’ TO THE DIRECTORS’ REPORT
Statement of particulars of employees pursuant to the provisions of Section 217(2A) of the Companies Act, 1956 read with theCompanies (Particulars of Employees) Rules, 1975 for the financial year ended 31st March, 2011
Sl. Name Age Designation/ Remuneration Qualification(s) Experience Date of Last EmploymentNo. (Years) Nature of Duties (Rs.) (Years) Employment (Designation)
1. Mr. Chopra Sudhir 53 President (Legal) 77,38,549/- B.Com, FCS, LL.B. 33 15.05.1993 Samtel India Limited& Company (Company Secretary)Secretary
2. Mr. Deshmukh 57 Dy. Managing 1,12,17,800/- B.Tech (Metallurgy) 34 01.08.1986 Bharat Gears Ltd.K.M. Director (Dy. Manager-Development)
3. Mr. Kapur Sunjay 37 Vice Chairman 3,00,66,194/- Graduate in Business 15 22.10.2008 Sona Management Services& Managing Admn. from Buckingham Ltd. (Managing Director)Director University (UK)
4. Dr. Kapur Surinder 67 Chairman 1,27,13,973/- Ph.D.(Mech.Engg) 37 01.10.1990 Bharat Gears Ltd.Michigan State (Vice Chairman & ManagingUniversity, (U.S.A.) Director)
5. Mr. Rajan 48 Chief Executive 77,57,350/- B.Sc., MBA & Master 26 01.12.2008 Sona Autocomp HoldingGovindrajan Officer of Information Private Limited (V.P. –Sunder Managment Strategy & Innovations)
NOTES :1. Remuneration received includes Salary, Allowances, Commission, payment in respect of Rent / Furnished Accommodation,
Company’s contribution to Provident Fund and Superannuation Fund, Medical reimbursement and LTA.2. Employment of Dr. Surinder Kapur, Mr. Sunjay Kapur and Mr. K.M. Deshmukh is contractual.
c) By developing design solution for “Rake & Reach type”Collapsible Column, Company aims to develop a newproduct with additional feature. This will enable Companydeveloping the competency to offer more value addedproducts for customers’ future needs.
d) Localisation of specific high value, critical components ofEPS system has helped Company in reducing the materialcost as well as lowering the risk from high fluctuations inforeign exchange.B. Research and Development
1. Specific areas in which R&D carried out by theCompany.
2. Benefits derived as a result of the above R&D.
3. Expenditure on R&D
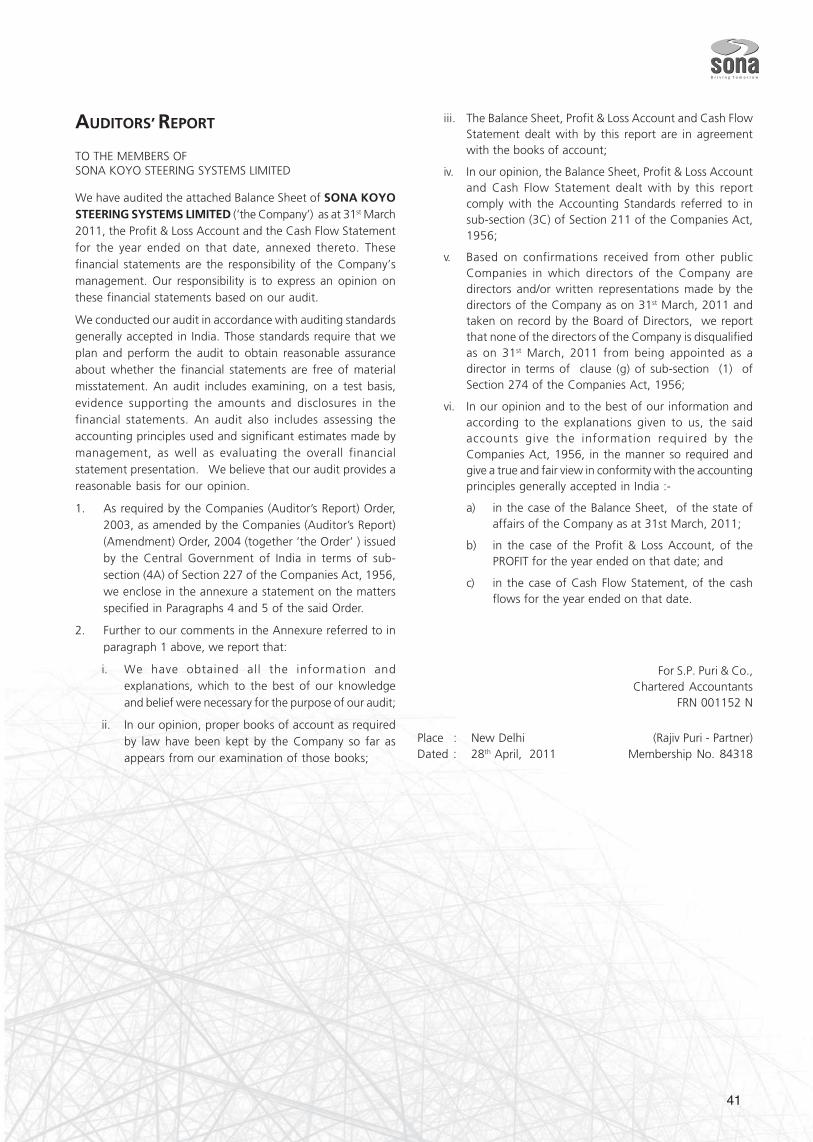
41
AUDITORS’ REPORT
TO THE MEMBERS OFSONA KOYO STEERING SYSTEMS LIMITED
We have audited the attached Balance Sheet of SONA KOYOSTEERING SYSTEMS LIMITED (‘the Company’) as at 31st March2011, the Profit & Loss Account and the Cash Flow Statementfor the year ended on that date, annexed thereto. Thesefinancial statements are the responsibility of the Company’smanagement. Our responsibility is to express an opinion onthese financial statements based on our audit.
We conducted our audit in accordance with auditing standardsgenerally accepted in India. Those standards require that weplan and perform the audit to obtain reasonable assuranceabout whether the financial statements are free of materialmisstatement. An audit includes examining, on a test basis,evidence supporting the amounts and disclosures in thefinancial statements. An audit also includes assessing theaccounting principles used and significant estimates made bymanagement, as well as evaluating the overall financialstatement presentation. We believe that our audit provides areasonable basis for our opinion.
1. As required by the Companies (Auditor’s Report) Order,2003, as amended by the Companies (Auditor’s Report)(Amendment) Order, 2004 (together ‘the Order’ ) issuedby the Central Government of India in terms of sub-section (4A) of Section 227 of the Companies Act, 1956,we enclose in the annexure a statement on the mattersspecified in Paragraphs 4 and 5 of the said Order.
2. Further to our comments in the Annexure referred to inparagraph 1 above, we report that:
i. We have obtained all the information andexplanations, which to the best of our knowledgeand belief were necessary for the purpose of our audit;
ii. In our opinion, proper books of account as requiredby law have been kept by the Company so far asappears from our examination of those books;
iii. The Balance Sheet, Profit & Loss Account and Cash FlowStatement dealt with by this report are in agreementwith the books of account;
iv. In our opinion, the Balance Sheet, Profit & Loss Accountand Cash Flow Statement dealt with by this reportcomply with the Accounting Standards referred to insub-section (3C) of Section 211 of the Companies Act,1956;
v. Based on confirmations received from other publicCompanies in which directors of the Company aredirectors and/or written representations made by thedirectors of the Company as on 31st March, 2011 andtaken on record by the Board of Directors, we reportthat none of the directors of the Company is disqualifiedas on 31st March, 2011 from being appointed as adirector in terms of clause (g) of sub-section (1) ofSection 274 of the Companies Act, 1956;
vi. In our opinion and to the best of our information andaccording to the explanations given to us, the saidaccounts give the information required by theCompanies Act, 1956, in the manner so required andgive a true and fair view in conformity with the accountingprinciples generally accepted in India :-
a) in the case of the Balance Sheet, of the state ofaffairs of the Company as at 31st March, 2011;
b) in the case of the Profit & Loss Account, of thePROFIT for the year ended on that date; and
c) in the case of Cash Flow Statement, of the cashflows for the year ended on that date.
For S.P. Puri & Co.,Chartered Accountants
FRN 001152 N
Place : New Delhi (Rajiv Puri - Partner)Dated : 28th April, 2011 Membership No. 84318
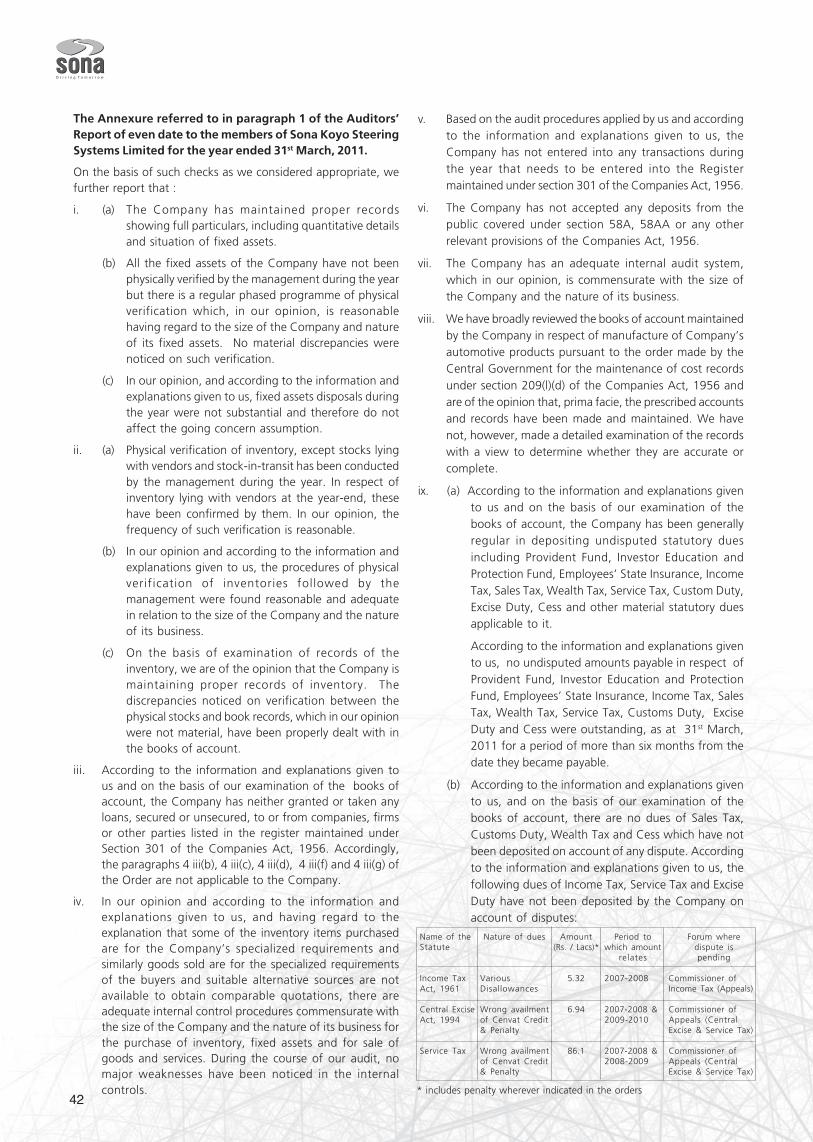
42
The Annexure referred to in paragraph 1 of the Auditors’Report of even date to the members of Sona Koyo SteeringSystems Limited for the year ended 31st March, 2011.
On the basis of such checks as we considered appropriate, wefurther report that :
i. (a) The Company has maintained proper recordsshowing full particulars, including quantitative detailsand situation of fixed assets.
(b) All the fixed assets of the Company have not beenphysically verified by the management during the yearbut there is a regular phased programme of physicalverification which, in our opinion, is reasonablehaving regard to the size of the Company and natureof its fixed assets. No material discrepancies werenoticed on such verification.
(c) In our opinion, and according to the information andexplanations given to us, fixed assets disposals duringthe year were not substantial and therefore do notaffect the going concern assumption.
ii. (a) Physical verification of inventory, except stocks lyingwith vendors and stock-in-transit has been conductedby the management during the year. In respect ofinventory lying with vendors at the year-end, thesehave been confirmed by them. In our opinion, thefrequency of such verification is reasonable.
(b) In our opinion and according to the information andexplanations given to us, the procedures of physicalverification of inventories followed by themanagement were found reasonable and adequatein relation to the size of the Company and the natureof its business.
(c) On the basis of examination of records of theinventory, we are of the opinion that the Company ismaintaining proper records of inventory. Thediscrepancies noticed on verification between thephysical stocks and book records, which in our opinionwere not material, have been properly dealt with inthe books of account.
iii. According to the information and explanations given tous and on the basis of our examination of the books ofaccount, the Company has neither granted or taken anyloans, secured or unsecured, to or from companies, firmsor other parties listed in the register maintained underSection 301 of the Companies Act, 1956. Accordingly,the paragraphs 4 iii(b), 4 iii(c), 4 iii(d), 4 iii(f) and 4 iii(g) ofthe Order are not applicable to the Company.
iv. In our opinion and according to the information andexplanations given to us, and having regard to theexplanation that some of the inventory items purchasedare for the Company’s specialized requirements andsimilarly goods sold are for the specialized requirementsof the buyers and suitable alternative sources are notavailable to obtain comparable quotations, there areadequate internal control procedures commensurate withthe size of the Company and the nature of its business forthe purchase of inventory, fixed assets and for sale ofgoods and services. During the course of our audit, nomajor weaknesses have been noticed in the internalcontrols.
v. Based on the audit procedures applied by us and accordingto the information and explanations given to us, theCompany has not entered into any transactions duringthe year that needs to be entered into the Registermaintained under section 301 of the Companies Act, 1956.
vi. The Company has not accepted any deposits from thepublic covered under section 58A, 58AA or any otherrelevant provisions of the Companies Act, 1956.
vii. The Company has an adequate internal audit system,which in our opinion, is commensurate with the size ofthe Company and the nature of its business.
viii. We have broadly reviewed the books of account maintainedby the Company in respect of manufacture of Company’sautomotive products pursuant to the order made by theCentral Government for the maintenance of cost recordsunder section 209(l)(d) of the Companies Act, 1956 andare of the opinion that, prima facie, the prescribed accountsand records have been made and maintained. We havenot, however, made a detailed examination of the recordswith a view to determine whether they are accurate orcomplete.
ix. (a) According to the information and explanations givento us and on the basis of our examination of thebooks of account, the Company has been generallyregular in depositing undisputed statutory duesincluding Provident Fund, Investor Education andProtection Fund, Employees’ State Insurance, IncomeTax, Sales Tax, Wealth Tax, Service Tax, Custom Duty,Excise Duty, Cess and other material statutory duesapplicable to it.
According to the information and explanations givento us, no undisputed amounts payable in respect ofProvident Fund, Investor Education and ProtectionFund, Employees’ State Insurance, Income Tax, SalesTax, Wealth Tax, Service Tax, Customs Duty, ExciseDuty and Cess were outstanding, as at 31st March,2011 for a period of more than six months from thedate they became payable.
(b) According to the information and explanations givento us, and on the basis of our examination of thebooks of account, there are no dues of Sales Tax,Customs Duty, Wealth Tax and Cess which have notbeen deposited on account of any dispute. Accordingto the information and explanations given to us, thefollowing dues of Income Tax, Service Tax and ExciseDuty have not been deposited by the Company onaccount of disputes:
Name of the Nature of dues Amount Period to Forum whereStatute (Rs. / Lacs)* which amount dispute is
relates pending
Income Tax Various 5.32 2007-2008 Commissioner ofAct, 1961 Disallowances Income Tax (Appeals)
Central Excise Wrong availment 6.94 2007-2008 & Commissioner ofAct, 1994 of Cenvat Credit 2009-2010 Appeals (Central
& Penalty Excise & Service Tax)
Service Tax Wrong availment 86.1 2007-2008 & Commissioner ofof Cenvat Credit 2008-2009 Appeals (Central& Penalty Excise & Service Tax)
* includes penalty wherever indicated in the orders
43
x. The Company does not have any accumulated losses atthe end of the financial year and has not incurred cashlosses in the current financial year and in the immediatelypreceding financial year.
xi. Based on our audit procedures and on the informationand explanations given to us, the Company has notdefaulted in repayment of dues to its bankers or to anyfinancial institutions. The Company did not have anyoutstanding debentures during the year.
xii. According to the information and explanations given tous, the Company has not granted loans and advances onthe basis of security by way of pledge of shares,debentures and other securities.
xiii. The Company is not a chit fund or a nidhi/ mutual benefitfund/society. Therefore, the provision of this clause ofthe Companies (Auditor’s Report) Order, 2003 is notapplicable to the Company.
xiv. According to information and explanations given to us,the Company is not dealing or trading in Shares,Securities, Debentures and other investments.
xv. According to the information and explanations given tous, the Company has not given any guarantee for anyloan taken by others from a bank or financial institution.
xvi. Based on our audit procedures and on the informationand explanations given by the management, the term
loans have been applied for the purpose for which theywere raised.
xvii. Based on the information and explanations given to usand on an overall examination of the Balance Sheet of theCompany as at 31st March, 2011, we are of the opinionthat no funds raised on short term basis have been usedfor long term investment by the Company.
xviii. The Company has not made any preferential allotment ofshares during the year.
xix. The Company has no outstanding debentures during theyear.
xx. The Company has not raised any money by public issueduring the year.
xxi. Based on the audit procedures performed and theinformation and explanations given by the management,we report that no fraud on or by the Company has beennoticed or reported during the year.
For S.P. Puri & Co.,Chartered Accountants
FRN 001152 N
Place : New Delhi (Rajiv Puri - Partner)Dated : 28th April, 2011 Membership No. 84318
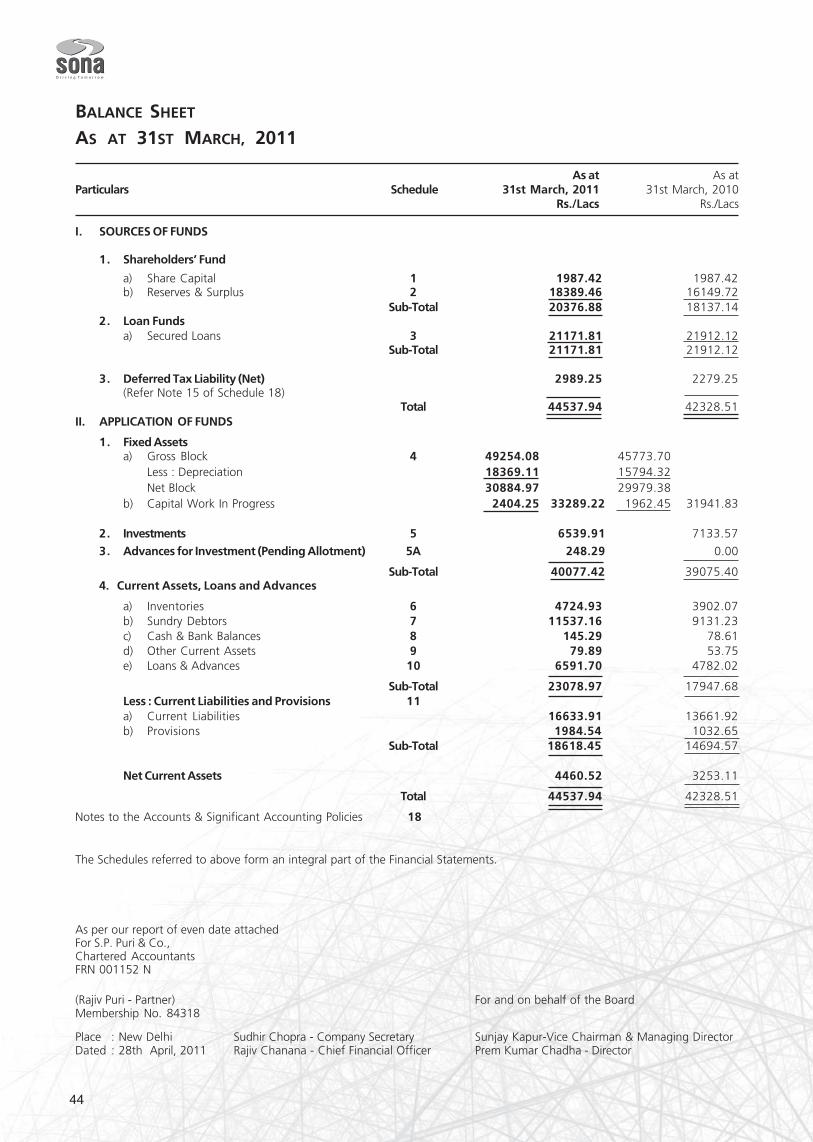
44
BALANCE SHEET
AS AT 31ST MARCH, 2011
As at As atParticulars Schedule 31st March, 2011 31st March, 2010
Rs./Lacs Rs./Lacs
I. SOURCES OF FUNDS
1. Shareholders’ Fund
a) Share Capital 1 1987.42 1987.42b) Reserves & Surplus 2 18389.46 16149.72
Sub-Total 20376.88 18137.142. Loan Funds
a) Secured Loans 3 21171.81 21912.12Sub-Total 21171.81 21912.12
3. Deferred Tax Liability (Net) 2989.25 2279.25(Refer Note 15 of Schedule 18)
Total 44537.94 42328.51II. APPLICATION OF FUNDS
1. Fixed Assetsa) Gross Block 4 49254.08 45773.70
Less : Depreciation 18369.11 15794.32Net Block 30884.97 29979.38
b) Capital Work In Progress 2404.25 33289.22 1962.45 31941.83
2. Investments 5 6539.91 7133.57
3. Advances for Investment (Pending Allotment) 5A 248.29 0.00
Sub-Total 40077.42 39075.404. Current Assets, Loans and Advances
a) Inventories 6 4724.93 3902.07b) Sundry Debtors 7 11537.16 9131.23c) Cash & Bank Balances 8 145.29 78.61d) Other Current Assets 9 79.89 53.75e) Loans & Advances 10 6591.70 4782.02
Sub-Total 23078.97 17947.68Less : Current Liabilities and Provisions 11a) Current Liabilities 16633.91 13661.92b) Provisions 1984.54 1032.65
Sub-Total 18618.45 14694.57
Net Current Assets 4460.52 3253.11
Total 44537.94 42328.51
Notes to the Accounts & Significant Accounting Policies 18
The Schedules referred to above form an integral part of the Financial Statements.
As per our report of even date attachedFor S.P. Puri & Co.,Chartered AccountantsFRN 001152 N
(Rajiv Puri - Partner) For and on behalf of the BoardMembership No. 84318
Place : New Delhi Sudhir Chopra - Company Secretary Sunjay Kapur-Vice Chairman & Managing DirectorDated : 28th April, 2011 Rajiv Chanana - Chief Financial Officer Prem Kumar Chadha - Director
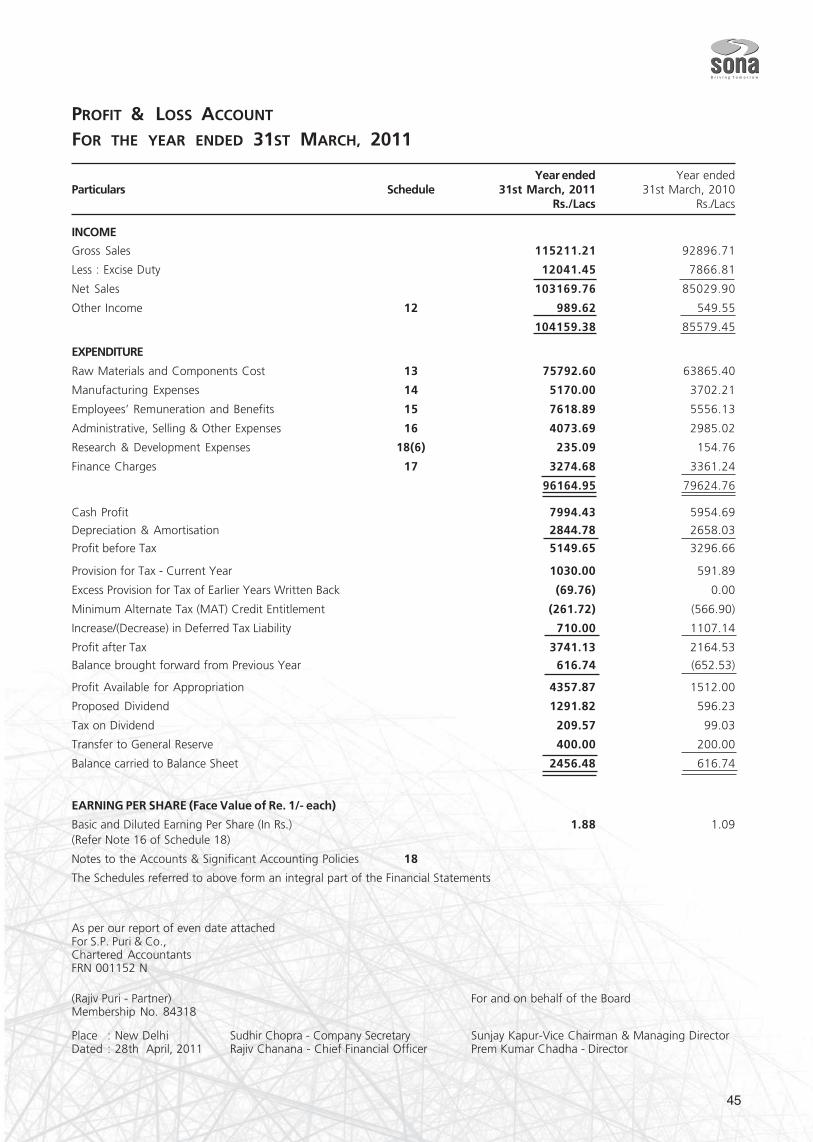
45
PROFIT & LOSS ACCOUNT
FOR THE YEAR ENDED 31ST MARCH, 2011
Year ended Year endedParticulars Schedule 31st March, 2011 31st March, 2010
Rs./Lacs Rs./Lacs
INCOME
Gross Sales 115211.21 92896.71
Less : Excise Duty 12041.45 7866.81
Net Sales 103169.76 85029.90
Other Income 12 989.62 549.55
104159.38 85579.45
EXPENDITURE
Raw Materials and Components Cost 13 75792.60 63865.40
Manufacturing Expenses 14 5170.00 3702.21
Employees’ Remuneration and Benefits 15 7618.89 5556.13
Administrative, Selling & Other Expenses 16 4073.69 2985.02
Research & Development Expenses 18(6) 235.09 154.76
Finance Charges 17 3274.68 3361.24
96164.95 79624.76
Cash Profit 7994.43 5954.69
Depreciation & Amortisation 2844.78 2658.03
Profit before Tax 5149.65 3296.66
Provision for Tax - Current Year 1030.00 591.89
Excess Provision for Tax of Earlier Years Written Back (69.76) 0.00
Minimum Alternate Tax (MAT) Credit Entitlement (261.72) (566.90)
Increase/(Decrease) in Deferred Tax Liability 710.00 1107.14
Profit after Tax 3741.13 2164.53
Balance brought forward from Previous Year 616.74 (652.53)
Profit Available for Appropriation 4357.87 1512.00
Proposed Dividend 1291.82 596.23
Tax on Dividend 209.57 99.03
Transfer to General Reserve 400.00 200.00
Balance carried to Balance Sheet 2456.48 616.74
EARNING PER SHARE (Face Value of Re. 1/- each)
Basic and Diluted Earning Per Share (In Rs.) 1.88 1.09(Refer Note 16 of Schedule 18)
Notes to the Accounts & Significant Accounting Policies 18
The Schedules referred to above form an integral part of the Financial Statements
As per our report of even date attachedFor S.P. Puri & Co.,Chartered AccountantsFRN 001152 N
(Rajiv Puri - Partner) For and on behalf of the BoardMembership No. 84318
Place : New Delhi Sudhir Chopra - Company Secretary Sunjay Kapur-Vice Chairman & Managing DirectorDated : 28th April, 2011 Rajiv Chanana - Chief Financial Officer Prem Kumar Chadha - Director
860
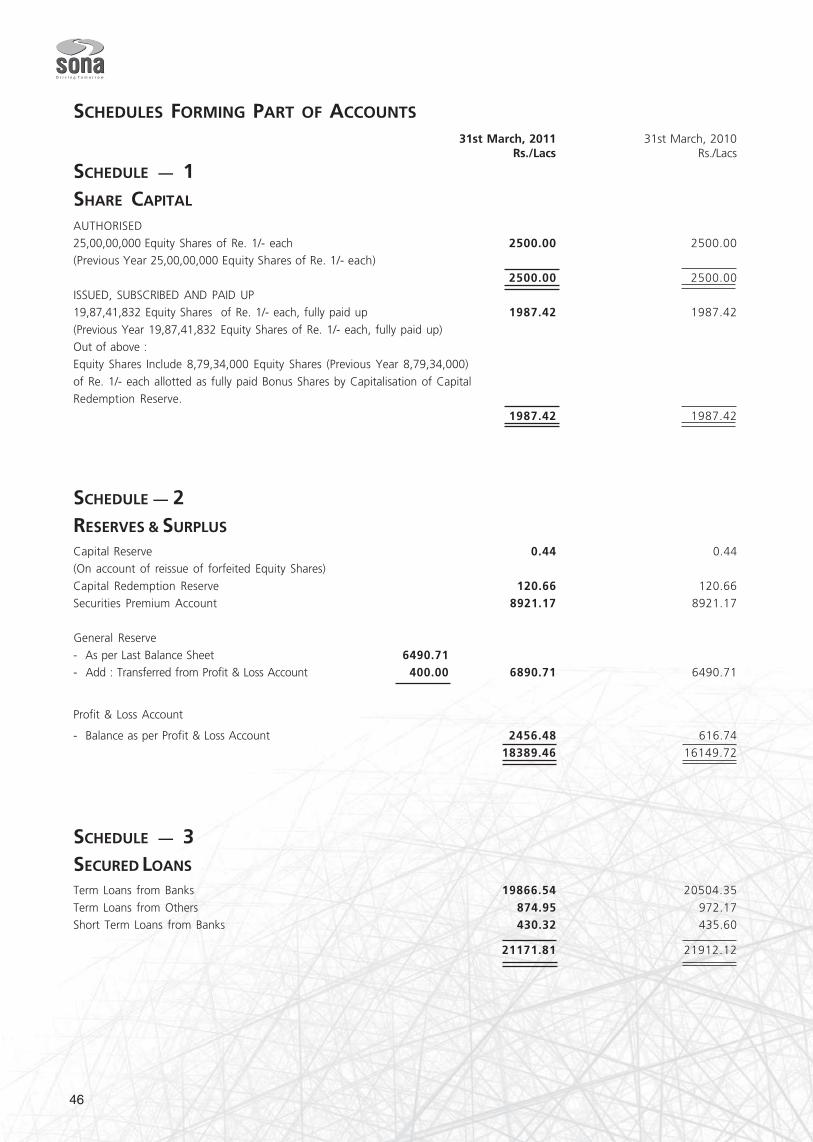
46
SCHEDULES FORMING PART OF ACCOUNTS
31st March, 2011 31st March, 2010Rs./Lacs Rs./Lacs
SCHEDULE — 1SHARE CAPITAL
AUTHORISED25,00,00,000 Equity Shares of Re. 1/- each 2500.00 2500.00(Previous Year 25,00,00,000 Equity Shares of Re. 1/- each)
2500.00 2500.00ISSUED, SUBSCRIBED AND PAID UP19,87,41,832 Equity Shares of Re. 1/- each, fully paid up 1987.42 1987.42
(Previous Year 19,87,41,832 Equity Shares of Re. 1/- each, fully paid up)Out of above :Equity Shares Include 8,79,34,000 Equity Shares (Previous Year 8,79,34,000)
of Re. 1/- each allotted as fully paid Bonus Shares by Capitalisation of CapitalRedemption Reserve.
1987.42 1987.42
SCHEDULE — 2RESERVES & SURPLUS
Capital Reserve 0.44 0.44(On account of reissue of forfeited Equity Shares)
Capital Redemption Reserve 120.66 120.66Securities Premium Account 8921.17 8921.17
General Reserve- As per Last Balance Sheet 6490.71- Add : Transferred from Profit & Loss Account 400.00 6890.71 6490.71
Profit & Loss Account
- Balance as per Profit & Loss Account 2456.48 616.7418389.46 16149.72
SCHEDULE — 3SECURED LOANS
Term Loans from Banks 19866.54 20504.35
Term Loans from Others 874.95 972.17Short Term Loans from Banks 430.32 435.60
21171.81 21912.12
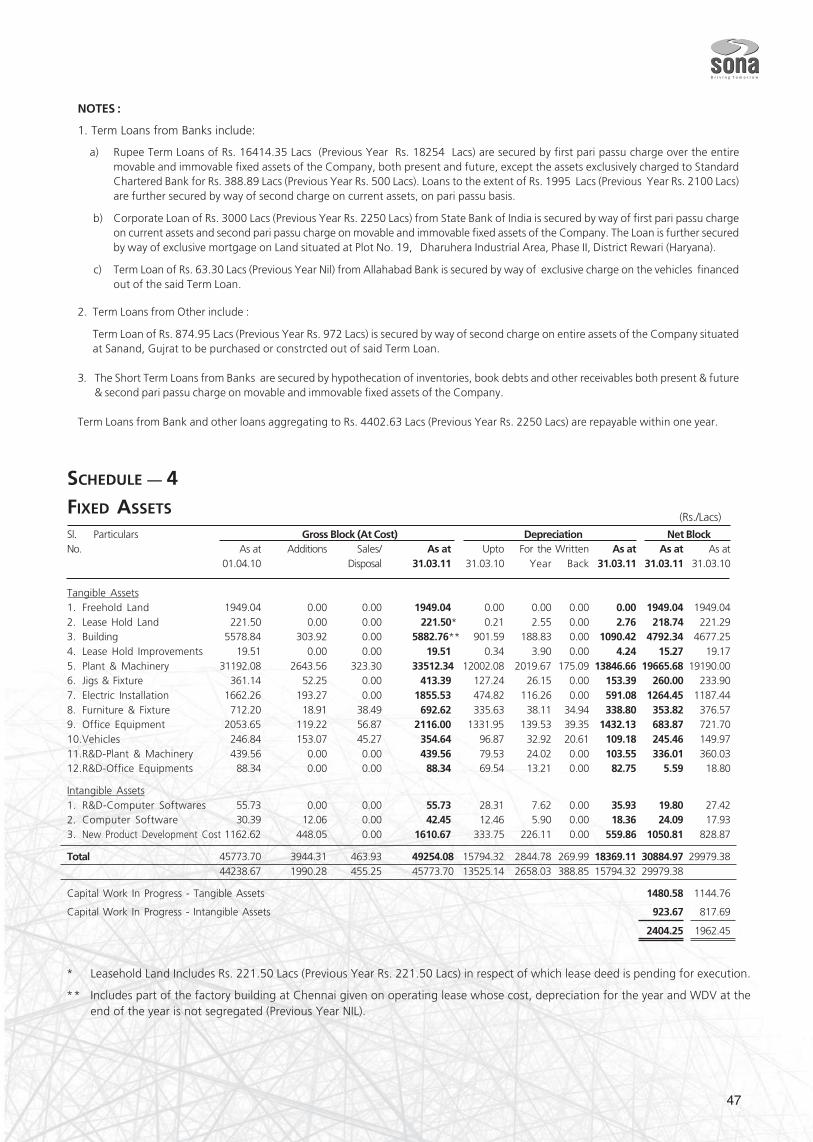
47
SCHEDULE — 4FIXED ASSETS
Sl. Particulars Gross Block (At Cost) Depreciation Net BlockNo. As at Additions Sales/ As at Upto For the Written As at As at As at
01.04.10 Disposal 31.03.11 31.03.10 Year Back 31.03.11 31.03.11 31.03.10
Tangible Assets1. Freehold Land 1949.04 0.00 0.00 1949.04 0.00 0.00 0.00 0.00 1949.04 1949.042. Lease Hold Land 221.50 0.00 0.00 221.50* 0.21 2.55 0.00 2.76 218.74 221.293. Building 5578.84 303.92 0.00 5882.76** 901.59 188.83 0.00 1090.42 4792.34 4677.254. Lease Hold Improvements 19.51 0.00 0.00 19.51 0.34 3.90 0.00 4.24 15.27 19.175. Plant & Machinery 31192.08 2643.56 323.30 33512.34 12002.08 2019.67 175.09 13846.66 19665.68 19190.006. Jigs & Fixture 361.14 52.25 0.00 413.39 127.24 26.15 0.00 153.39 260.00 233.907. Electric Installation 1662.26 193.27 0.00 1855.53 474.82 116.26 0.00 591.08 1264.45 1187.448. Furniture & Fixture 712.20 18.91 38.49 692.62 335.63 38.11 34.94 338.80 353.82 376.579. Office Equipment 2053.65 119.22 56.87 2116.00 1331.95 139.53 39.35 1432.13 683.87 721.7010.Vehicles 246.84 153.07 45.27 354.64 96.87 32.92 20.61 109.18 245.46 149.9711.R&D-Plant & Machinery 439.56 0.00 0.00 439.56 79.53 24.02 0.00 103.55 336.01 360.0312.R&D-Office Equipments 88.34 0.00 0.00 88.34 69.54 13.21 0.00 82.75 5.59 18.80
Intangible Assets1. R&D-Computer Softwares 55.73 0.00 0.00 55.73 28.31 7.62 0.00 35.93 19.80 27.422. Computer Software 30.39 12.06 0.00 42.45 12.46 5.90 0.00 18.36 24.09 17.933. New Product Development Cost 1162.62 448.05 0.00 1610.67 333.75 226.11 0.00 559.86 1050.81 828.87
Total 45773.70 3944.31 463.93 49254.08 15794.32 2844.78 269.99 18369.11 30884.97 29979.3844238.67 1990.28 455.25 45773.70 13525.14 2658.03 388.85 15794.32 29979.38
Capital Work In Progress - Tangible Assets 1480.58 1144.76
Capital Work In Progress - Intangible Assets 923.67 817.69
2404.25 1962.45
NOTES :
1. Term Loans from Banks include:
a) Rupee Term Loans of Rs. 16414.35 Lacs (Previous Year Rs. 18254 Lacs) are secured by first pari passu charge over the entiremovable and immovable fixed assets of the Company, both present and future, except the assets exclusively charged to StandardChartered Bank for Rs. 388.89 Lacs (Previous Year Rs. 500 Lacs). Loans to the extent of Rs. 1995 Lacs (Previous Year Rs. 2100 Lacs)are further secured by way of second charge on current assets, on pari passu basis.
b) Corporate Loan of Rs. 3000 Lacs (Previous Year Rs. 2250 Lacs) from State Bank of India is secured by way of first pari passu chargeon current assets and second pari passu charge on movable and immovable fixed assets of the Company. The Loan is further securedby way of exclusive mortgage on Land situated at Plot No. 19, Dharuhera Industrial Area, Phase II, District Rewari (Haryana).
c) Term Loan of Rs. 63.30 Lacs (Previous Year Nil) from Allahabad Bank is secured by way of exclusive charge on the vehicles financedout of the said Term Loan.
2. Term Loans from Other include :
Term Loan of Rs. 874.95 Lacs (Previous Year Rs. 972 Lacs) is secured by way of second charge on entire assets of the Company situatedat Sanand, Gujrat to be purchased or constrcted out of said Term Loan.
3. The Short Term Loans from Banks are secured by hypothecation of inventories, book debts and other receivables both present & future& second pari passu charge on movable and immovable fixed assets of the Company.
Term Loans from Bank and other loans aggregating to Rs. 4402.63 Lacs (Previous Year Rs. 2250 Lacs) are repayable within one year.
* Leasehold Land Includes Rs. 221.50 Lacs (Previous Year Rs. 221.50 Lacs) in respect of which lease deed is pending for execution.
** Includes part of the factory building at Chennai given on operating lease whose cost, depreciation for the year and WDV at theend of the year is not segregated (Previous Year NIL).
(Rs./Lacs)
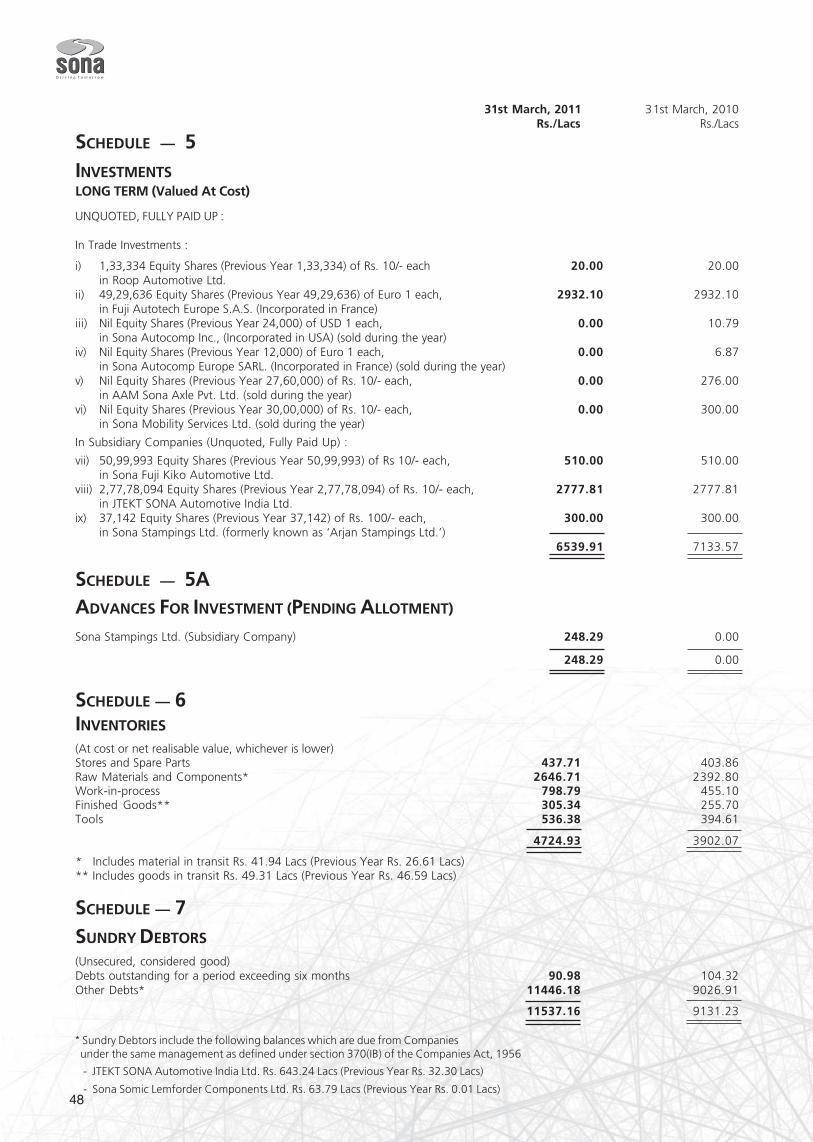
48
31st March, 2011 31st March, 2010 Rs./Lacs Rs./Lacs
SCHEDULE — 5INVESTMENTSLONG TERM (Valued At Cost)
UNQUOTED, FULLY PAID UP :
In Trade Investments :
i) 1,33,334 Equity Shares (Previous Year 1,33,334) of Rs. 10/- each 20.00 20.00in Roop Automotive Ltd.
ii) 49,29,636 Equity Shares (Previous Year 49,29,636) of Euro 1 each, 2932.10 2932.10in Fuji Autotech Europe S.A.S. (Incorporated in France)
iii) Nil Equity Shares (Previous Year 24,000) of USD 1 each, 0.00 10.79in Sona Autocomp Inc., (Incorporated in USA) (sold during the year)
iv) Nil Equity Shares (Previous Year 12,000) of Euro 1 each, 0.00 6.87in Sona Autocomp Europe SARL. (Incorporated in France) (sold during the year)
v) Nil Equity Shares (Previous Year 27,60,000) of Rs. 10/- each, 0.00 276.00in AAM Sona Axle Pvt. Ltd. (sold during the year)
vi) Nil Equity Shares (Previous Year 30,00,000) of Rs. 10/- each, 0.00 300.00in Sona Mobility Services Ltd. (sold during the year)
In Subsidiary Companies (Unquoted, Fully Paid Up) :
vii) 50,99,993 Equity Shares (Previous Year 50,99,993) of Rs 10/- each, 510.00 510.00in Sona Fuji Kiko Automotive Ltd.
viii) 2,77,78,094 Equity Shares (Previous Year 2,77,78,094) of Rs. 10/- each, 2777.81 2777.81in JTEKT SONA Automotive India Ltd.
ix) 37,142 Equity Shares (Previous Year 37,142) of Rs. 100/- each, 300.00 300.00in Sona Stampings Ltd. (formerly known as ‘Arjan Stampings Ltd.’)
6539.91 7133.57
SCHEDULE — 5AADVANCES FOR INVESTMENT (PENDING ALLOTMENT)
Sona Stampings Ltd. (Subsidiary Company) 248.29 0.00
248.29 0.00
SCHEDULE — 6INVENTORIES
(At cost or net realisable value, whichever is lower)Stores and Spare Parts 437.71 403.86Raw Materials and Components* 2646.71 2392.80Work-in-process 798.79 455.10Finished Goods** 305.34 255.70Tools 536.38 394.61
4724.93 3902.07
* Includes material in transit Rs. 41.94 Lacs (Previous Year Rs. 26.61 Lacs)** Includes goods in transit Rs. 49.31 Lacs (Previous Year Rs. 46.59 Lacs)
SCHEDULE — 7SUNDRY DEBTORS
(Unsecured, considered good)Debts outstanding for a period exceeding six months 90.98 104.32Other Debts* 11446.18 9026.91
11537.16 9131.23
* Sundry Debtors include the following balances which are due from Companies under the same management as defined under section 370(IB) of the Companies Act, 1956
- JTEKT SONA Automotive India Ltd. Rs. 643.24 Lacs (Previous Year Rs. 32.30 Lacs)
- Sona Somic Lemforder Components Ltd. Rs. 63.79 Lacs (Previous Year Rs. 0.01 Lacs)
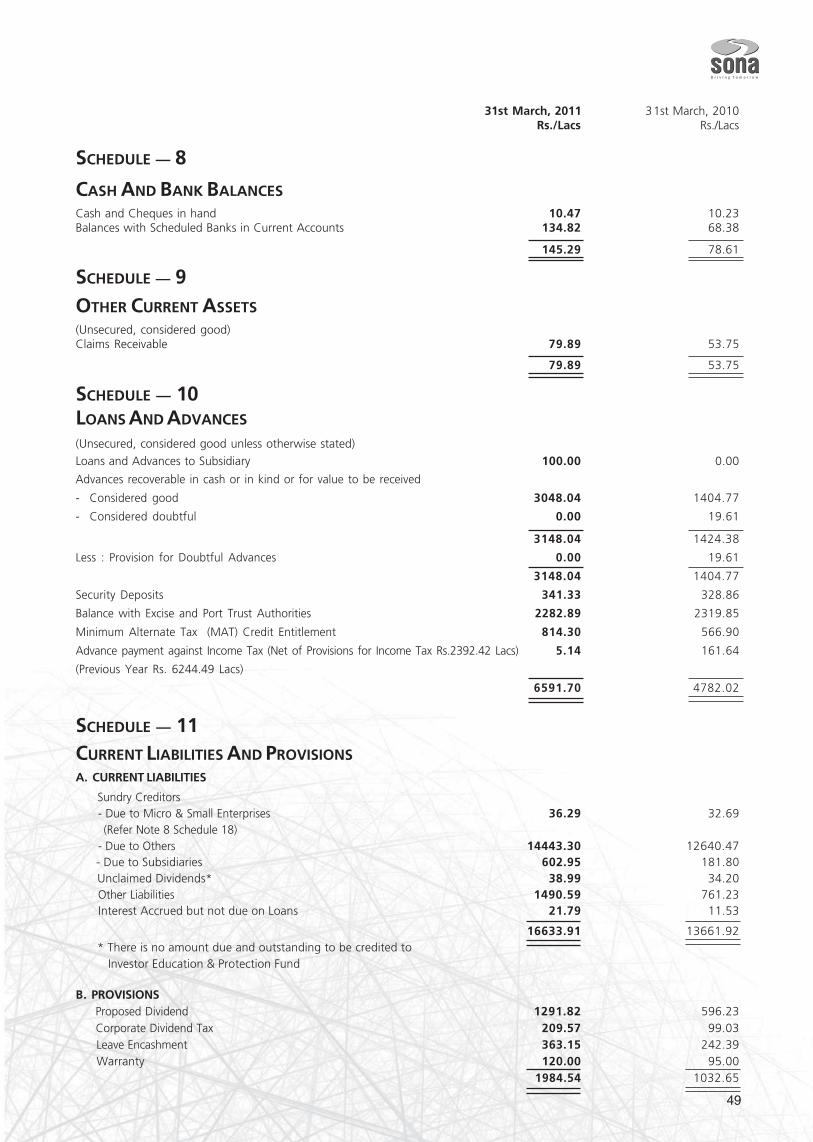
49
31st March, 2011 31st March, 2010 Rs./Lacs Rs./Lacs
SCHEDULE — 8
CASH AND BANK BALANCESCash and Cheques in hand 10.47 10.23Balances with Scheduled Banks in Current Accounts 134.82 68.38
145.29 78.61
SCHEDULE — 9OTHER CURRENT ASSETS(Unsecured, considered good)Claims Receivable 79.89 53.75
79.89 53.75
SCHEDULE — 10LOANS AND ADVANCES
(Unsecured, considered good unless otherwise stated)
Loans and Advances to Subsidiary 100.00 0.00
Advances recoverable in cash or in kind or for value to be received
- Considered good 3048.04 1404.77
- Considered doubtful 0.00 19.61
3148.04 1424.38
Less : Provision for Doubtful Advances 0.00 19.61
3148.04 1404.77
Security Deposits 341.33 328.86
Balance with Excise and Port Trust Authorities 2282.89 2319.85
Minimum Alternate Tax (MAT) Credit Entitlement 814.30 566.90
Advance payment against Income Tax (Net of Provisions for Income Tax Rs.2392.42 Lacs) 5.14 161.64
(Previous Year Rs. 6244.49 Lacs)
6591.70 4782.02
SCHEDULE — 11CURRENT LIABILITIES AND PROVISIONSA. CURRENT LIABILITIES
Sundry Creditors - Due to Micro & Small Enterprises 36.29 32.69 (Refer Note 8 Schedule 18) - Due to Others 14443.30 12640.47 - Due to Subsidiaries 602.95 181.80 Unclaimed Dividends* 38.99 34.20 Other Liabilities 1490.59 761.23 Interest Accrued but not due on Loans 21.79 11.53
16633.91 13661.92 * There is no amount due and outstanding to be credited to Investor Education & Protection Fund
B. PROVISIONS Proposed Dividend 1291.82 596.23 Corporate Dividend Tax 209.57 99.03 Leave Encashment 363.15 242.39 Warranty 120.00 95.00
1984.54 1032.65
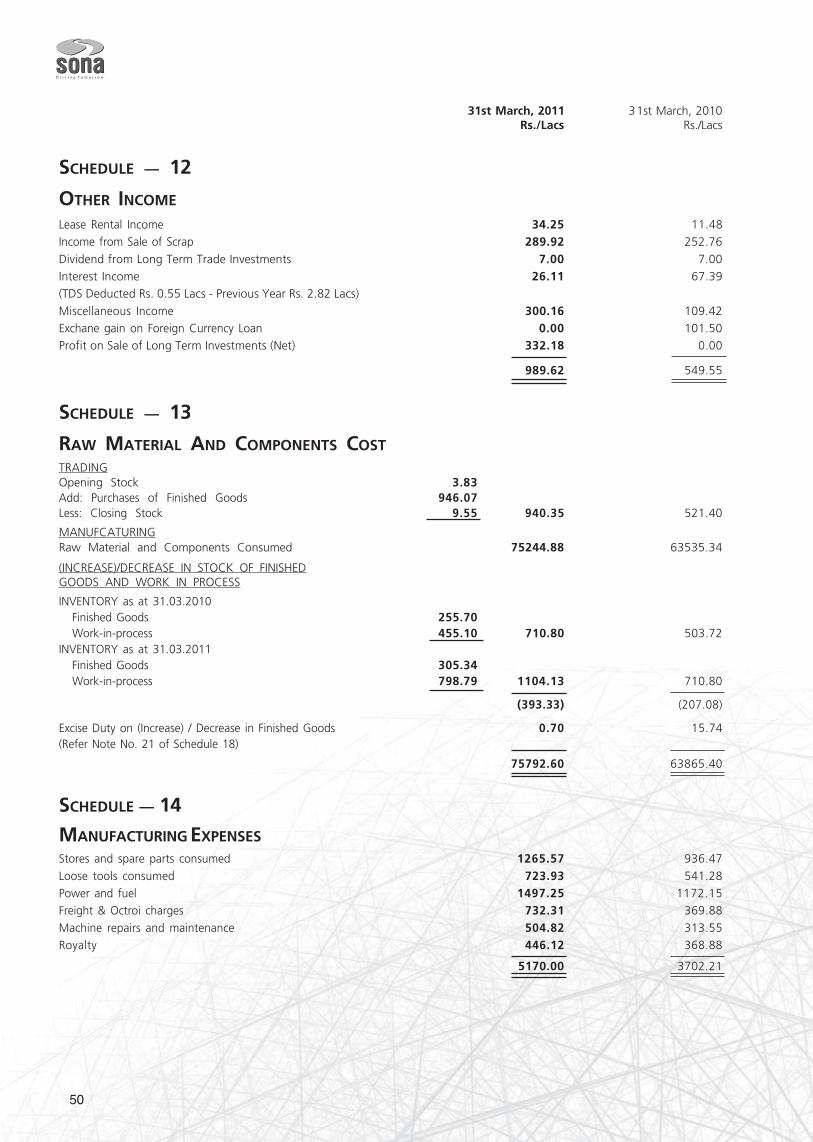
50
31st March, 2011 31st March, 2010 Rs./Lacs Rs./Lacs
SCHEDULE — 12
OTHER INCOME
Lease Rental Income 34.25 11.48Income from Sale of Scrap 289.92 252.76
Dividend from Long Term Trade Investments 7.00 7.00Interest Income 26.11 67.39(TDS Deducted Rs. 0.55 Lacs - Previous Year Rs. 2.82 Lacs)
Miscellaneous Income 300.16 109.42Exchane gain on Foreign Currency Loan 0.00 101.50Profit on Sale of Long Term Investments (Net) 332.18 0.00
989.62 549.55
SCHEDULE — 13
RAW MATERIAL AND COMPONENTS COSTTRADINGOpening Stock 3.83Add: Purchases of Finished Goods 946.07Less: Closing Stock 9.55 940.35 521.40
MANUFCATURINGRaw Material and Components Consumed 75244.88 63535.34
(INCREASE)/DECREASE IN STOCK OF FINISHEDGOODS AND WORK IN PROCESS
INVENTORY as at 31.03.2010 Finished Goods 255.70 Work-in-process 455.10 710.80 503.72INVENTORY as at 31.03.2011 Finished Goods 305.34 Work-in-process 798.79 1104.13 710.80
(393.33) (207.08)
Excise Duty on (Increase) / Decrease in Finished Goods 0.70 15.74(Refer Note No. 21 of Schedule 18)
75792.60 63865.40
SCHEDULE — 14
MANUFACTURING EXPENSESStores and spare parts consumed 1265.57 936.47
Loose tools consumed 723.93 541.28Power and fuel 1497.25 1172.15Freight & Octroi charges 732.31 369.88
Machine repairs and maintenance 504.82 313.55Royalty 446.12 368.88
5170.00 3702.21
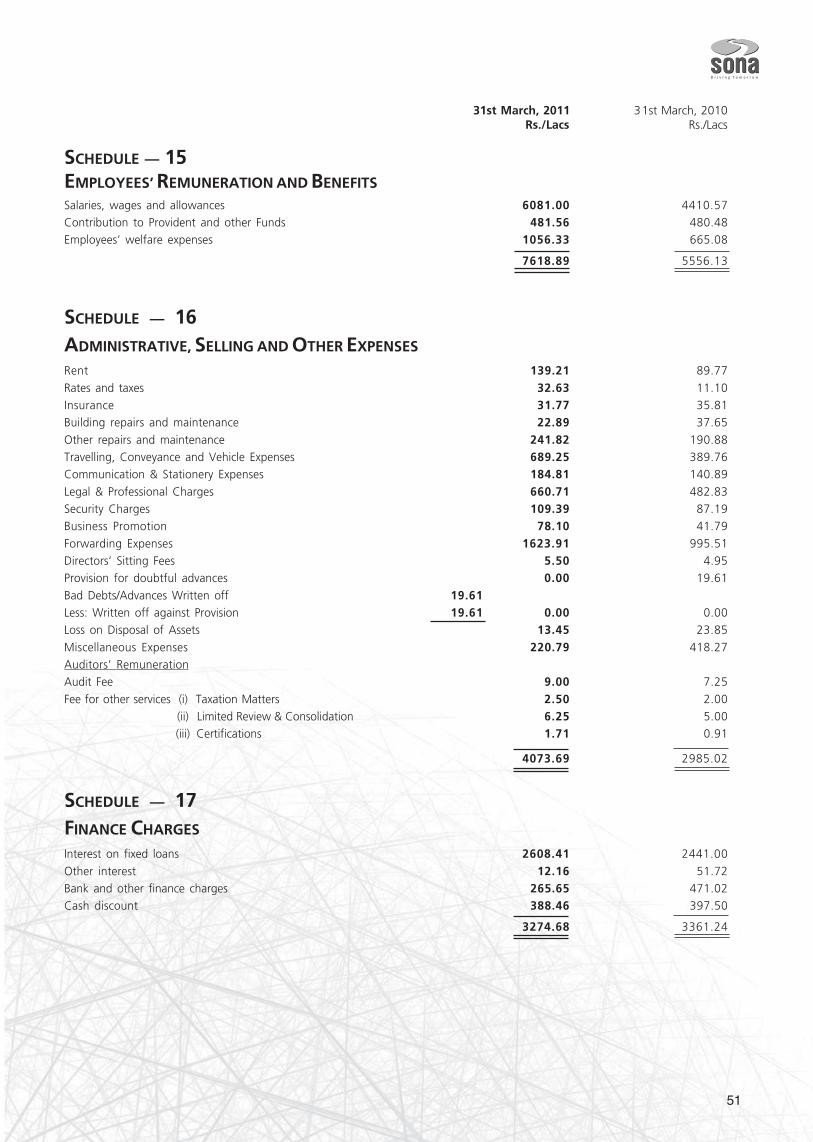
51
31st March, 2011 31st March, 2010 Rs./Lacs Rs./Lacs
SCHEDULE — 15EMPLOYEES’ REMUNERATION AND BENEFITSSalaries, wages and allowances 6081.00 4410.57Contribution to Provident and other Funds 481.56 480.48Employees’ welfare expenses 1056.33 665.08
7618.89 5556.13
SCHEDULE — 16ADMINISTRATIVE, SELLING AND OTHER EXPENSES
Rent 139.21 89.77
Rates and taxes 32.63 11.10Insurance 31.77 35.81Building repairs and maintenance 22.89 37.65
Other repairs and maintenance 241.82 190.88Travelling, Conveyance and Vehicle Expenses 689.25 389.76Communication & Stationery Expenses 184.81 140.89
Legal & Professional Charges 660.71 482.83Security Charges 109.39 87.19Business Promotion 78.10 41.79
Forwarding Expenses 1623.91 995.51Directors’ Sitting Fees 5.50 4.95Provision for doubtful advances 0.00 19.61
Bad Debts/Advances Written off 19.61Less: Written off against Provision 19.61 0.00 0.00Loss on Disposal of Assets 13.45 23.85
Miscellaneous Expenses 220.79 418.27Auditors’ RemunerationAudit Fee 9.00 7.25
Fee for other services (i) Taxation Matters 2.50 2.00 (ii) Limited Review & Consolidation 6.25 5.00
(iii) Certifications 1.71 0.91
4073.69 2985.02
SCHEDULE — 17FINANCE CHARGES
Interest on fixed loans 2608.41 2441.00
Other interest 12.16 51.72Bank and other finance charges 265.65 471.02Cash discount 388.46 397.50
3274.68 3361.24
52
SCHEDULE – 18
NOTES TO THE ACCOUNTS1. SIGNIFICANT ACCOUNTING POLICIES
I. Accounting Convention :
The financial statements have been prepared in accordance with applicable accounting standards in India notifiedunder Section 211 (3C) of the Companies Act, 1956. Financial statements have also been prepared in accordancewith relevant presentation requirements of the Companies Act, 1956 of India.
II. Basis of Accounting :
The financial statements are prepared under the historical cost convention on an accrual basis.
III. Use of Estimates :
The preparation of financial statements in conformity with generally accepted accounting principles (GAAP) requiresmanagement to make estimates and assumptions that affect the reported amounts of assets and liabilities and thedisclosure of contingent liabilities at the date of the financial statements and the reported amounts of revenuesand expenses during the year. Actual results could differ from those estimates. Any revision to accounting estimatesis recognised prospectively in current and future periods.
IV. Fixed Assets and Depreciation :
Fixed Assets are stated at cost of acquisition or construction less accumulated depreciation. Cost comprises of thepurchase price, incidental expenses, erection/commissioning expenses and financial charges upto the date thefixed asset is ready for its intended use.
The Company provides depreciation on fixed assets on the straight-line method at the rates specified in ScheduleXIV to the Companies Act, 1956 on a pro-rata basis from the month in which the asset is put to use, except asstated below.
- Leasehold improvements are depreciated at the rate of 20% per annum or over the period of lease if less thanfive years.
- Assets situated at employees’ residence are depreciated at the rate of 33.33% per annum.
- Vehicles are depreciated at the rate of 12% per annum from April, 2003.
An asset is treated as impaired when the carrying cost of assets exceeds its recoverable value. An impairment lossis charged to the Profit & Loss Account in the year in which an asset is identified as impaired. The impairment lossrecognised in prior accounting period is reversed if there has been a change in the estimate of recoverable amount.
V. Intangible Assets and Amortization thereof :
Intangible assets comprise new product development expenses and computer software and are stated at cost lessaccumulated amortization and impairment losses, if any.
Product development costs incurred including technical fees paid to collaborator for the development of newproducts for which letters of intent have been received from customers are accumulated and recognised asintangible assets (included under fixed assets) and are amortised over a period of six years. Un-amortized productsdevelopment fee in respect of models discontinued during the year is fully charged off in Profit & Loss Account.
Software, which is not an integral part of the related computer hardware is classified as an intangible asset and isbeing amortised over a period of 72 months, being the estimated useful life.
Amortization expenses is charged on a pro-rata basis for assets purchased during the year. The appropriateness ofthe amortization period and the amortization method is reviewed at each financial year end.
VI. Leases :
Operating Lease :
Lease arrangements, where the risks and rewards incidental to ownership of an asset substantially vest with thelessor, are recognised as operating lease.
Operating lease payments are recognised as an expense in the Profit & Loss Account on a straight line basis overthe lease term.
VII. Investments :
Long term investments are valued at their acquisition cost. Provision for diminution, other than temporary, is madewherever necessary.
53
VIII. Inventory Valuation :
a) Stores and spare parts are valued at lower of weighted average cost and net realisable value.
b) All tools (including loose tools) are written off over their useful life and un-issued tools are valued at lower ofweighted average cost and market value.
c) Raw materials, Components and Work-in-Process are valued at lower of weighted average cost and net realisablevalue.
d) Finished Goods are valued at lower of weighted average cost and net realisable value.
Finished Goods and Work in Process include costs of conversion and other costs incurred in bringing the inventoriesto their present location and condition.
IX. Foreign Currency Transactions :
Foreign currency transactions are recorded on the basis of average of the exchange rates in force during the relevantweek of each month. Gains and losses resulting from the settlement of such transactions and from the translationof monetary assets and liabilities denominated in foreign currencies are recognised in the Profit & Loss Account. Incase of transaction covered by forward contracts, the difference between the contract rate and exchange rateprevailing on the date of transaction is charged to Profit & Loss Account, proportionately over the contract period.All assets and liabilities denominated in foreign currency are restated at relevant year end rates.
X. Excise :
Excise duty on finished goods manufactured is accounted on the basis of production of goods.
XI . Research & Development :
a) Capital Expenditure for Research & Development is capitalised in the year of installation.
b) Revenue expenses incurred for Research & Development for existing products are charged to Profit & LossAccount of the year.
XII. Income :
1) Revenue recognition - Revenue from domestic and export sales are recognised on transfer of all significant risksand rewards or ownership to the buyer, which generally coincides with dispatch of goods from factory / portrespectively.
2) Price escalation claims from customers and discounts from suppliers are accounted in the year under audit, onlyif they are settled with the customers and suppliers respectively up to the date of finalisation of accounts.
3) Dividend on investment is accounted in the year in which it is declared.
4) All export benefits are recognised as income when there is substantial certainty as to their realisability e.g.
a) DEPB license and FPS are recognized as income on the relevant application being filed.
b) Duty draw back is accounted in the year of export.
XIII. Expenses :
a) Discounts to customers and price escalation to suppliers to the extent not settled at the Balance Sheet date areaccounted on the basis of reasonable estimates made after considering negotiations with vendors/customers.
b) Jigs and fixtures costing less than Rs. 5,000/- each are written off in the year of purchase.
c) Goods received are accounted as purchases on satisfactory completion of inspection.
XIV. Borrowing Cost :
Borrowing costs on loans relatable to qualifying assets are capitalized to the extent incurred prior to these assetsbeing put to use. Other borrowing costs are written off in the year to which they pertain.
XV. Employees’ Benefits :
Provident Fund
Contributions to defined contribution schemes such as Provident Fund, etc. are charged to the Profit & Loss accountas incurred. In respect of certain employees, Provident Fund contributions are made to a Trust administered by theCompany. The interest rate payable to the members of the Trust shall not be lower than the statutory rate of interestdeclared by the Central Government under the Employees Provident Funds and Miscellaneous Provisions Act, 1952and shortfall, if any, shall be made good by the Company. The remaining contributions are made to a governmentadministered Provident Fund towards which the Company has no further obligations beyond its monthly contributions.
54
Gratuity
The Company has an obligation towards gratuity, a defined benefit retirement plan covering eligible employees.The Company has an Employee Gratuity Fund managed by LIC. The Company accounts for the liability of GratuityBenefits payable in future based on an independent actuarial valuation.
Leave Encashment
The Company provides for the encashment of leave with pay subject to certain rules for certain grade of employees.The eligible employees are entitled to accumulate leave subject to certain limits, for future encashment/availment.The liability is provided based on the number of days of unutilized leave at each balance sheet date on the basis ofan independent actuarial valuation.
Termination Benefits
Termination benefits are recognised as an expense as and when incurred or only when the obligation can bereliably estimated.
XVI. Taxation :
Taxes on income for the current year are determined on the basis of provisions of Income Tax Act, 1961.
Deferred Tax is recognised on timing differences between the accounting income and the taxable income for theyear and quantified using the tax rates and laws enacted or substantively enacted as on the Balance Sheet date.
Deferred Tax assets are recognised and carried forward to the extent that there is a virtual certainity that sufficientfuture taxable income will be available against which such deferred tax asset can be realised.
XVII. Contingencies :
Loss contingencies arising from claims, litigations, assessments, fines, penalties, etc., are recorded when it isprobable that a liability will be incurred, and the amount can be reasonably estimated.
Warranty cost is provided on the basis of cost of warranty claims received from the customers and a reasonableestimate for future claims is made based on empirical data.
XVIII. Earning Per Share :
Annualised basic earning per equity share is arrived at based on net profit/(loss) after taxation to the basic/weighted average number of equity shares.
Current Year Previous YearRs./Lacs Rs./Lacs
2. Capital Commitment :
Estimated amount of contracts remaining to be executed on 2274.57 1548.49capital account not provided for (Net of Advances)
3. Contingent Liabilities :
I. Claims against the Company not acknowledgedas debt on account of
a) Excise Duty 1322.54 847.36
b) Service Tax 341.88 299.22
c) Local Area Development Tax (LADT) 209.16 -
d) Income Tax - Matters in Appeal 56.81 83.96
e) Warranties/Customers 67.25 22.11
II. Customer Bills Discounted 910.00 -III. Letter of Credit opened by banks for purchase of inventory/capital goods 867.00 1324.51
4. Raw Material and Components consumed are net of Rs. 3036.74 Lacs (Previous Year Rs. 2522.39 Lacs) being the value ofdispatches made to vendors for job work.
5. Miscellaneous Income in Schedule 12 includes :
a) Nil (Previous Year Rs. 29.54 Lacs) being provision for slow moving inventory written back.
b) Rs. 171.99 Lacs being Service Income from Business Support fees.
6. The Company has an R&D Centre (Approved by the Department of Scientific and Industrial Research, Ministry of Science &Technology, Govt. of India) on which revenue expenditure incurred in addition to capital expenditure is Nil (Previous Year Rs.7.07 Lacs) is as under:
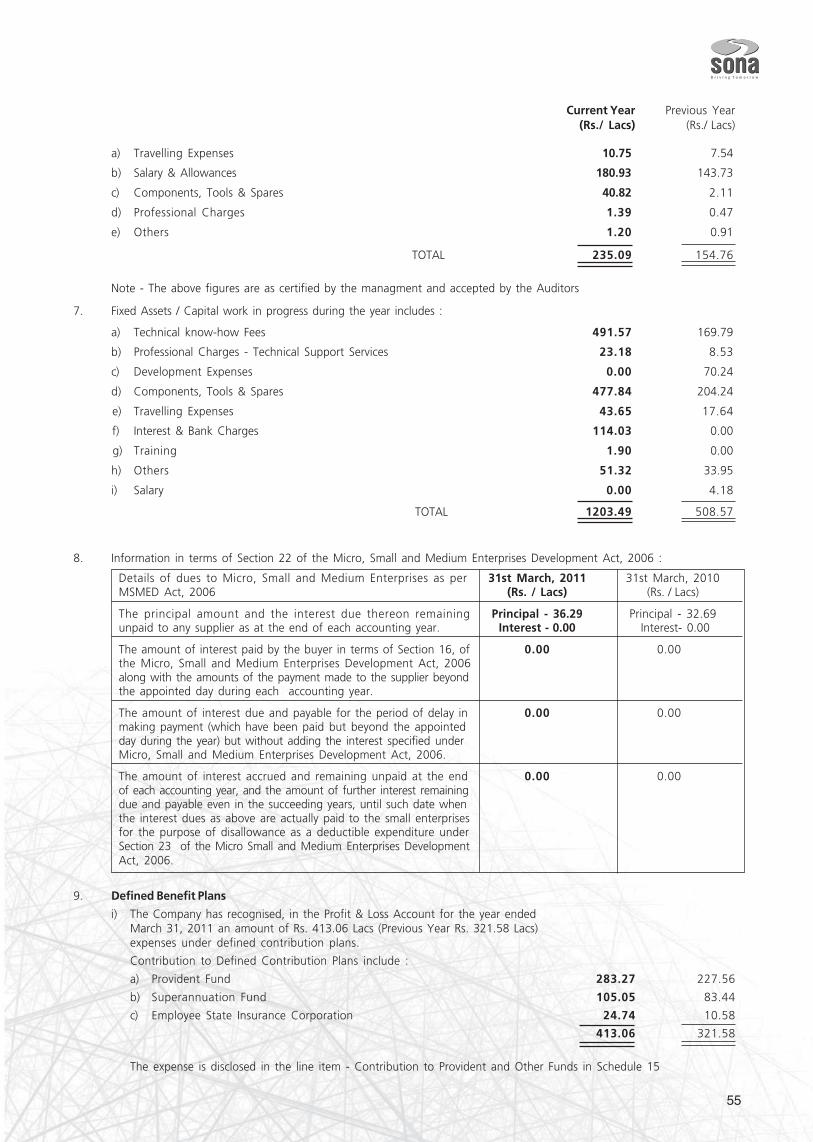
55
Current Year Previous Year(Rs./ Lacs) (Rs./ Lacs)
a) Travelling Expenses 10.75 7.54
b) Salary & Allowances 180.93 143.73
c) Components, Tools & Spares 40.82 2.11
d) Professional Charges 1.39 0.47
e) Others 1.20 0.91
TOTAL 235.09 154.76
Note - The above figures are as certified by the managment and accepted by the Auditors
7. Fixed Assets / Capital work in progress during the year includes :
a) Technical know-how Fees 491.57 169.79
b) Professional Charges - Technical Support Services 23.18 8.53
c) Development Expenses 0.00 70.24
d) Components, Tools & Spares 477.84 204.24
e) Travelling Expenses 43.65 17.64
f) Interest & Bank Charges 114.03 0.00
g) Training 1.90 0.00
h) Others 51.32 33.95
i) Salary 0.00 4.18
TOTAL 1203.49 508.57
8. Information in terms of Section 22 of the Micro, Small and Medium Enterprises Development Act, 2006 :
Details of dues to Micro, Small and Medium Enterprises as per 31st March, 2011 31st March, 2010MSMED Act, 2006 (Rs. / Lacs) (Rs. / Lacs)
The principal amount and the interest due thereon remaining Principal - 36.29 Principal - 32.69unpaid to any supplier as at the end of each accounting year. Interest - 0.00 Interest- 0.00
The amount of interest paid by the buyer in terms of Section 16, of 0.00 0.00the Micro, Small and Medium Enterprises Development Act, 2006along with the amounts of the payment made to the supplier beyondthe appointed day during each accounting year.
The amount of interest due and payable for the period of delay in 0.00 0.00making payment (which have been paid but beyond the appointedday during the year) but without adding the interest specified underMicro, Small and Medium Enterprises Development Act, 2006.
The amount of interest accrued and remaining unpaid at the end 0.00 0.00of each accounting year, and the amount of further interest remainingdue and payable even in the succeeding years, until such date whenthe interest dues as above are actually paid to the small enterprisesfor the purpose of disallowance as a deductible expenditure underSection 23 of the Micro Small and Medium Enterprises DevelopmentAct, 2006.
9. Defined Benefit Plans
i) The Company has recognised, in the Profit & Loss Account for the year endedMarch 31, 2011 an amount of Rs. 413.06 Lacs (Previous Year Rs. 321.58 Lacs)expenses under defined contribution plans.
Contribution to Defined Contribution Plans include :
a) Provident Fund 283.27 227.56
b) Superannuation Fund 105.05 83.44
c) Employee State Insurance Corporation 24.74 10.58
413.06 321.58
The expense is disclosed in the line item - Contribution to Provident and Other Funds in Schedule 15
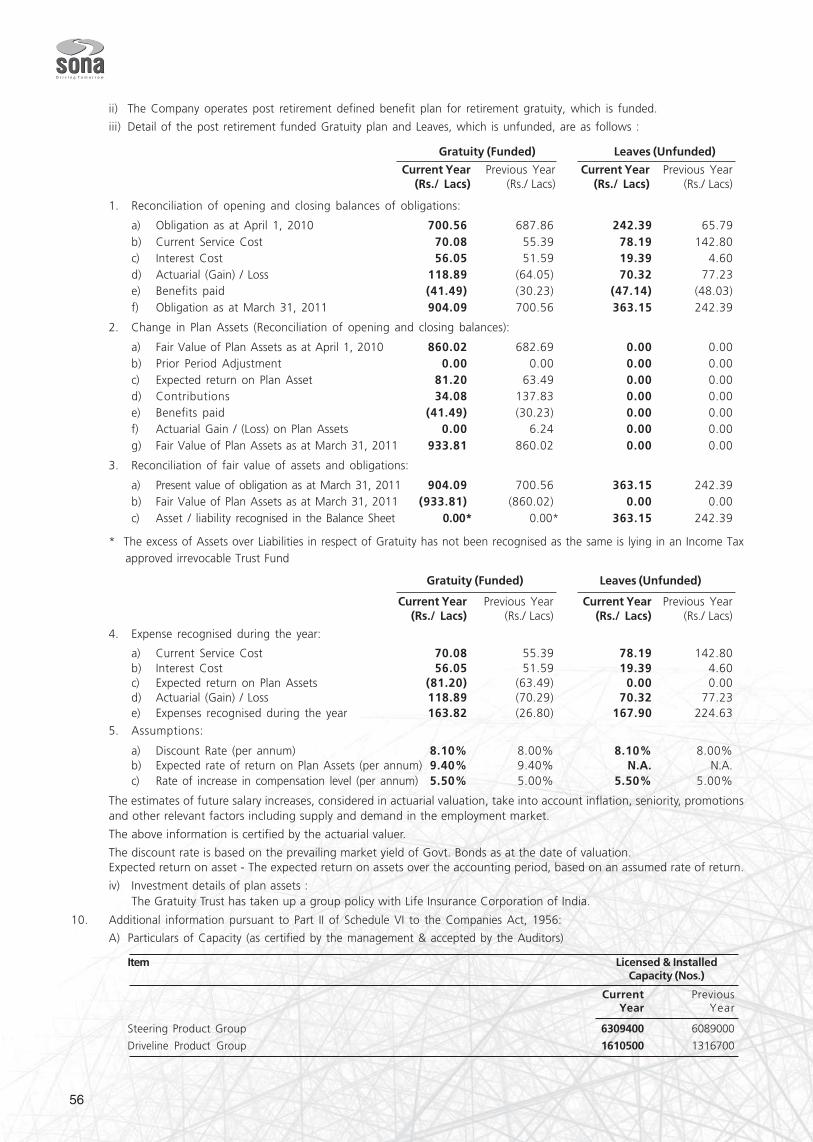
56
ii) The Company operates post retirement defined benefit plan for retirement gratuity, which is funded.
iii) Detail of the post retirement funded Gratuity plan and Leaves, which is unfunded, are as follows :
Gratuity (Funded) Leaves (Unfunded)
Current Year Previous Year Current Year Previous Year(Rs./ Lacs) (Rs./ Lacs) (Rs./ Lacs) (Rs./ Lacs)
1. Reconciliation of opening and closing balances of obligations:
a) Obligation as at April 1, 2010 700.56 687.86 242.39 65.79b) Current Service Cost 70.08 55.39 78.19 142.80c) Interest Cost 56.05 51.59 19.39 4.60d) Actuarial (Gain) / Loss 118.89 (64.05) 70.32 77.23e) Benefits paid (41.49) (30.23) (47.14) (48.03)f) Obligation as at March 31, 2011 904.09 700.56 363.15 242.39
2. Change in Plan Assets (Reconciliation of opening and closing balances):
a) Fair Value of Plan Assets as at April 1, 2010 860.02 682.69 0.00 0.00b) Prior Period Adjustment 0.00 0.00 0.00 0.00c) Expected return on Plan Asset 81.20 63.49 0.00 0.00d) Contributions 34.08 137.83 0.00 0.00e) Benefits paid (41.49) (30.23) 0.00 0.00f) Actuarial Gain / (Loss) on Plan Assets 0.00 6.24 0.00 0.00g) Fair Value of Plan Assets as at March 31, 2011 933.81 860.02 0.00 0.00
3. Reconciliation of fair value of assets and obligations:
a) Present value of obligation as at March 31, 2011 904.09 700.56 363.15 242.39b) Fair Value of Plan Assets as at March 31, 2011 (933.81) (860.02) 0.00 0.00c) Asset / liability recognised in the Balance Sheet 0.00* 0.00* 363.15 242.39
* The excess of Assets over Liabilities in respect of Gratuity has not been recognised as the same is lying in an Income Tax approved irrevocable Trust Fund
Gratuity (Funded) Leaves (Unfunded)
Current Year Previous Year Current Year Previous Year(Rs./ Lacs) (Rs./ Lacs) (Rs./ Lacs) (Rs./ Lacs)
4. Expense recognised during the year:
a) Current Service Cost 70.08 55.39 78.19 142.80b) Interest Cost 56.05 51.59 19.39 4.60c) Expected return on Plan Assets (81.20) (63.49) 0.00 0.00d) Actuarial (Gain) / Loss 118.89 (70.29) 70.32 77.23e) Expenses recognised during the year 163.82 (26.80) 167.90 224.63
5. Assumptions:
a) Discount Rate (per annum) 8.10% 8.00% 8.10% 8.00%b) Expected rate of return on Plan Assets (per annum) 9.40% 9.40% N.A. N.A.c) Rate of increase in compensation level (per annum) 5.50% 5.00% 5.50% 5.00%
The estimates of future salary increases, considered in actuarial valuation, take into account inflation, seniority, promotionsand other relevant factors including supply and demand in the employment market.
The above information is certified by the actuarial valuer.
The discount rate is based on the prevailing market yield of Govt. Bonds as at the date of valuation.Expected return on asset - The expected return on assets over the accounting period, based on an assumed rate of return.
iv) Investment details of plan assets :The Gratuity Trust has taken up a group policy with Life Insurance Corporation of India.
10. Additional information pursuant to Part II of Schedule VI to the Companies Act, 1956:
A) Particulars of Capacity (as certified by the management & accepted by the Auditors)
Item Licensed & InstalledCapacity (Nos.)
Current PreviousYear Year
Steering Product Group 6309400 6089000
Driveline Product Group 1610500 1316700
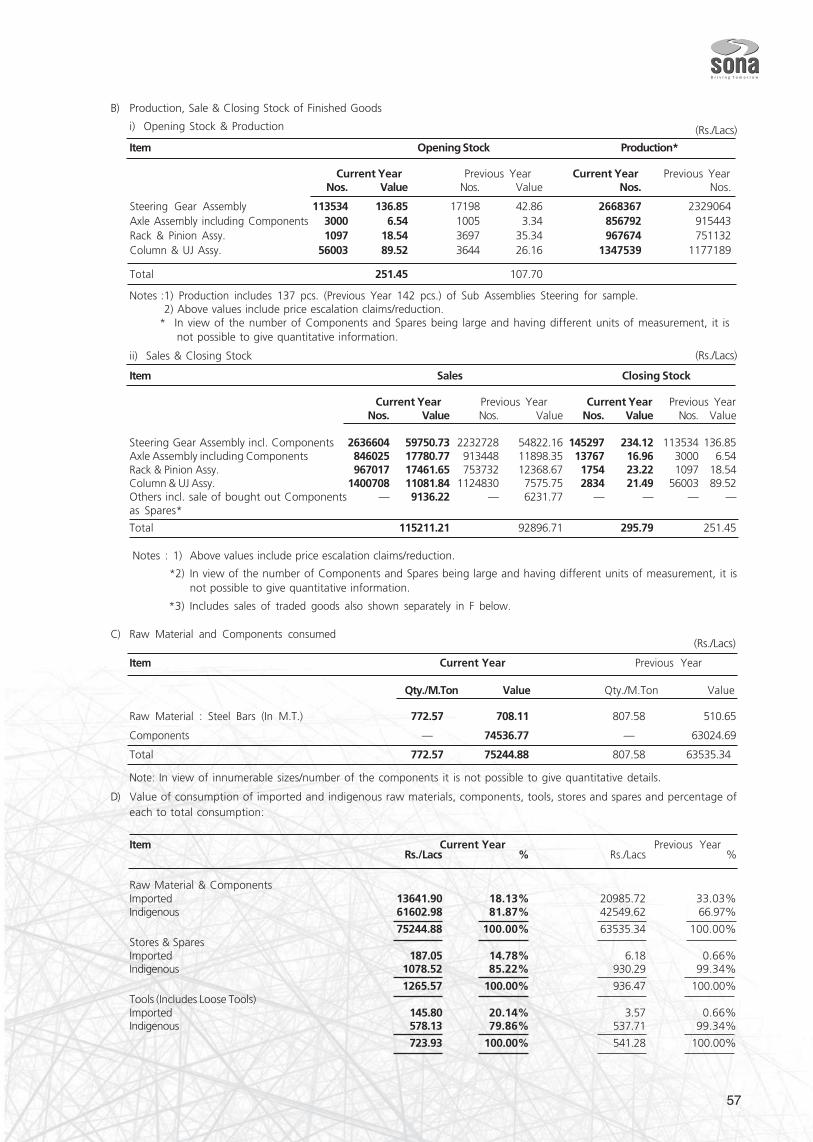
57
B) Production, Sale & Closing Stock of Finished Goods
i) Opening Stock & Production
Item Opening Stock Production*
Current Year Previous Year Current Year Previous YearNos. Value Nos. Value Nos. Nos.
Steering Gear Assembly 113534 136.85 17198 42.86 2668367 2329064Axle Assembly including Components 3000 6.54 1005 3.34 856792 915443Rack & Pinion Assy. 1097 18.54 3697 35.34 967674 751132Column & UJ Assy. 56003 89.52 3644 26.16 1347539 1177189
Total 251.45 107.70
Notes :1) Production includes 137 pcs. (Previous Year 142 pcs.) of Sub Assemblies Steering for sample. 2) Above values include price escalation claims/reduction. * In view of the number of Components and Spares being large and having different units of measurement, it is
not possible to give quantitative information.
ii) Sales & Closing Stock
Item Sales Closing Stock
Current Year Previous Year Current Year Previous YearNos. Value Nos. Value Nos. Value Nos. Value
Steering Gear Assembly incl. Components 2636604 59750.73 2232728 54822.16 145297 234.12 113534 136.85Axle Assembly including Components 846025 17780.77 913448 11898.35 13767 16.96 3000 6.54Rack & Pinion Assy. 967017 17461.65 753732 12368.67 1754 23.22 1097 18.54Column & UJ Assy. 1400708 11081.84 1124830 7575.75 2834 21.49 56003 89.52Others incl. sale of bought out Components — 9136.22 — 6231.77 — — — —as Spares*
Total 115211.21 92896.71 295.79 251.45
Notes : 1) Above values include price escalation claims/reduction.
*2) In view of the number of Components and Spares being large and having different units of measurement, it isnot possible to give quantitative information.
*3) Includes sales of traded goods also shown separately in F below.
C) Raw Material and Components consumed
Item Current Year Previous Year
Qty./M.Ton Value Qty./M.Ton Value
Raw Material : Steel Bars (In M.T.) 772.57 708.11 807.58 510.65
Components — 74536.77 — 63024.69
Total 772.57 75244.88 807.58 63535.340
Note: In view of innumerable sizes/number of the components it is not possible to give quantitative details.
D) Value of consumption of imported and indigenous raw materials, components, tools, stores and spares and percentage ofeach to total consumption:
Item Current Year Previous YearRs./Lacs % Rs./Lacs %
Raw Material & ComponentsImported 13641.90 18.13% 20985.72 33.03%Indigenous 61602.98 81.87% 42549.62 66.97%
75244.88 100.00% 63535.34 100.00%Stores & SparesImported 187.05 14.78% 6.18 0.66%Indigenous 1078.52 85.22% 930.29 99.34%
1265.57 100.00% 936.47 100.00%Tools (Includes Loose Tools)Imported 145.80 20.14% 3.57 0.66%Indigenous 578.13 79.86% 537.71 99.34%
723.93 100.00% 541.28 100.00%
(Rs./Lacs)
(Rs./Lacs)
(Rs./Lacs)
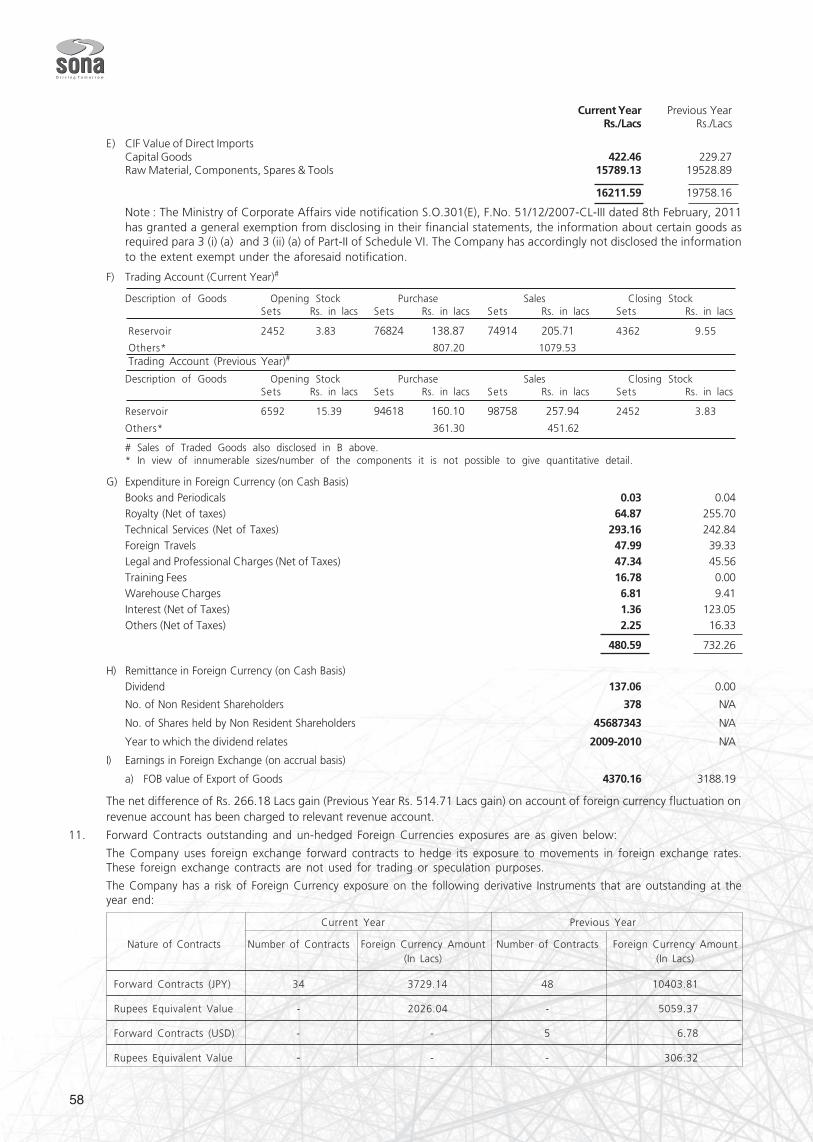
58
Current Year Previous YearRs./Lacs Rs./Lacs
E) CIF Value of Direct ImportsCapital Goods 422.46 229.27Raw Material, Components, Spares & Tools 15789.13 19528.89
16211.59 19758.16
Note : The Ministry of Corporate Affairs vide notification S.O.301(E), F.No. 51/12/2007-CL-III dated 8th February, 2011has granted a general exemption from disclosing in their financial statements, the information about certain goods asrequired para 3 (i) (a) and 3 (ii) (a) of Part-II of Schedule VI. The Company has accordingly not disclosed the informationto the extent exempt under the aforesaid notification.
F) Trading Account (Current Year)#
Description of Goods Opening Stock Purchase Sales Closing StockSets Rs. in lacs Sets Rs. in lacs Sets Rs. in lacs Sets Rs. in lacs
Reservoir 2452 3.83 76824 138.87 74914 205.71 4362 9.55
Others* 807.20 1079.53Trading Account (Previous Year)#
Description of Goods Opening Stock Purchase Sales Closing StockSets Rs. in lacs Sets Rs. in lacs Sets Rs. in lacs Sets Rs. in lacs
Reservoir 6592 15.39 94618 160.10 98758 257.94 2452 3.83
Others* 361.30 451.62
# Sales of Traded Goods also disclosed in B above.* In view of innumerable sizes/number of the components it is not possible to give quantitative detail.
G) Expenditure in Foreign Currency (on Cash Basis)Books and Periodicals 0.03 0.04Royalty (Net of taxes) 64.87 255.70Technical Services (Net of Taxes) 293.16 242.84Foreign Travels 47.99 39.33Legal and Professional Charges (Net of Taxes) 47.34 45.56Training Fees 16.78 0.00Warehouse Charges 6.81 9.41Interest (Net of Taxes) 1.36 123.05Others (Net of Taxes) 2.25 16.33
480.59 732.26
H) Remittance in Foreign Currency (on Cash Basis)Dividend 137.06 0.00
No. of Non Resident Shareholders 378 N/A
No. of Shares held by Non Resident Shareholders 45687343 N/A
Year to which the dividend relates 2009-2010 N/A
I) Earnings in Foreign Exchange (on accrual basis)
a) FOB value of Export of Goods 4370.16 3188.19
The net difference of Rs. 266.18 Lacs gain (Previous Year Rs. 514.71 Lacs gain) on account of foreign currency fluctuation onrevenue account has been charged to relevant revenue account.
11. Forward Contracts outstanding and un-hedged Foreign Currencies exposures are as given below:
The Company uses foreign exchange forward contracts to hedge its exposure to movements in foreign exchange rates.These foreign exchange contracts are not used for trading or speculation purposes.
The Company has a risk of Foreign Currency exposure on the following derivative Instruments that are outstanding at theyear end:
Current Year Previous Year
Nature of Contracts Number of Contracts Foreign Currency Amount Number of Contracts Foreign Currency Amount(In Lacs) (In Lacs)
Forward Contracts (JPY) 34 3729.14 48 10403.81
Rupees Equivalent Value - 2026.04 - 5059.37
Forward Contracts (USD) - - 5 6.78
Rupees Equivalent Value - - - 306.32
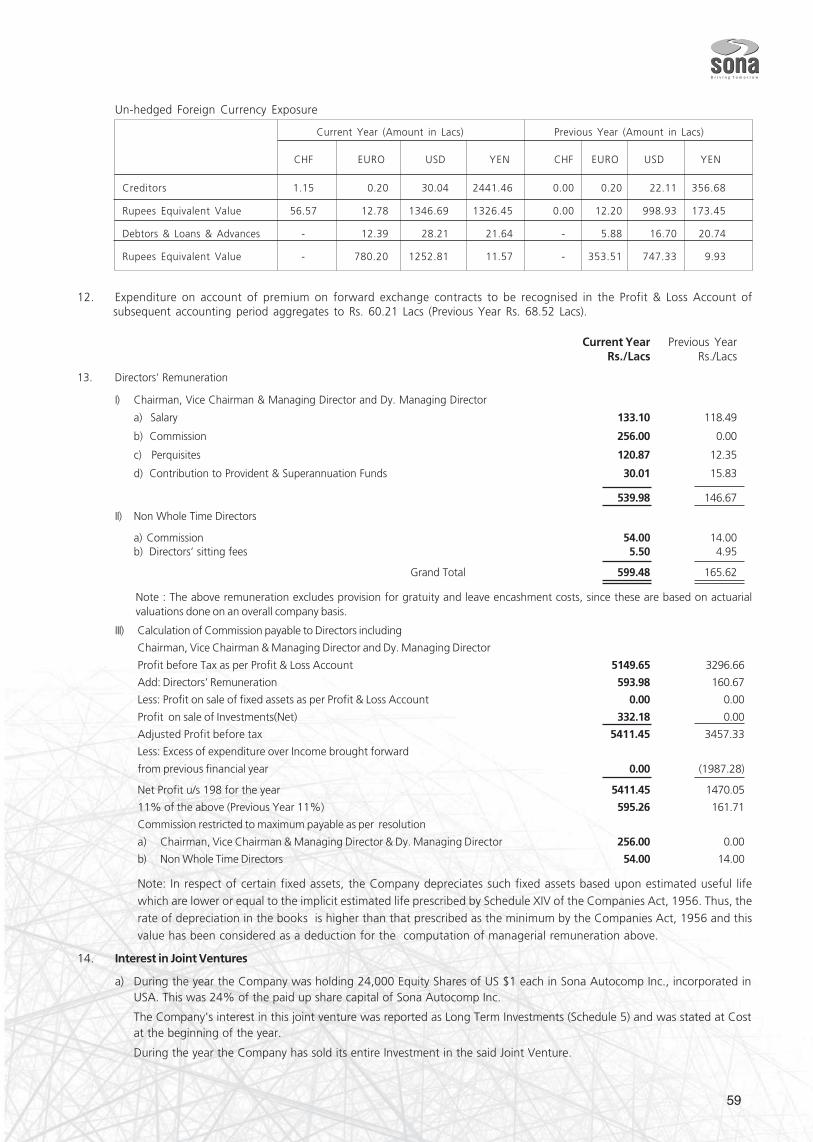
59
Un-hedged Foreign Currency Exposure
Current Year (Amount in Lacs) Previous Year (Amount in Lacs)
CHF EURO USD YEN CHF EURO USD YEN
Creditors 1.15 0.20 30.04 2441.46 0.00 0.20 22.11 356.68
Rupees Equivalent Value 56.57 12.78 1346.69 1326.45 0.00 12.20 998.93 173.45
Debtors & Loans & Advances - 12.39 28.21 21.64 - 5.88 16.70 20.74
Rupees Equivalent Value - 780.20 1252.81 11.57 - 353.51 747.33 9.93
12. Expenditure on account of premium on forward exchange contracts to be recognised in the Profit & Loss Account ofsubsequent accounting period aggregates to Rs. 60.21 Lacs (Previous Year Rs. 68.52 Lacs).
Current Year Previous YearRs./Lacs Rs./Lacs
13. Directors’ Remuneration
I) Chairman, Vice Chairman & Managing Director and Dy. Managing Director
a) Salary 133.10 118.49
b) Commission 256.00 0.00
c) Perquisites 120.87 12.35
d) Contribution to Provident & Superannuation Funds 30.01 15.83
539.98 146.67
II) Non Whole Time Directors
a) Commission 54.00 14.00b) Directors’ sitting fees 5.50 4.95
Grand Total 599.48 165.62
Note : The above remuneration excludes provision for gratuity and leave encashment costs, since these are based on actuarialvaluations done on an overall company basis.
III) Calculation of Commission payable to Directors including
Chairman, Vice Chairman & Managing Director and Dy. Managing Director
Profit before Tax as per Profit & Loss Account 5149.65 3296.66
Add: Directors’ Remuneration 593.98 160.67
Less: Profit on sale of fixed assets as per Profit & Loss Account 0.00 0.00
Profit on sale of Investments(Net) 332.18 0.00
Adjusted Profit before tax 5411.45 3457.33
Less: Excess of expenditure over Income brought forward
from previous financial year 0.00 (1987.28)
Net Profit u/s 198 for the year 5411.45 1470.05
11% of the above (Previous Year 11%) 595.26 161.71
Commission restricted to maximum payable as per resolution
a) Chairman, Vice Chairman & Managing Director & Dy. Managing Director 256.00 0.00
b) Non Whole Time Directors 54.00 14.00
Note: In respect of certain fixed assets, the Company depreciates such fixed assets based upon estimated useful lifewhich are lower or equal to the implicit estimated life prescribed by Schedule XIV of the Companies Act, 1956. Thus, therate of depreciation in the books is higher than that prescribed as the minimum by the Companies Act, 1956 and this
value has been considered as a deduction for the computation of managerial remuneration above.
14. Interest in Joint Ventures
a) During the year the Company was holding 24,000 Equity Shares of US $1 each in Sona Autocomp Inc., incorporated inUSA. This was 24% of the paid up share capital of Sona Autocomp Inc.
The Company's interest in this joint venture was reported as Long Term Investments (Schedule 5) and was stated at Costat the beginning of the year.
During the year the Company has sold its entire Investment in the said Joint Venture.
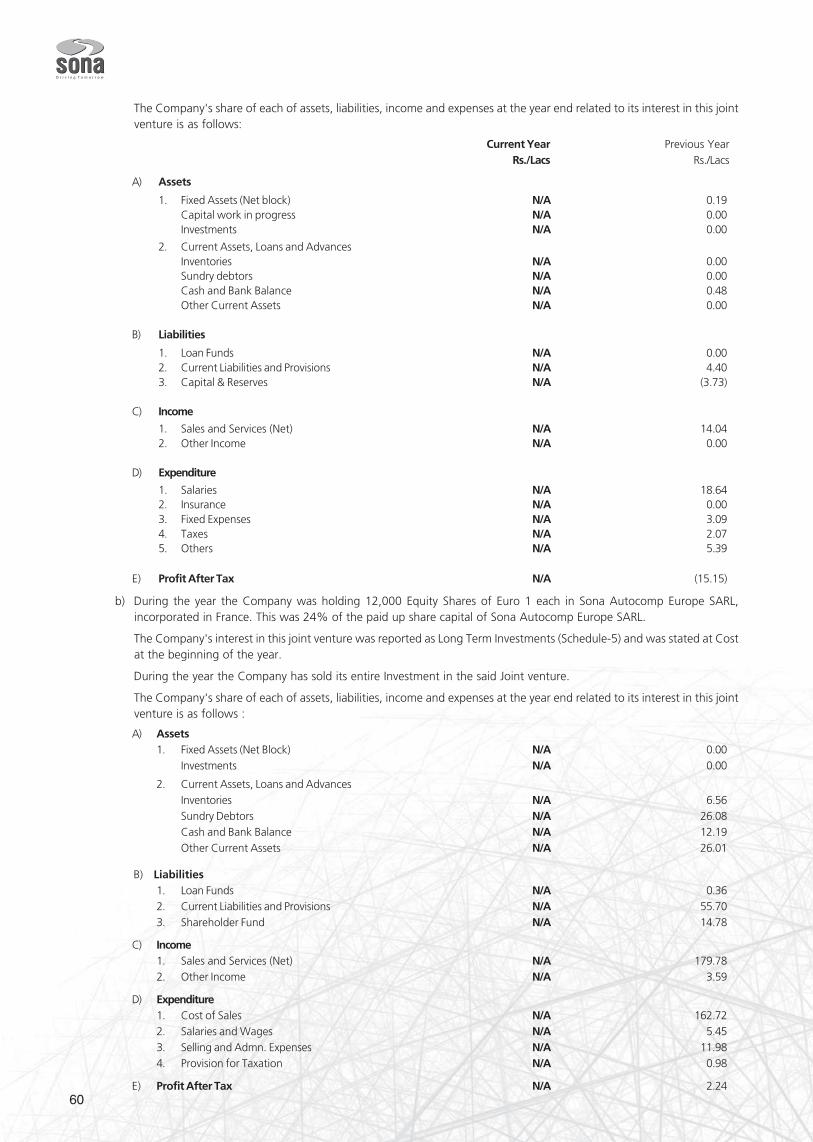
60
The Company's share of each of assets, liabilities, income and expenses at the year end related to its interest in this jointventure is as follows:
Current Year Previous YearRs./Lacs Rs./Lacs
A) Assets
1. Fixed Assets (Net block) N/A 0.19Capital work in progress N/A 0.00Investments N/A 0.00
2. Current Assets, Loans and AdvancesInventories N/A 0.00Sundry debtors N/A 0.00Cash and Bank Balance N/A 0.48Other Current Assets N/A 0.00
B) Liabilities
1. Loan Funds N/A 0.002. Current Liabilities and Provisions N/A 4.403. Capital & Reserves N/A (3.73)
C) Income
1. Sales and Services (Net) N/A 14.042. Other Income N/A 0.00
D) Expenditure
1. Salaries N/A 18.642. Insurance N/A 0.003. Fixed Expenses N/A 3.094. Taxes N/A 2.075. Others N/A 5.39
E) Profit After Tax N/A (15.15)
b) During the year the Company was holding 12,000 Equity Shares of Euro 1 each in Sona Autocomp Europe SARL,incorporated in France. This was 24% of the paid up share capital of Sona Autocomp Europe SARL.
The Company's interest in this joint venture was reported as Long Term Investments (Schedule-5) and was stated at Costat the beginning of the year.
During the year the Company has sold its entire Investment in the said Joint venture.
The Company's share of each of assets, liabilities, income and expenses at the year end related to its interest in this jointventure is as follows :
A) Assets1. Fixed Assets (Net Block) N/A 0.00
Investments N/A 0.00
2. Current Assets, Loans and AdvancesInventories N/A 6.56Sundry Debtors N/A 26.08Cash and Bank Balance N/A 12.19Other Current Assets N/A 26.01
B) Liabilities1. Loan Funds N/A 0.362. Current Liabilities and Provisions N/A 55.703. Shareholder Fund N/A 14.78
C) Income1. Sales and Services (Net) N/A 179.782. Other Income N/A 3.59
D) Expenditure1. Cost of Sales N/A 162.722. Salaries and Wages N/A 5.453. Selling and Admn. Expenses N/A 11.984. Provision for Taxation N/A 0.98
E) Profit After Tax N/A 2.24
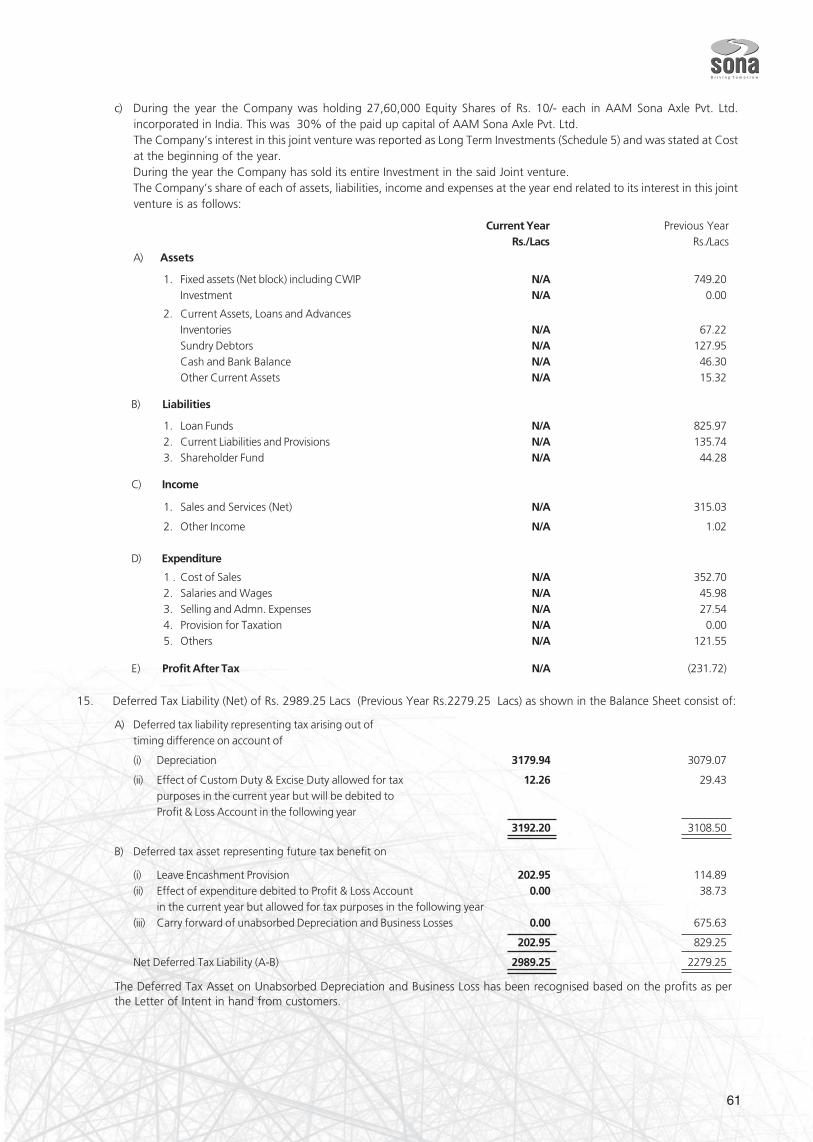
61
c) During the year the Company was holding 27,60,000 Equity Shares of Rs. 10/- each in AAM Sona Axle Pvt. Ltd.incorporated in India. This was 30% of the paid up capital of AAM Sona Axle Pvt. Ltd.The Company’s interest in this joint venture was reported as Long Term Investments (Schedule 5) and was stated at Costat the beginning of the year.During the year the Company has sold its entire Investment in the said Joint venture.The Company’s share of each of assets, liabilities, income and expenses at the year end related to its interest in this jointventure is as follows:
Current Year Previous YearRs./Lacs Rs./Lacs
A) Assets
1. Fixed assets (Net block) including CWIP N/A 749.20Investment N/A 0.00
2. Current Assets, Loans and AdvancesInventories N/A 67.22Sundry Debtors N/A 127.95Cash and Bank Balance N/A 46.30Other Current Assets N/A 15.32
B) Liabilities
1. Loan Funds N/A 825.97 2. Current Liabilities and Provisions N/A 135.74 3. Shareholder Fund N/A 44.28
C) Income
1. Sales and Services (Net) N/A 315.03
2. Other Income N/A 1.02
D) Expenditure
1 . Cost of Sales N/A 352.70 2. Salaries and Wages N/A 45.98 3. Selling and Admn. Expenses N/A 27.54 4. Provision for Taxation N/A 0.00 5. Others N/A 121.55
E) Profit After Tax N/A (231.72)
15. Deferred Tax Liability (Net) of Rs. 2989.25 Lacs (Previous Year Rs.2279.25 Lacs) as shown in the Balance Sheet consist of:
A) Deferred tax liability representing tax arising out oftiming difference on account of
(i) Depreciation 3179.94 3079.07
(ii) Effect of Custom Duty & Excise Duty allowed for tax 12.26 29.43purposes in the current year but will be debited toProfit & Loss Account in the following year
3192.20 3108.50
B) Deferred tax asset representing future tax benefit on
(i) Leave Encashment Provision 202.95 114.89(ii) Effect of expenditure debited to Profit & Loss Account 0.00 38.73
in the current year but allowed for tax purposes in the following year(iii) Carry forward of unabsorbed Depreciation and Business Losses 0.00 675.63
202.95 829.25
Net Deferred Tax Liability (A-B) 2989.25 2279.25
The Deferred Tax Asset on Unabsorbed Depreciation and Business Loss has been recognised based on the profits as perthe Letter of Intent in hand from customers.
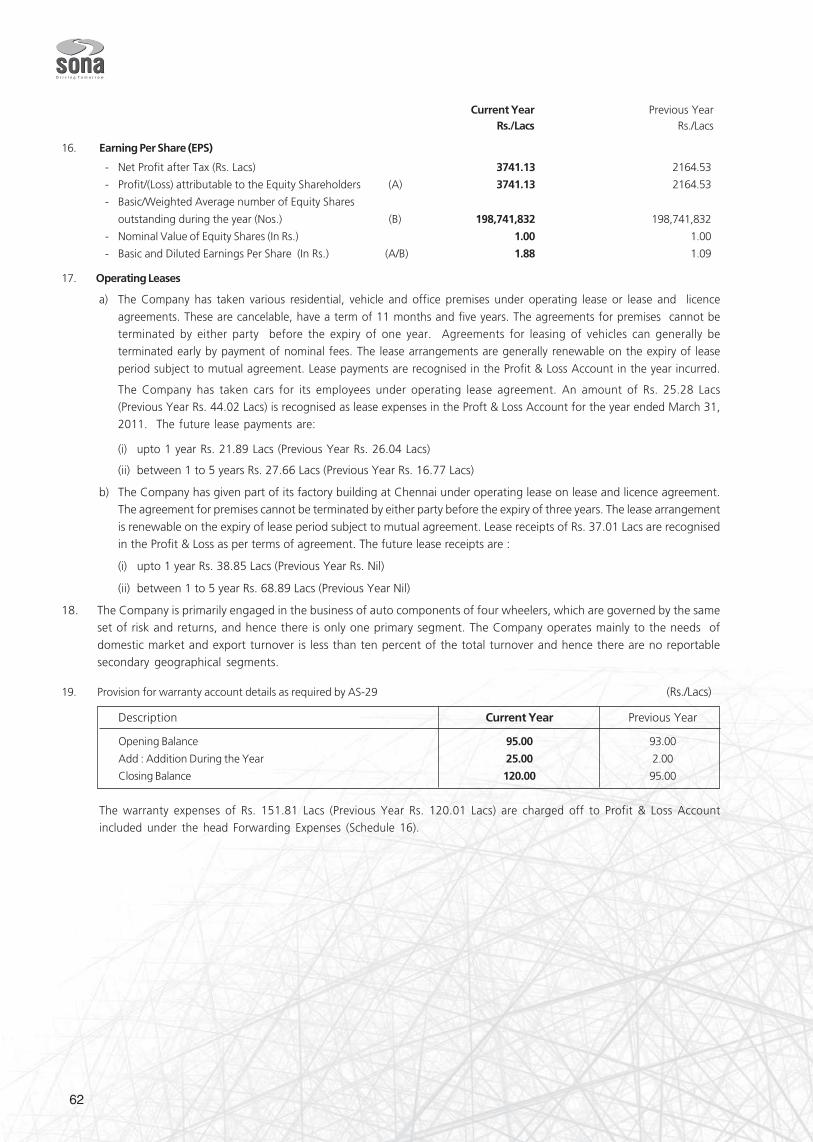
62
Current Year Previous YearRs./Lacs Rs./Lacs
16. Earning Per Share (EPS)
- Net Profit after Tax (Rs. Lacs) 3741.13 2164.53
- Profit/(Loss) attributable to the Equity Shareholders (A) 3741.13 2164.53
- Basic/Weighted Average number of Equity Shares ( No
outstanding during the year (Nos.) (B) 198,741,832 198,741,832
- Nominal Value of Equity Shares (In Rs.) 1.00 1.00
- Basic and Diluted Earnings Per Share (In Rs.) (A/B) 1.88 1.09
17. Operating Leases
a) The Company has taken various residential, vehicle and office premises under operating lease or lease and licence
agreements. These are cancelable, have a term of 11 months and five years. The agreements for premises cannot beterminated by either party before the expiry of one year. Agreements for leasing of vehicles can generally beterminated early by payment of nominal fees. The lease arrangements are generally renewable on the expiry of lease
period subject to mutual agreement. Lease payments are recognised in the Profit & Loss Account in the year incurred.
The Company has taken cars for its employees under operating lease agreement. An amount of Rs. 25.28 Lacs(Previous Year Rs. 44.02 Lacs) is recognised as lease expenses in the Proft & Loss Account for the year ended March 31,2011. The future lease payments are:
(i) upto 1 year Rs. 21.89 Lacs (Previous Year Rs. 26.04 Lacs)
(ii) between 1 to 5 years Rs. 27.66 Lacs (Previous Year Rs. 16.77 Lacs)
b) The Company has given part of its factory building at Chennai under operating lease on lease and licence agreement.The agreement for premises cannot be terminated by either party before the expiry of three years. The lease arrangement
is renewable on the expiry of lease period subject to mutual agreement. Lease receipts of Rs. 37.01 Lacs are recognisedin the Profit & Loss as per terms of agreement. The future lease receipts are :
(i) upto 1 year Rs. 38.85 Lacs (Previous Year Rs. Nil)
(ii) between 1 to 5 year Rs. 68.89 Lacs (Previous Year Nil)
18. The Company is primarily engaged in the business of auto components of four wheelers, which are governed by the sameset of risk and returns, and hence there is only one primary segment. The Company operates mainly to the needs of
domestic market and export turnover is less than ten percent of the total turnover and hence there are no reportablesecondary geographical segments.
19. Provision for warranty account details as required by AS-29 (Rs./Lacs)
Description Current Year Previous Year
Opening Balance 95.00 93.00
Add : Addition During the Year 25.00 2.00
Closing Balance 120.00 95.00
The warranty expenses of Rs. 151.81 Lacs (Previous Year Rs. 120.01 Lacs) are charged off to Profit & Loss Accountincluded under the head Forwarding Expenses (Schedule 16).
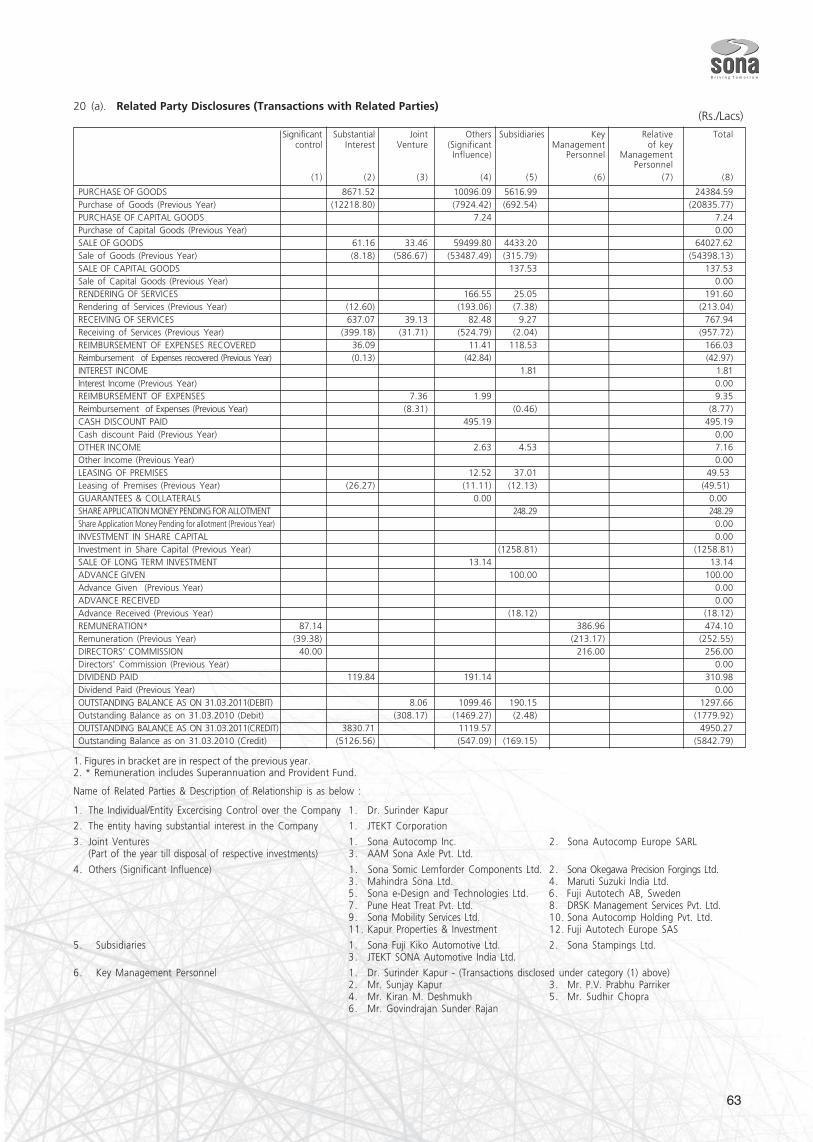
63
20 (a). Related Party Disclosures (Transactions with Related Parties)
Significant Substantial Joint Others Subsidiaries Key Relative Totalcontrol Interest Venture (Significant Management of key
Influence) Personnel ManagementPersonnel
(1) (2) (3) (4) (5) (6) (7) (8)
PURCHASE OF GOODS 8671.52 10096.09 5616.99 24384.59Purchase of Goods (Previous Year) (12218.80) (7924.42) (692.54) (20835.77)PURCHASE OF CAPITAL GOODS 7.24 7.24Purchase of Capital Goods (Previous Year) 0.00SALE OF GOODS 61.16 33.46 59499.80 4433.20 64027.62Sale of Goods (Previous Year) (8.18) (586.67) (53487.49) (315.79) (54398.13)SALE OF CAPITAL GOODS 137.53 137.53Sale of Capital Goods (Previous Year) 0.00RENDERING OF SERVICES 166.55 25.05 191.60Rendering of Services (Previous Year) (12.60) (193.06) (7.38) (213.04)RECEIVING OF SERVICES 637.07 39.13 82.48 9.27 767.94Receiving of Services (Previous Year) (399.18) (31.71) (524.79) (2.04) (957.72)REIMBURSEMENT OF EXPENSES RECOVERED 36.09 11.41 118.53 166.03Reimbursement of Expenses recovered (Previous Year) (0.13) (42.84) (42.97)INTEREST INCOME 1.81 1.81Interest Income (Previous Year) 0.00REIMBURSEMENT OF EXPENSES 7.36 1.99 9.35Reimbursement of Expenses (Previous Year) (8.31) (0.46) (8.77)CASH DISCOUNT PAID 495.19 495.19Cash discount Paid (Previous Year) 0.00OTHER INCOME 2.63 4.53 7.16Other Income (Previous Year) 0.00LEASING OF PREMISES 12.52 37.01 49.53Leasing of Premises (Previous Year) (26.27) (11.11) (12.13) (49.51)GUARANTEES & COLLATERALS 0.00 0.00SHARE APPLICATION MONEY PENDING FOR ALLOTMENT 248..29 248..29Share Application Money Pending for allotment (Previous Year) 0.00INVESTMENT IN SHARE CAPITAL 0.00Investment in Share Capital (Previous Year) (1258.81) (1258.81)SALE OF LONG TERM INVESTMENT 13.14 13.14ADVANCE GIVEN 100.00 100.00Advance Given (Previous Year) 0.00ADVANCE RECEIVED 0.00Advance Received (Previous Year) (18.12) (18.12)REMUNERATION* 87.14 386.96 474.10Remuneration (Previous Year) (39.38) (213.17) (252.55)DIRECTORS’ COMMISSION 40.00 216.00 256.00Directors’ Commission (Previous Year) 0.00DIVIDEND PAID 119.84 191.14 310.98Dividend Paid (Previous Year) 0.00OUTSTANDING BALANCE AS ON 31.03.2011(DEBIT) 8.06 1099.46 190.15 1297.66Outstanding Balance as on 31.03.2010 (Debit) (308.17) (1469.27) (2.48) (1779.92)OUTSTANDING BALANCE AS ON 31.03.2011(CREDIT) 3830.71 1119.57 4950.27Outstanding Balance as on 31.03.2010 (Credit) (5126.56) (547.09) (169.15) (5842.79)
1. Figures in bracket are in respect of the previous year.2. * Remuneration includes Superannuation and Provident Fund.
Name of Related Parties & Description of Relationship is as below :
1. The Individual/Entity Excercising Control over the Company 1. Dr. Surinder Kapur
2. The entity having substantial interest in the Company 1. JTEKT Corporation
3. Joint Ventures 1. Sona Autocomp Inc. 2. Sona Autocomp Europe SARL(Part of the year till disposal of respective investments) 3. AAM Sona Axle Pvt. Ltd.
4. Others (Significant Influence) 1. Sona Somic Lemforder Components Ltd. 2. Sona Okegawa Precision Forgings Ltd.3. Mahindra Sona Ltd. 4. Maruti Suzuki India Ltd.5. Sona e-Design and Technologies Ltd. 6. Fuji Autotech AB, Sweden7. Pune Heat Treat Pvt. Ltd. 8. DRSK Management Services Pvt. Ltd.9. Sona Mobility Services Ltd. 10. Sona Autocomp Holding Pvt. Ltd.11. Kapur Properties & Investment 12. Fuji Autotech Europe SAS
5. Subsidiaries 1. Sona Fuji Kiko Automotive Ltd. 2. Sona Stampings Ltd.3. JTEKT SONA Automotive India Ltd.
6. Key Management Personnel 1. Dr. Surinder Kapur - (Transactions disclosed under category (1) above)2. Mr. Sunjay Kapur 3. Mr. P.V. Prabhu Parriker4. Mr. Kiran M. Deshmukh 5. Mr. Sudhir Chopra6. Mr. Govindrajan Sunder Rajan
(Rs./Lacs)
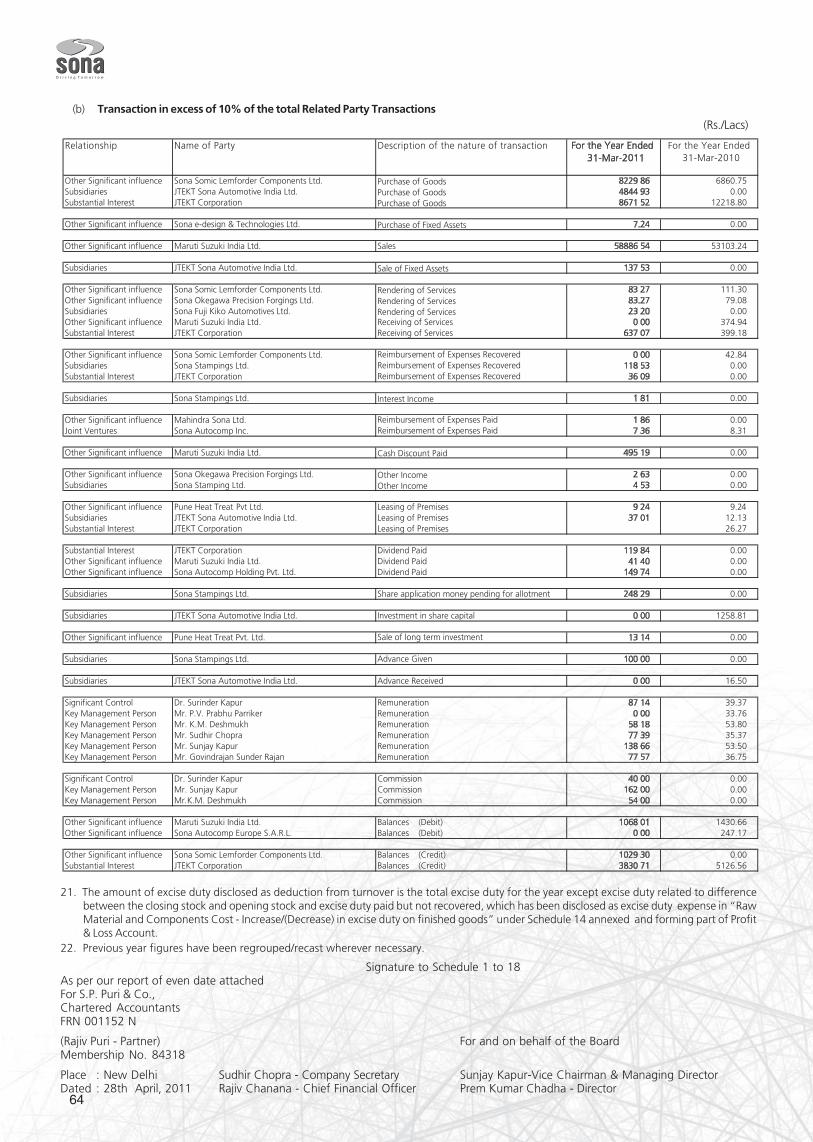
64
(b) Transaction in excess of 10% of the total Related Party Transactions
21. The amount of excise duty disclosed as deduction from turnover is the total excise duty for the year except excise duty related to differencebetween the closing stock and opening stock and excise duty paid but not recovered, which has been disclosed as excise duty expense in “RawMaterial and Components Cost - Increase/(Decrease) in excise duty on finished goods” under Schedule 14 annexed and forming part of Profit& Loss Account.
22. Previous year figures have been regrouped/recast wherever necessary.
Signature to Schedule 1 to 18As per our report of even date attachedFor S.P. Puri & Co.,Chartered AccountantsFRN 001152 N
(Rajiv Puri - Partner) For and on behalf of the BoardMembership No. 84318
Place : New Delhi Sudhir Chopra - Company Secretary Sunjay Kapur-Vice Chairman & Managing DirectorDated : 28th April, 2011 Rajiv Chanana - Chief Financial Officer Prem Kumar Chadha - Director
(Rs./Lacs)
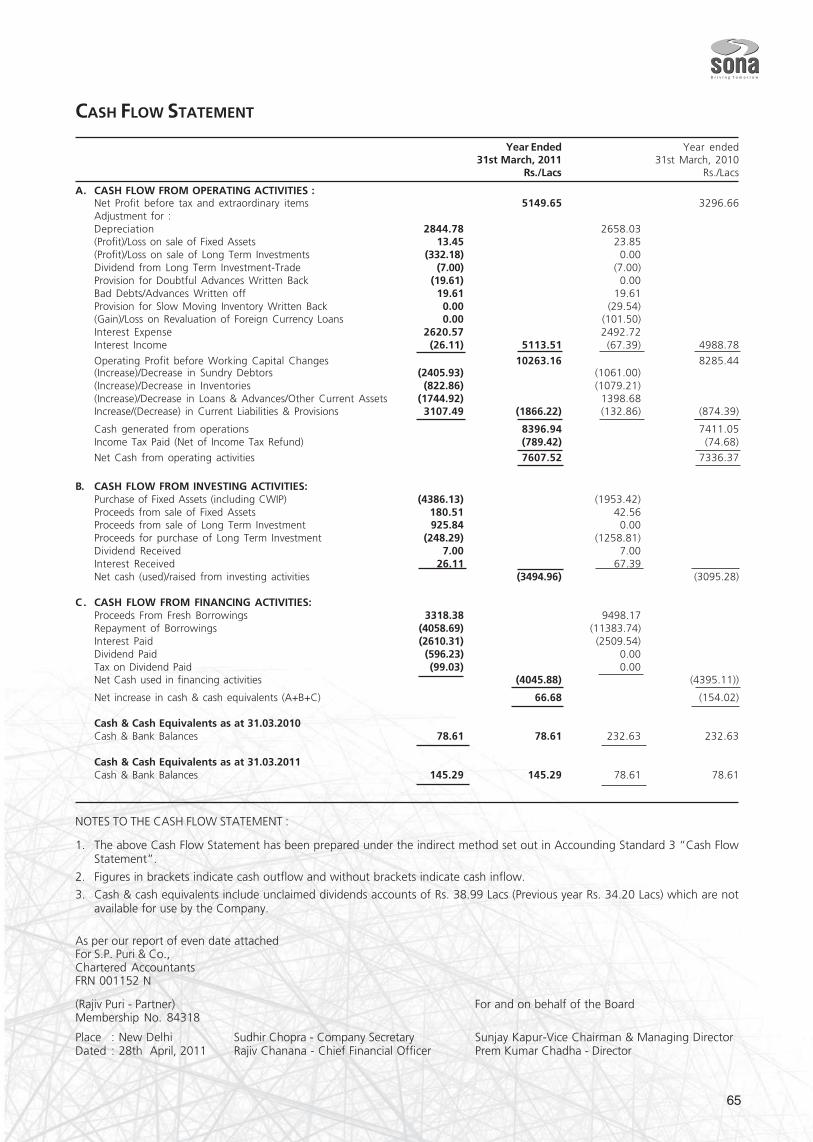
65
CASH FLOW STATEMENT
Year Ended Year ended31st March, 2011 31st March, 2010
Rs./Lacs Rs./Lacs
A. CASH FLOW FROM OPERATING ACTIVITIES :Net Profit before tax and extraordinary items 5149.65 3296.66Adjustment for :Depreciation 2844.78 2658.03(Profit)/Loss on sale of Fixed Assets 13.45 23.85(Profit)/Loss on sale of Long Term Investments (332.18) 0.00Dividend from Long Term Investment-Trade (7.00) (7.00)Provision for Doubtful Advances Written Back (19.61) 0.00Bad Debts/Advances Written off 19.61 19.61Provision for Slow Moving Inventory Written Back 0.00 (29.54)(Gain)/Loss on Revaluation of Foreign Currency Loans 0.00 (101.50)Interest Expense 2620.57 2492.72Interest Income (26.11) 5113.51 (67.39) 4988.78
Operating Profit before Working Capital Changes 10263.16 8285.44(Increase)/Decrease in Sundry Debtors (2405.93) (1061.00)(Increase)/Decrease in Inventories (822.86) (1079.21)(Increase)/Decrease in Loans & Advances/Other Current Assets (1744.92) 1398.68Increase/(Decrease) in Current Liabilities & Provisions 3107.49 (1866.22) (132.86) (874.39)
Cash generated from operations 8396.94 7411.05Income Tax Paid (Net of Income Tax Refund) (789.42) (74.68)
Net Cash from operating activities 7607.52 7336.37
B. CASH FLOW FROM INVESTING ACTIVITIES:Purchase of Fixed Assets (including CWIP) (4386.13) (1953.42)Proceeds from sale of Fixed Assets 180.51 42.56Proceeds from sale of Long Term Investment 925.84 0.00Proceeds for purchase of Long Term Investment (248.29) (1258.81)Dividend Received 7.00 7.00Interest Received 26.11 67.39Net cash (used)/raised from investing activities (3494.96) (3095.28)
C . CASH FLOW FROM FINANCING ACTIVITIES:Proceeds From Fresh Borrowings 3318.38 9498.17Repayment of Borrowings (4058.69) (11383.74)Interest Paid (2610.31) (2509.54)Dividend Paid (596.23) 0.00Tax on Dividend Paid (99.03) 0.00Net Cash used in financing activities (4045.88) (4395.11))
Net increase in cash & cash equivalents (A+B+C) 66.68 (154.02)
Cash & Cash Equivalents as at 31.03.2010Cash & Bank Balances 78.61 78.61 232.63 232.63
Cash & Cash Equivalents as at 31.03.2011Cash & Bank Balances 145.29 145.29 78.61 78.61
NOTES TO THE CASH FLOW STATEMENT :
1. The above Cash Flow Statement has been prepared under the indirect method set out in Accounding Standard 3 “Cash FlowStatement”.
2. Figures in brackets indicate cash outflow and without brackets indicate cash inflow.
3. Cash & cash equivalents include unclaimed dividends accounts of Rs. 38.99 Lacs (Previous year Rs. 34.20 Lacs) which are notavailable for use by the Company.
As per our report of even date attachedFor S.P. Puri & Co.,Chartered AccountantsFRN 001152 N
(Rajiv Puri - Partner) For and on behalf of the BoardMembership No. 84318
Place : New Delhi Sudhir Chopra - Company Secretary Sunjay Kapur-Vice Chairman & Managing DirectorDated : 28th April, 2011 Rajiv Chanana - Chief Financial Officer Prem Kumar Chadha - Director
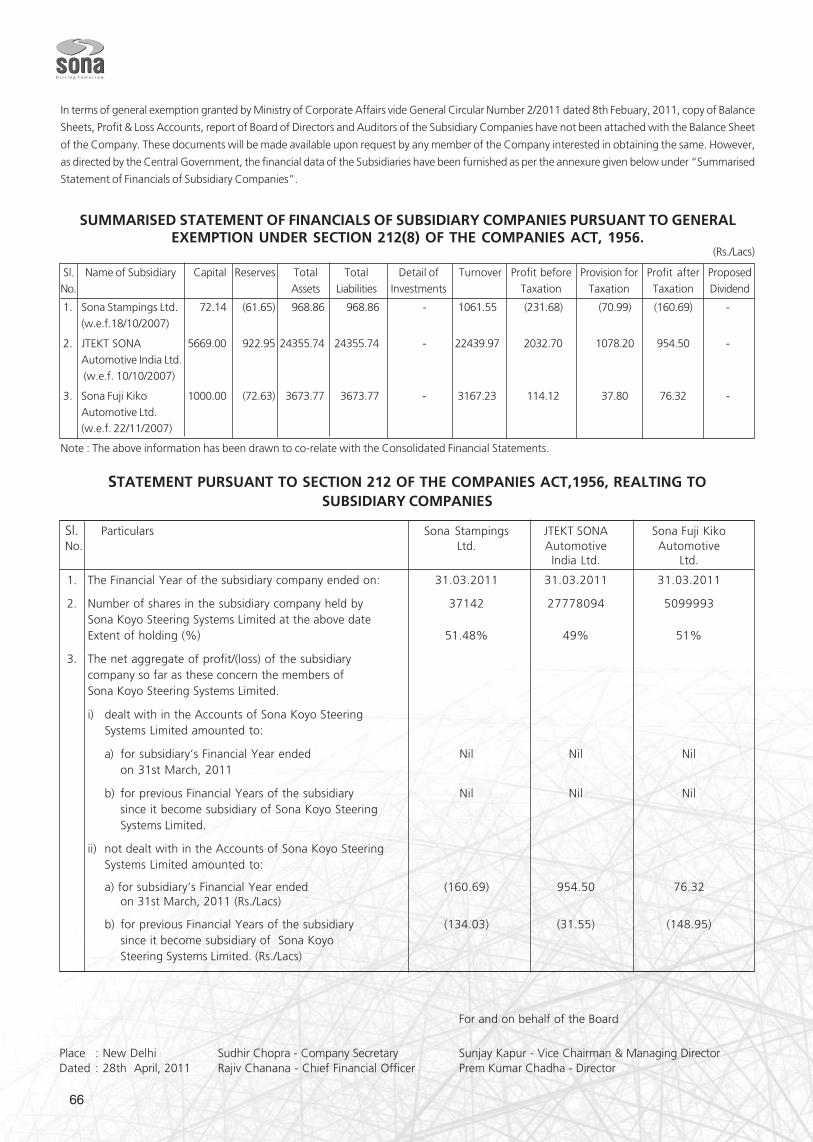
66
STATEMENT PURSUANT TO SECTION 212 OF THE COMPANIES ACT,1956, REALTING TOSUBSIDIARY COMPANIES
Sl. Particulars Sona Stampings JTEKT SONA Sona Fuji KikoNo. Ltd. Automotive Automotive
India Ltd. Ltd.
1. The Financial Year of the subsidiary company ended on: 31.03.2011 31.03.2011 31.03.2011
2. Number of shares in the subsidiary company held by 37142 27778094 5099993Sona Koyo Steering Systems Limited at the above dateExtent of holding (%) 51.48% 49% 51%
3. The net aggregate of profit/(loss) of the subsidiarycompany so far as these concern the members ofSona Koyo Steering Systems Limited.
i) dealt with in the Accounts of Sona Koyo SteeringSystems Limited amounted to:
a) for subsidiary’s Financial Year ended Nil Nil Nilon 31st March, 2011
b) for previous Financial Years of the subsidiary Nil Nil Nilsince it become subsidiary of Sona Koyo SteeringSystems Limited.
ii) not dealt with in the Accounts of Sona Koyo SteeringSystems Limited amounted to:
a) for subsidiary’s Financial Year ended (160.69) 954.50 76.32on 31st March, 2011 (Rs./Lacs)
b) for previous Financial Years of the subsidiary (134.03) (31.55) (148.95)since it become subsidiary of Sona KoyoSteering Systems Limited. (Rs./Lacs)
For and on behalf of the Board
Place : New Delhi Sudhir Chopra - Company Secretary Sunjay Kapur - Vice Chairman & Managing DirectorDated : 28th April, 2011 Rajiv Chanana - Chief Financial Officer Prem Kumar Chadha - Director
In terms of general exemption granted by Ministry of Corporate Affairs vide General Circular Number 2/2011 dated 8th Febuary, 2011, copy of Balance
Sheets, Profit & Loss Accounts, report of Board of Directors and Auditors of the Subsidiary Companies have not been attached with the Balance Sheet
of the Company. These documents will be made available upon request by any member of the Company interested in obtaining the same. However,
as directed by the Central Government, the financial data of the Subsidiaries have been furnished as per the annexure given below under “Summarised
Statement of Financials of Subsidiary Companies”.
SUMMARISED STATEMENT OF FINANCIALS OF SUBSIDIARY COMPANIES PURSUANT TO GENERALEXEMPTION UNDER SECTION 212(8) OF THE COMPANIES ACT, 1956.
Sl. Name of Subsidiary Capital Reserves Total Total Detail of Turnover Profit before Provision for Profit after ProposedNo. Assets Liabilities Investments Taxation Taxation Taxation Dividend
1. Sona Stampings Ltd. 72.14 (61.65) 968.86 968.86 - 1061.55 (231.68) (70.99) (160.69) -(w.e.f.18/10/2007)
2. JTEKT SONA 5669.00 922.95 24355.74 24355.74 - 22439.97 2032.70 1078.20 954.50 -Automotive India Ltd. (w.e.f. 10/10/2007)
3. Sona Fuji Kiko 1000.00 (72.63) 3673.77 3673.77 - 3167.23 114.12 37.80 76.32 -Automotive Ltd.(w.e.f. 22/11/2007)
Note : The above information has been drawn to co-relate with the Consolidated Financial Statements.
(Rs./Lacs)
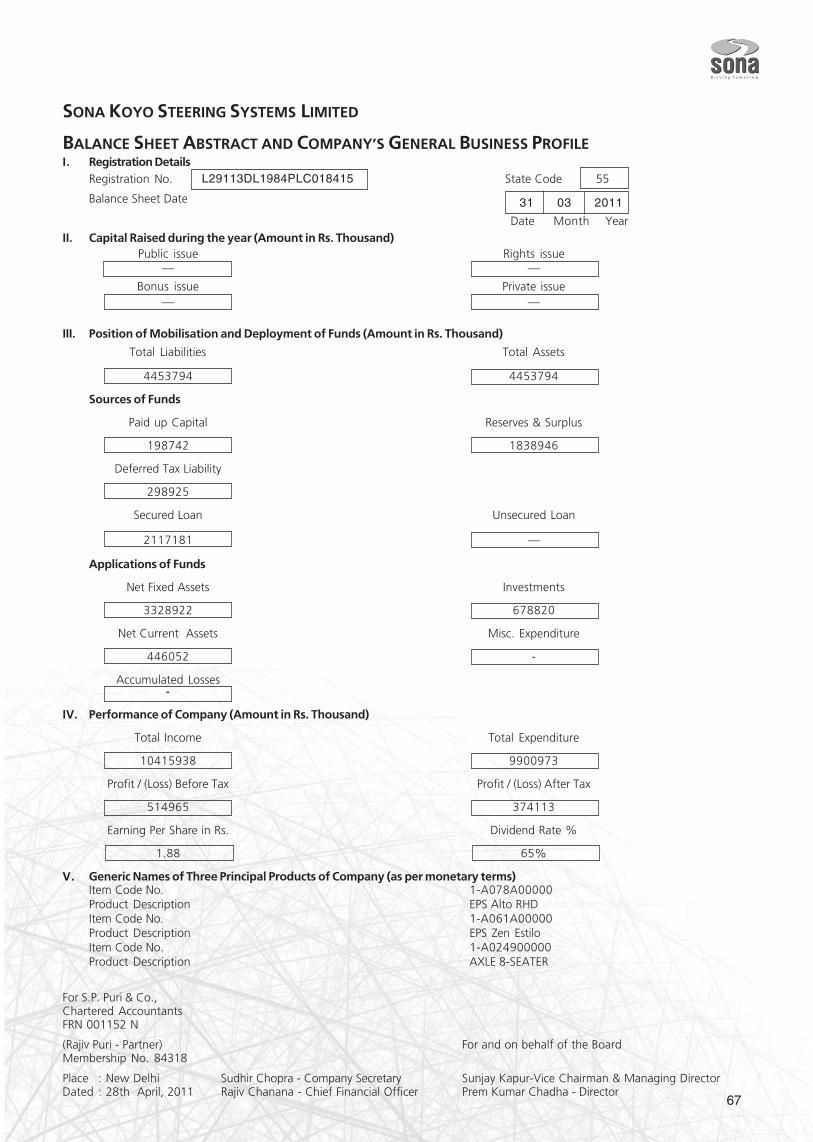
67
SONA KOYO STEERING SYSTEMS LIMITED
BALANCE SHEET ABSTRACT AND COMPANY’S GENERAL BUSINESS PROFILEI. Registration Details
Registration No. State Code 55
Balance Sheet Date
Date Month YearII. Capital Raised during the year (Amount in Rs. Thousand)
Public issue Rights issue— —
Bonus issue Private issue— —
III. Position of Mobilisation and Deployment of Funds (Amount in Rs. Thousand)
Total Liabilities Total Assets
4453794 4453794
Sources of Funds
Paid up Capital Reserves & Surplus
198742 1838946
Deferred Tax Liability
298925
Secured Loan Unsecured Loan
2117181 —
Applications of Funds
Net Fixed Assets Investments
3328922 678820
Net Current Assets Misc. Expenditure
446052 -
Accumulated Losses-
IV. Performance of Company (Amount in Rs. Thousand)
Total Income Total Expenditure
10415938 9900973
Profit / (Loss) Before Tax Profit / (Loss) After Tax
514965 374113
Earning Per Share in Rs. Dividend Rate %
1.88 65%
V. Generic Names of Three Principal Products of Company (as per monetary terms)Item Code No. 1-A078A00000Product Description EPS Alto RHDItem Code No. 1-A061A00000Product Description EPS Zen EstiloItem Code No. 1-A024900000Product Description AXLE 8-SEATER
For S.P. Puri & Co.,Chartered AccountantsFRN 001152 N
(Rajiv Puri - Partner) For and on behalf of the BoardMembership No. 84318
Place : New Delhi Sudhir Chopra - Company Secretary Sunjay Kapur-Vice Chairman & Managing DirectorDated : 28th April, 2011 Rajiv Chanana - Chief Financial Officer Prem Kumar Chadha - Director
31 03 2011
L29113DL1984PLC018415
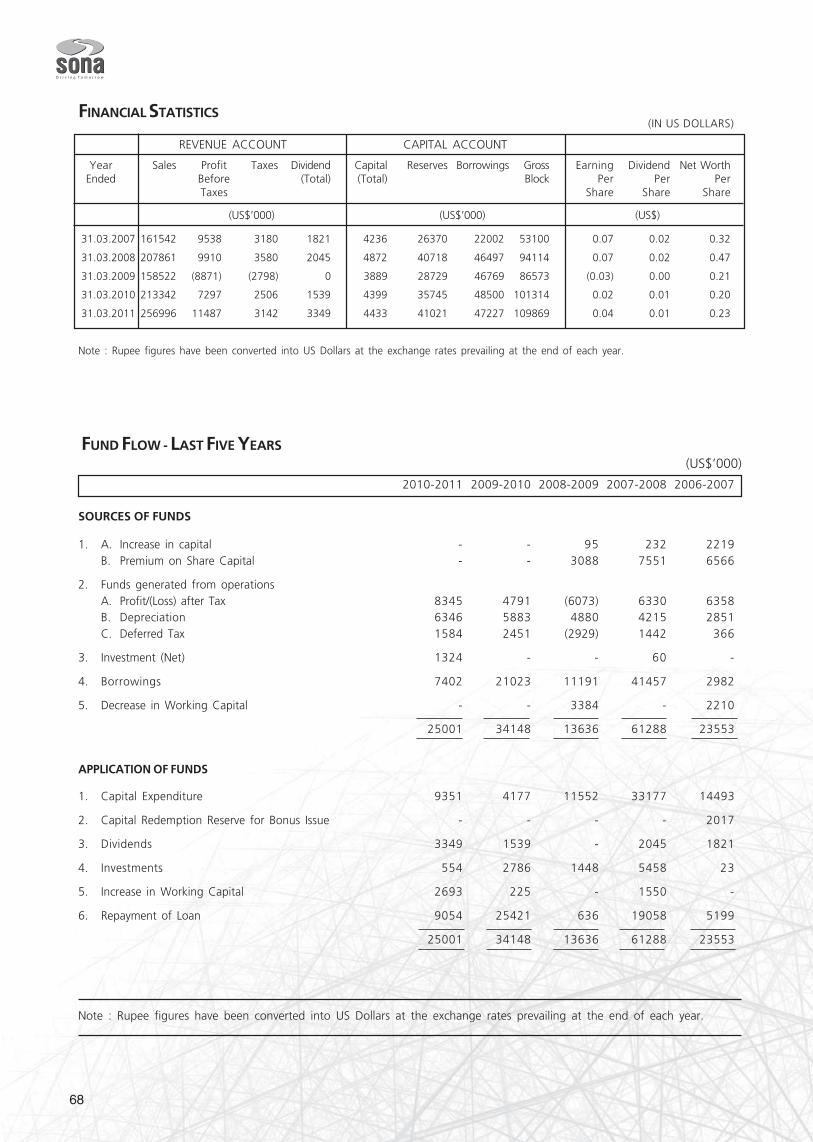
68
FINANCIAL STATISTICS
REVENUE ACCOUNT CAPITAL ACCOUNT
Year Sales Profit Taxes Dividend Capital Reserves Borrowings Gross Earning Dividend Net WorthEnded Before (Total) (Total) Block Per Per Per
Taxes Share Share Share
(US$’000) (US$’000) (US$)
31.03.2007 161542 9538 3180 1821 4236 26370 22002 53100 0.07 0.02 0.32
31.03.2008 207861 9910 3580 2045 4872 40718 46497 94114 0.07 0.02 0.47
31.03.2009 158522 (8871) (2798) 0 3889 28729 46769 86573 (0.03) 0.00 0.21
31.03.2010 213342 7297 2506 1539 4399 35745 48500 101314 0.02 0.01 0.20
31.03.2011 256996 11487 3142 3349 4433 41021 47227 109869 0.04 0.01 0.23
Note : Rupee figures have been converted into US Dollars at the exchange rates prevailing at the end of each year.
FUND FLOW - LAST FIVE YEARS(US$’000)
2010-2011 2009-2010 2008-2009 2007-2008 2006-2007
SOURCES OF FUNDS
1. A. Increase in capital - - 95 232 2219B. Premium on Share Capital - - 3088 7551 6566
2. Funds generated from operationsA. Profit/(Loss) after Tax 8345 4791 (6073) 6330 6358B. Depreciation 6346 5883 4880 4215 2851C. Deferred Tax 1584 2451 (2929) 1442 366
3. Investment (Net) 1324 - - 60 -
4. Borrowings 7402 21023 11191 41457 2982
5. Decrease in Working Capital - - 3384 - 2210
25001 34148 13636 61288 23553
APPLICATION OF FUNDS
1. Capital Expenditure 9351 4177 11552 33177 14493
2. Capital Redemption Reserve for Bonus Issue - - - - 2017
3. Dividends 3349 1539 - 2045 1821
4. Investments 554 2786 1448 5458 23
5. Increase in Working Capital 2693 225 - 1550 -
6. Repayment of Loan 9054 25421 636 19058 5199
25001 34148 13636 61288 23553
Note : Rupee figures have been converted into US Dollars at the exchange rates prevailing at the end of each year.
(IN US DOLLARS)
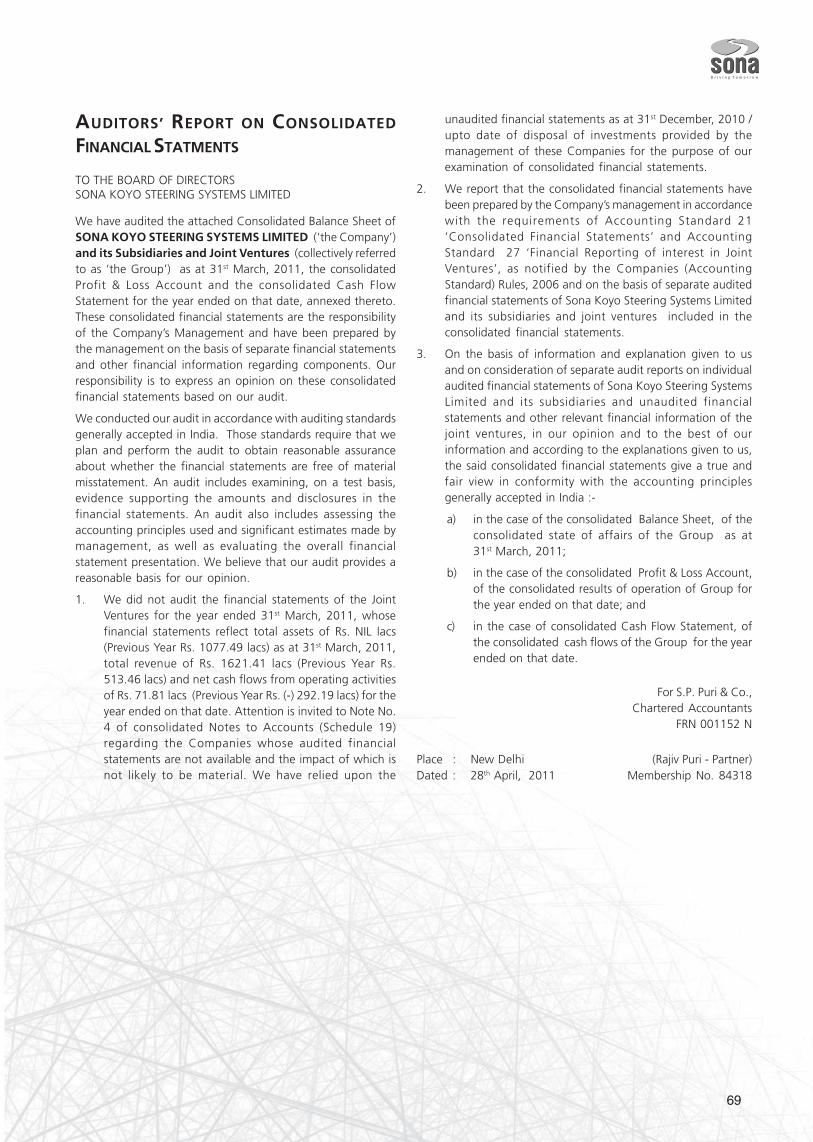
69
AUDITORS’ REPORT ON CONSOLIDATED
FINANCIAL STATMENTS
TO THE BOARD OF DIRECTORSSONA KOYO STEERING SYSTEMS LIMITED
We have audited the attached Consolidated Balance Sheet ofSONA KOYO STEERING SYSTEMS LIMITED (‘the Company’)and its Subsidiaries and Joint Ventures (collectively referredto as ‘the Group’) as at 31st March, 2011, the consolidatedProfit & Loss Account and the consolidated Cash FlowStatement for the year ended on that date, annexed thereto.These consolidated financial statements are the responsibilityof the Company’s Management and have been prepared bythe management on the basis of separate financial statementsand other financial information regarding components. Ourresponsibility is to express an opinion on these consolidatedfinancial statements based on our audit.
We conducted our audit in accordance with auditing standardsgenerally accepted in India. Those standards require that weplan and perform the audit to obtain reasonable assuranceabout whether the financial statements are free of materialmisstatement. An audit includes examining, on a test basis,evidence supporting the amounts and disclosures in thefinancial statements. An audit also includes assessing theaccounting principles used and significant estimates made bymanagement, as well as evaluating the overall financialstatement presentation. We believe that our audit provides areasonable basis for our opinion.
1. We did not audit the financial statements of the JointVentures for the year ended 31st March, 2011, whosefinancial statements reflect total assets of Rs. NIL lacs(Previous Year Rs. 1077.49 lacs) as at 31st March, 2011,total revenue of Rs. 1621.41 lacs (Previous Year Rs.513.46 lacs) and net cash flows from operating activitiesof Rs. 71.81 lacs (Previous Year Rs. (-) 292.19 lacs) for theyear ended on that date. Attention is invited to Note No.4 of consolidated Notes to Accounts (Schedule 19)regarding the Companies whose audited financialstatements are not available and the impact of which isnot likely to be material. We have relied upon the
unaudited financial statements as at 31st December, 2010 /upto date of disposal of investments provided by themanagement of these Companies for the purpose of ourexamination of consolidated financial statements.
2. We report that the consolidated financial statements havebeen prepared by the Company’s management in accordancewith the requirements of Accounting Standard 21‘Consolidated Financial Statements’ and AccountingStandard 27 ‘Financial Reporting of interest in JointVentures’, as notified by the Companies (AccountingStandard) Rules, 2006 and on the basis of separate auditedfinancial statements of Sona Koyo Steering Systems Limitedand its subsidiaries and joint ventures included in theconsolidated financial statements.
3. On the basis of information and explanation given to usand on consideration of separate audit reports on individualaudited financial statements of Sona Koyo Steering SystemsLimited and its subsidiaries and unaudited financialstatements and other relevant financial information of thejoint ventures, in our opinion and to the best of ourinformation and according to the explanations given to us,the said consolidated financial statements give a true andfair view in conformity with the accounting principlesgenerally accepted in India :-
a) in the case of the consolidated Balance Sheet, of theconsolidated state of affairs of the Group as at31st March, 2011;
b) in the case of the consolidated Profit & Loss Account,of the consolidated results of operation of Group forthe year ended on that date; and
c) in the case of consolidated Cash Flow Statement, ofthe consolidated cash flows of the Group for the yearended on that date.
For S.P. Puri & Co.,Chartered Accountants
FRN 001152 N
Place : New Delhi (Rajiv Puri - Partner)Dated : 28th April, 2011 Membership No. 84318
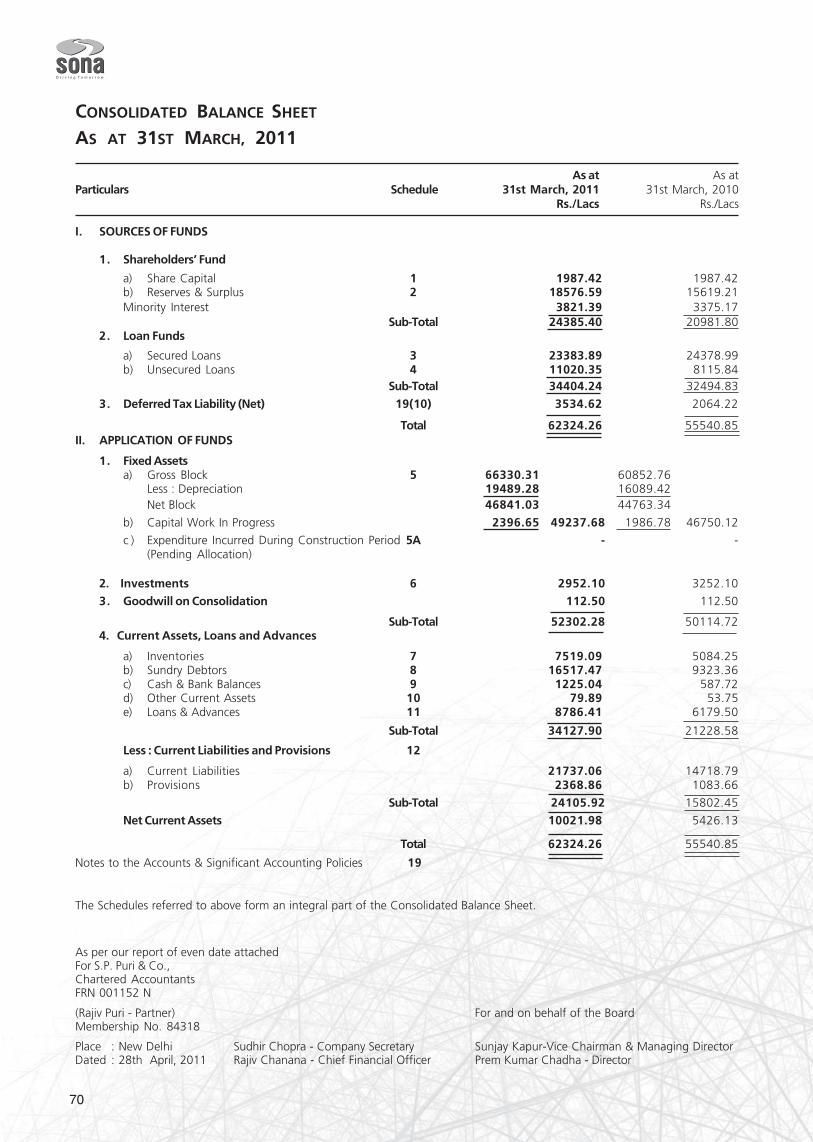
70
CONSOLIDATED BALANCE SHEET
AS AT 31ST MARCH, 2011
As at As atParticulars Schedule 31st March, 2011 31st March, 2010
Rs./Lacs Rs./Lacs
I. SOURCES OF FUNDS
1. Shareholders’ Fund
a) Share Capital 1 1987.42 1987.42b) Reserves & Surplus 2 18576.59 15619.21Minority Interest 3821.39 3375.17
Sub-Total 24385.40 20981.802. Loan Funds
a) Secured Loans 3 23383.89 24378.99b) Unsecured Loans 4 11020.35 8115.84
Sub-Total 34404.24 32494.83
3. Deferred Tax Liability (Net) 19(10) 3534.62 2064.22
Total 62324.26 55540.85II. APPLICATION OF FUNDS
1. Fixed Assetsa) Gross Block 5 66330.31 60852.76
Less : Depreciation 19489.28 16089.42Net Block 46841.03 44763.34
b) Capital Work In Progress 2396.65 49237.68 1986.78 46750.12
c ) Expenditure Incurred During Construction Period 5A - -(Pending Allocation)
2. Investments 6 2952.10 3252.10
3. Goodwill on Consolidation 112.50 112.50
Sub-Total 52302.28 50114.724. Current Assets, Loans and Advances
a) Inventories 7 7519.09 5084.25b) Sundry Debtors 8 16517.47 9323.36c) Cash & Bank Balances 9 1225.04 587.72d) Other Current Assets 10 79.89 53.75e) Loans & Advances 11 8786.41 6179.50
Sub-Total 34127.90 21228.58
Less : Current Liabilities and Provisions 12
a) Current Liabilities 21737.06 14718.79b) Provisions 2368.86 1083.66
Sub-Total 24105.92 15802.45
Net Current Assets 10021.98 5426.13
Total 62324.26 55540.85
Notes to the Accounts & Significant Accounting Policies 19
The Schedules referred to above form an integral part of the Consolidated Balance Sheet.
As per our report of even date attachedFor S.P. Puri & Co.,Chartered AccountantsFRN 001152 N
(Rajiv Puri - Partner) For and on behalf of the BoardMembership No. 84318
Place : New Delhi Sudhir Chopra - Company Secretary Sunjay Kapur-Vice Chairman & Managing DirectorDated : 28th April, 2011 Rajiv Chanana - Chief Financial Officer Prem Kumar Chadha - Director
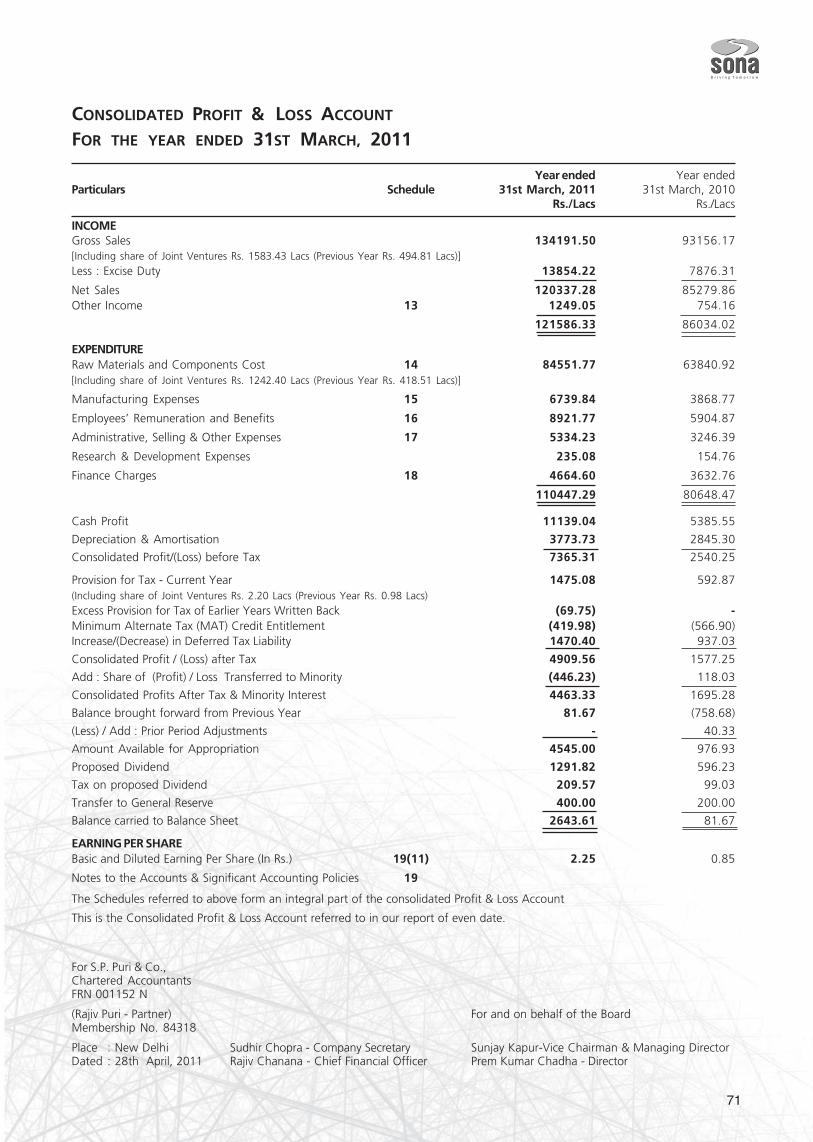
71
CONSOLIDATED PROFIT & LOSS ACCOUNT
FOR THE YEAR ENDED 31ST MARCH, 2011
Year ended Year endedParticulars Schedule 31st March, 2011 31st March, 2010
Rs./Lacs Rs./Lacs
INCOMEGross Sales 134191.50 93156.17[Including share of Joint Ventures Rs. 1583.43 Lacs (Previous Year Rs. 494.81 Lacs)]Less : Excise Duty 13854.22 7876.31
Net Sales 120337.28 85279.86Other Income 13 1249.05 754.16
121586.33 86034.02
EXPENDITURERaw Materials and Components Cost 14 84551.77 63840.92[Including share of Joint Ventures Rs. 1242.40 Lacs (Previous Year Rs. 418.51 Lacs)]
Manufacturing Expenses 15 6739.84 3868.77
Employees’ Remuneration and Benefits 16 8921.77 5904.87
Administrative, Selling & Other Expenses 17 5334.23 3246.39
Research & Development Expenses 235.08 154.76
Finance Charges 18 4664.60 3632.76
110447.29 80648.47
Cash Profit 11139.04 5385.55
Depreciation & Amortisation 3773.73 2845.30
Consolidated Profit/(Loss) before Tax 7365.31 2540.25
Provision for Tax - Current Year 1475.08 592.87(Including share of Joint Ventures Rs. 2.20 Lacs (Previous Year Rs. 0.98 Lacs)Excess Provision for Tax of Earlier Years Written Back (69.75) -Minimum Alternate Tax (MAT) Credit Entitlement (419.98) (566.90)Increase/(Decrease) in Deferred Tax Liability 1470.40 937.03
Consolidated Profit / (Loss) after Tax 4909.56 1577.25
Add : Share of (Profit) / Loss Transferred to Minority (446.23) 118.03
Consolidated Profits After Tax & Minority Interest 4463.33 1695.28
Balance brought forward from Previous Year 81.67 (758.68)
(Less) / Add : Prior Period Adjustments - 40.33
Amount Available for Appropriation 4545.00 976.93
Proposed Dividend 1291.82 596.23
Tax on proposed Dividend 209.57 99.03
Transfer to General Reserve 400.00 200.00
Balance carried to Balance Sheet 2643.61 81.67
EARNING PER SHAREBasic and Diluted Earning Per Share (In Rs.) 19(11) 2.25 0.85
Notes to the Accounts & Significant Accounting Policies 19
The Schedules referred to above form an integral part of the consolidated Profit & Loss Account
This is the Consolidated Profit & Loss Account referred to in our report of even date.
For S.P. Puri & Co.,Chartered AccountantsFRN 001152 N
(Rajiv Puri - Partner) For and on behalf of the BoardMembership No. 84318
Place : New Delhi Sudhir Chopra - Company Secretary Sunjay Kapur-Vice Chairman & Managing DirectorDated : 28th April, 2011 Rajiv Chanana - Chief Financial Officer Prem Kumar Chadha - Director
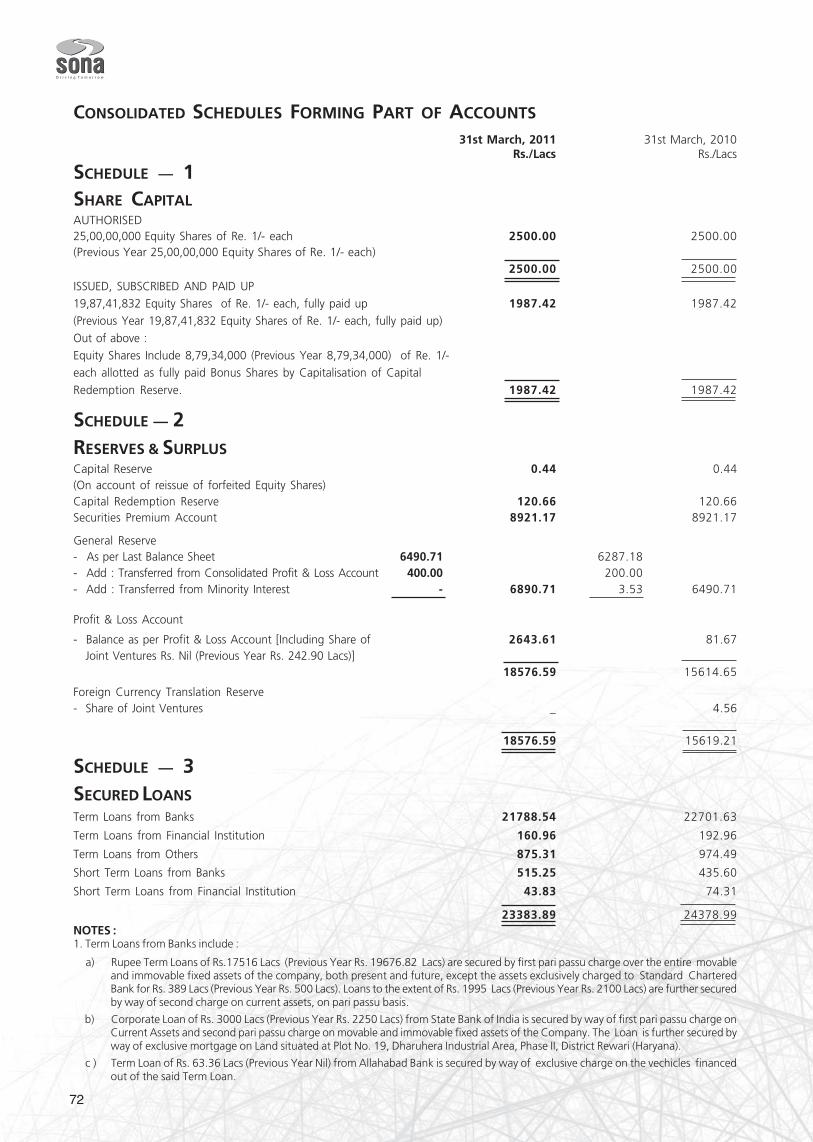
72
CONSOLIDATED SCHEDULES FORMING PART OF ACCOUNTS
31st March, 2011 31st March, 2010Rs./Lacs Rs./Lacs
SCHEDULE — 1SHARE CAPITALAUTHORISED25,00,00,000 Equity Shares of Re. 1/- each 2500.00 2500.00(Previous Year 25,00,00,000 Equity Shares of Re. 1/- each)
2500.00 2500.00
ISSUED, SUBSCRIBED AND PAID UP19,87,41,832 Equity Shares of Re. 1/- each, fully paid up 1987.42 1987.42(Previous Year 19,87,41,832 Equity Shares of Re. 1/- each, fully paid up)
Out of above :Equity Shares Include 8,79,34,000 (Previous Year 8,79,34,000) of Re. 1/-each allotted as fully paid Bonus Shares by Capitalisation of Capital
Redemption Reserve. 1987.42 1987.42
SCHEDULE — 2RESERVES & SURPLUSCapital Reserve 0.44 0.44(On account of reissue of forfeited Equity Shares)Capital Redemption Reserve 120.66 120.66Securities Premium Account 8921.17 8921.17
General Reserve- As per Last Balance Sheet 6490.71 6287.18- Add : Transferred from Consolidated Profit & Loss Account 400.00 200.00- Add : Transferred from Minority Interest - 6890.71 3.53 6490.71
Profit & Loss Account
- Balance as per Profit & Loss Account [Including Share of 2643.61 81.67 Joint Ventures Rs. Nil (Previous Year Rs. 242.90 Lacs)]
18576.59 15614.65
Foreign Currency Translation Reserve- Share of Joint Ventures _ 4.56
18576.59 15619.21
SCHEDULE — 3SECURED LOANSTerm Loans from Banks 21788.54 22701.63
Term Loans from Financial Institution 160.96 192.96
Term Loans from Others 875.31 974.49
Short Term Loans from Banks 515.25 435.60
Short Term Loans from Financial Institution 43.83 74.31
23383.89 24378.99NOTES :1. Term Loans from Banks include :
a) Rupee Term Loans of Rs.17516 Lacs (Previous Year Rs. 19676.82 Lacs) are secured by first pari passu charge over the entire movableand immovable fixed assets of the company, both present and future, except the assets exclusively charged to Standard CharteredBank for Rs. 389 Lacs (Previous Year Rs. 500 Lacs). Loans to the extent of Rs. 1995 Lacs (Previous Year Rs. 2100 Lacs) are further securedby way of second charge on current assets, on pari passu basis.
b) Corporate Loan of Rs. 3000 Lacs (Previous Year Rs. 2250 Lacs) from State Bank of India is secured by way of first pari passu charge onCurrent Assets and second pari passu charge on movable and immovable fixed assets of the Company. The Loan is further secured byway of exclusive mortgage on Land situated at Plot No. 19, Dharuhera Industrial Area, Phase II, District Rewari (Haryana).
c ) Term Loan of Rs. 63.36 Lacs (Previous Year Nil) from Allahabad Bank is secured by way of exclusive charge on the vechicles financedout of the said Term Loan.
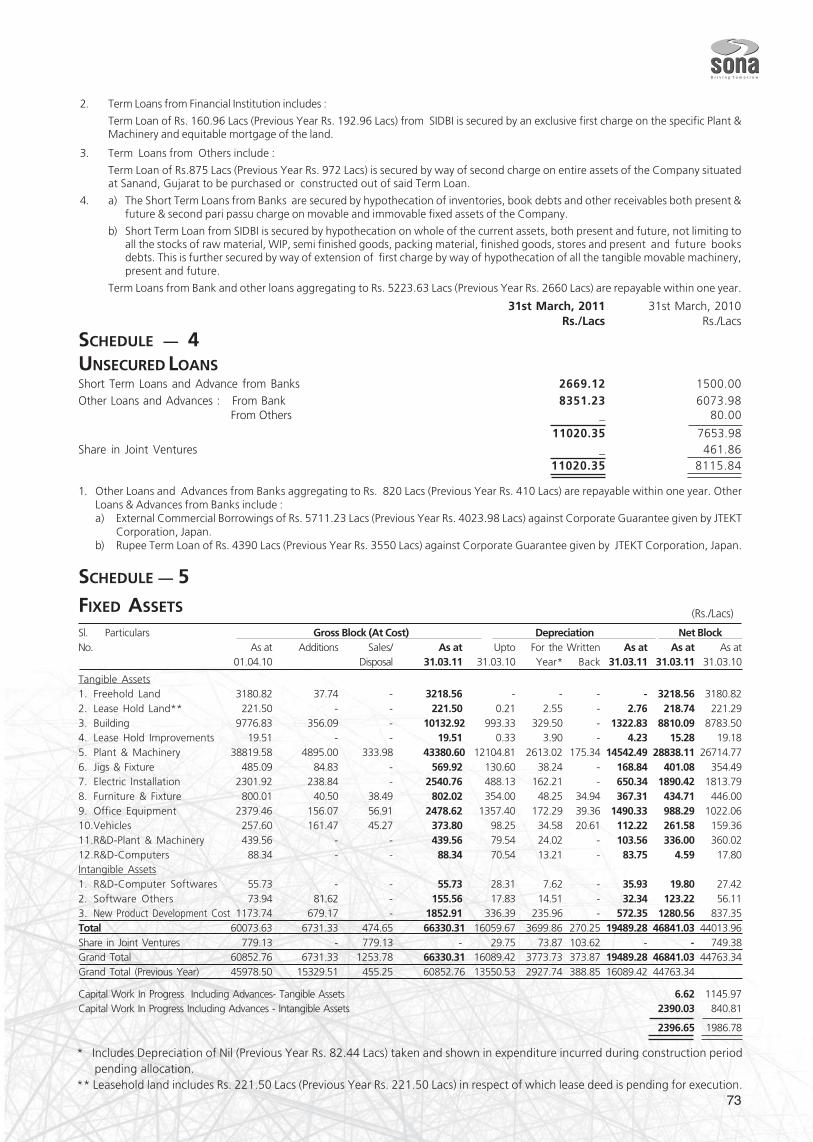
73
31st March, 2011 31st March, 2010Rs./Lacs Rs./Lacs
SCHEDULE — 4UNSECURED LOANSShort Term Loans and Advance from Banks 2669.12 1500.00Other Loans and Advances : From Bank 8351.23 6073.98
From Others _ 80.00
11020.35 7653.98Share in Joint Ventures _ 461.86
11020.35 8115.84
1. Other Loans and Advances from Banks aggregating to Rs. 820 Lacs (Previous Year Rs. 410 Lacs) are repayable within one year. OtherLoans & Advances from Banks include :a) External Commercial Borrowings of Rs. 5711.23 Lacs (Previous Year Rs. 4023.98 Lacs) against Corporate Guarantee given by JTEKT
Corporation, Japan.b) Rupee Term Loan of Rs. 4390 Lacs (Previous Year Rs. 3550 Lacs) against Corporate Guarantee given by JTEKT Corporation, Japan.
SCHEDULE — 5FIXED ASSETS
Sl. Particulars Gross Block (At Cost) Depreciation Net BlockNo. As at Additions Sales/ As at Upto For the Written As at As at As at
01.04.10 Disposal 31.03.11 31.03.10 Year* Back 31.03.11 31.03.11 31.03.10
Tangible Assets1. Freehold Land 3180.82 37.74 - 3218.56 - - - - 3218.56 3180.822. Lease Hold Land** 221.50 - - 221.50 0.21 2.55 - 2.76 218.74 221.293. Building 9776.83 356.09 - 10132.92 993.33 329.50 - 1322.83 8810.09 8783.504. Lease Hold Improvements 19.51 - - 19.51 0.33 3.90 - 4.23 15.28 19.185. Plant & Machinery 38819.58 4895.00 333.98 43380.60 12104.81 2613.02 175.34 14542.49 28838.11 26714.776. Jigs & Fixture 485.09 84.83 - 569.92 130.60 38.24 - 168.84 401.08 354.497. Electric Installation 2301.92 238.84 - 2540.76 488.13 162.21 - 650.34 1890.42 1813.798. Furniture & Fixture 800.01 40.50 38.49 802.02 354.00 48.25 34.94 367.31 434.71 446.009. Office Equipment 2379.46 156.07 56.91 2478.62 1357.40 172.29 39.36 1490.33 988.29 1022.0610.Vehicles 257.60 161.47 45.27 373.80 98.25 34.58 20.61 112.22 261.58 159.3611.R&D-Plant & Machinery 439.56 - - 439.56 79.54 24.02 - 103.56 336.00 360.0212.R&D-Computers 88.34 - - 88.34 70.54 13.21 - 83.75 4.59 17.80Intangible Assets1. R&D-Computer Softwares 55.73 - - 55.73 28.31 7.62 - 35.93 19.80 27.422. Software Others 73.94 81.62 - 155.56 17.83 14.51 - 32.34 123.22 56.113. New Product Development Cost 1173.74 679.17 - 1852.91 336.39 235.96 - 572.35 1280.56 837.35Total 60073.63 6731.33 474.65 66330.31 16059.67 3699.86 270.25 19489.28 46841.03 44013.96Share in Joint Ventures 779.13 - 779.13 - 29.75 73.87 103.62 - - 749.38Grand Total 60852.76 6731.33 1253.78 66330.31 16089.42 3773.73 373.87 19489.28 46841.03 44763.34Grand Total (Previous Year) 45978.50 15329.51 455.25 60852.76 13550.53 2927.74 388.85 16089.42 44763.34
Capital Work In Progress Including Advances- Tangible Assets 6.62 1145.97Capital Work In Progress Including Advances - Intangible Assets 2390.03 840.81
2396.65 1986.78
2. Term Loans from Financial Institution includes :
Term Loan of Rs. 160.96 Lacs (Previous Year Rs. 192.96 Lacs) from SIDBI is secured by an exclusive first charge on the specific Plant &Machinery and equitable mortgage of the land.
3. Term Loans from Others include :
Term Loan of Rs.875 Lacs (Previous Year Rs. 972 Lacs) is secured by way of second charge on entire assets of the Company situatedat Sanand, Gujarat to be purchased or constructed out of said Term Loan.
4. a) The Short Term Loans from Banks are secured by hypothecation of inventories, book debts and other receivables both present &future & second pari passu charge on movable and immovable fixed assets of the Company.
b) Short Term Loan from SIDBI is secured by hypothecation on whole of the current assets, both present and future, not limiting toall the stocks of raw material, WIP, semi finished goods, packing material, finished goods, stores and present and future booksdebts. This is further secured by way of extension of first charge by way of hypothecation of all the tangible movable machinery,present and future.
Term Loans from Bank and other loans aggregating to Rs. 5223.63 Lacs (Previous Year Rs. 2660 Lacs) are repayable within one year.
* Includes Depreciation of Nil (Previous Year Rs. 82.44 Lacs) taken and shown in expenditure incurred during construction period pending allocation.** Leasehold land includes Rs. 221.50 Lacs (Previous Year Rs. 221.50 Lacs) in respect of which lease deed is pending for execution.
(Rs./Lacs)
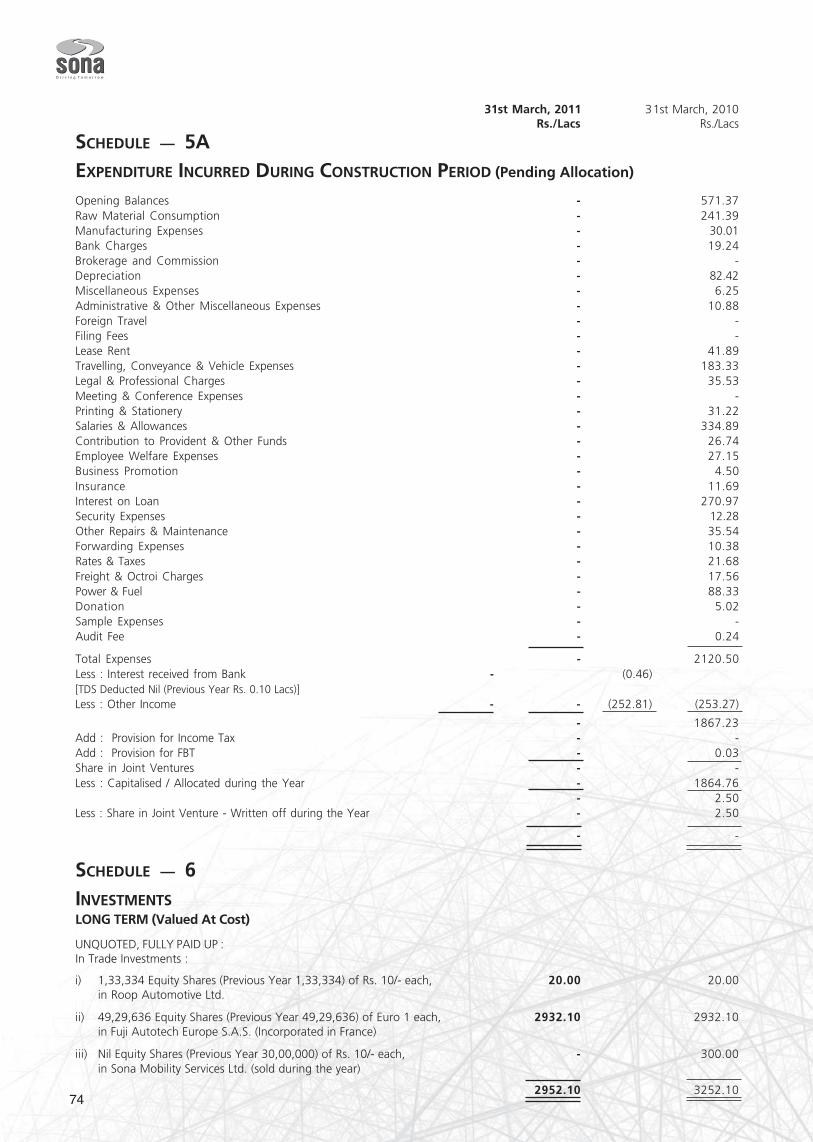
74
31st March, 2011 31st March, 2010 Rs./Lacs Rs./Lacs
SCHEDULE — 5AEXPENDITURE INCURRED DURING CONSTRUCTION PERIOD (Pending Allocation)
Opening Balances - 571.37Raw Material Consumption - 241.39Manufacturing Expenses - 30.01Bank Charges - 19.24Brokerage and Commission - -Depreciation - 82.42Miscellaneous Expenses - 6.25Administrative & Other Miscellaneous Expenses - 10.88Foreign Travel - -Filing Fees - -Lease Rent - 41.89Travelling, Conveyance & Vehicle Expenses - 183.33Legal & Professional Charges - 35.53Meeting & Conference Expenses - -Printing & Stationery - 31.22Salaries & Allowances - 334.89Contribution to Provident & Other Funds - 26.74Employee Welfare Expenses - 27.15Business Promotion - 4.50Insurance - 11.69Interest on Loan - 270.97Security Expenses - 12.28Other Repairs & Maintenance - 35.54Forwarding Expenses - 10.38Rates & Taxes - 21.68Freight & Octroi Charges - 17.56Power & Fuel - 88.33Donation - 5.02Sample Expenses - -Audit Fee - 0.24
Total Expenses - 2120.50Less : Interest received from Bank - (0.46)[TDS Deducted Nil (Previous Year Rs. 0.10 Lacs)]Less : Other Income - - (252.81) (253.27)
- 1867.23Add : Provision for Income Tax - -Add : Provision for FBT - 0.03Share in Joint Ventures - -Less : Capitalised / Allocated during the Year - 1864.76
- 2.50Less : Share in Joint Venture - Written off during the Year - 2.50
- -
SCHEDULE — 6INVESTMENTSLONG TERM (Valued At Cost)
UNQUOTED, FULLY PAID UP :In Trade Investments :
i) 1,33,334 Equity Shares (Previous Year 1,33,334) of Rs. 10/- each, 20.00 20.00in Roop Automotive Ltd.
ii) 49,29,636 Equity Shares (Previous Year 49,29,636) of Euro 1 each, 2932.10 2932.10in Fuji Autotech Europe S.A.S. (Incorporated in France)
iii) Nil Equity Shares (Previous Year 30,00,000) of Rs. 10/- each, - 300.00in Sona Mobility Services Ltd. (sold during the year)
2952.10 3252.10
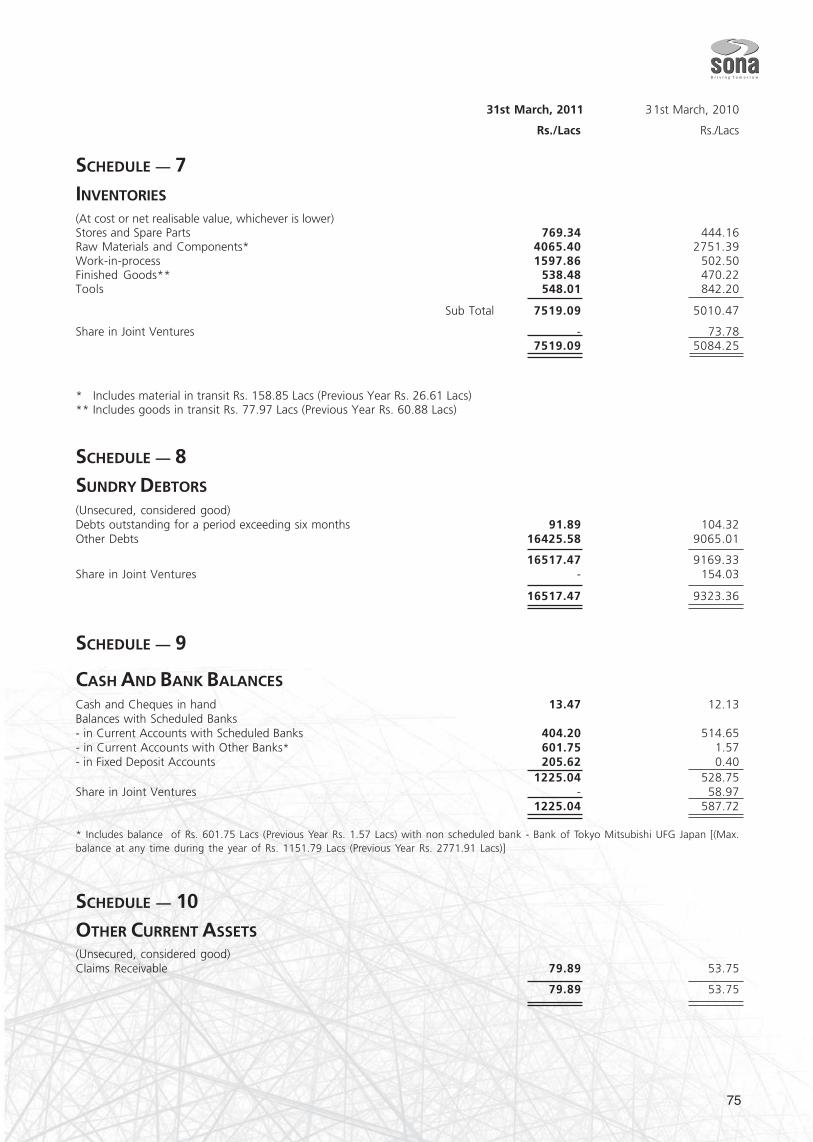
75
31st March, 2011 31st March, 2010
Rs./Lacs Rs./Lacs
SCHEDULE — 7INVENTORIES
(At cost or net realisable value, whichever is lower)Stores and Spare Parts 769.34 444.16Raw Materials and Components* 4065.40 2751.39Work-in-process 1597.86 502.50Finished Goods** 538.48 470.22Tools 548.01 842.20
Sub Total 7519.09 5010.47
Share in Joint Ventures - 73.787519.09 5084.25
* Includes material in transit Rs. 158.85 Lacs (Previous Year Rs. 26.61 Lacs)** Includes goods in transit Rs. 77.97 Lacs (Previous Year Rs. 60.88 Lacs)
SCHEDULE — 8SUNDRY DEBTORS
(Unsecured, considered good)Debts outstanding for a period exceeding six months 91.89 104.32Other Debts 16425.58 9065.01
16517.47 9169.33Share in Joint Ventures - 154.03
16517.47 9323.36
SCHEDULE — 9
CASH AND BANK BALANCES
Cash and Cheques in hand 13.47 12.13Balances with Scheduled Banks- in Current Accounts with Scheduled Banks 404.20 514.65- in Current Accounts with Other Banks* 601.75 1.57- in Fixed Deposit Accounts 205.62 0.40
1225.04 528.75Share in Joint Ventures - 58.97
1225.04 587.72
* Includes balance of Rs. 601.75 Lacs (Previous Year Rs. 1.57 Lacs) with non scheduled bank - Bank of Tokyo Mitsubishi UFG Japan [(Max.balance at any time during the year of Rs. 1151.79 Lacs (Previous Year Rs. 2771.91 Lacs)]
SCHEDULE — 10OTHER CURRENT ASSETS(Unsecured, considered good)Claims Receivable 79.89 53.75
79.89 53.75
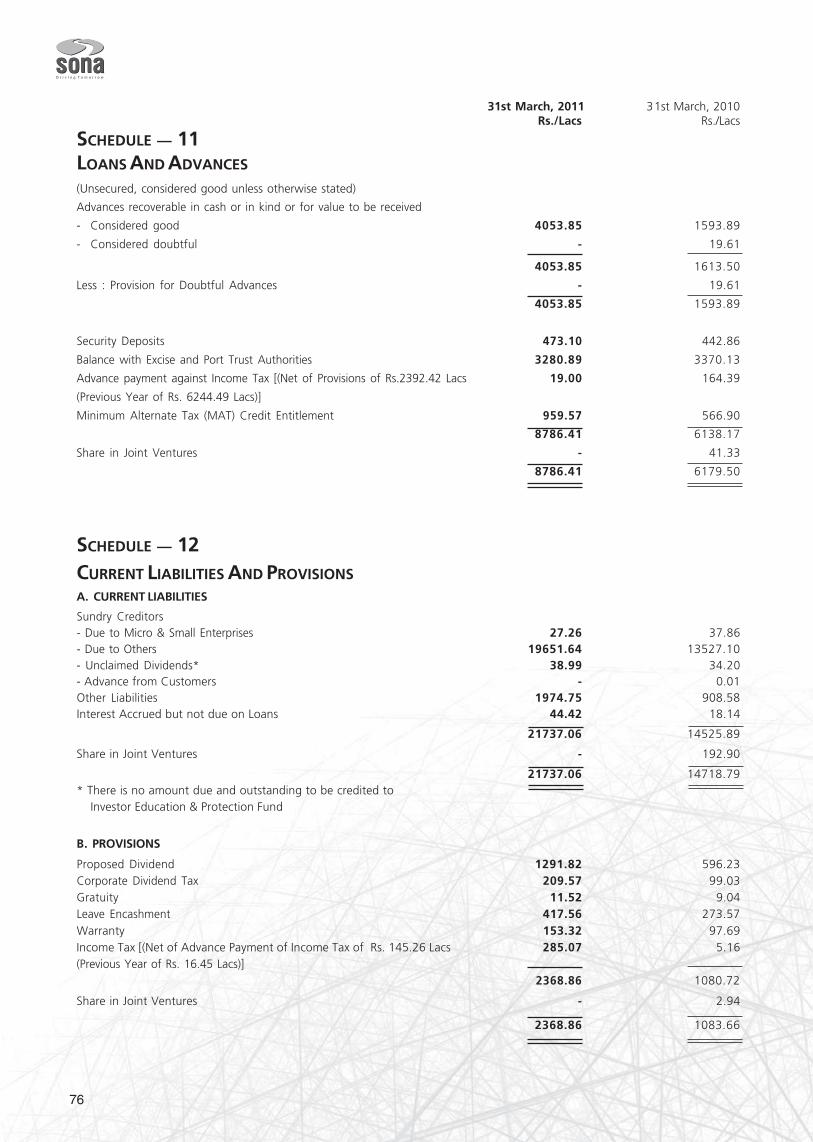
76
31st March, 2011 31st March, 2010 Rs./Lacs Rs./Lacs
SCHEDULE — 11LOANS AND ADVANCES
(Unsecured, considered good unless otherwise stated)
Advances recoverable in cash or in kind or for value to be received
- Considered good 4053.85 1593.89
- Considered doubtful - 19.61
4053.85 1613.50
Less : Provision for Doubtful Advances - 19.61
4053.85 1593.89
Security Deposits 473.10 442.86
Balance with Excise and Port Trust Authorities 3280.89 3370.13
Advance payment against Income Tax [(Net of Provisions of Rs.2392.42 Lacs 19.00 164.39
(Previous Year of Rs. 6244.49 Lacs)]
Minimum Alternate Tax (MAT) Credit Entitlement 959.57 566.90
8786.41 6138.17
Share in Joint Ventures - 41.33
8786.41 6179.50
SCHEDULE — 12CURRENT LIABILITIES AND PROVISIONSA. CURRENT LIABILITIES
Sundry Creditors- Due to Micro & Small Enterprises 27.26 37.86- Due to Others 19651.64 13527.10- Unclaimed Dividends* 38.99 34.20- Advance from Customers - 0.01Other Liabilities 1974.75 908.58Interest Accrued but not due on Loans 44.42 18.14
21737.06 14525.89
Share in Joint Ventures - 192.90
21737.06 14718.79* There is no amount due and outstanding to be credited to Investor Education & Protection Fund
B. PROVISIONS
Proposed Dividend 1291.82 596.23Corporate Dividend Tax 209.57 99.03Gratuity 11.52 9.04Leave Encashment 417.56 273.57Warranty 153.32 97.69Income Tax [(Net of Advance Payment of Income Tax of Rs. 145.26 Lacs 285.07 5.16(Previous Year of Rs. 16.45 Lacs)]
2368.86 1080.72
Share in Joint Ventures - 2.94
2368.86 1083.66
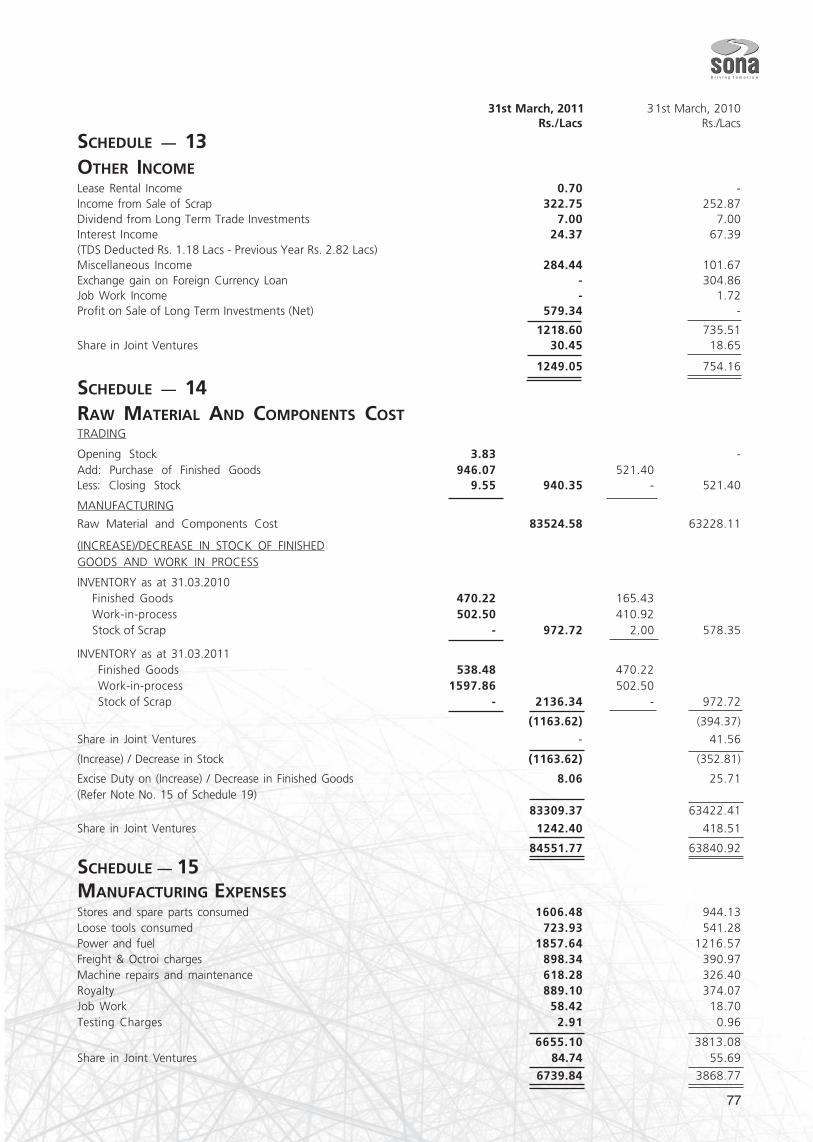
77
31st March, 2011 31st March, 2010 Rs./Lacs Rs./Lacs
SCHEDULE — 13OTHER INCOMELease Rental Income 0.70 -Income from Sale of Scrap 322.75 252.87Dividend from Long Term Trade Investments 7.00 7.00Interest Income 24.37 67.39(TDS Deducted Rs. 1.18 Lacs - Previous Year Rs. 2.82 Lacs)Miscellaneous Income 284.44 101.67Exchange gain on Foreign Currency Loan - 304.86Job Work Income - 1.72Profit on Sale of Long Term Investments (Net) 579.34 -
1218.60 735.51Share in Joint Ventures 30.45 18.65
1249.05 754.16
SCHEDULE — 14RAW MATERIAL AND COMPONENTS COSTTRADING
Opening Stock 3.83 -Add: Purchase of Finished Goods 946.07 521.40Less: Closing Stock 9.55 940.35 - 521.40
MANUFACTURING
Raw Material and Components Cost 83524.58 63228.11
(INCREASE)/DECREASE IN STOCK OF FINISHEDGOODS AND WORK IN PROCESS
INVENTORY as at 31.03.2010Finished Goods 470.22 165.43Work-in-process 502.50 410.92Stock of Scrap - 972.72 2.00 578.35
INVENTORY as at 31.03.2011Finished Goods 538.48 470.22Work-in-process 1597.86 502.50Stock of Scrap - 2136.34 - 972.72
(1163.62) (394.37)
Share in Joint Ventures - 41.56
(Increase) / Decrease in Stock (1163.62) (352.81)
Excise Duty on (Increase) / Decrease in Finished Goods 8.06 25.71(Refer Note No. 15 of Schedule 19)
83309.37 63422.41
Share in Joint Ventures 1242.40 418.51
84551.77 63840.92
SCHEDULE — 15MANUFACTURING EXPENSESStores and spare parts consumed 1606.48 944.13Loose tools consumed 723.93 541.28Power and fuel 1857.64 1216.57Freight & Octroi charges 898.34 390.97Machine repairs and maintenance 618.28 326.40Royalty 889.10 374.07Job Work 58.42 18.70Testing Charges 2.91 0.96
6655.10 3813.08Share in Joint Ventures 84.74 55.69
6739.84 3868.77
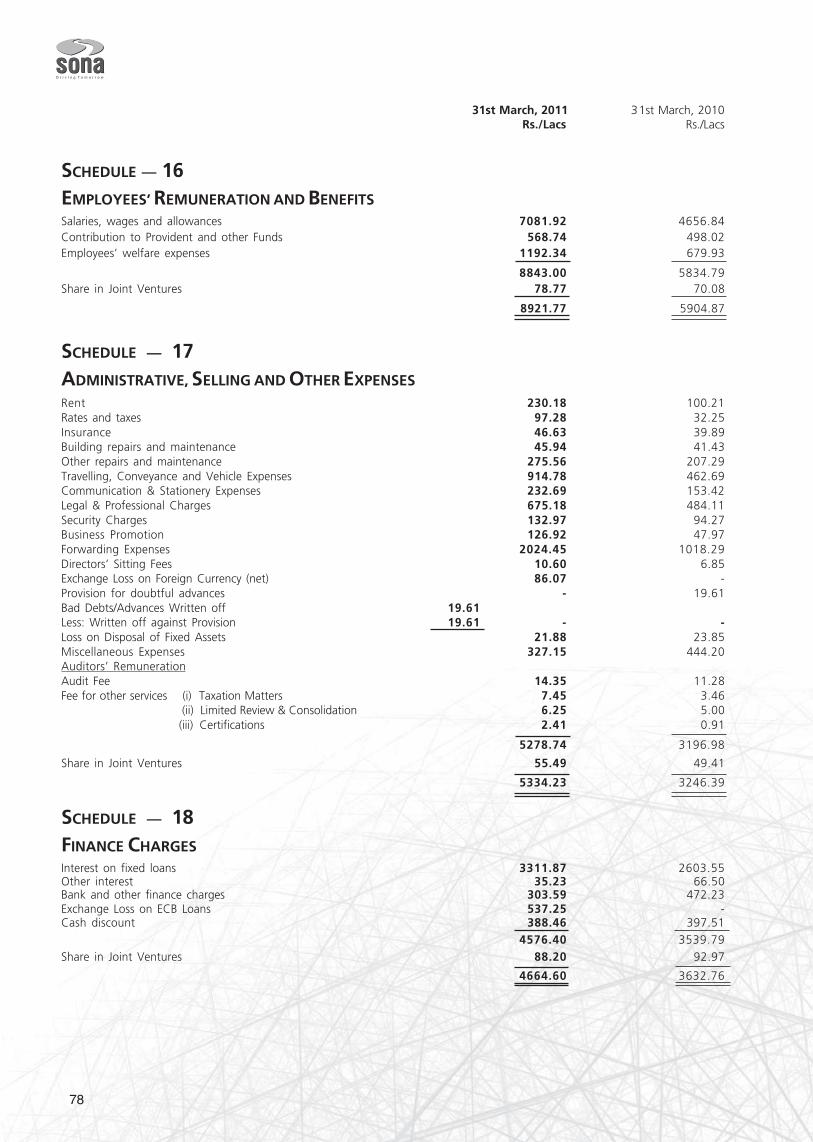
78
31st March, 2011 31st March, 2010 Rs./Lacs Rs./Lacs
SCHEDULE — 16EMPLOYEES’ REMUNERATION AND BENEFITSSalaries, wages and allowances 7081.92 4656.84Contribution to Provident and other Funds 568.74 498.02Employees’ welfare expenses 1192.34 679.93
8843.00 5834.79Share in Joint Ventures 78.77 70.08
8921.77 5904.87
SCHEDULE — 17ADMINISTRATIVE, SELLING AND OTHER EXPENSESRent 230.18 100.21Rates and taxes 97.28 32.25Insurance 46.63 39.89Building repairs and maintenance 45.94 41.43Other repairs and maintenance 275.56 207.29Travelling, Conveyance and Vehicle Expenses 914.78 462.69Communication & Stationery Expenses 232.69 153.42Legal & Professional Charges 675.18 484.11Security Charges 132.97 94.27Business Promotion 126.92 47.97Forwarding Expenses 2024.45 1018.29Directors’ Sitting Fees 10.60 6.85Exchange Loss on Foreign Currency (net) 86.07 -Provision for doubtful advances - 19.61Bad Debts/Advances Written off 19.61Less: Written off against Provision 19.61 - -Loss on Disposal of Fixed Assets 21.88 23.85Miscellaneous Expenses 327.15 444.20Auditors’ RemunerationAudit Fee 14.35 11.28Fee for other services (i) Taxation Matters 7.45 3.46
(ii) Limited Review & Consolidation 6.25 5.00 (iii) Certifications 2.41 0.91
5278.74 3196.98
Share in Joint Ventures 55.49 49.41
5334.23 3246.39
SCHEDULE — 18FINANCE CHARGESInterest on fixed loans 3311.87 2603.55Other interest 35.23 66.50Bank and other finance charges 303.59 472.23Exchange Loss on ECB Loans 537.25 -Cash discount 388.46 397.51
4576.40 3539.79Share in Joint Ventures 88.20 92.97
4664.60 3632.76
79
SCHEDULE – 19NOTES TO THE ACCOUNTS1. SIGNIFICANT ACCOUNTING POLICIES
I. Group Companies :
Sona Koyo Steering Systems Limited has consolidated the financial statements of three Subsidiaries and three JointVenture Companies as given in Table below:
Sl.No. Name of Company Relationship Country of % of ownershipIncorporation interest as on 31st March, 2011
1. Sona Fuji Kiko Automotive Ltd. Subsidiary India 51 2. JTEKT SONA Automotive India Ltd. Subsidiary India 49* 3. Sona Stampings Ltd. Subsidiary India 51.48 4. Sona Autocomp Europe SARL Joint Venture France 24 (up to 24/03/11) 5. Sona Autocomp Inc. USA Joint Venture USA 24 (up to 31/12/10) 6. AAM Sona Axle Pvt. Ltd. Joint Venture India 30 (up to 15/12/10)
*Subsidiary due to control of the compostion of the Board of Directors.
The Joint Venture enterprises referred above were sold during the year.II. Accounting Convention :
The financial statements have been prepared on historical cost basis and in accordance with the applicable accountingstandards and other applicable relevant statutes. A summary of important accounting policies is set out below.
III. Basis for preparation and principal of consolidation :
The consolidated financial statements of the Group have been prepared and presented under the historical costconvention on an accrual basis. The Financial statements of the parent company and the subsidiaries have beencombined on a line to line basis by adding together the book values of like items of assets and liabilities, income andexpenses after eliminating intra group balances/transactions in full as per Accounting Standard-21 on "ConsolidatedFinancial Statements" issued by the Institute of Chartered Accountants of India. The Financial Statements of the JointVenture Companies over which the Company exercises joint control are accounted for using proportionateconsolidation method as per Accounting Standard 27 on "Financial Reporting of Interests in Joint Ventures" issuedby the Institute of Chartered Accountants of India. All unrealised surplus and deficits on transactions between thegroup companies are eliminated. Entities sold during the year have been consolidated upto respective date of theirdisposal. Accounting policies between group companies are consistent to the extent practicable. Appropriate disclosureis made of significant deviations from the company accounting policies, which have not been adjusted.
IV. Goodwill :
Goodwill arising on acquisition is tested for impairment on each Balance Sheet date.
V. The transactions of Sona Autocomp Inc., USA, are not significant and variance in accounting policies, if any, may notmaterially vary these consolidated financial statements.
VI. Other Significant Accounting Policies :
Significant accounting policies followed by Sona Koyo Steering Systems Ltd. are annexed to the independent non-consolidated financial statements. The accounting policy of the joint ventures and subsidiaries are not in major variance.
- Use of Estimates :
The preparation of financial statements in conformity with generally accepted accounting principles (GAAP)requires management to make estimates and assumptions that affect the reported amounts of assets andliabilities and the disclosure of contingent liabilities at the date of the financial statements and the reportedamounts of revenues and expenses during the year. Actual results could differ from those estimates. Any revisionto accounting estimates is recognised prospectively in current and future periods.
- Fixed Assets and Depreciation :
Fixed Assets are stated at cost of acquisition or construction less accumulated depreciation. Cost comprises of thepurchase price, incidental expenses,erection/commissioning expenses and financial charges upto the date thefixed asset is ready for its intended use.
The Group provides depreciation on fixed assets on the straight-line method at the rates specified in ScheduleXIV to the Companies Act, 1956 on a pro-rata basis from the month in which the asset is put to use, except asstated below :
- Leasehold improvements are depreciated at the rate of 20% per annum or over the period of lease if lessthan five years.
- Assets situated at employees’ residence are depreciated at the rate of 33.33% per annum.
- Vehicles are depreciated at the rate of 12% per annum from April, 2003.
80
- The Foreign Joint Venture Companies provide depreciation based on useful life of assets as per localregulations.
An asset is treated as impaired when the carrying cost of assets exceeds its recoverable value. An impairment lossis charged to the Profit & Loss Account in the year in which an asset is identified as impaired. The impairment lossrecognised in prior accounting period is reversed if there has been a change in the estimate of recoverableamount.
- Intangible Assets and Amortization thereof :
Intangible assets comprise new product development expenses and computer software and are stated at costless accumulated amortization and impairment losses, if any.Product development costs incurred including technical fees paid to collaborator for the development of newproducts for which letters of intent have been received from customers are accumulated & recognised asintangible assets (included under fixed assets) and are amortised over a period of six years. Un-amortisedproducts development fee in respect of models discontinued during the year is fully charged off in Profit & LossAccount.Software, which is not an integral part of the related computer hardware is classified as an intangible asset andis being amortised over a period of 72 months, being the estimated useful life.Amortisation expenses is charged on a pro-rata basis for assets purchased during the year. The appropriatenessof the amortisation period and the amortisation method is reviewed at each financial year end.
- Operating Lease :
Lease arrangements, where the risks and rewards incidental to ownership of an asset substantially vest with thelessor, are recognised as operating lease.
Operating lease payments are recognised as an expense in the Profit & Loss Account on a straight line basis overthe lease term.
- Investments :
Long term investments are valued at their acquisition cost. Provision for diminution, other than temporary, ismade wherever necessary.
- Inventory Valuation :
a) Stores and spare parts are valued at lower of weighted average cost and net realisable value.
b) All tools (including loose tools) are written off over their useful life and un-issued tools are valued at lower ofweighted average cost and market value.
c) Raw materials and Components and Work-in-Process are valued at lower of weighted average cost and netrealisable value.
d) Finished Goods are valued at lower of weighted average cost and net realisable value.
Finished Goods and Work in Process include costs of conversion and other costs incurred in bringing theinventories to their present location and condition.
- Foreign Currency Transactions :
Foreign currency transactions are recorded on the basis of average of the exchange rates in force during therelevant week of each month. Gains and losses resulting from the settlement of such transactions and from thetranslation of monetary assets and liabilities denominated in foreign currencies are recognised in the Profit &Loss Account. In case of transaction covered by forward contracts, the difference between the contract rate andexchange rate prevailing on the date of transaction is charged to Profit & Loss Account, proportionately over thecontract period. All assets and liabilities denominated in foreign currency are restated at relevant year end rates.
Foreign Joint Venture Companies are not considered as an integral part of the operation of the parent companyhence all monetary and non monetary assets and liablities have been translated at exchange rate prevailing atthe closing date of Joint Venture Companies’ financial year. Income and expenditure have been translated atquarterly average rate of exhange prevailing for the Joint Ventures Companies’ financial year. Translation lossesand gains on the above are carried to “Foreign Currency Translation Reserve” for future adjustments on disposalof that entity.
- Excise :
Excise duty on finished goods manufactured is accounted on the basis of production of goods.
- Research & Development :
a) Capital Expenditure for Research & Development is capitalised in the year of installation.
b) Revenue expenses incurred for Research & Development for existing products are charged to Profit & LossAccount of the year.
- Income :
Revenue recognition - Revenue from domestic and export sales are recognised on transfer of all significant risksand rewards or ownership to the buyer, which generally coincides with dispatch of goods from factory/portrespectively.
81
Price escalation claims from customers and discounts from suppliers are accounted in the year under audit, onlyif they are settled with the customers and suppliers respectively up to the date of finalisation of accounts.
Dividend on investment is accounted in the year in which it is declared.
All export benefits are recognised as income when there is substantial certainty as their realisability e.g.
a) DEPB license and FPS are recognized as income on the relevant application being filed.
b) Duty draw back is accounted in the year of export.
- Expenses :
a) Discounts to customers and price escalation to suppliers to the extent not settled at the Balance Sheet dateare accounted on the basis of reasonable estimates made after considering negotiations with vendors/customers.
b) Jigs and fixtures costing less than Rs. 5,000/- each are written off in the year of purchase.
c) Goods received are accounted as purchases on satisfactory completion of inspection.
- Borrowing Cost :
Borrowing costs on loans relatable to qualifying assets are capitalized to the extent incurred prior to these assetsbeing put to use. Other borrowing costs are written off in the year to which they pertain.
- Employees’ Benefits :
a) Provident Fund
Contributions to defined contribution schemes such as Provident Fund, etc. are charged to the Profit & LossAccount as incurred. In respect of certain employees, Provident Fund contirbutions are made to a Trustadministered by the Company. The interest rate payable to the members of the Trust shall not be lower thanthe statutory rate of interest declared by the Central Government under the Employees Provident Funds andMiscellaneous Provisions Act, 1952 and shortfall, if any, shall be made good by the Company. The remainingcontributions are made to a government administered Provident Fund towards which the Company has nofurther obligations beyond its monthly contributions.
b) Gratuity
The obligation towards gratuity is a defined benefit retirement plan covering eligible employees. The EmployeeGratuity Fund is managed by Insurance Institutions. The liability of Gratuity Benefits payable in future isaccounted or provided based on an independent actuarial valuation.
c) Leave Encashment
The encashment of leave with pay is provided subject to certain rules for certain grade of employees. Theeligible employees are entitled to accumulate leave subject to certain limits, for future encashment/availment.The liability is provided based on the number of days of unutilized leave at each balance sheet date on thebasis of an independent actuarial valuation.
d) Termination Benefits
Termination benefits are recognised as an expense as and when incurred or only when the obligation can bereliably estimated.
- Taxation :
Taxes on income for the current year are determined on the basis of provisions of Income Tax Act.
Deferred Tax is recognised on timing differences between the accounting income and the taxable income forthe year and quantified using the tax rates and laws enacted or substantively enacted as on the Balance Sheetdate.
Deferred Tax assets are recognised and carried forward to the extent that there is a virtual certainity thatsufficient future taxable income will be available against which such deferred tax asset can be realised.
- Contingencies :
Loss contingencies arising from claims, litigations, assessments, fines, penalties, etc., are recorded when it isprobable that a liability will be incurred, and the amount can be reasonably estimated.
Warranty cost is provided on the basis of cost of warranty claims received from the customers and a reasonableestimate for future claims is made based on empirical data.
- Earning Per Share :
Annualised basic earning per Equity Share is arrived at based on net profit/(loss) after taxation to the basic/weighted average number of equity shares.
82
Current Year Previous YearRs./Lacs Rs./Lacs
2. Capital Commitment :
Estimated amount of contracts remaining 2341.84 1869.25to be executed on capital account not provided for
3. Contingent Liabilities :
I. Claims against the Group not acknowledgedas debt on account of
a) Excise Duty 1322.54 847.36b) Service Tax 341.88 299.22c) Local Area Development Tax (LADT) 209.16 0.00d) Income Tax - Matters in Appeal 56.81 83.96e) Warranties/Customers 67.25 22.11
II. Customer Bills Discounted 910.00 0.00III. Letter of credit opened by banks for purchase of inventory/capital goods 1015.32 1324.51
4. The Profit/Loss after tax of Joint Venture Companies namely Sona Autocomp Inc., USA and AAM Sona Axle Pvt. Ltd. hasbeen based on unaudited financial statement upto the respective date of their disposal and for Sona Autocomp EuropeSARL has been based on the unaudited financial statement ended 31st December, 2010. It is unlikely that the auditedresults would be materially different from the unaudited results. There are no material transaction from 1st January, 2011to 24th March, 2011 in respect of Joint Venture Company Sona Autocomp Europe SARL. There is no change in Company’sinterest in aforesaid Joint Venture from 1st January, 2011 to 24th March, 2011 (Date of disposal).
As a result of disposal of investment in the Joint Venture enterprises a profit of Rs. 871.85 Lacs on the net asset value hasbeen recognised in the consolidated financial statements.
5. Fixed Assets / Capital work in progress during the year includes:
a) Technical Know-how Fees 491.57 169.79b) Professional Charges / Technical Support Services 23.18 8.53c) Development Expenses 0.00 70.24d) Components, Tools & Spares 477.84 204.24
e) Travelling Expenses 43.65 17.64 f) Interest & Bank Charges 114.03 0.00 g) Others 1.90 33.95
h) Salary 51.32 4.18i) Training 0.00 0.00
TOTAL 1203.49 508.57
Note - Excluding figures reported in Schedule 5A.
6. Defined Benefit Plans :
i) The group has recognised, in the Profit & Loss Account for the year ended March 31, 2011 and an amount of Rs. 478.43Lacs (Previous Year Rs. 336.70 Lacs) expenses under defined contribution plans. Contibution to defined contributionplans include :
a) Provident Fund 340.54 241.94
b) Superanuation Fund 105.05 83.44
c) Employee State Insurance Corporation 32.84 11.32
478.43 336.70
The expense is disclosed in the line item - Contribution to provident and other funds in Schedule 16.
ii) The group operates post retirement defined benefit plan for retirement gratuity, which is funded.
iii) Detail of the post retirement funded Gratuity plan and Leaves, which is unfunded, are as follows :
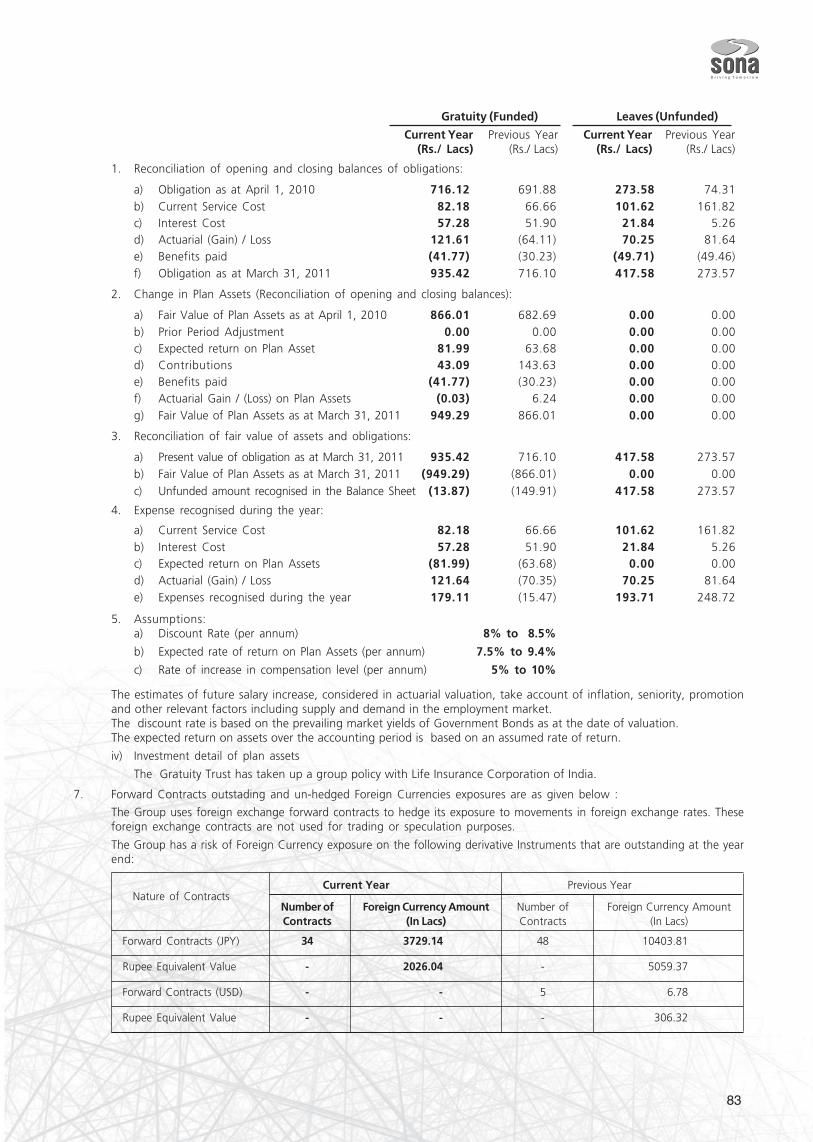
83
Gratuity (Funded) Leaves (Unfunded)
Current Year Previous Year Current Year Previous Year(Rs./ Lacs) (Rs./ Lacs) (Rs./ Lacs) (Rs./ Lacs)
1. Reconciliation of opening and closing balances of obligations:
a) Obligation as at April 1, 2010 716.12 691.88 273.58 74.31b) Current Service Cost 82.18 66.66 101.62 161.82c) Interest Cost 57.28 51.90 21.84 5.26d) Actuarial (Gain) / Loss 121.61 (64.11) 70.25 81.64e) Benefits paid (41.77) (30.23) (49.71) (49.46)f) Obligation as at March 31, 2011 935.42 716.10 417.58 273.57
2. Change in Plan Assets (Reconciliation of opening and closing balances):
a) Fair Value of Plan Assets as at April 1, 2010 866.01 682.69 0.00 0.00b) Prior Period Adjustment 0.00 0.00 0.00 0.00c) Expected return on Plan Asset 81.99 63.68 0.00 0.00d) Contributions 43.09 143.63 0.00 0.00e) Benefits paid (41.77) (30.23) 0.00 0.00f) Actuarial Gain / (Loss) on Plan Assets (0.03) 6.24 0.00 0.00g) Fair Value of Plan Assets as at March 31, 2011 949.29 866.01 0.00 0.00
3. Reconciliation of fair value of assets and obligations:
a) Present value of obligation as at March 31, 2011 935.42 716.10 417.58 273.57b) Fair Value of Plan Assets as at March 31, 2011 (949.29) (866.01) 0.00 0.00c) Unfunded amount recognised in the Balance Sheet (13.87) (149.91) 417.58 273.57
4. Expense recognised during the year:
a) Current Service Cost 82.18 66.66 101.62 161.82b) Interest Cost 57.28 51.90 21.84 5.26c) Expected return on Plan Assets (81.99) (63.68) 0.00 0.00d) Actuarial (Gain) / Loss 121.64 (70.35) 70.25 81.64e) Expenses recognised during the year 179.11 (15.47) 193.71 248.72
5. Assumptions:a) Discount Rate (per annum) 8% to 8.5%
b) Expected rate of return on Plan Assets (per annum) 7.5% to 9.4%
c) Rate of increase in compensation level (per annum) 5% to 10%
The estimates of future salary increase, considered in actuarial valuation, take account of inflation, seniority, promotionand other relevant factors including supply and demand in the employment market.The discount rate is based on the prevailing market yields of Government Bonds as at the date of valuation.The expected return on assets over the accounting period is based on an assumed rate of return.
iv) Investment detail of plan assets
The Gratuity Trust has taken up a group policy with Life Insurance Corporation of India.
7. Forward Contracts outstading and un-hedged Foreign Currencies exposures are as given below :
The Group uses foreign exchange forward contracts to hedge its exposure to movements in foreign exchange rates. Theseforeign exchange contracts are not used for trading or speculation purposes.
The Group has a risk of Foreign Currency exposure on the following derivative Instruments that are outstanding at the yearend:
Current Year Previous Year
Number of Foreign Currency Amount Number of Foreign Currency AmountContracts (In Lacs) Contracts (In Lacs)
Forward Contracts (JPY) 34 3729.14 48 10403.81
Rupee Equivalent Value - 2026.04 - 5059.37
Forward Contracts (USD) - - 5 6.78
Rupee Equivalent Value - - - 306.32
Nature of Contracts
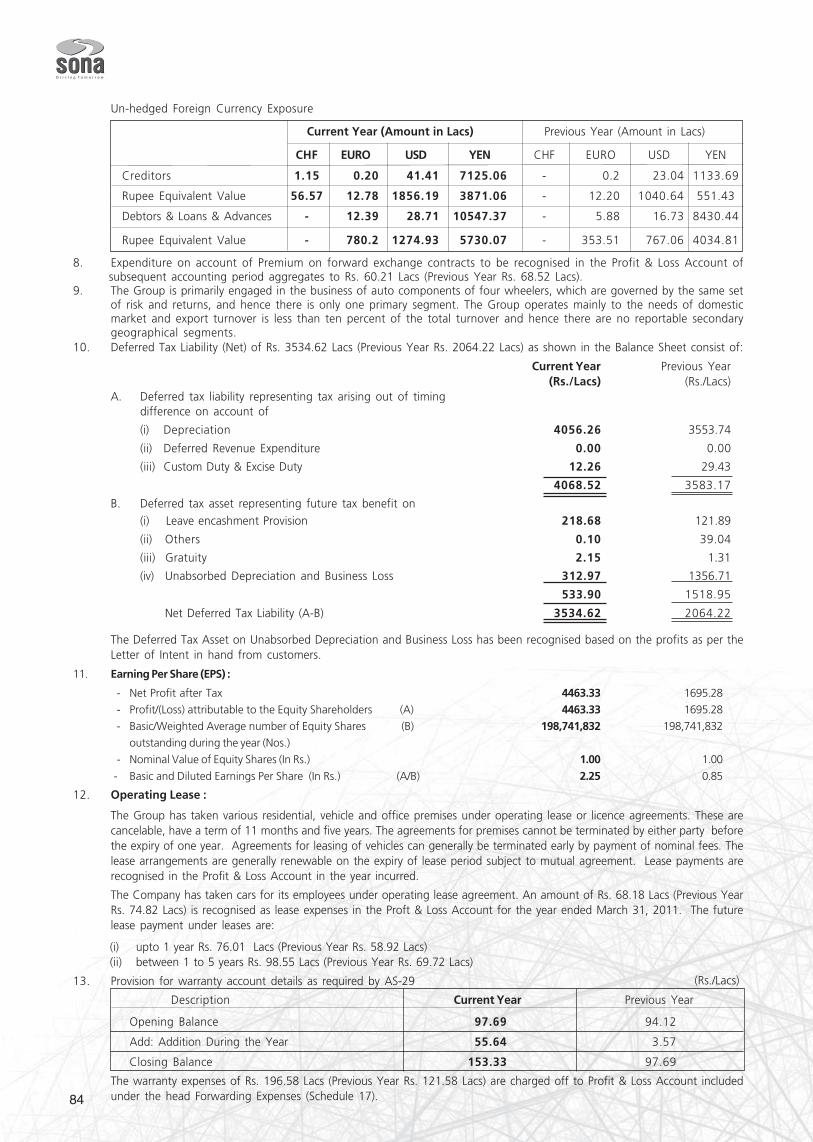
84
Un-hedged Foreign Currency Exposure
Current Year (Amount in Lacs) Previous Year (Amount in Lacs)
CHF EURO USD YEN CHF EURO USD YEN
Creditors 1.15 0.20 41.41 7125.06 - 0.2 23.04 1133.69
Rupee Equivalent Value 56.57 12.78 1856.19 3871.06 - 12.20 1040.64 551.43
Debtors & Loans & Advances - 12.39 28.71 10547.37 - 5.88 16.73 8430.44
Rupee Equivalent Value - 780.2 1274.93 5730.07 - 353.51 767.06 4034.81
8. Expenditure on account of Premium on forward exchange contracts to be recognised in the Profit & Loss Account ofsubsequent accounting period aggregates to Rs. 60.21 Lacs (Previous Year Rs. 68.52 Lacs).
9. The Group is primarily engaged in the business of auto components of four wheelers, which are governed by the same setof risk and returns, and hence there is only one primary segment. The Group operates mainly to the needs of domesticmarket and export turnover is less than ten percent of the total turnover and hence there are no reportable secondarygeographical segments.
10. Deferred Tax Liability (Net) of Rs. 3534.62 Lacs (Previous Year Rs. 2064.22 Lacs) as shown in the Balance Sheet consist of:
Current Year Previous Year(Rs./Lacs) (Rs./Lacs)
A. Deferred tax liability representing tax arising out of timingdifference on account of
(i) Depreciation 4056.26 3553.74
(ii) Deferred Revenue Expenditure 0.00 0.00
(iii) Custom Duty & Excise Duty 12.26 29.43
4068.52 3583.17
B. Deferred tax asset representing future tax benefit on(i) Leave encashment Provision 218.68 121.89
(ii) Others 0.10 39.04
(iii) Gratuity 2.15 1.31
(iv) Unabsorbed Depreciation and Business Loss 312.97 1356.71
533.90 1518.95
Net Deferred Tax Liability (A-B) 3534.62 2064.22
The Deferred Tax Asset on Unabsorbed Depreciation and Business Loss has been recognised based on the profits as per theLetter of Intent in hand from customers.
11. Earning Per Share (EPS) :
- Net Profit after Tax 4463.33 1695.28
- Profit/(Loss) attributable to the Equity Shareholders (A) 4463.33 1695.28
- Basic/Weighted Average number of Equity Shares ( (B)No 198,741,832 198,741,832
outstanding during the year (Nos.)
- Nominal Value of Equity Shares (In Rs.) 1.00 1.00
- Basic and Diluted Earnings Per Share (In Rs.) (A/B) 2.25 0.85
12. Operating Lease :
The Group has taken various residential, vehicle and office premises under operating lease or licence agreements. These arecancelable, have a term of 11 months and five years. The agreements for premises cannot be terminated by either party beforethe expiry of one year. Agreements for leasing of vehicles can generally be terminated early by payment of nominal fees. Thelease arrangements are generally renewable on the expiry of lease period subject to mutual agreement. Lease payments arerecognised in the Profit & Loss Account in the year incurred.
The Company has taken cars for its employees under operating lease agreement. An amount of Rs. 68.18 Lacs (Previous YearRs. 74.82 Lacs) is recognised as lease expenses in the Proft & Loss Account for the year ended March 31, 2011. The futurelease payment under leases are:
(i) upto 1 year Rs. 76.01 Lacs (Previous Year Rs. 58.92 Lacs)(ii) between 1 to 5 years Rs. 98.55 Lacs (Previous Year Rs. 69.72 Lacs)
13. Provision for warranty account details as required by AS-29
Description Current Year Previous Year
Opening Balance 97.69 94.12
Add: Addition During the Year 55.64 3.57
Closing Balance 153.33 97.69
The warranty expenses of Rs. 196.58 Lacs (Previous Year Rs. 121.58 Lacs) are charged off to Profit & Loss Account includedunder the head Forwarding Expenses (Schedule 17).
(Rs./Lacs)
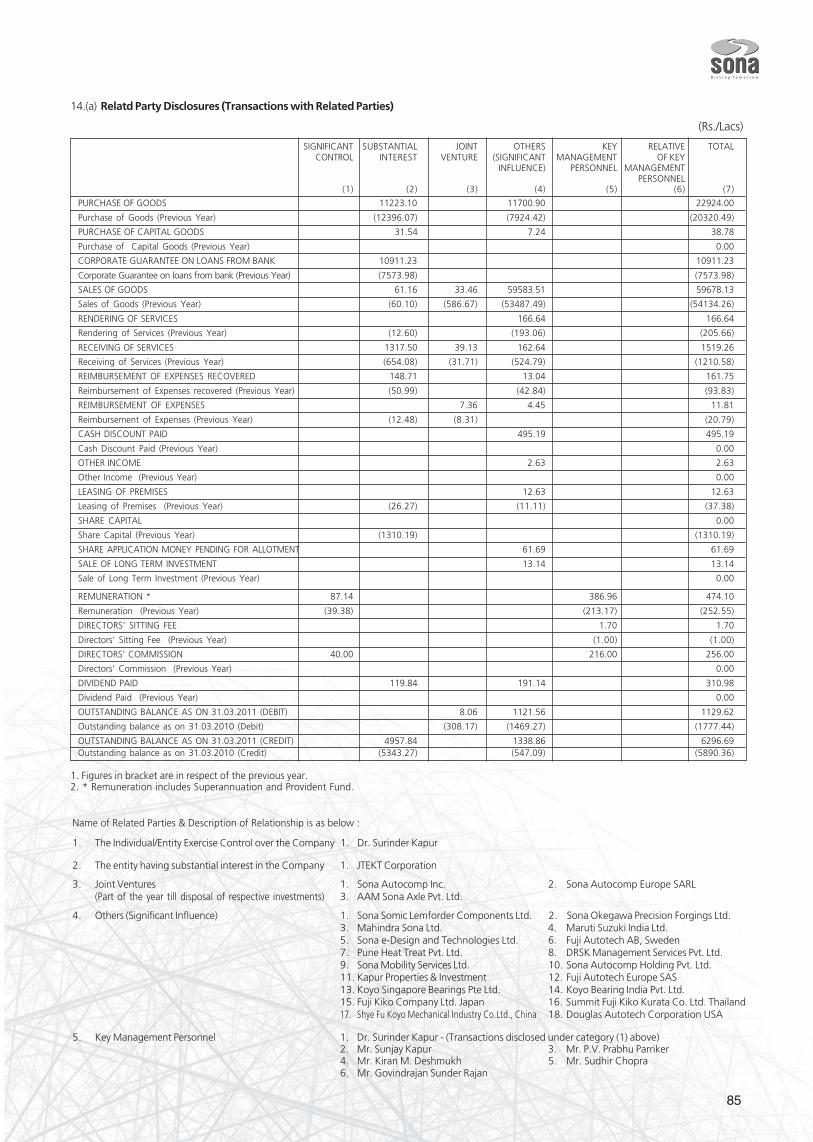
85
14.(a) Relatd Party Disclosures (Transactions with Related Parties)
SIGNIFICANT SUBSTANTIAL JOINT OTHERS KEY RELATIVE TOTALCONTROL INTEREST VENTURE (SIGNIFICANT MANAGEMENT OF KEY
INFLUENCE) PERSONNEL MANAGEMENTPERSONNEL
(1) (2) (3) (4) (5) (6) (7)
PURCHASE OF GOODS 11223.10 11700.90 22924.00
Purchase of Goods (Previous Year) (12396.07) (7924.42) (20320.49)
PURCHASE OF CAPITAL GOODS 31.54 7.24 38.78
Purchase of Capital Goods (Previous Year) 0.00
CORPORATE GUARANTEE ON LOANS FROM BANK 10911.23 10911.23
Corporate Guarantee on loans from bank (Previous Year) (7573.98) (7573.98)
SALES OF GOODS 61.16 33.46 59583.51 59678.13
Sales of Goods (Previous Year) (60.10) (586.67) (53487.49) (54134.26)
RENDERING OF SERVICES 166.64 166.64
Rendering of Services (Previous Year) (12.60) (193.06) (205.66)
RECEIVING OF SERVICES 1317.50 39.13 162.64 1519.26
Receiving of Services (Previous Year) (654.08) (31.71) (524.79) (1210.58)
REIMBURSEMENT OF EXPENSES RECOVERED 148.71 13.04 161.75
Reimbursement of Expenses recovered (Previous Year) (50.99) (42.84) (93.83)
REIMBURSEMENT OF EXPENSES 7.36 4.45 11.81
Reimbursement of Expenses (Previous Year) (12.48) (8.31) (20.79)
CASH DISCOUNT PAID 495.19 495.19
Cash Discount Paid (Previous Year) 0.00
OTHER INCOME 2.63 2.63
Other Income (Previous Year) 0.00
LEASING OF PREMISES 12.63 12.63
Leasing of Premises (Previous Year) (26.27) (11.11) (37.38)
SHARE CAPITAL 0.00
Share Capital (Previous Year) (1310.19) (1310.19)
SHARE APPLICATION MONEY PENDING FOR ALLOTMENT 61.69 61.69
SALE OF LONG TERM INVESTMENT 13.14 13.14
Sale of Long Term Investment (Previous Year) 0.00
REMUNERATION * 87.14 386.96 474.10
Remuneration (Previous Year) (39.38) (213.17) (252.55)
DIRECTORS’ SITTING FEE 1.70 1.70
Directors’ Sitting Fee (Previous Year) (1.00) (1.00)
DIRECTORS’ COMMISSION 40.00 216.00 256.00
Directors’ Commission (Previous Year) 0.00
DIVIDEND PAID 119.84 191.14 310.98
Dividend Paid (Previous Year) 0.00
OUTSTANDING BALANCE AS ON 31.03.2011 (DEBIT) 8.06 1121.56 1129.62
Outstanding balance as on 31.03.2010 (Debit) (308.17) (1469.27) (1777.44)
OUTSTANDING BALANCE AS ON 31.03.2011 (CREDIT) 4957.84 1338.86 6296.69Outstanding balance as on 31.03.2010 (Credit) (5343.27) (547.09) (5890.36)
1. Figures in bracket are in respect of the previous year.2. * Remuneration includes Superannuation and Provident Fund.
(Rs./Lacs)
Name of Related Parties & Description of Relationship is as below :
1. The Individual/Entity Exercise Control over the Company 1. Dr. Surinder Kapur
2. The entity having substantial interest in the Company 1. JTEKT Corporation
3. Joint Ventures 1. Sona Autocomp Inc. 2. Sona Autocomp Europe SARL(Part of the year till disposal of respective investments) 3. AAM Sona Axle Pvt. Ltd.
4. Others (Significant Influence) 1. Sona Somic Lemforder Components Ltd. 2. Sona Okegawa Precision Forgings Ltd.3. Mahindra Sona Ltd. 4. Maruti Suzuki India Ltd.5. Sona e-Design and Technologies Ltd. 6. Fuji Autotech AB, Sweden7. Pune Heat Treat Pvt. Ltd. 8. DRSK Management Services Pvt. Ltd.9. Sona Mobility Services Ltd. 10. Sona Autocomp Holding Pvt. Ltd.11. Kapur Properties & Investment 12. Fuji Autotech Europe SAS13. Koyo Singapore Bearings Pte Ltd. 14. Koyo Bearing India Pvt. Ltd.15. Fuji Kiko Company Ltd. Japan 16. Summit Fuji Kiko Kurata Co. Ltd. Thailand17. Shye Fu Koyo Mechanical Industry Co.Ltd., China 18. Douglas Autotech Corporation USA
5. Key Management Personnel 1. Dr. Surinder Kapur - (Transactions disclosed under category (1) above)2. Mr. Sunjay Kapur 3. Mr. P.V. Prabhu Parriker4. Mr. Kiran M. Deshmukh 5. Mr. Sudhir Chopra6. Mr. Govindrajan Sunder Rajan
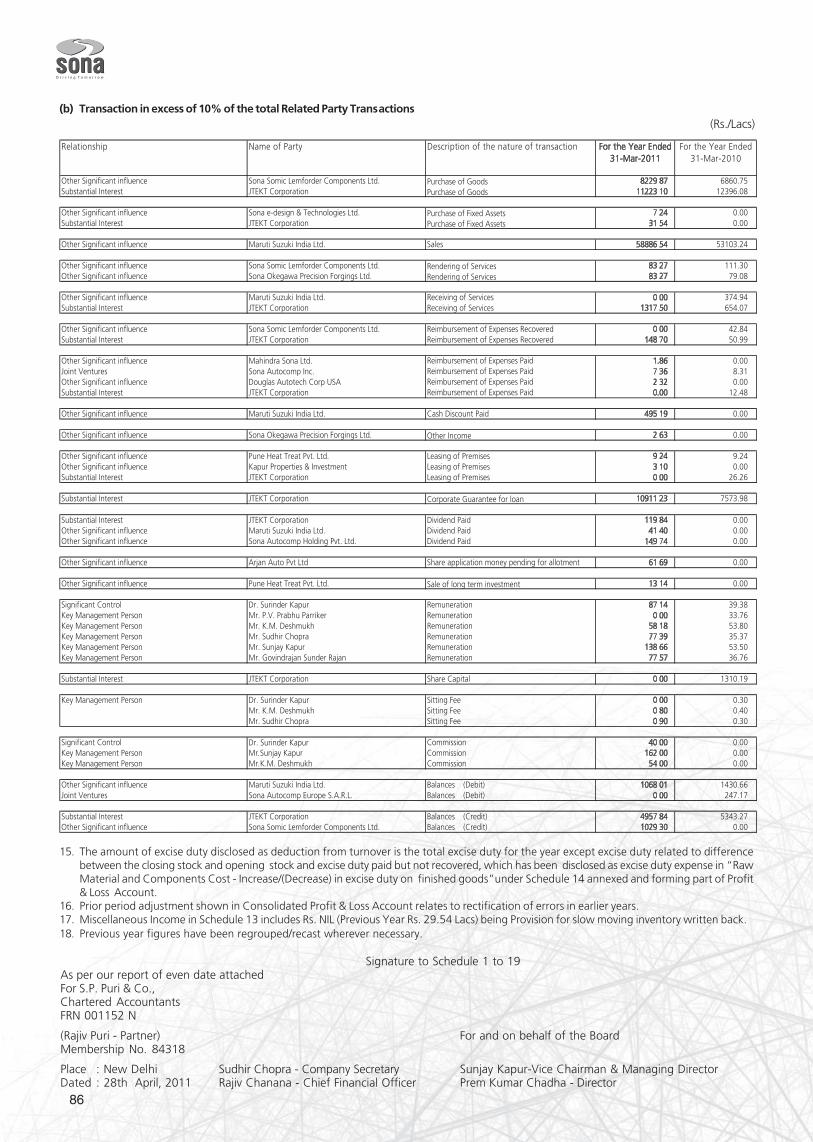
86
(b) Transaction in excess of 10% of the total Related Party Transactions
15. The amount of excise duty disclosed as deduction from turnover is the total excise duty for the year except excise duty related to differencebetween the closing stock and opening stock and excise duty paid but not recovered, which has been disclosed as excise duty expense in “RawMaterial and Components Cost - Increase/(Decrease) in excise duty on finished goods”under Schedule 14 annexed and forming part of Profit& Loss Account.
16. Prior period adjustment shown in Consolidated Profit & Loss Account relates to rectification of errors in earlier years.17. Miscellaneous Income in Schedule 13 includes Rs. NIL (Previous Year Rs. 29.54 Lacs) being Provision for slow moving inventory written back.18. Previous year figures have been regrouped/recast wherever necessary.
Signature to Schedule 1 to 19As per our report of even date attachedFor S.P. Puri & Co.,Chartered AccountantsFRN 001152 N
(Rajiv Puri - Partner) For and on behalf of the BoardMembership No. 84318
Place : New Delhi Sudhir Chopra - Company Secretary Sunjay Kapur-Vice Chairman & Managing DirectorDated : 28th April, 2011 Rajiv Chanana - Chief Financial Officer Prem Kumar Chadha - Director
(Rs./Lacs)
87
CONSOLIDATED CASH FLOW STATEMENT
Year Ended Year ended31st March, 2011 31st March, 2010
Rs./Lacs Rs./Lacs
A. CASH FLOW FROM OPERATING ACTIVITIES :Net Profit before tax and Minority Interest 7365.31 2540.25Adjustment for :Depreciation 3773.73 2845.30(Profit)/Loss on sale of Fixed Assets 21.88 23.85(Profit)/Loss on sale of Long Term Investments (579.34) 0.00Dividend from Long Term Investment-Trade (7.00) (7.00)Provision for Doubtful Debts Written Back (19.61) 0.00Bad Debts/Advances Written off 19.61 19.61Provision for Slow Moving Inventory 0.00 (29.54)(Gain)/Loss on Revaluation of Foreign Currency Term Loans 0.00 (304.86)Minority Interest 0.00 7.26Interest Expense 3347.10 2670.05Interest Income (24.37) 6532.00 (67.39) 5157.28Operating Profit before Working Capital Changes 13897.31 7697.53(Increase)/Decrease in Sundry Debtors (7194.11) (1376.01)
(Increase)/Decrease in Inventories (2434.84) (2066.75)(Increase)/Decrease in Loans & Advances/Other Current Assets (2385.79) 2411.40Increase/(Decrease) in Current Liabilities & Provisions 7191.14 (4823.60) (2644.36) (3675.72)
Cash generated from operations 9073.71 4021.81Income Tax Paid (952.72) (82.19)
Net Cash from operating activities 8120.99 3939.62
B. CASH FLOW FROM INVESTING ACTIVITIES:Purchase of Fixed Assets (including CWIP) (7141.20) (6495.21)Proceeds from Sale of Fixed Assets 858.03 42.56Proceeds from Sale of Long term Investments 874.78 0.00Dividend Received 7.00 7.00Interest Received 24.37 67.39Net cash (used)/raised from investing activities (5377.02) (6378.26)
C . CASH FLOW FROM FINANCING ACTIVITIES:Share Application Money Received 0.00 (58.80)Proceeds From Fresh Borrowings 5962.81 16560.31Repayment of Borrowings (4053.37) (11169.98)Interest Paid (3320.83) (2681.36)Dividend Paid (596.23) 0.00Tax on Dividend Paid (99.03) 0.00
Net Cash used in financing activities (2106.65) 2650.17
Net increase in cash & cash equivalents (A+B+C) 637.32 211.53
Cash & Cash Equivalents as at 31.03.2010Cash & Bank Balances 587.72 587.72 376.19 376.19Cash & Cash Equivalents as at 31.03.2011Cash & Bank Balances 1225.04 1225.04 587.72 587.72
NOTES TO THE CASH FLOW STATEMENT :
1. The above Cash Flow Statement has been prepared under the indirect method set out in Accounting Standard 3 “CashFlow Statement”.
2. Figures in brackets indicate cash outflow and without brackets indicate cash inflow.3. Cash and Cash equivalents include unclaimed dividends accounts of Rs.38.99 Lacs (Previous Year Rs.34.20 Lacs) which
are not available for use by the Company.
As per our report of even date attachedFor S.P. Puri & Co.,Chartered AccountantsFRN 001152 N
(Rajiv Puri - Partner) For and on behalf of the BoardMembership No. 84318
Place : New Delhi Sudhir Chopra - Company Secretary Sunjay Kapur-Vice Chairman & Managing DirectorDated : 28th April, 2011 Rajiv Chanana - Chief Financial Officer Prem Kumar Chadha - Director
Sona Koyo Steering Systems Ltd.
UGF-6, Indraprakash21, Barakhamba Road,New Delhi 110 001 INDIAPh. 91 (11) 2331 1924, 2332 7205
www.sonagroup.com