Embed Size (px)
Citation preview

„Something, that is allegedly secure is not necessarily secure,
Something, that is allegedly known might turn out to be unknown. Appearance can be deceptive,
our senses can deceive us.Even though experience and knowledge
can limit errors,reality also limits those.“
Author: unknown
Inspired by Berthold Brecht

16 members 10 PHD students + Master and Bachelor students


Spain
France
Germany
Barcelona
Düsseldorf


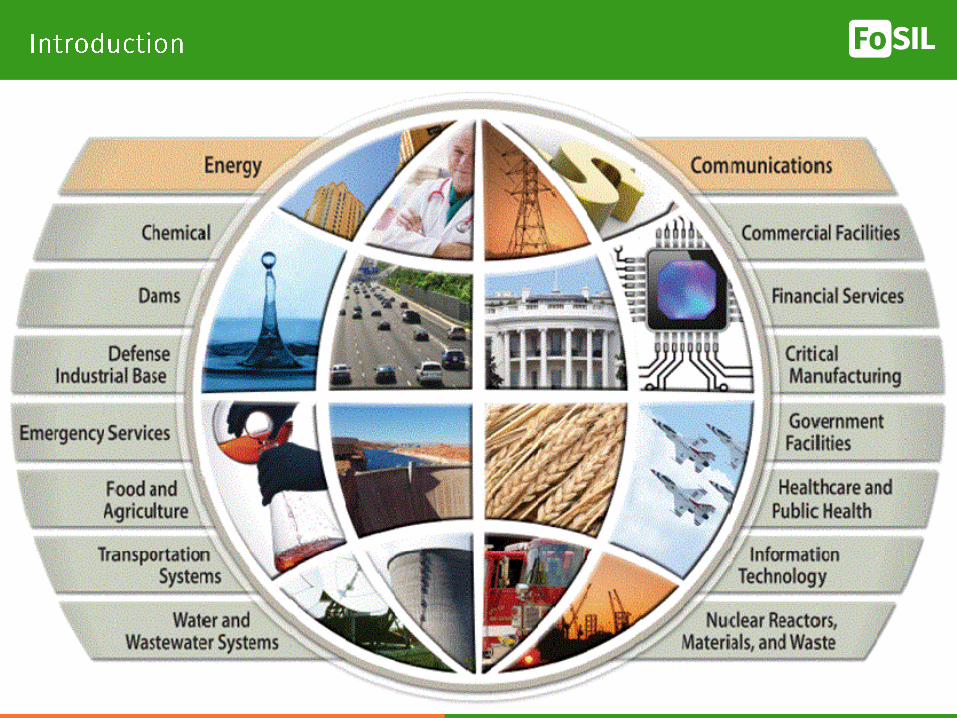
What does security meanin this context?
Security means protection of humansor things from humans.

What does crime mean in this context?
Violating the right of physical and psychological integrity and sacredness
of property.

Can we model security by simulating crime?
P(Security) = 1- P(Crime)Is security the absence of crime?

Levels of Security
International security interests• Terror• Civil war• Plane hijacking
National security interests• Extremism• Amok• Organized crime
Regional security interests• Burglary series
Personal security interests• Burglary

Law and Order
Aspects of Security
technical securitylegal security
perceived security
residents, neighbors Urban Structure
Actors
Right to physical integrityInviolability of the home
data protection


Top-Down - Approach
Approaches for security from the system theoryMethods in information gathering
Top‐down (deductive)
• Creating experimental data
• Analysis of data and formulation of
hypotheses (iterative)
• Validate hypotheses by means of
experiments (iterative)
• Goal: Identification and characterization of
new mechanisms leading to a better
understanding of the complex relations in a
„populated urban structure“
• Integration in the resilience process
Top-down(deductive)
Measurement of overall condition
Modeling
Data analysis and integration
Network analysis

Top-Down - Approach
A Simulation is an approach used for the analysis of systems which are too complex to be analyzed theoretically or with formulas. This is mostly the case for dynamic system behavior. In a simulation, experiments are performed with a model in order to gain knowledge about the real system.
• Discovering of network structures on different levels
• Gathering of the temporal and spatial dynamic of „cellular/system“ components using different (environmental) conditions
• Development of detailed mathematical models
• Visualization of networks and the processes taking place within those networks
-> Understanding of the processes as a whole

Multi-Agent-Systems
Cellular automata and multi-agent systems can be used for the simulation of the dynamic of spatial processes.
urban system
Layer for mobile agents
Local fixed objects
Multi Agent System (MAS)
CircularCoupledSystem
Cellular Automaton

Cellular automata model spatial elements such as streets, parcels of land, and buildings. Those are treated as locally fixed objects, whose state can change at a certain point in time. In a first step, these elements are transferred to a cell of a regular grid and saved as the status of this cell.
Cellular automata
urban system
Layer for mobile agents
Local fixed objects
Multi Agent System (MAS)
CircularCoupledSystem
Cellular Automaton

Multi-Agent-Systems (MAS)
A second level includes the individual and collective urban actors, which will be called agents. In comparison to the cells, agents are mobile and can move freely through the cell grid, the cellular room. It is possible to define different types of communication between the agents and between the agents and the cell.
urban system
Layer for mobile agents
Local fixed objects
Multi Agent System (MAS)
CircularCoupledSystem
Cellular Automaton

FACS (Free Agents in a Cellular Space)
Model of an urban system. The system is separated in different levels, which are represented either by the cells of a CA or the agents of the MAS.
urban system
Layer for mobile agents
Local fixed objects
Multi Agent System (MAS)
CircularCoupledSystem
Cellular Automaton

Ideas for Implementation
P(Security) = 1- P(crime)

Cellular Automata Graph Automata
• Interaction with neighboring cells in a fixed grid
• Neighborly relations have to bedetermined at the beginning
• Neighbor geometry can be flexibly modified
• Neighborly relations can change at any time
Definition of neighbors by means
of a graph
Automata

Models of dispersal
Near-repeat pattern analysis
Question:
When a criminal event takes place, how does the risk develop in the surrounding area?
→ Repeated attacks at the same or nearby places
𝑃 𝐴|𝑥, 𝑡 → 𝑃(𝐵|𝑥 + ∆𝑥, 𝑡 + ∆𝑡)What influence does an assault A at the place x at the time t have at
a later point in time t + ∆𝑡 and a nearby place x + ∆𝑥.
Relations for time and space can be derived from statistics.

BigData – Predictive Policing
First „statistic of criminal activity“ – people mark crimes on a map. Basic idea – divide in quadrants (grid)

BigData – Predictive Policing
Number of criminal offences and their „circumstances“

Ausbreitungsmodelle
Near-repeat pattern analysis
Near-Repeat Patterns in Philadelphia Shootings. Jerry H. Ratcliffe and George F. Rengert, Security Journal 2008.

Cyclic-load forecastingQuestion:
Are there certain days in the year, certain days of the week orcertain times in the day in which more criminal incidents areto be expected?
𝑷 𝑬𝒗𝒆𝒏𝒕|𝑃𝑜𝑖𝑛𝑡 𝑖𝑛 𝑡𝑖𝑚𝑒 = 𝑃 𝑬𝒗𝒆𝒏𝒕|𝑀𝑜𝑛𝑡ℎ+ 𝑃 𝑬𝒗𝒆𝒏𝒕|𝐷𝑎𝑦 + 𝑃 𝑬𝒗𝒆𝒏𝒕|𝐷𝑎𝑦 𝑜𝑓 𝑡ℎ𝑒 𝑤𝑒𝑒𝑘+ 𝑃 𝑬𝒗𝒆𝒏𝒕|𝑇𝑖𝑚𝑒 𝑜𝑓 𝑑𝑎𝑦 + …

Result

Graphen Automaten

Securit of a house in an urban structure with a well defined crime rate

Simulation Grid

Simulation Urban Structure

Modelling patterns of burglary on streetnetworks
Primal Representation Modell [Porta et al. 2006]
• Graph G=(V,E)• Intersections of streets are nodes V• Enclosed segments of streets are the
edges E
Betweenness Centrality

Modelling patterns of burglary on streetnetworks
model
risk -> static and dynamic components
The risk of a burglary happening at a certain point in time on a specific stretch of road shall be determined -> the risk passes from segments with a high risk to segments with a lower risk
Activity of pedestrians (in a wider sense) is a function of betweenness centrality (function-> non-linear behavior)
Probability of a criminal offence -> probability within a given period of time, determined by the means of the initial attractiveness including a number of decisions by the offender
Di constant for activities, which cannot be explicitly captured
Growth of crime diffussion from link to link
Breakdown
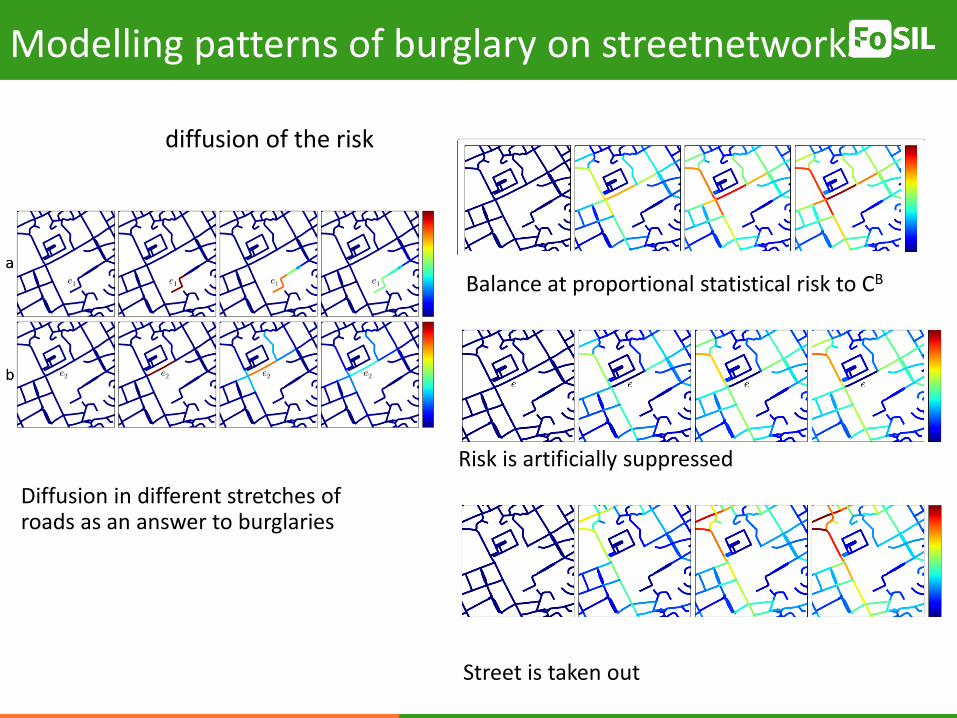
Modelling patterns of burglary on streetnetworks
diffusion of the risk
Diffusion in different stretches of roads as an answer to burglaries
Risk is artificially suppressed
Street is taken out
Balance at proportional statistical risk to CB

Modelling patterns of burglary on streetnetworks
Results and future work
• Mathematical network model for the simulation of the spread of crime
• Non-linear effects show the significance -> targeted Policing• Requirement is the presence of relations between network
characteristics and crime rates• Even though an empiric basis was developed, there have been
no analyses with the presented metrics• Next steps:
• Creating a model showing the consequences of the predictions made for the organization of police operations
• statistical analyses• Influence of the network configuration on the phenomenon
of the near-repeat victimization• Implementation in practical police work

This is what defines us…. Our Identity
Real World Cyber World
Separation?
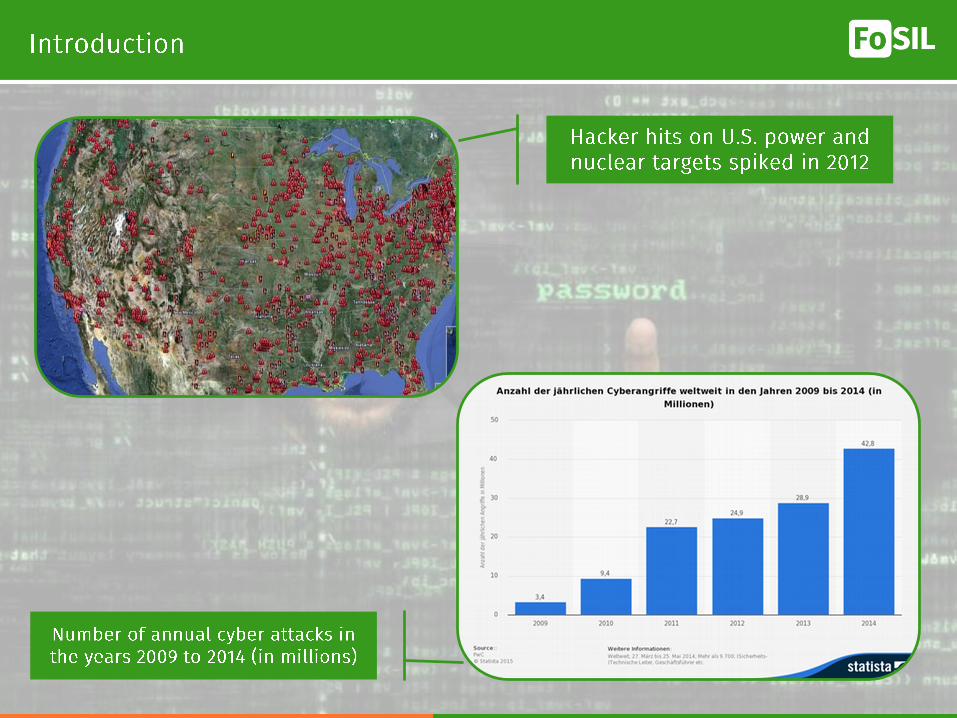

2013: using a hacked account of the US news agency AP, hacker spread the news that of an explosion in the White House within minutes the Dow Jones looses about 1 %
2012: within 45 minutes the publically traded company Knight Capital losses US$ 440 Million because of a flawed computer software (Malware) Shares loose 75 % of their value

Communication and content have changed due to the digitalization.
Digital identity and real identity
Modern communication

Modern communication and crime
Modern ways of communication is not only used in order to perform criminal acts, yet especially to plan criminal activities.
Consideration of digital communication for the modeling and simulation of criminal offences.
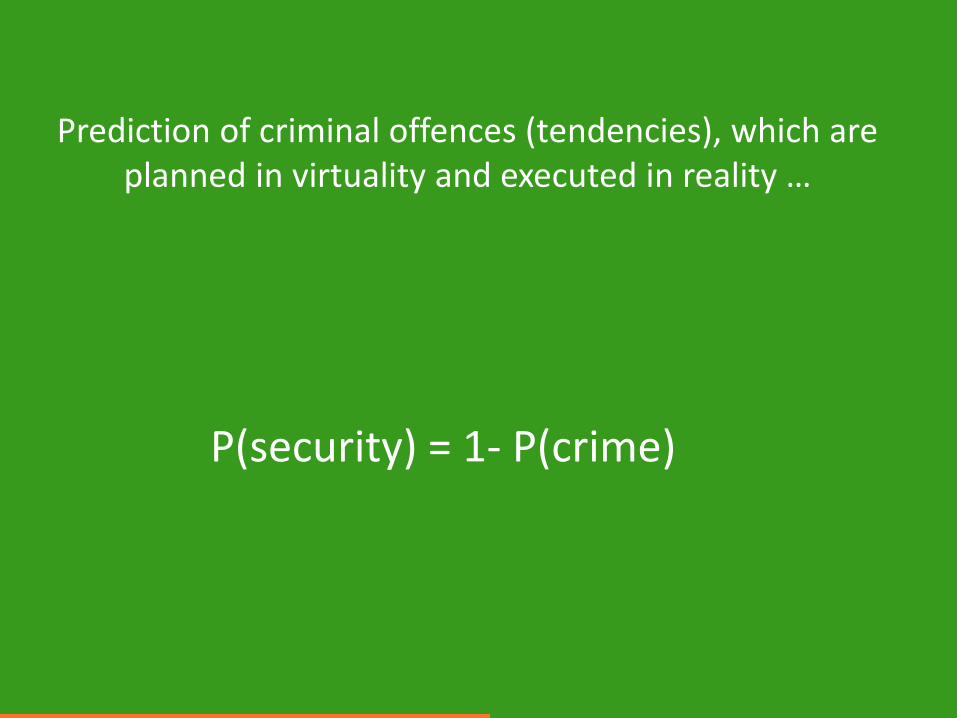
Prediction of criminal offences (tendencies), which are planned in virtuality and executed in reality …
P(security) = 1- P(crime)

Crime scene hypotheses cycle
information

Human Individual Digital Footprint (HIDF) Network
• Communication • Information transfer • Feelings• Emotions• Sentiments• Statements• ….
• Analyses• Validation • Evaluation
HIDF in groups, sub-groups

Human Individual Digital Footprint (HIDF) Network

An ontology is a specification of a conceptualization.
Definition of syntax of terms and symbols in a network of associations
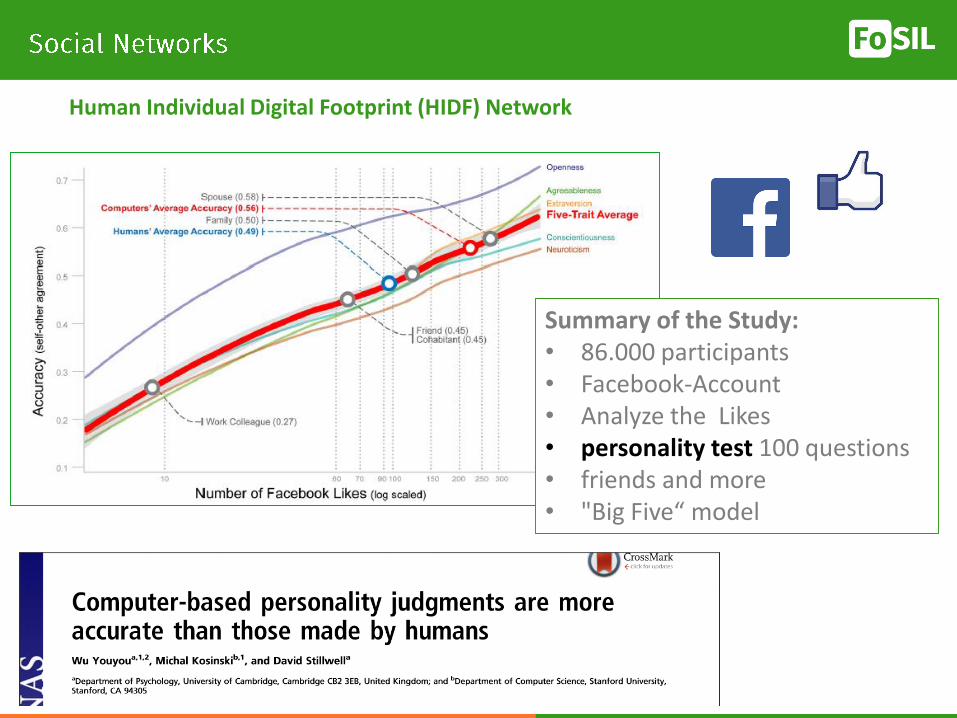
Human Individual Digital Footprint (HIDF) Network
Summary of the Study:• 86.000 participants • Facebook-Account • Analyze the Likes • personality test 100 questions • friends and more • "Big Five“ model
Social networks -Sentiment analyses of groups in social networksand

Sentiment Detection:• sub-area of text mining• automatic analysis of texts with the aim of
identifying an expressed attitude aspositive or negative
trend analysis
Statistical analysis starts from a basic set of concepts (or n-grams), which is associated positive or negative sentiments.• Occurrences of positive or negative sentiments • Comparison • Designation of trends, opinions Statements
Inside the Web --- feelings, beliefs and personal opinions!

• Asylindustrie – alysum industry • Lügenpresse – lies press• Volksverräter – public traitor• Der Untergang des Abendlandes• „the decline of the West”• Islamisierung … Islamic
“Slogan”
Generation of person landscapes from Facebook
PEGIDA – Patriotische Europäer gegen die Islamisierung des Abendlandes(Patriotic Europeans Against the Islamisation of the West)

PEGIDA – Patriotische Europäer gegen die Islamisierung des Abendlandes(Patriotic Europeans Against the Islamisation of the West)
A political movement
• far-right, conservative, nationalist• anti-Islam
• formed in October 2014• present in Saxony region of Germany, many offshoots exist(ed) in other
German cities and countries
Causes for the group’s sudden uprising and gain in popularity:• Nationalist anti-EU movements had grown to significant sizes in entire
Europe in 2014• refugee crisis• Acts of Islamist terrorism and violence in EuropeIncrease of Islamophobia

https://www.facebook.com/pages/PEGIDA/790669100971515
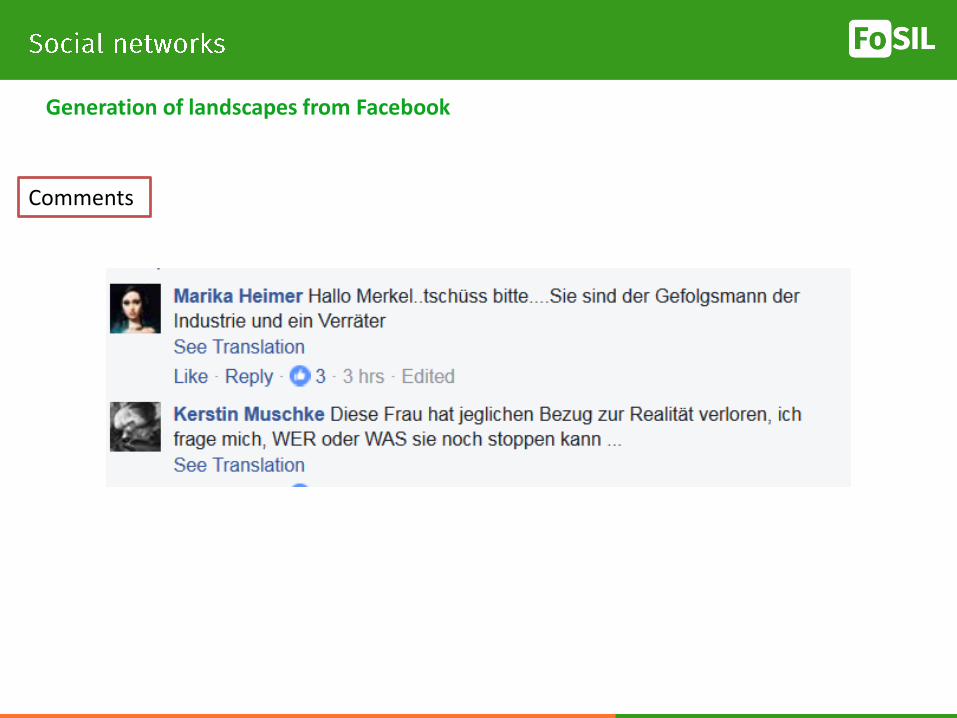
Comments
Generation of landscapes from Facebook

Information exchange via FB
Graph APIapplicationprogramminginterface
Generation of person landscapes from Facebook
Comments
Generation of landscapes from Facebook
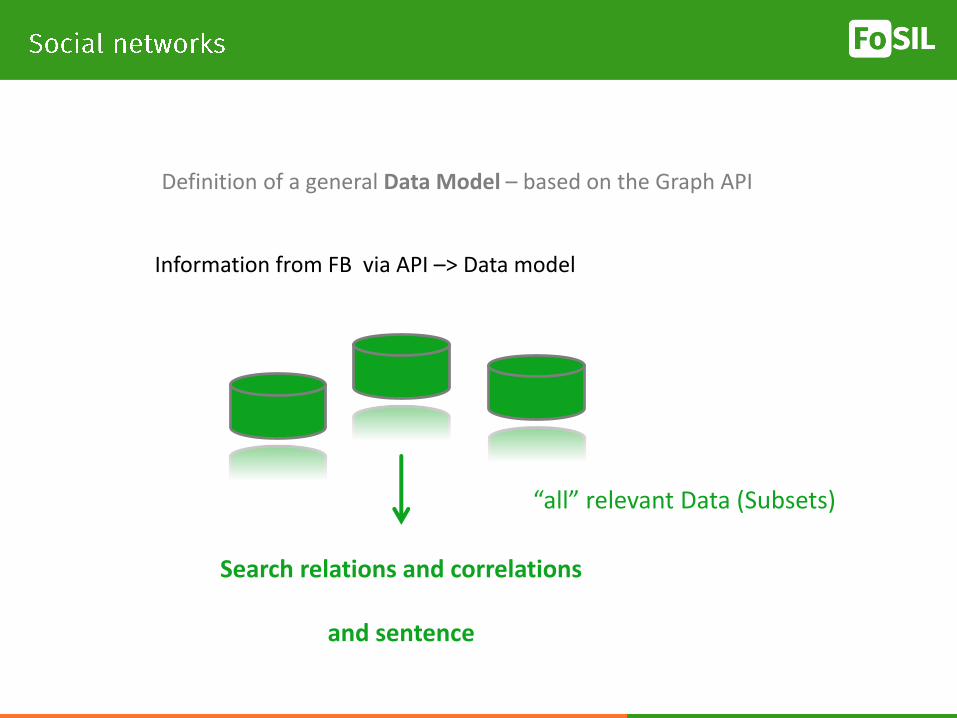
Definition of a general Data Model – based on the Graph API
Information from FB via API –> Data model
“all” relevant Data (Subsets)
Search relations and correlations
and sentence


Participants FB_ID user profiles
• User activities• Topics• Subgroups
• User-specific content• Sentiments of the network

All information are labeled by time and user!
Time and geographical Monitoring
Sentiment AnalyzeAnalyze der opinion in der Groupa. positiveb. negativec. neutral

Opinions and moods (Sentences)
0
5
10
15
20
25
30
35
40
45
0
1000
2000
3000
4000
5000
6000
Negative Comment Sentences
Negative Post Sentences
hot phase

Digitized traces - geographical Monitoring
Digital traces
Digitized traces - geographical Monitoring
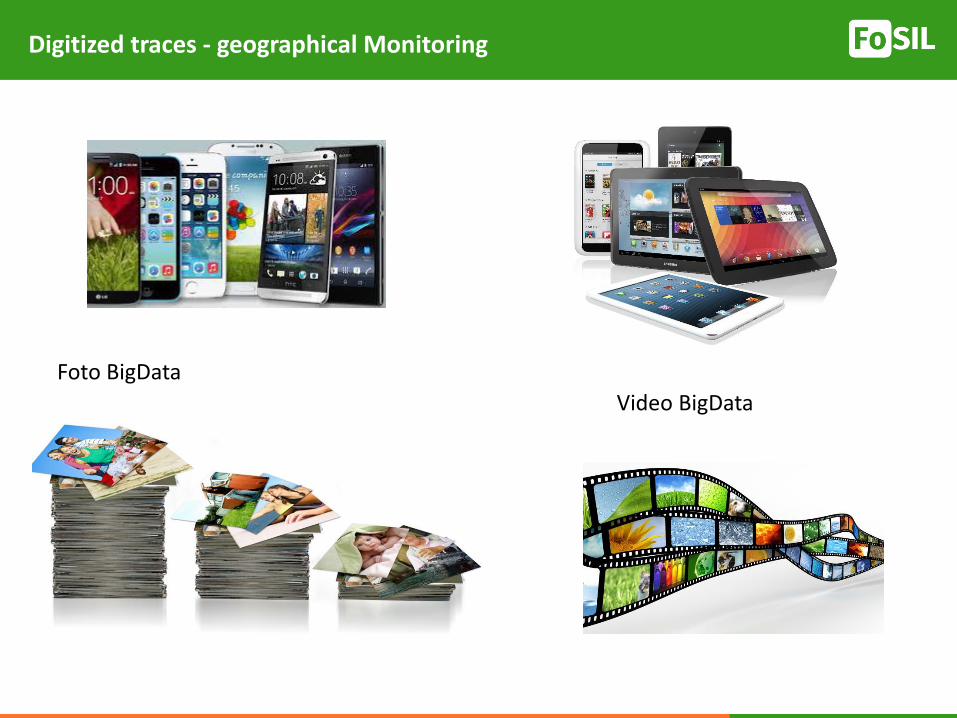
Foto BigData
Video BigData

What makes pictures and videos from the perspective ofForensics so interesting?
Database forensics Mobile device forensics Forensic video Forensic audio
• Manipulation of pictures• artificial generation of Pictures• class of devices (digital camera, scanner, etc.)
Content Meta-data
Digitized traces - geographical Monitoring

Pictures – Fotos - Content
EXIF Metadata (TIFF or JPEG)
camera- und shooting-related data:• Aperture• Time• Place• Camera type etc.
Geo-location data

amous
Digitized traces - geographical Monitoring

Digitized traces - geographical Monitoring
facial proportions
Euclidean distance to the pairwise distances of faces j and k

All information are labeled by time, locations and user!
Sentiment Analyze+
Posible geo-information
Content Meta-dataUser-list

Digital traces
Prediction
Digital traces
Digital traces
Digital traces
Digital traces
Digitized traces
Digitized traces
Digitized traces
Digitized traces
Digitized traces
BigData – Predictive Policing

Questions
Is it possible to identifythreat hot-spots ?
Can we predict the long-term development
of groups that pose a threat ?
Can we support long-term resource andstrategy planning ?

BigData – Predictive Policing
Number of crimes and their "conditions"

• Extraction of profiles for monitoring• Extraction of post or comment content
relating to the threat ontology and a sentiment analysis
enables short-term reaction• Simulation of temporal development of
groups and hot-spots enables long-term resource and strategic planning• Increasing resilience

Opinions and moods (Sentences)
0
5
10
15
20
25
30
35
40
45
0
1000
2000
3000
4000
5000
6000
Negative Comment Sentences
Negative Post Sentences
rights rioters in Leipzig-Connewitz
hot phase

• comprised by a set of independent statistical testing units• the role of each unit is to test the degree of change between
sentiment statistics obtained for two points in time
statistical testing units
„energy agents“

Sentiment analyses of user comments made on officials PEGIDA’s facebook page per day ‘temper’ tracking
The networking energy is the sum of all unit energy values Representation of ‘network awareness’

• an energy value is assigned to each unit
• for each observation (sentiment and comment frequencies), it is decided whether a given unit conducts a statistical test on the new data depending on its energy value
• in the test, the new data is compared to the data the unit processed during the last test! the network memorizes the data and underlying dynamics!

Sentiment analyses of user comments made on officials PEGIDA’s facebook page per day ‘temper’ tracking
The networking energy is the sum of all unit energy values Representation of ‘network awareness’
Are energy peaks correlated to major criminal incidents with anti-Islam and anti-refugee background?

Sentiment analyses of user comments made on officials PEGIDA’s facebook page per day ‘temper’ tracking
The networking energy is the sum of all unit energy values Representation of ‘network awareness’
Possible events

Are energy peaks correlated to major criminal incidents with anti-Islam and anti-refugee background?
Answer …… next time