Embed Size (px)
Citation preview
Proceedings of 82nd The IIER International Conference, Berlin, Germany, 3rd-4th October 2016, ISBN: 978-93-82702-15-3
14
SOME PRINCIPLES OF FLOW VISUALIZATION TECHNIQUES IN WIND TUNNELS
YE HTUN, ZAY YAR MYO MYINT
Moscow Institute of Physics and Technology (State University), Russia
E-mail: [email protected] Abstract— Nowadays, there are various ways to study gas and fluid flows in wind tunnels and are still an important field of scientific research. The objectives of the research intended to present the basic principle of flow visualization techniques in wind tunnels and to simulate, visualize, observe, and measure how the flow around the object. Keywords— Flow Visualization Technique, Wind Tunnels, Experimental Aerodynamics. I. INTRODUCTION Fluid and gas flows are studying for the development of automobile, aircrafts and spacecrafts, and for the design of machines such as turbines and combustion engines. The liquid flow research is necessary for naval applications, such as ship design construction and it is widely used in civil engineering, chemistry and so on [1]. However, for fluid flow research, the visualization is an important tool in experimental fluid mechanics, which can provide the overall picture of the flow field. Flow visualization has probably existed for as long as fluid flow research [2-7]. Experimental flow visualization techniques are applied for several reasons: to get a picture of fluid flow around a scaled model of a real object, without any calculations; to develop or verify new and better theories of fluid flow or models.
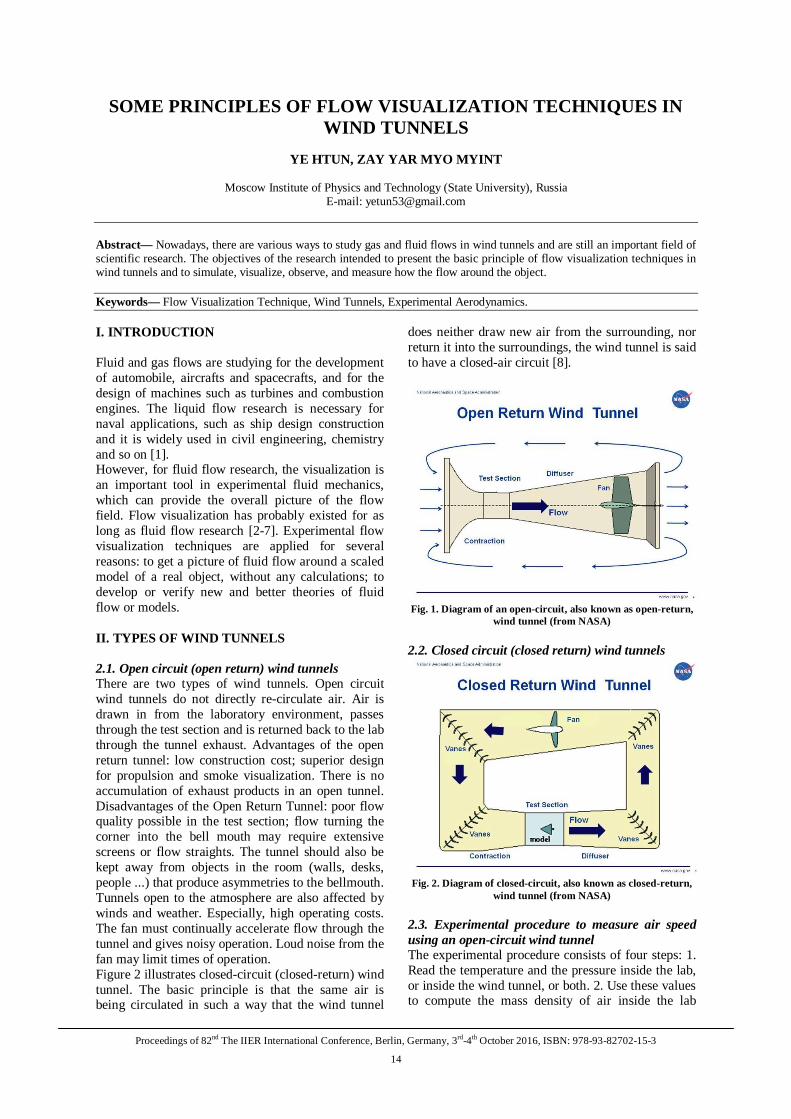
II. TYPES OF WIND TUNNELS 2.1. Open circuit (open return) wind tunnels There are two types of wind tunnels. Open circuit wind tunnels do not directly re-circulate air. Air is drawn in from the laboratory environment, passes through the test section and is returned back to the lab through the tunnel exhaust. Advantages of the open return tunnel: low construction cost; superior design for propulsion and smoke visualization. There is no accumulation of exhaust products in an open tunnel. Disadvantages of the Open Return Tunnel: poor flow quality possible in the test section; flow turning the corner into the bell mouth may require extensive screens or flow straights. The tunnel should also be kept away from objects in the room (walls, desks, people ...) that produce asymmetries to the bellmouth. Tunnels open to the atmosphere are also affected by winds and weather. Especially, high operating costs. The fan must continually accelerate flow through the tunnel and gives noisy operation. Loud noise from the fan may limit times of operation. Figure 2 illustrates closed-circuit (closed-return) wind tunnel. The basic principle is that the same air is being circulated in such a way that the wind tunnel
does neither draw new air from the surrounding, nor return it into the surroundings, the wind tunnel is said to have a closed-air circuit [8].
Fig. 1. Diagram of an open-circuit, also known as open-return,
wind tunnel (from NASA)
2.2. Closed circuit (closed return) wind tunnels
Fig. 2. Diagram of closed-circuit, also known as closed-return,
wind tunnel (from NASA)
2.3. Experimental procedure to measure air speed using an open-circuit wind tunnel The experimental procedure consists of four steps: 1. Read the temperature and the pressure inside the lab, or inside the wind tunnel, or both. 2. Use these values to compute the mass density of air inside the lab

Some Principles of Flow Visualization Techniques in Wind Tunnels
Proceedings of 82nd The IIER International Conference, Berlin, Germany, 3rd-4th October 2016, ISBN: 978-93-82702-15-3
15
using the ideal gas law. 3. Use the wind tunnel to measure the pressure difference, p0- p, at the point of interest. 4. Use the equation described below to compute the speed of the air at that point.
02( )p pV
Fig. 3. A sketch of the open-circuit subsonic wind tunnel equipped with static- and dynamic-pressure taps, a pressure-
sensing electronic device [8].
III. FLOW VISUALIZATION TECHNIQUES Flow visualization is an experimental means of examining the flow patterns around a body or over its surface. Flow visualization may be divided into surface flow visualization and off-the-surface visualization. Surface flow visualization involves tufts, fluorescent dye, oil or special clay mixtures, which are applied to the surface of a model [9].
Fig. 4. Flow visualization [NASA]
The figure shows five flow visualization techniques that are used in wind tunnel testing; smoke, tufts, laser sheet, surface oil flow, and schlieren photography. Tufts and surface oil flow are used to provide information about the state of the boundary layer on the surface, particularly to detect flow separation and re-attachment. Boundary layer separation is a source of drag and the cause of wing stalls. Some engineers try to determine where the external flow is going by studying the flow along the surface. A more accurate way to visualize free stream flow is to use smoke or laser sheets. The assumption is made that the smoke or seed particles for the laser
move exactly with the flow and therefore gives some indication of how the flow moves around the model. The schlieren photographic technique is used for flows with a large change in fluid density. The technique relies on the bending of light rays across density gradients to produce a photographic image that locates the gradients. Wind tunnel engineers use the schlieren system to locate shock waves, which are very thin regions with high density gradients. The system can also be used to study combustion [NASA].
IV. OPTICAL-PHYSICAL METHODS The purposes of the method are: to study the spatial structure and measuring characteristics of the distributed gas flowing around the aircraft model; to learn the process of gas stream interaction with the surface and the measurement of distributions on the surface of the parameters of the aircraft model; to study and measure distribution and motion parameters of the aircraft model, under the action of high-speed air flow [10]. For refractive methods include direct-shadow method, Toepler shadow method, the raster method, interferometric method. These methods use a change in the refractive index when an inhomogeneity in the medium. Direct-shadow method registers the second derivative of the change in refractive index, Toepler method - the first derivative, interferometric methods register the change in the refractive index of the medium itself directly.
Fig. 5. Penetration barriers bullet caliber 7.62 mm [TsAGI]
Tufts method is the oldest method of experimental aerodynamics. It is to that surface of the model are glued in multiple light filament (tuft) which are arranged in the flow velocity vector, and in the detachment zones extend from the surface and oscillate. Using fluorescent tufts can significantly increase their contrast and reduce their size. Such tuft less outraged over the models and visualization using them more reliable. Small length mintufts can also apply them with greater density and thus get a better spatial resolution of flow patterns. Fluorescent tufts contrast is such that they can be used even on unpainted metal pattern. Due to the small diameter fluorescent tufts decreases the effect of centrifugal forces at the position tufts, paving the way to the study of flow around rotating models.

Some Principles of Flow Visualization Techniques in Wind Tunnels
Proceedings of 82nd The IIER International Conference, Berlin, Germany, 3rd-4th October 2016, ISBN: 978-93-82702-15-3
16
Fig. 6. Visualization at subsonic flow [TsAGI]
Fig. 7. The view below shows a wing in a wind tunnel with
flourescent oil on the right wing and mini-tufts on the left wing [11]
At TsAGI led by N.S. Tskhai optical methods for measuring brake temperature, high-temperature gas flows and the surface temperature of heat-shielding materials have been developed (Z.K. Tikstinskaya, M.N. Osin). Optical temperature measurement methods are widely used in mining thermal protection for “Buran” [12]. V. SOME EXPERIMENTAL RESULTS AND DISCUSSIONS
In this paper described the study on the development of optical equipment for imaging and non-contact measurement of instantaneous flow field structure of the currents in the wind tunnel [13]. The common methods of recording the result of flow visualization are by film, either still or movie or television camera or video and magnetic tapes [14]. The objects of research are two refractometric method of visualization of flows: a scanning method and the shearing interferometry. In the process of modernization works scanning TPD installation carried out comparative studies of different types of digital cameras. The lighting system in addition to a continuous light source is added flash light, allowing to obtain a clear and bright image due to less exposure (~ 9 ms instead of 800 ms) and greater energy. As a result of the re-engineered and
implemented in a wind tunnel TPD raster shadow system and method of visualization of flow patterns with the registration of the image with a CCD camera type Videoscan-285-2101 on the personal computer. Presented system and imaging technique used in industrial test model axisymmetric air intake. Tests have shown the efficacy of the developed system and method in studies of models of air intakes and jet nozzles to install TPD. To install UGSD in the process of its modernization has been applied imaging system based on a modernized IT interferometer 183.Modernization has undergone lighting and reception of the interferometer. The mercury lamp illumination unit to the laser light source has been replaced. In the waiting room of the interferometer eyepiece was removed, and the image was focused directly on matrix video camera that connects to your computer. As a result of work performed significantly increased the efficiency of imaging systems as installation TPD, and the UGSD. So the use of a pulsed source of light allowed to dramatically increase the clarity and brightness of the imaging pictures, and use the new camera control enabled shooting modes directly from the TPD control cabin. Installing interferometric system UGSD considerably expanded display range from subsonic to supersonic speeds, which was not in the initial direct-shadow method.
Fig. 8. Frame 2011-06-07-21-57-35-2
Fig. 9. Frame 2011-06-07-21-57-35-5

Some Principles of Flow Visualization Techniques in Wind Tunnels
Proceedings of 82nd The IIER International Conference, Berlin, Germany, 3rd-4th October 2016, ISBN: 978-93-82702-15-3
17
Fig. 10. Frame 2011-06-07-21-57-35-5
Figure 8-10 show flow around the model with α = 8. The pulse light sources, exposure 9 microseconds (ms). Frames number - the date (year-month-day.) The time of the experiment (hours, minutes, seconds...). Between frames ~ 150 ms. In this paragraph described the visualization of the flow on the model surface using fluorescent mini tufts. Flow visualization on the surface of aircraft models is an important and integral part of the aerodynamic experiment. Imaging techniques limiting streamlines the most widely used: the method of carbon black, an oil film method eroded points and tufts method. These techniques are used in an aerodynamic experiment with the dawn of aviation. They are distinguished by an intuitive obviousness and simplicity of use. Traditional imaging techniques are designed for visual perception and recording on film. In place of the film come digital cameras with matrix photodetectors, allows to get the result and immediately process it on a computer. Spatial resolution - it is the only thing matrix photodetectors is losing film. Every year this advantage melts and now commercially available camera with a resolution of 40004000 pixels, which is at the level of 35 mm film. The spatial resolution is determined not only by the number of pixels, but the quality of the lens and limits the scope of the investigated phenomena, in some cases; these limitations can be overcome by using luminescence. Thus, in the final spatial resolution of the recording equipment, improve the spatial resolution can be tufts method using luminescent tufts. Fluorescent tufts because of their high contrast can be compared to conventional thinner (about 20-50 microns) and smaller length (15-20 mm). Mini tufts less outraged over the models and, as a consequence, visualization using them more reliable. A smaller length mini tuft allows tufts also be applied with a greater density and, thus, improve information flow patterns obtained. Furthermore, luminescent mini tufts provide the desired image contrast even at a metal not colored pattern (conventional tufts usually require a matt black color model helmet). model
painting exception not only reduces the complexity of the experiment, but also allows you to avoid problems with adhesion tufts to the model surface due to their electrifying. Fluorescent mini tufts necessary to initiate a specific spectral range of light and capture images of tufts in the spectral range of fluorescent, that is different from the spectrum of the excitation light. Application allows fluorescent thus eliminate light scattered on pipe walls and the model image registered only tufts and thereby prevent the glare on the surface of the model and data loss. Mini tufts method was proposed and developed by James Crowder (James Crowder) of the Boeing company about 20 years ago. As part of this work its own technology dyeing yarns fluorescent dye has been developed for the excitation of luminescence of these two strands of LED UV illuminator with 100 LEDs made in each. LEDs are assembled in a square matrix of 10x10 LEDs. The total angle of divergence of radiation from the illuminator is 20o, which allows them to be used in large wind tunnels. Method fluorescent mini tufts used in wind tunnel T-103 and T-128. The T-103 was studied wrapping training jet L-15 at a flow rate of 50 m / s model dimensions are: length - 1500 mm, wingspan - 1200 mm. Customer interested in wrapping all the aircraft from the top and from the side. The T-128 model, two firm Embraer passenger jets were investigated: the Phenom 100 and the Phenom-300, with a wingspan of 2000 mm imaging system installed in a T-128, is shown in figure 11.
Fig. 11.
The tests were conducted at a pressure of 1 atm and a filling flow rate of 80 m / s. Thus, the dynamic pressure in the T-128 was five times larger than when tested in a T-103. With such a high-speed pressure occurred fraying tufts into individual fibers and, in the future, a gradual separation of the fibers to the total destruction tufts. This process occurs rapidly in the areas of separation and significantly weaker in continuous areas. Therefore, from time to time it was necessary to repair the coating of tufts in times of rewiring pattern. Customer interested in the flow around the upper surface of the wings and engine

Some Principles of Flow Visualization Techniques in Wind Tunnels
Proceedings of 82nd The IIER International Conference, Berlin, Germany, 3rd-4th October 2016, ISBN: 978-93-82702-15-3
18
nacelles and pylons (nacelle located in the rear fuselage). And it needed a simultaneous recording of both consoles since weight tests showed asymmetrical flow.
Fig. 12.
In fig. 12 just presented is asymmetrical wrap. Total has been studied more than 1500 flow regimes. Influence mini tufts on the aerodynamic characteristics of the model analyzed the results of testing the Phenom 100-model T-128. In cruise configuration tufts impact can be considered negligible. So tufts influence on the lift coefficient does not exceed the value of 0.007, and is irregular. Tufts effect on the coefficient of resistance is increasing resistance to 0.0006. Influence mini tufts at the time of the pitch is also negligible z = 35° revealed marked differences in the aerodynamic characteristics during repeated tests of the model. CONCLUSION In the paper presented a brief introduction to experimental flow visualization techniques and methods. Flow visualization effects are illustrated by photos or videos. The advantage of computer technology for visualization and very powerful device for digital image recording are needed for visualization effects from flow measurements. Experimental flow visualization technique is a very
important for numerical flow visualization techniques using computer. ACKNOWLEDGEMENT The authors would like to thank Prof. Osin M.N. for useful discussion and sharing the results. REFERENCES
[1] Slavica Ristic. Flow Visualisation Techniques in Wind Tunnels Part I-II. Scientific Technical Review. Vol. LVII, No. 1, 2007. p. 39-49.
[2] Marzkirich W. Flow visualization, Academic Press, New York, 1977.
[3] Asanuma T. Flow visualization, Hemishere Publishing co., Tokyo, 1977
[4] Stedman D.H., Carignan G.R. Flow Visualization III, 1983.
[5] Yang W.J. Flow visualization III proc. of 3. International Symposium, An Arbor MI, 1983, Hemisphere, New York, 1985.
[6] Settles G.S. Modern Developments in Flow Visualization, AIAA JournaL, 1986, Vol.24, No.8, pp.1313-1323.
[7] Ristic S. Vizualizacija strujanja u aerodinamièkim tunelima, Glasnik RV i PVO,1990, No.1, pp.16-24.
[8] Josué Njock Libii Wind tunnels in engineering education, Wind Tunnels and Experimental Fluid Dynamics Research, Intechopen, 2011.
[9] Flow visualization, The National Aeronautics and Space Administration (NASA), https://www.grc.nasa.gov/www/k-12/airplane/tunvis.html
[10] Optical and physical research methods, The Central AeroHydrodynamic Institute named after professor N.E. Zhukovsky, http://www.tsagi.ru/experimental_base/
[11] Wind Tunnel Testing, http://adg.stanford.edu/aa208/modeling/empiricalmethods.html
[12] Petronevich V.V. 70 years of separation of the measuring equipment and metrology TsAGI. Milestones and Prospects. Proceedings of the conference on metrology and measurement technology for experimental investigations of aircraft, No. 1, 2014.
[13] Ye Htun. Model Fixation System In Wind Tunnel, M.Sc. thesis, MIPT, 2015.
[14] Muzafferuddin Mahmood Flow Visualization in Wind Tunnels, Wind Tunnels and Experimental Fluid Dynamics Research, Intechopen, 2011.