Embed Size (px)
Citation preview
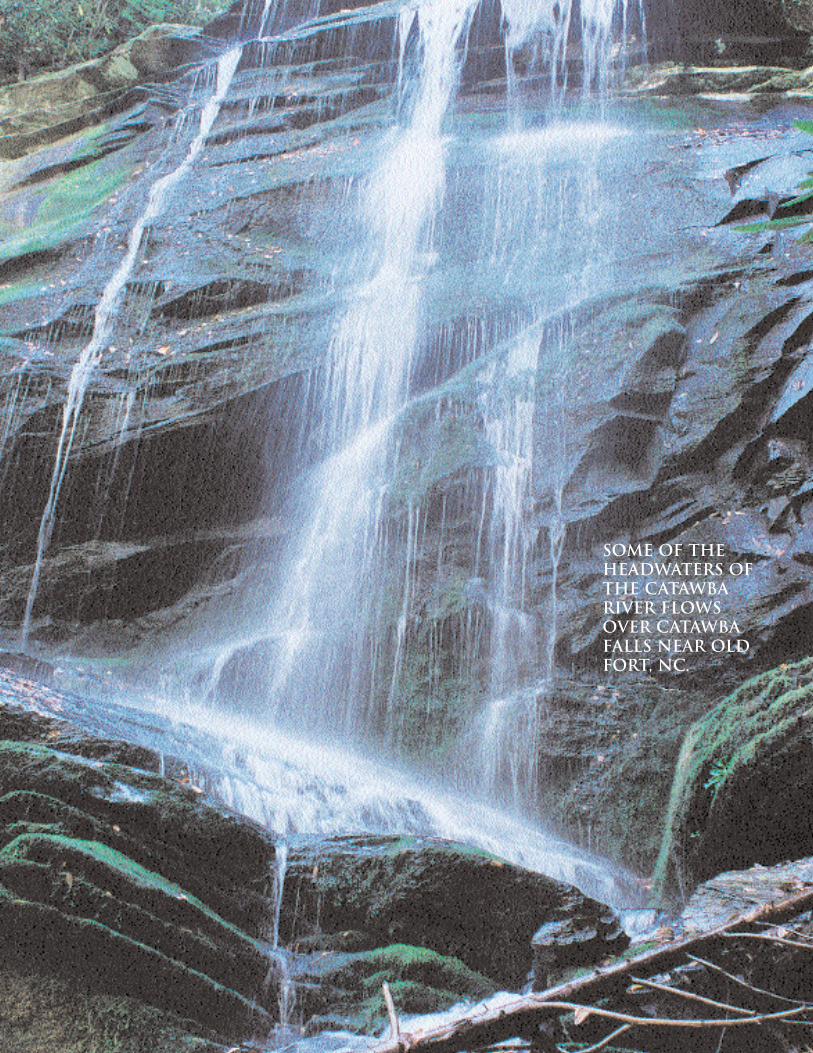
Some of theheadwaters ofthe CatawbaRiver flowsover CatawbaFalls near OldFort, NC.
water supplyPROTECTING OUR PRECIOUS WATER SUPPLY
water supply:water
id you ever take a moment to wonder where yourdrinking water comes from? The tap....pipes....TheCity....? Drinking water is a resource, which isoften taken for granted by the general public. A lot
of folks really don’t know where their drinking water originates,only that it flows from the tap when the faucet is open. In theMecklenburg County area, water can easily be taken for grantedbecause it is so plentiful and relatively inexpensive. It is oftenthe thing that is most common in our lives which goes unno-ticed and unappreciated.
The truth of the matter is that our water supply is the lifeline ofthe community. Mecklenburg County is blessed with abundantwater resources, which led to the settle-ment of this area, by Europeans in the1700's. Prior to this, Native Americansprospered from the wealth of the watersof this region. In more recent history,these water resources have supported theincredible population and economicgrowth Mecklenburg County has experi-enced and it is apparent that we are evermore dependent on our precious watersupply. Evidence of this growth trend canbe illustrated as easily by water usagetrends as by population figures. Forexample, Charlotte-Mecklenburg Utilities(CMU) reports that average daily waterusage over the past decade has increasedfrom 61 million gallons per day in 1989 to100 million gallons per day in 1999.
Unfortunately, the rapid growth, extensivedevelopment, and changing land uses seenthroughout this region often come at theexpense of environmental degradation.Mecklenburg County’s water supply reser-voirs are particularly susceptible to thedetrimental impacts of an expanding community in that wedesire to live and recreate on or near these water bodies. Aswe move into the future, great emphasis must be placed on pro-tecting our water supply so that we may maintain the resources,which have made our community a leader and trendsetter, bothregionally and abroad.
The Catawba River - A Journey From the Blue RidgeMountains to the Tap
High on the eastern slopes of the Blue Ridge Mountains inAvery, Burke, Caldwell, and McDowell counties, thousands of tiny
springs and seemingly insignificant tributaries act as conduits forrainwater and groundwater. These small conduits converge asthey flow down the mountain slopes and create larger streams,which in turn converge into rushing rivers such as the CatawbaRiver and the scenic Linville River. These rivers enter LakeJames, which is the first of eleven manmade impoundments alongthe Catawba that were created to harness her impressivepower.
As the Catawba River emerges on the other side of the dam atLake James, it continues its southeastern trek flowing throughthree more manmade impoundments including Lake Rhodhiss,Lake Hickory, and Lookout Shoals. The free flowing segments of
the Catawba meander through undisturbedforests, cow pastures, cornfields, residential,and industrial areas through both urban andrural communities. All along the way, wateris being added to the system through natu-ral hydrologic processes such as streamflow, rainfall, overland runoff and throughhuman activities such as treated wastewaterdischarges. Conversely, water is also beingextracted from the river and its impound-ments for agricultural uses, treatment forhuman consumption, industrial processes,and through evaporation.
Like any other traveler, the Catawba Riveracquires mementos along the way that rep-resent the places it has been. For example,the river may pick up sediment fromstormwater runoff over disturbed land,nutrients from agricultural activities andwastewater discharges, oil and grease,hydrocarbons, and other chemicals fromparking lot runoff, and bacteria from humanactivity and wildlife.
The Catawba River enters Mecklenburg County under the nameof Lake Norman, which is the largest manmade lake in NorthCarolina. Here, the water is detained for more than 200 daysuntil it flows through the dam and enters the much smallerMountain Island Lake. The sheer size and volume of LakeNorman along with the detention time in some ways acts as anatural water treatment process for a portion of the contami-nants, which were picked up along the rivers journey. As thewater velocity is slowed, sediment and suspended solids settleto the lake bottom and nutrients and other organic substancesare utilized by aquatic organisms.
D
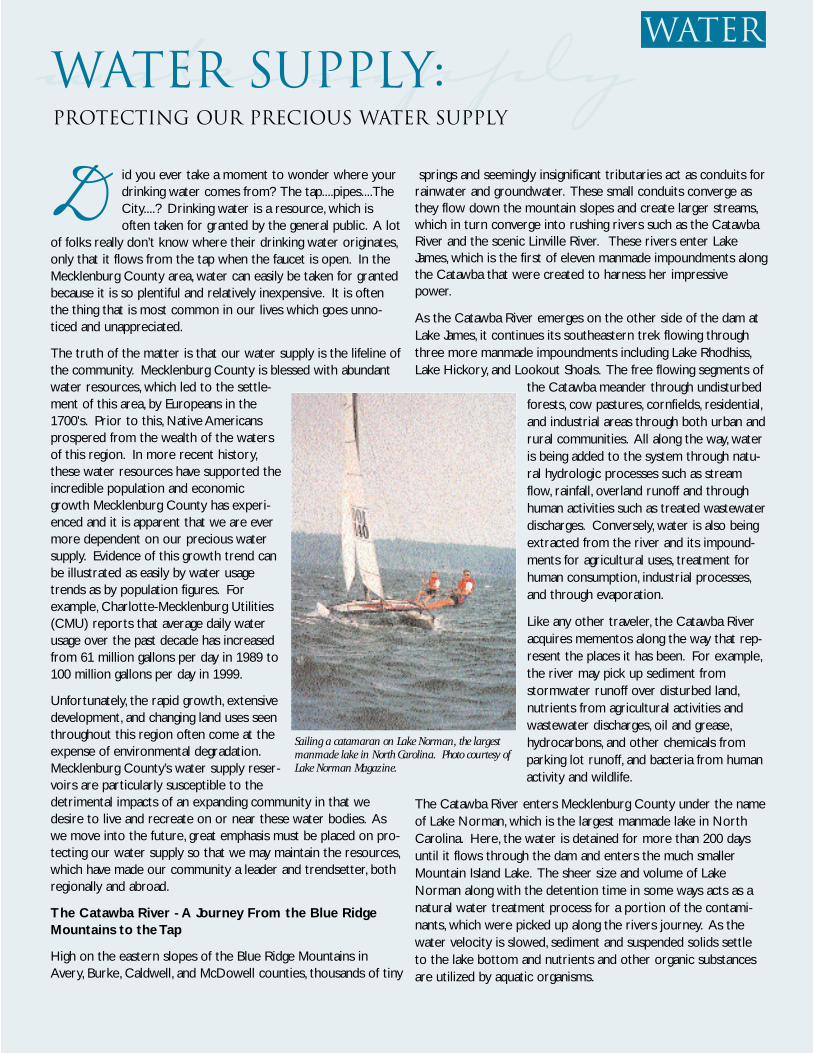
Sailing a catamaran on Lake Norman, the largestmanmade lake in North Carolina. Photo courtesy ofLake Norman Magazine.
Lake Norman and Mountain Island Lake serve as the drinkingwater supply reservoirs for Mecklenburg County. Though LakeNorman is approximately 95 percent larger than MountainIsland from a volume standpoint, Mountain Island serves asMecklenburg County’s primary water supply reservoir. Twowater intakes pump raw water from these lakes and distributeit to three water treatment facilities operated by Charlotte-Mecklenburg Utilities. CMU is capable of treating 183 milliongallons of water each day and provides drinking water toapproximately 70 percent of Mecklenburg County’s estimated661,091 people. On the average, each person uses nearly 147
gallons of water per day at a cost of approximately$.0014 per gallon including treatment and distribution.The treated water is distributed to customers through anetwork of 2,965 miles of water main and 174,800 serv-ice connections. Industries within the County aredependent on this source of water to maintain industrialprocesses. In addition, 8,846 fire hydrants offer fire pro-tection to individuals and industries within the servicearea.
Managing the Threats to Our Water Supply
Considering that our water supply reservoirs are such animportant aspect of the foundation of our community, theobvious question arises,“What is being done to protectthese essential resources?”
The answer to this question is somewhat complex in thatit often conflicts with the community development agen-da, crosses political lines, and often requires personal sac-rifice. The successful protection of these resources mustactually be implemented on the regional as well as thelocal watershed scale. A watershed would include all landarea that drains to our water supply reservoirs. In otherwords, the protection of our water supply begins at itspoint of origin in the Blue Ridge Mountains, along themeandering 112-mile journey to Mecklenburg County,and yes, even in our own backyards.
Pollution, which threatens our water supply reservoirsand streams, can be divided into two general categories:point source and non-point source pollution. Pointsource pollution can be defined as discharges from pipessuch as treated industrial and domestic wastewaters.These discharges are regulated and monitored by theNational Pollutant Discharge Elimination System (NPDES)permitting program. NPDES permits specify the maxi-mum pollutant load of individual characteristics a facilityis allowed to discharge to surface waters.
Non-point sources on the other hand, would includethose discharges associated with rainfall runoff and snowmelt.The quality and rate of runoff of non-point source pollution isdependent on the type of land cover and land use from whichthe rainfall runoff flows. For example, rainfall runoff fromundisturbed forested land will generally contain much less pol-lution and run off more slowly than runoff from urban andindustrial land uses with large amounts of impervious cover,such as paved parking lots, roof tops, and roadways. Non-pointsource pollution is widely considered to have the greatest neg-ative impact on water quality in the Catawba River because it iswidespread, difficult to study and quantify, and even more diffi-cult to control.
water
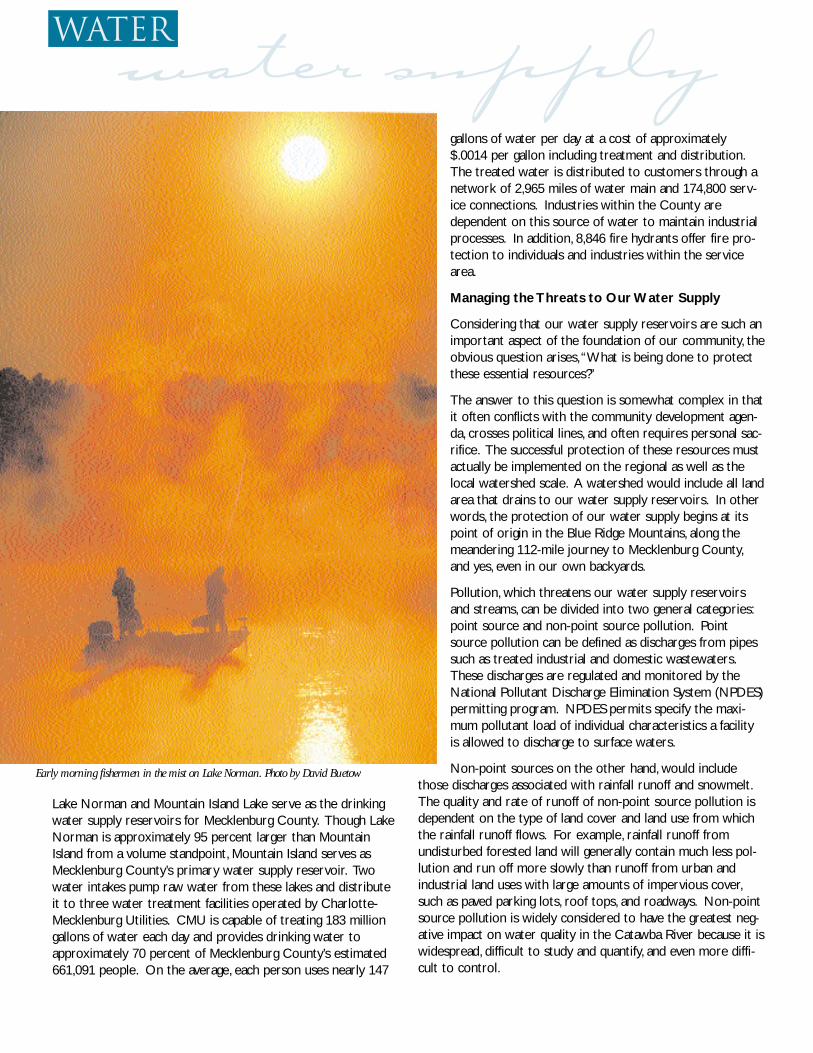
Early morning fishermen in the mist on Lake Norman. Photo by David Buetow
water supply
water
water
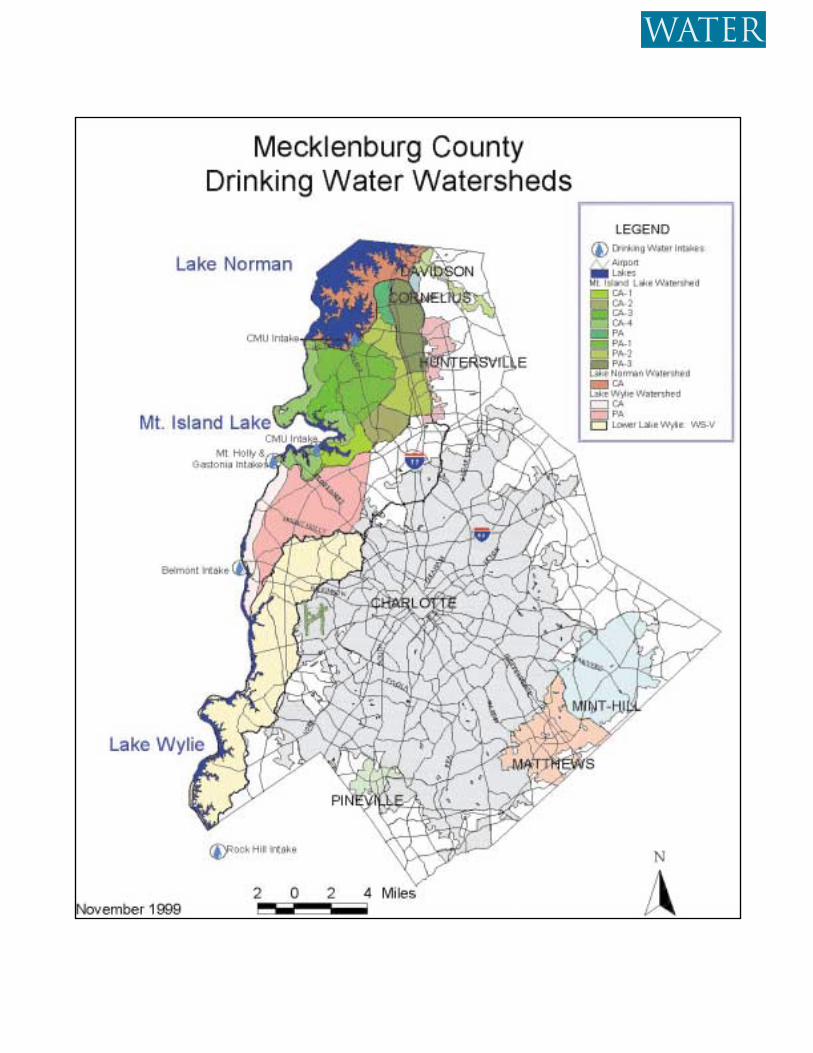
water supplyWho is Protecting Our Water Supply?Federal regulations require that state governments have meas-ures in place to protect water supply sources. In NorthCarolina, this is accomplished by designating the use of all orparts of certain streams, rivers and lakes as water supplysources (WS) or technically WS-I,WS-II,WS-III,WS-IV or WS-Vwaters. These water supplyclassifications require varyingdegrees of protection toensure that the waters meettheir designated use. Thedegree of protection andrestriction is also based uponthe environmental sensitivityof the surface water. Toensure that the desired use ofthese waters is maintained, theState regulates minimum ambi-ent water quality standardsand wastewater discharge limi-tations within a water supplywatershed.
In June of 1989, the N.C.Water Supply WatershedProtection Act (NCGS 143-214.5) was passed. This Actinstituted a cooperative pro-gram of watershed manage-ment and protection to beadministered by local govern-ments. Through this Act, localgovernments had the optionof developing, implementing,and enforcing their ownwatershed management poli-cies as long as they met mini-mum state requirements. Iflocal governments chose not to develop a watershed manage-ment plan, the State would administer and enforce minimumstatewide requirements. This Act had a large impact onMecklenburg County since its entire western boundary isdefined by the Catawba River, which is designated as a WS-IVwater supply, with the exception of lower Lake Wylie, which is aWS-V water supply. Mecklenburg County has three majorwatershed protection areas that are regulated under this Act:Lake Norman, Mountain Island Lake, and upper Lake Wylie.Although Lake Wylie is currently not a drinking water reservoirfor Mecklenburg County, the Town of Belmont in Gaston
County, and the Towns of Rock Hill and Fort Mill, SouthCarolina are dependent on this source. These three protectedareas encompass roughly one fourth of the land area ofMecklenburg County.
Governments in Mecklenburg County that have jurisdictionwithin the protected areas have adopted watershed protection
regulations as required byNCGS 143-214.5. These regu-lations provide limits, require-ments and restrictions fordevelopment within the pro-tected areas. Included as partof these regulations are undis-turbed vegetated buffers alongperennial streams and lakes.The required buffer widthsvary from 30 feet to 100 feetdepending on the location ofthe development and proximityto the drinking water intakes.All local watershed regulationsmust meet the minimum Statestandards. MecklenburgCounty has exercised a proac-tive approach to protectingour drinking water supplies bycreating regulations thatexceed State minimum stan-dards. These local watershedregulations are administeredunder County, City, and Townzoning and subdivision ordi-nances.
While regulations serve as anessential tool for watershed
protection, another extremelyimportant aspect of the preser-
vation of our water supply and natural resources has come inthe form of private organizations which are not only active inMecklenburg County, but all along the Catawba River. Groups,such as the Catawba Lands Conservancy, Catawba RiverFoundation,Trust for Public Lands, theRiverKeeper/CoveKeeper Program, and Adopt-A-Streamgroups, are instrumental to the protection of our waterresources. Some of the major accomplishments of these organ-izations include the preservation of several hundred acres ofland on Mountain Island Lake, development of water quality
water
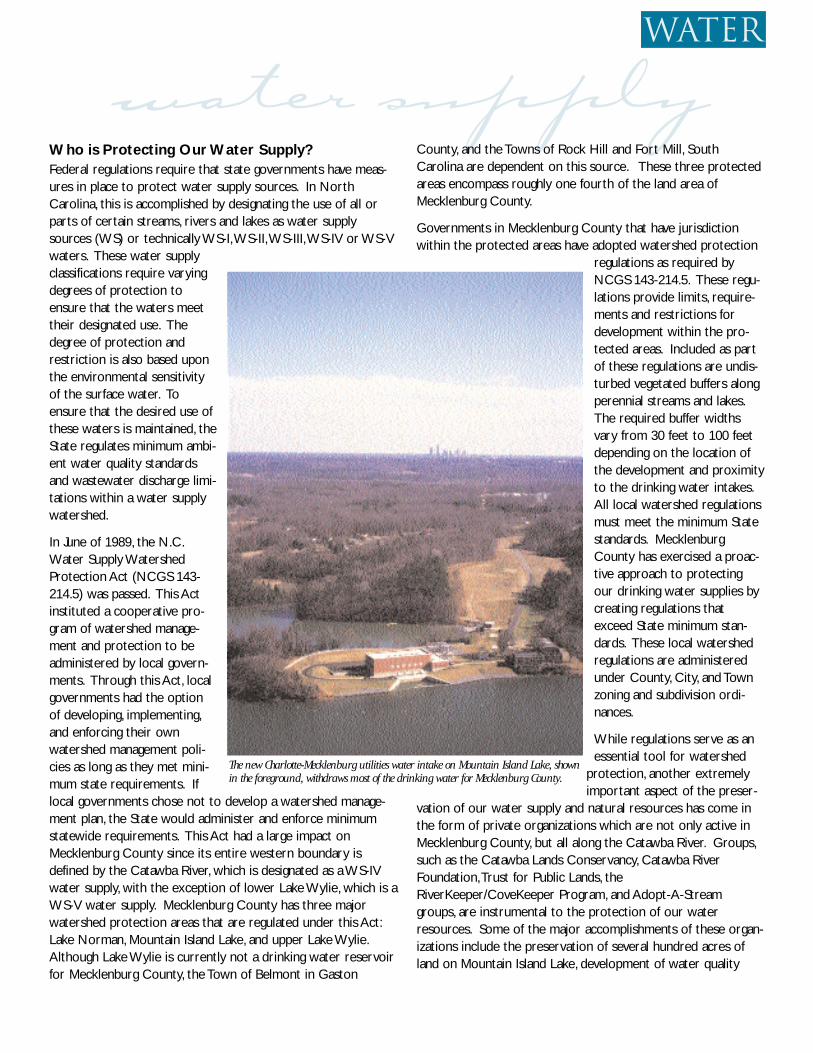
The new Charlotte-Mecklenburg utilities water intake on Mountain Island Lake, shownin the foreground, withdraws most of the drinking water for Mecklenburg County.
monitoring programs, patrolling hundreds of miles of Catawbashoreline to identify illegal discharges and buffer violations,adoption of several stream and shoreline miles resulting in theremoval of hundreds of pounds of trash from our surfacewaters, and providing funding for land acquisition projects inMecklenburg and surrounding counties to name a few.
Mecklenburg County and Charlotte-Mecklenburg Utilities havealso made great strides in preserving the water supply water-sheds, particularly around Mountain Island Lake. In 1970, theCounty passed a $20-million bond package to create parks andgreenways, primarily on the east side of Mountain Island. Inthat same decade, CMU also launched a land acquisition pro-gram in the watershed. Each year $50,000 from the utility’scapital improvement budget goes to protection of land in thewatershed, particularly on the eastern lakeshore where theCMU intake is located. This land, managed by MecklenburgCounty Park and Recreation Department, now totals 2,700acres. Regulations permit only low-impact recreation, such ascanoeing, fishing, and hiking in these areas.
Looking AheadThe future of Mecklenburg County’s water supply will find itselfthreatened by population growth and extensive development asurbanization continues both locally and upstream in the morerural counties. As development forces land values to rise,major landowners will feel increasing pressure to sell water-shed land for housing, shopping centers, and industrial develop-ment. To ensure high quality water supplies and naturalresources for future generations, water supply watershed pro-tection must continue through a balance of watershed regula-tion enforcement, intensified efforts to preserve land and ripari-an buffers along our streams, lakes and rivers, and throughcommunity involvement and education.
State Senator Fountain Odom, whose district encompasses theeastern side of Mountain Island Lake and who has been work-ing to protect it for 30 years, once said in describing MountainIsland Lake,“There’s tremendous diversity of wildlife--white-tailed deer, red-tailed hawks, as well as rare and endangeredflowers. The lake is the crown jewel of the area. It is to us asCentral Park is to Manhattan, only more so-it’s not only ourrecreational oasis, but also the source of our drinking water.”
John McCulloch/Water Quality [email protected]
hen putting together a puzzle, each puzzle piece adds to the puz-zle’s picture. Alone, each piece of the puzzle does not look like
much more than a blob of color. The more pieces added to the puzzle,the clearer the picture becomes. Like putting together a puzzle, WaterQuality uses a number of different water quality puzzle pieces to developa picture of the overall water quality conditions of the County’s lakes andstreams. Like the pieces of a puzzle, each water quality puzzle piecealone does not provide enough information to assess the overall waterquality conditions of the County’s surface waters. The water quality puz-zle pieces can be referred to as indicators of water quality.
Water Quality uses four different physical, chemical, and biological indi-cators of water quality. They include the Water Quality Index (WQI), theLake Water Quality Index (LWQI), Biosurveys of BenthicMacroinvertebrates and Fish, and the Overall Water Quality Rating Index(WQR), a combined physical, chemical and biological index. Thesewater quality indicators enable Water Quality to develop a more completepicture of the water quality conditions of the County’s lakes and streams,to identify and eliminate sources of pollution, to determine lake andstream water quality trends over time and to evaluate the success ofefforts to improve lake and stream water quality.
Physical and Chemical Indicators of Water QualityThe first water quality puzzle piece, the WQI, was developed by NSFInternational (formerly the National Sanitation Foundation). The WQIis a water quality indicator that utilizes physical and chemical waterquality parameters of streams. Each of the parameters measured reflectdifferent types of possible pollutants in a stream. Parameters measured
PUZZLEPIECES
OF WATERQUALITY
water
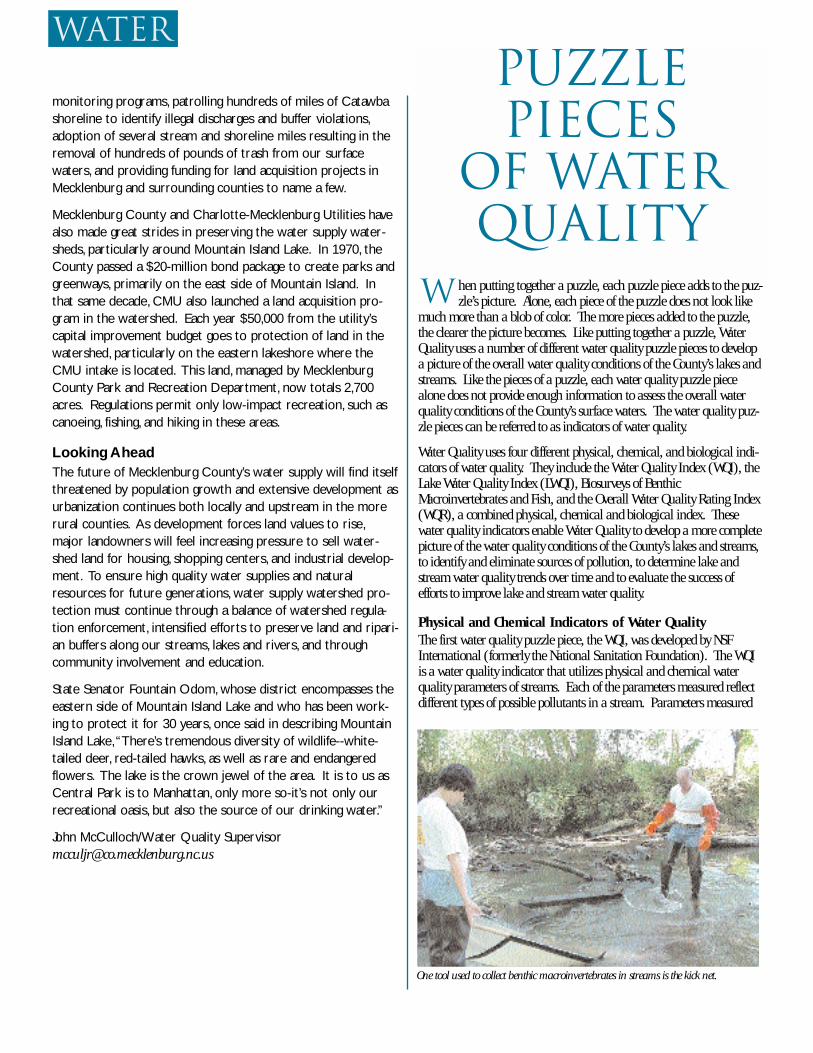
One tool used to collect benthic macroinvertebrates in streams is the kick net.
W
for the WQI include pH, Biochemical Oxygen Demand(BOD), Nitrate, Total Phosphorus, Turbidity, Total Solids,Fecal Coliform Bacteria, percent saturation of DissolvedOxygen (DO), and change in Temperature from upstreamto downstream. The LWQI, a lake water quality puzzlepiece, is an adaptation of the WQI developed by WilliamFusilier where several of the parameters used to determinestream water quality have been replaced by those moreindicative of water quality conditions in lakes. Parametersmeasured for the LWQI include pH, Nitrate, TotalPhosphorus, percent saturation of DO, Temperature,Conductivity, Secchi Disk Depth, Alkalinity, andChlorophyll-a. Any significant change in the parametersmeasured may indicate that a pollution problem exists. Forexample, a low DO and high BOD and nutrients concentra-tions may indicate organic pollution, and if accompanied bya high fecal coliform count may indicate a sewer discharge to a stream.Both indexes provide an indication of how safe it is for people to be in alake or stream.
Biological Indicators of Water QualityThe third water quality puzzle piece, biological surveys of theBenthic Macroinvertebrate (bottom dwelling aquatic organ-isms such as insects, crayfish and clams) and Fish commu-nities, serve as excellent indicators of water quality that com-plement the WQI and LWQI indicators. Changes in the com-position of benthic macroinvertebrate or fish communitiescan reflect changes in water quality caused by pollutionproblems or alterations in the aquatic habitat due to streambank erosion and sedimentation from construction sites.Each fish species has a unique tolerance to pollution and tospecific pollutants. For example, darter species are sensitiveto excessive sedimentation and temperature changes and arenot found in urban streams that have experienced severestream bank erosion and have been largely exposed to sun-light. The same can be said for benthic macroinvertebratesas tolerance to various pollutants varies greatly from species
to species. Benthic macroinvertebrates are ideal water quali-ty indicators because they are sensitive to changes in waterquality, found in all types of aquatic habitats, less mobilethan fish and large enough to be easily collected. Whilechemical and physical parameter sampling may miss occa-sional pollutant discharges, benthic macroinvertebrates areexposed to everything that enters the streams and lakes.Using benthic macroinvertebrates, the stream water qualityclassification is determined by EPT Taxa Richness (totalnumber of different species) of three pollution sensitiveaquatic insect orders, Mayflies (Ephemeroptera), Stoneflies(Plecoptera), and Caddisflies (Trichoptera). The greater the
taxa richness is the better the stream water quality. Usingfishes, the stream water quality classification is determined byusing the North Carolina Index of Biotic Integrity (NCIBI),which incorporates 12 different community composition
descriptors. The higher the NCIBI, the better the stream water quality.
Combined Physical, Chemical and Biological Indicator ofWater QualityThe most accurate water quality puzzle piece that summarizes the stream
water quality conditions in Mecklenburg County is the WQRindicator that combines the chemical, physical and biologi-cal parameters that have been measured. This rating isobtained by averaging the annual WQI with the EPT TaxaRichness value. The WQR gives a better view of the waterquality conditions of the County’s streams since the limita-tions of the chemical sampling are minimized by the EPTTaxa Richness values. The benthic macroinvertebrate com-munity present in a stream is a reflection of the total com-bined effects of all pollutants, and therefore the resultingWQR more accurately reflects the true water quality condi-tions in those streams. The better the water quality, the bet-
ter the stream will be able to support increasingly sensitiveuses such as propagation of wildlife, wading and swimming.
Unlike a puzzle whose picture never changes, the water qual-ity conditions of Mecklenburg County’s lakes and streams
change daily. New development,accidental spills, and storm waterrunoff combine to add a widevariety of pollutants to the sur-face waters of the County.Continued monitoring of thewater quality conditions of thelakes and streams will give newdata to keep the water qualitypuzzle pieces current, and reflectan accurate overall picture of thewater quality conditions inMecklenburg County.
Anthony J. Roux / EnvironmentalHygienist II, Water [email protected]
water
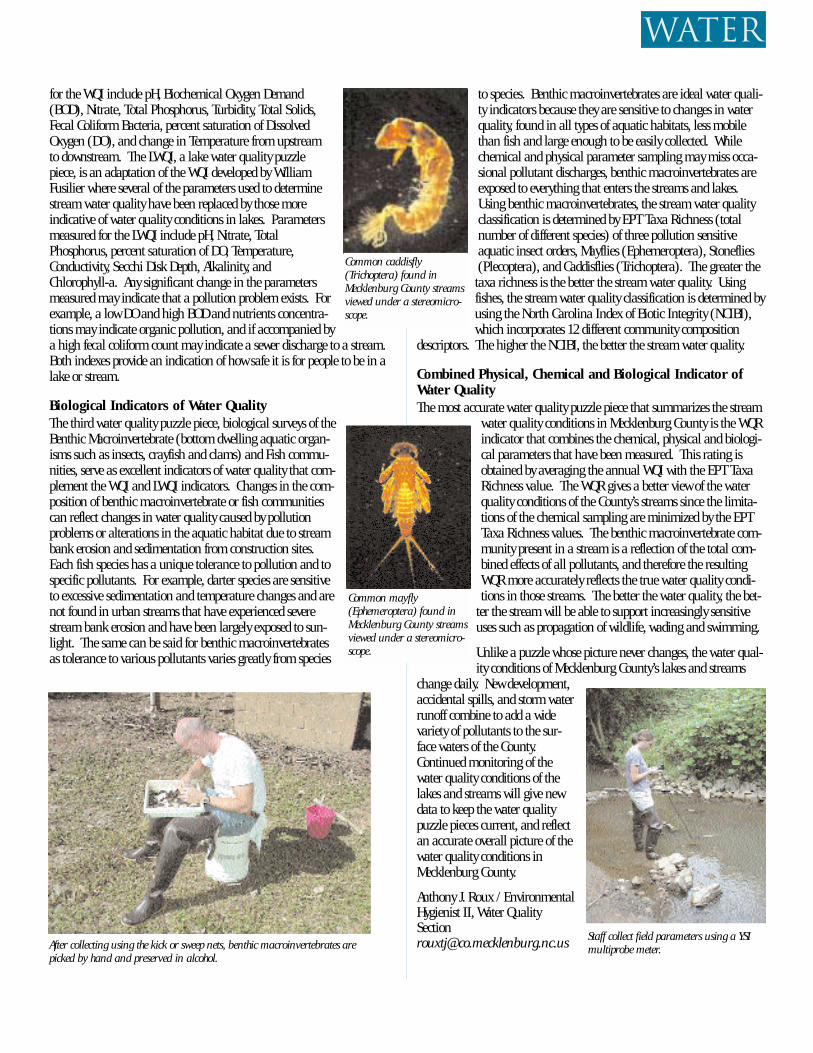
After collecting using the kick or sweep nets, benthic macroinvertebrates arepicked by hand and preserved in alcohol.
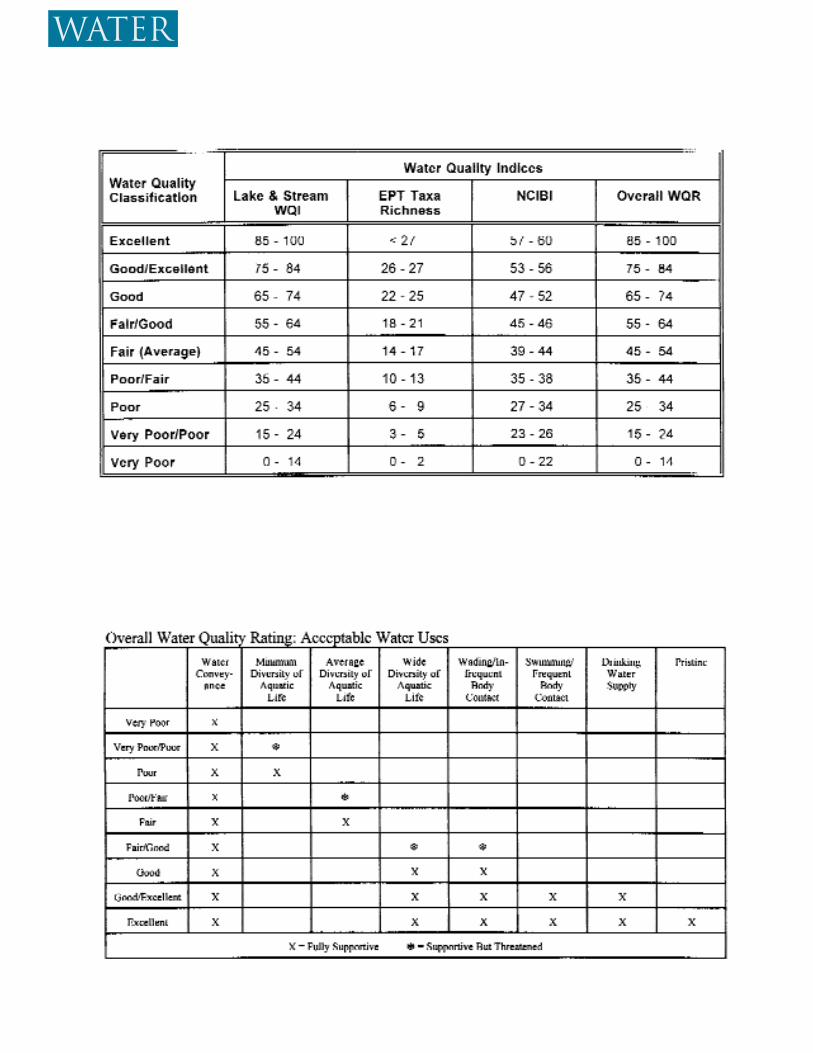
Common caddisfly(Trichoptera) found inMecklenburg County streamsviewed under a stereomicro-scope.
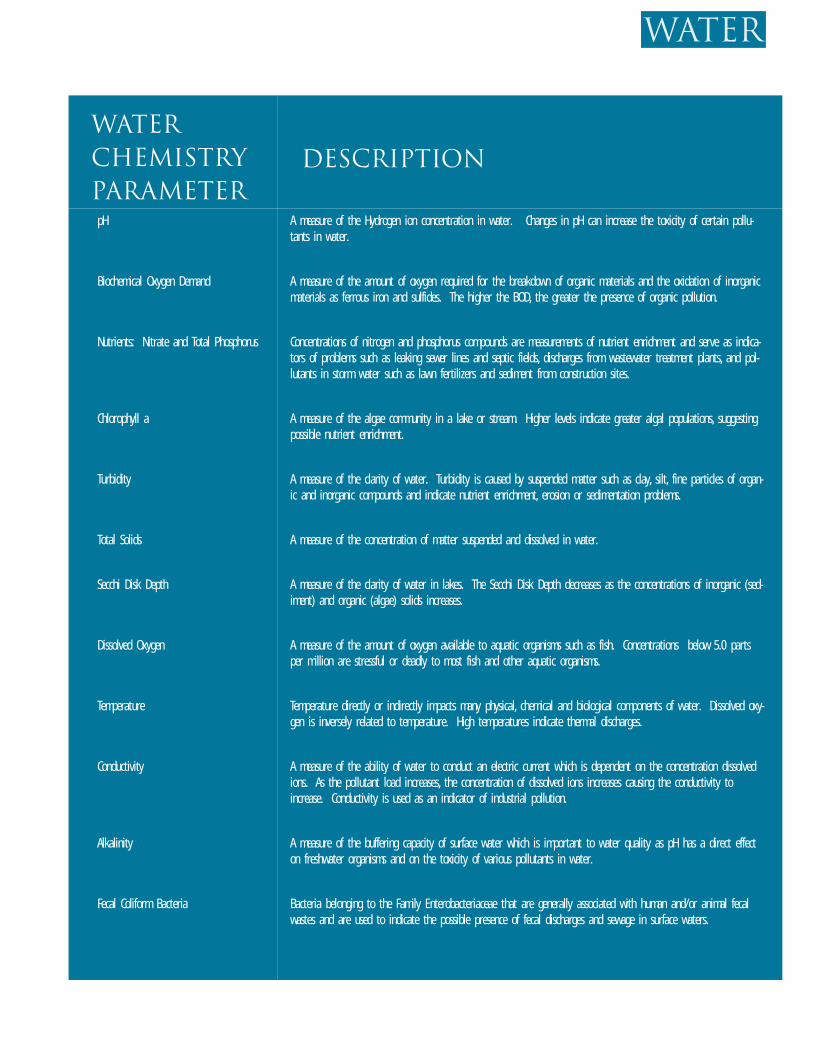
Common mayfly(Ephemeroptera) found inMecklenburg County streamsviewed under a stereomicro-scope.
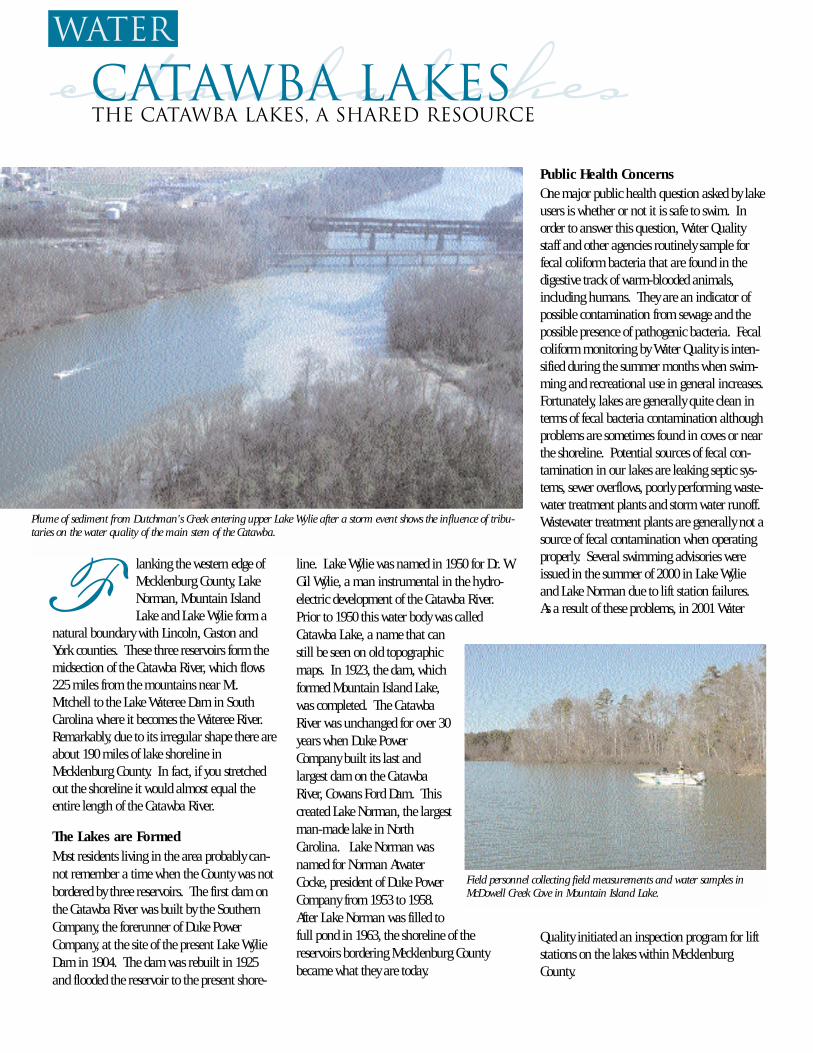
Staff collect field parameters using a YSImultiprobe meter.
water
Description
pH A measure of the Hydrogen ion concentration in water. Changes in pH can increase the toxicity of certain pollu-tants in water.
Biochemical Oxygen Demand A measure of the amount of oxygen required for the breakdown of organic materials and the oxidation of inorganicmaterials as ferrous iron and sulfides. The higher the BOD, the greater the presence of organic pollution.
Nutrients: Nitrate and Total Phosphorus Concentrations of nitrogen and phosphorus compounds are measurements of nutrient enrichment and serve as indica-tors of problems such as leaking sewer lines and septic fields, discharges from wastewater treatment plants, and pol-lutants in storm water such as lawn fertilizers and sediment from construction sites.
Chlorophyll a A measure of the algae community in a lake or stream. Higher levels indicate greater algal populations, suggestingpossible nutrient enrichment.
Turbidity A measure of the clarity of water. Turbidity is caused by suspended matter such as clay, silt, fine particles of organ-ic and inorganic compounds and indicate nutrient enrichment, erosion or sedimentation problems.
Total Solids A measure of the concentration of matter suspended and dissolved in water.
Secchi Disk Depth A measure of the clarity of water in lakes. The Secchi Disk Depth decreases as the concentrations of inorganic (sed-iment) and organic (algae) solids increases.
Dissolved Oxygen A measure of the amount of oxygen available to aquatic organisms such as fish. Concentrations below 5.0 partsper million are stressful or deadly to most fish and other aquatic organisms.
Temperature Temperature directly or indirectly impacts many physical, chemical and biological components of water. Dissolved oxy-gen is inversely related to temperature. High temperatures indicate thermal discharges.
Conductivity A measure of the ability of water to conduct an electric current which is dependent on the concentration dissolvedions. As the pollutant load increases, the concentration of dissolved ions increases causing the conductivity toincrease. Conductivity is used as an indicator of industrial pollution.
Alkalinity A measure of the buffering capacity of surface water which is important to water quality as pH has a direct effecton freshwater organisms and on the toxicity of various pollutants in water.
Fecal Coliform Bacteria Bacteria belonging to the Family Enterobacteriaceae that are generally associated with human and/or animal fecalwastes and are used to indicate the possible presence of fecal discharges and sewage in surface waters.
water
Water Chemistry Parameter
catawba lakes
lanking the western edge ofMecklenburg County, LakeNorman, Mountain IslandLake and Lake Wylie form a
natural boundary with Lincoln, Gaston andYork counties. These three reservoirs form themidsection of the Catawba River, which flows225 miles from the mountains near Mt.Mitchell to the Lake Wateree Dam in SouthCarolina where it becomes the Wateree River.Remarkably, due to its irregular shape there areabout 190 miles of lake shoreline inMecklenburg County. In fact, if you stretchedout the shoreline it would almost equal theentire length of the Catawba River.
The Lakes are FormedMost residents living in the area probably can-not remember a time when the County was notbordered by three reservoirs. The first dam onthe Catawba River was built by the SouthernCompany, the forerunner of Duke PowerCompany, at the site of the present Lake WylieDam in 1904. The dam was rebuilt in 1925and flooded the reservoir to the present shore-
line. Lake Wylie was named in 1950 for Dr. W.Gil Wylie, a man instrumental in the hydro-electric development of the Catawba River.Prior to 1950 this water body was calledCatawba Lake, a name that canstill be seen on old topographicmaps. In 1923, the dam, whichformed Mountain Island Lake,was completed. The CatawbaRiver was unchanged for over 30years when Duke PowerCompany built its last andlargest dam on the CatawbaRiver, Cowans Ford Dam. Thiscreated Lake Norman, the largestman-made lake in NorthCarolina. Lake Norman wasnamed for Norman AtwaterCocke, president of Duke PowerCompany from 1953 to 1958.After Lake Norman was filled tofull pond in 1963, the shoreline of the reservoirs bordering Mecklenburg Countybecame what they are today.
Public Health ConcernsOne major public health question asked by lakeusers is whether or not it is safe to swim. Inorder to answer this question, Water Qualitystaff and other agencies routinely sample forfecal coliform bacteria that are found in thedigestive track of warm-blooded animals,including humans. They are an indicator ofpossible contamination from sewage and thepossible presence of pathogenic bacteria. Fecalcoliform monitoring by Water Quality is inten-sified during the summer months when swim-ming and recreational use in general increases.Fortunately, lakes are generally quite clean interms of fecal bacteria contamination althoughproblems are sometimes found in coves or nearthe shoreline. Potential sources of fecal con-tamination in our lakes are leaking septic sys-tems, sewer overflows, poorly performing waste-water treatment plants and storm water runoff.Wastewater treatment plants are generally not asource of fecal contamination when operatingproperly. Several swimming advisories wereissued in the summer of 2000 in Lake Wylieand Lake Norman due to lift station failures.As a result of these problems, in 2001 Water
Quality initiated an inspection program for liftstations on the lakes within MecklenburgCounty.
The Catawba Lakes, a Shared ResourceCatawba lakes
water
Field personnel collecting field measurements and water samples inMcDowell Creek Cove in Mountain Island Lake.
Plume of sediment from Dutchman's Creek entering upper Lake Wylie after a storm event shows the influence of tribu-taries on the water quality of the main stem of the Catawba.
F
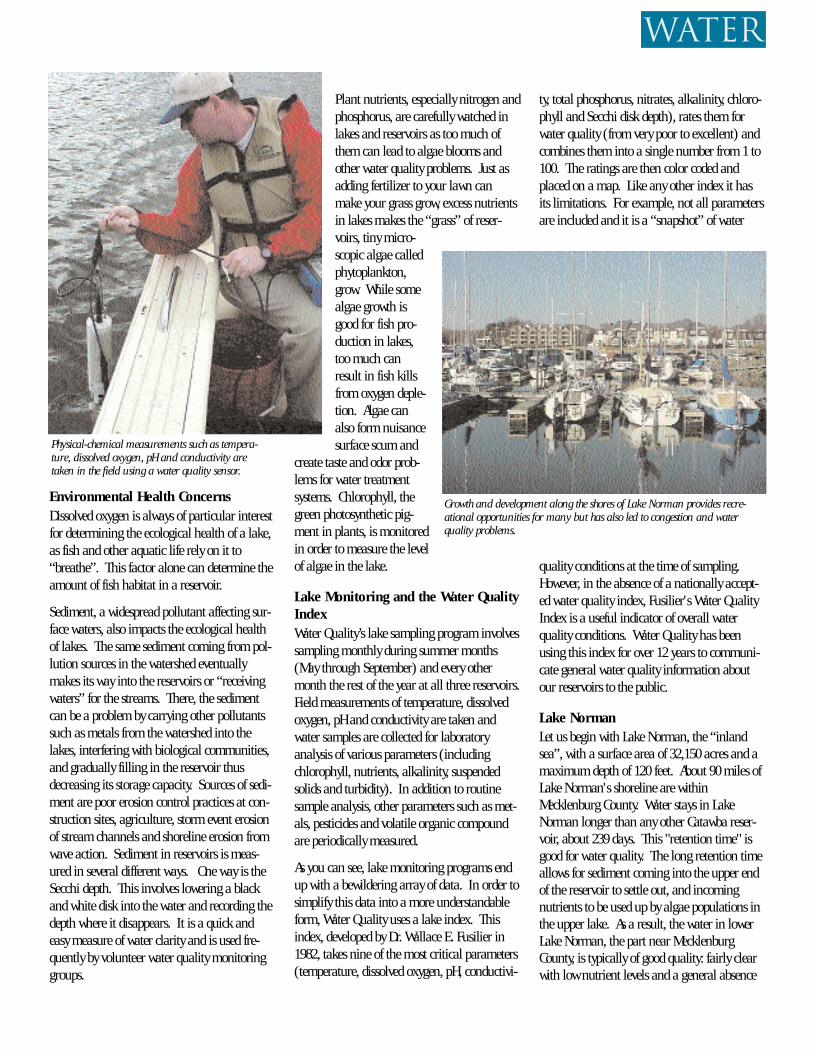
Environmental Health ConcernsDissolved oxygen is always of particular interestfor determining the ecological health of a lake,as fish and other aquatic life rely on it to“breathe”. This factor alone can determine theamount of fish habitat in a reservoir.
Sediment, a widespread pollutant affecting sur-face waters, also impacts the ecological healthof lakes. The same sediment coming from pol-lution sources in the watershed eventuallymakes its way into the reservoirs or “receivingwaters” for the streams. There, the sedimentcan be a problem by carrying other pollutantssuch as metals from the watershed into thelakes, interfering with biological communities,and gradually filling in the reservoir thusdecreasing its storage capacity. Sources of sedi-ment are poor erosion control practices at con-struction sites, agriculture, storm event erosionof stream channels and shoreline erosion fromwave action. Sediment in reservoirs is meas-ured in several different ways. One way is theSecchi depth. This involves lowering a blackand white disk into the water and recording thedepth where it disappears. It is a quick andeasy measure of water clarity and is used fre-quently by volunteer water quality monitoringgroups.
Plant nutrients, especially nitrogen andphosphorus, are carefully watched inlakes and reservoirs as too much ofthem can lead to algae blooms andother water quality problems. Just asadding fertilizer to your lawn canmake your grass grow, excess nutrientsin lakes makes the “grass” of reser-voirs, tiny micro-scopic algae calledphytoplankton,grow. While somealgae growth isgood for fish pro-duction in lakes,too much canresult in fish killsfrom oxygen deple-tion. Algae canalso form nuisancesurface scum and
create taste and odor prob-lems for water treatmentsystems. Chlorophyll, thegreen photosynthetic pig-ment in plants, is monitoredin order to measure the levelof algae in the lake.
Lake Monitoring and the Water QualityIndexWater Quality’s lake sampling program involvessampling monthly during summer months(May through September) and every othermonth the rest of the year at all three reservoirs.Field measurements of temperature, dissolvedoxygen, pH and conductivity are taken andwater samples are collected for laboratoryanalysis of various parameters (includingchlorophyll, nutrients, alkalinity, suspendedsolids and turbidity). In addition to routinesample analysis, other parameters such as met-als, pesticides and volatile organic compoundare periodically measured.
As you can see, lake monitoring programs endup with a bewildering array of data. In order tosimplify this data into a more understandableform, Water Quality uses a lake index. Thisindex, developed by Dr. Wallace E. Fusilier in1982, takes nine of the most critical parameters(temperature, dissolved oxygen, pH, conductivi-
ty, total phosphorus, nitrates, alkalinity, chloro-phyll and Secchi disk depth), rates them forwater quality (from very poor to excellent) andcombines them into a single number from 1 to100. The ratings are then color coded andplaced on a map. Like any other index it hasits limitations. For example, not all parametersare included and it is a “snapshot” of water
quality conditions at the time of sampling.However, in the absence of a nationally accept-ed water quality index, Fusilier's Water QualityIndex is a useful indicator of overall waterquality conditions. Water Quality has beenusing this index for over 12 years to communi-cate general water quality information aboutour reservoirs to the public.
Lake NormanLet us begin with Lake Norman, the “inlandsea”, with a surface area of 32,150 acres and amaximum depth of 120 feet. About 90 miles ofLake Norman's shoreline are withinMecklenburg County. Water stays in LakeNorman longer than any other Catawba reser-voir, about 239 days. This "retention time" isgood for water quality. The long retention timeallows for sediment coming into the upper endof the reservoir to settle out, and incomingnutrients to be used up by algae populations inthe upper lake. As a result, the water in lowerLake Norman, the part near MecklenburgCounty, is typically of good quality: fairly clearwith low nutrient levels and a general absence
water
Physical-chemical measurements such as tempera-ture, dissolved oxygen, pH and conductivity aretaken in the field using a water quality sensor.
Growth and development along the shores of Lake Norman provides recre-ational opportunities for many but has also led to congestion and waterquality problems.
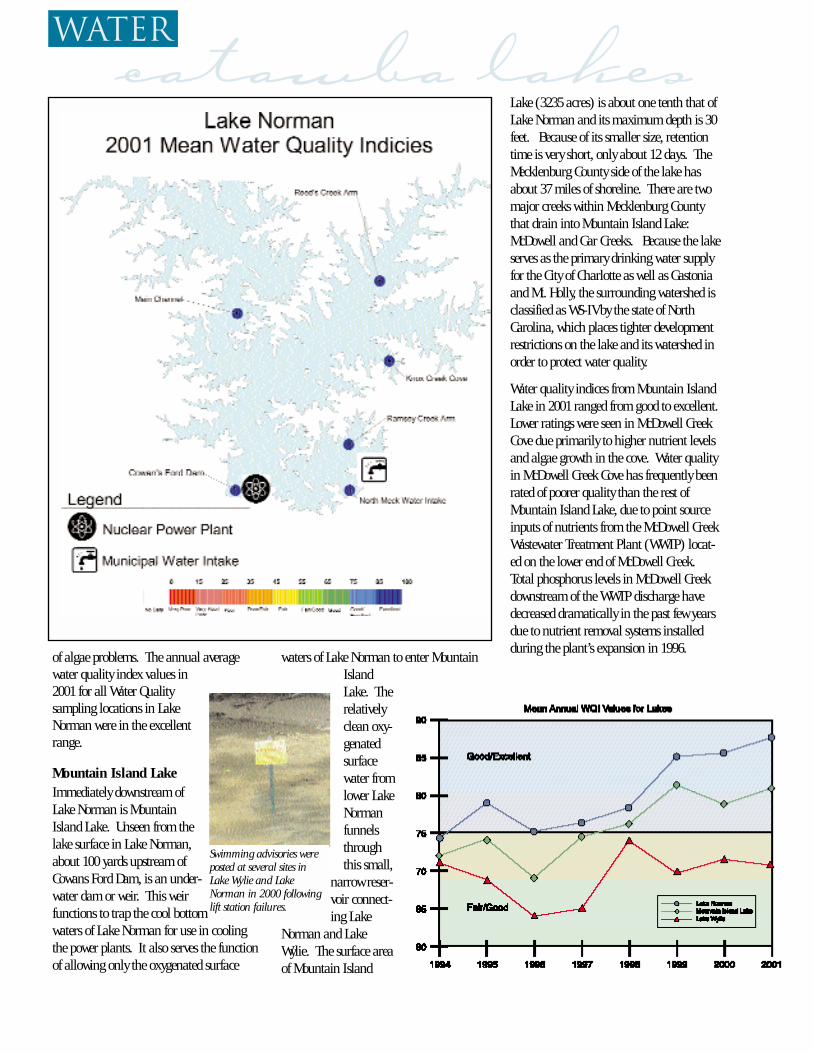
of algae problems. The annual averagewater quality index values in2001 for all Water Qualitysampling locations in LakeNorman were in the excellentrange.
Mountain Island LakeImmediately downstream ofLake Norman is MountainIsland Lake. Unseen from thelake surface in Lake Norman,about 100 yards upstream ofCowans Ford Dam, is an under-water dam or weir. This weirfunctions to trap the cool bottomwaters of Lake Norman for use in coolingthe power plants. It also serves the functionof allowing only the oxygenated surface
waters of Lake Norman to enter MountainIslandLake. Therelativelyclean oxy-genatedsurfacewater fromlower LakeNormanfunnelsthroughthis small,
narrow reser-voir connect-ing Lake
Norman and LakeWylie. The surface areaof Mountain Island
Lake (3235 acres) is about one tenth that ofLake Norman and its maximum depth is 30feet. Because of its smaller size, retentiontime is very short, only about 12 days. TheMecklenburg County side of the lake hasabout 37 miles of shoreline. There are twomajor creeks within Mecklenburg Countythat drain into Mountain Island Lake:McDowell and Gar Creeks. Because the lakeserves as the primary drinking water supplyfor the City of Charlotte as well as Gastoniaand Mt. Holly, the surrounding watershed isclassified as WS-IV by the state of NorthCarolina, which places tighter developmentrestrictions on the lake and its watershed inorder to protect water quality.
Water quality indices from Mountain IslandLake in 2001 ranged from good to excellent.Lower ratings were seen in McDowell CreekCove due primarily to higher nutrient levelsand algae growth in the cove. Water qualityin McDowell Creek Cove has frequently beenrated of poorer quality than the rest ofMountain Island Lake, due to point sourceinputs of nutrients from the McDowell CreekWastewater Treatment Plant (WWTP) locat-ed on the lower end of McDowell Creek.Total phosphorus levels in McDowell Creekdownstream of the WWTP discharge havedecreased dramatically in the past few yearsdue to nutrient removal systems installedduring the plant’s expansion in 1996.
water
Swimming advisories wereposted at several sites inLake Wylie and LakeNorman in 2000 followinglift station failures.
catawba lakes
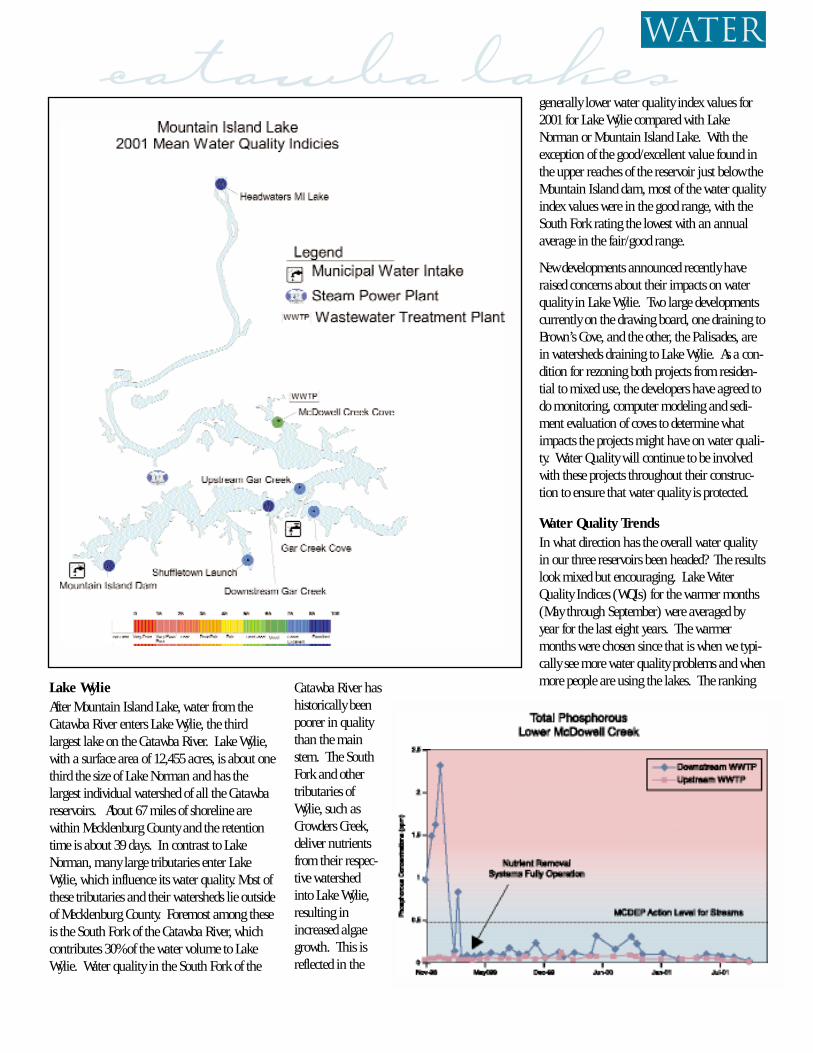
Lake WylieAfter Mountain Island Lake, water from theCatawba River enters Lake Wylie, the thirdlargest lake on the Catawba River. Lake Wylie,with a surface area of 12,455 acres, is about onethird the size of Lake Norman and has thelargest individual watershed of all the Catawbareservoirs. About 67 miles of shoreline arewithin Mecklenburg County and the retentiontime is about 39 days. In contrast to LakeNorman, many large tributaries enter LakeWylie, which influence its water quality. Most ofthese tributaries and their watersheds lie outsideof Mecklenburg County. Foremost among theseis the South Fork of the Catawba River, whichcontributes 30% of the water volume to LakeWylie. Water quality in the South Fork of the
Catawba River hashistorically beenpoorer in qualitythan the mainstem. The SouthFork and othertributaries ofWylie, such asCrowders Creek,deliver nutrientsfrom their respec-tive watershedinto Lake Wylie,resulting inincreased algaegrowth. This isreflected in the
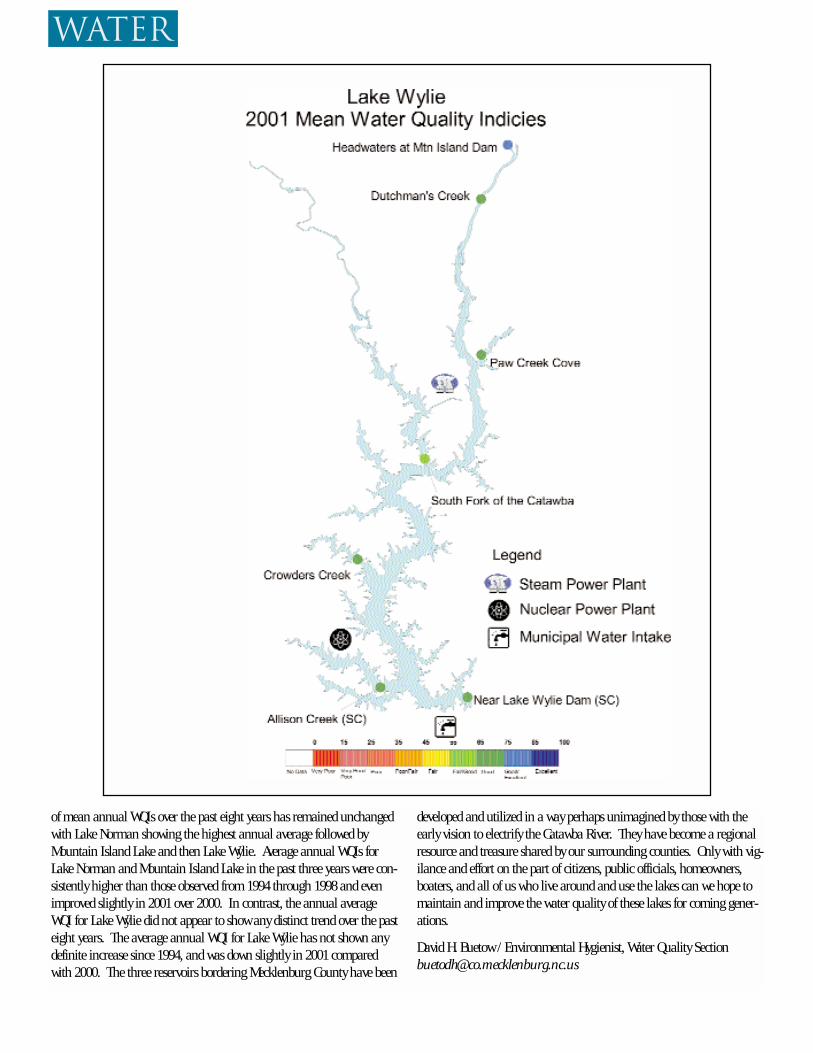
generally lower water quality index values for2001 for Lake Wylie compared with LakeNorman or Mountain Island Lake. With theexception of the good/excellent value found inthe upper reaches of the reservoir just below theMountain Island dam, most of the water qualityindex values were in the good range, with theSouth Fork rating the lowest with an annualaverage in the fair/good range.
New developments announced recently haveraised concerns about their impacts on waterquality in Lake Wylie. Two large developmentscurrently on the drawing board, one draining toBrown’s Cove, and the other, the Palisades, arein watersheds draining to Lake Wylie. As a con-dition for rezoning both projects from residen-tial to mixed use, the developers have agreed todo monitoring, computer modeling and sedi-ment evaluation of coves to determine whatimpacts the projects might have on water quali-ty. Water Quality will continue to be involvedwith these projects throughout their construc-tion to ensure that water quality is protected.
Water Quality Trends In what direction has the overall water qualityin our three reservoirs been headed? The resultslook mixed but encouraging. Lake WaterQuality Indices (WQIs) for the warmer months(May through September) were averaged byyear for the last eight years. The warmermonths were chosen since that is when we typi-cally see more water quality problems and whenmore people are using the lakes. The ranking
watercatawba lakes
water
of mean annual WQIs over the past eight years has remained unchangedwith Lake Norman showing the highest annual average followed byMountain Island Lake and then Lake Wylie. Average annual WQIs forLake Norman and Mountain Island Lake in the past three years were con-sistently higher than those observed from 1994 through 1998 and evenimproved slightly in 2001 over 2000. In contrast, the annual averageWQI for Lake Wylie did not appear to show any distinct trend over the pasteight years. The average annual WQI for Lake Wylie has not shown anydefinite increase since 1994, and was down slightly in 2001 comparedwith 2000. The three reservoirs bordering Mecklenburg County have been
developed and utilized in a way perhaps unimagined by those with theearly vision to electrify the Catawba River. They have become a regionalresource and treasure shared by our surrounding counties. Only with vig-ilance and effort on the part of citizens, public officials, homeowners,boaters, and all of us who live around and use the lakes can we hope tomaintain and improve the water quality of these lakes for coming gener-ations.
David H. Buetow / Environmental Hygienist, Water Quality [email protected]
protecting
n October of 1999, the Mecklenburg County Board of CountyCommissioners (BOCC) appointed a stakeholders group to considerthe possibility of extending water supply watershed regulations to
include Lower Lake Wylie. This portion of Lake Wylie, extending fromPaw Creek south to the South Carolina State line, was previously excludedfrom Mecklenburg County water supply watershed regulations due to itsdesignation as a WS-V water supply. As a result of this WS-V classification,North Carolina state law did not require protection for this portion of thewatershed since it is not currently utilized as a drinking water supplysource.
The stakeholders, consisting of 16 members representing Lower LakeWylie property owners, developers, realtors, and environmental interestgroups deliberated for several months to develop recommendations forconsideration by the BOCC and the Charlotte City Council. The stake-holders group considered water quality conditions in Lake Wylie, the ben-efits of watershed protection regulations, the potential that MecklenburgCounty may have a future need to draw drinking water from Lake Wylie,and the fact that the Towns of Rock Hill and Fort Mill, South Carolinaalready depend on Lake Wylie as a drinking water source in the develop-ment of their recommendations.
In May 2000, the stakeholders reached consensus and issued a report rec-ommending the development of undisturbed buffers along the Lower LakeWylie lakeshore and perennial streams in addition to restrictions on theamounts of impervious area allowed within the Lower Lake Wylie water-shed. After a series of public notifications by mail and media, community
meetings, public forums, and public hearings, the BOCC and CharlotteCity Council unanimously adopted the Lower Lake Wylie WatershedProtection ordinances on July 10, 2001 and October 17, 2001,respectively.As a result of this effort, all 197 miles of shoreline along the CatawbaRiver in Mecklenburg County are now protected.
To prevent undue hardship to individuals already living along Lower LakeWylie or those properties otherwise vested, the regulations contain clausesfor "grandfathering". For instance, developments, existing prior to thedates that the ordinances were adopted, are not subject to the regulationsunless the property owner wishes to redevelop or expand. Vacant lotsexisting prior to ordinance adoption are subject only to the buffer require-ments. New developments approved after the dates of ordinance adoptionmust comply with all requirements of the ordinance.
The following tables summarize the water supply watershed protectionrequirements for Lake Wylie. To view or download a copy of the LowerLake Wylie Watershed Ordinance on the Internet: Go to www.co.mecklen-burg.nc.us/coenv/inside.htm
1. Click on Surface Water2. Click on Lower Lake Wylie Watershed Information3. Select a format and view or download the document.
John McCulloch - Water Quality [email protected]
Lower Lake WylieProtecting
water
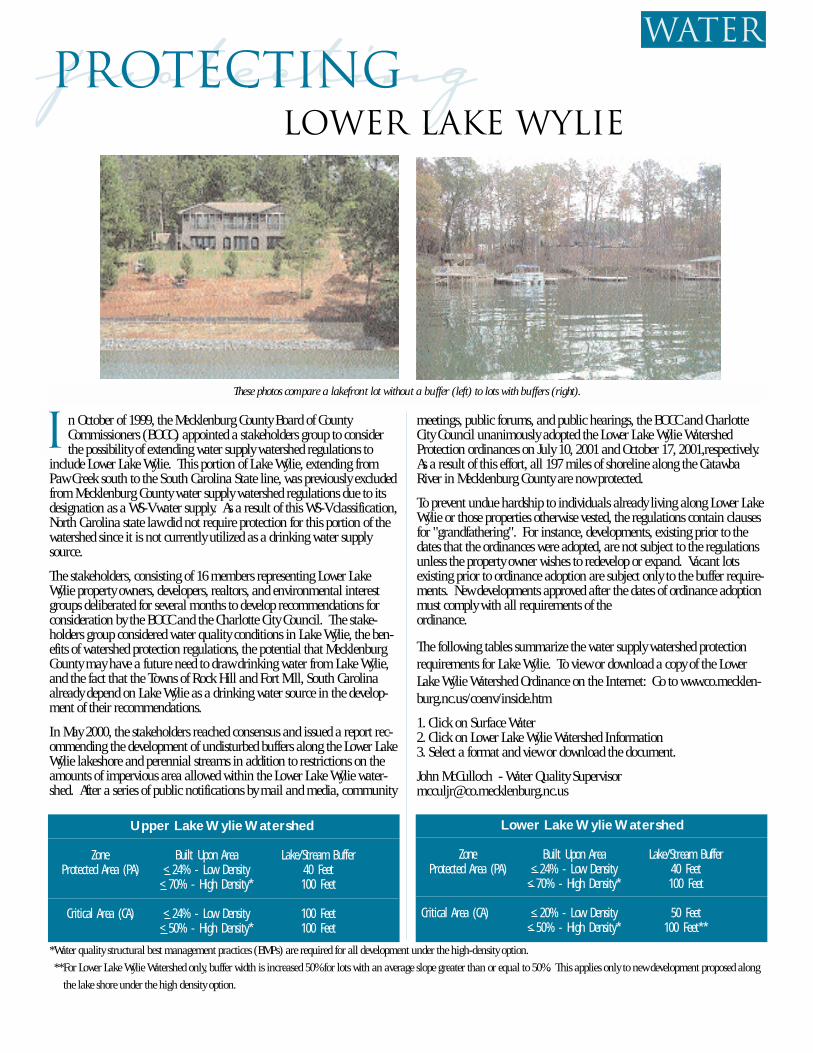
These photos compare a lakefront lot without a buffer (left) to lots with buffers (right).
I
Upper Lake Wylie Watershed
Zone Built Upon Area Lake/Stream BufferProtected Area (PA) <24% - Low Density 40 Feet
<70% - High Density* 100 Feet
Critical Area (CA) <24% - Low Density 100 Feet<50% - High Density* 100 Feet
Lower Lake Wylie Watershed
Zone Built Upon Area Lake/Stream BufferProtected Area (PA) <24% - Low Density 40 Feet
<70% - High Density* 100 Feet
Critical Area (CA) <20% - Low Density 50 Feet<50% - High Density* 100 Feet**
*Water quality structural best management practices (BMPs) are required for all development under the high-density option.
**For Lower Lake Wylie Watershed only, buffer width is increased 50% for lots with an average slope greater than or equal to 50%. This applies only to new development proposed along
the lake shore under the high density option.
delightsome rivulets
young Englishman by thename of John Lawson wasthe earliest explorer to ven-ture into the interior of NorthCarolina. His travels carried
him across the lower edge of MecklenburgCounty in 1700. In his journal, Mr. Lawsonnoted concerning Mecklenburg County that itwas “abounding in many and delightsomerivulets.” As a matter of fact, MecklenburgCounty has over 2000 miles of “delightsomerivulets” or streams which lace across itsrolling landscape. Mecklenburg County sits onthe drainage divide between the Catawba andYadkin River Basins with two-thirds of itsstreams draining west toward the Catawba andthe remaining one-third draining east to theYadkin. The western edge of the County isformed by 190 miles of shoreline along por-tions of three of the eleven lakes that comprisethe Catawba River system including LakeNorman, Mountain Island Lake and LakeWylie. It is a foregone fact that MecklenburgCounty is a “water rich” community and thatthese abundant surface waters played a majorrole in its early settlement. Pioneers, many ofthem of Scotch-Irish descent, flocked to thebanks of Mecklenburg County’s streams begin-ning in the mid 1700's. Many of these earlysettlers were accomplished millwrights and itwasn’t long until water mills sprang up alongnearly every stream having year round flow,
grinding grain into flour and poweringsawmills for producing lumber. Communitiesdeveloped around these mills and streamsquickly became the life’s blood of this areaplaying a vital role in the development ofMecklenburg.
The Catawba River also contributed tremen-dously to the early development of MecklenburgCounty. It served as a highway for early settlersmoving into the region and was also used as amajor shipping route for goods bound toCharleston for export. Beginning in the 1700's,fisheries sprang up along the banks of the riverproviding a food source for early settlers.Ferries were constructed along major trans-portation routes crossing the river followed bybridges. Another little known fact concerningthe Catawba River is that it served as a barrierpreventing federal forces from invading andlaying waste to Charlotte during the Civil War.During the spring of 1865, federal calvarymoved east towardCharlotte from the direc-tion of Lincolnton.Confederate forces underthe command of GeneralR. D. Johnston of LincolnCounty established a defen-sive position on the eastbank of the Catawba Riverin Mecklenburg Countyadjacent to the bridge atthe Rozzelle’s Ferry in thearea where BrookshireFreeway crosses MountainIsland Lake today. Federalforces reached the westbank of the river and firedupon the Confederate position but were unableto affect a river crossing and were thereby pre-vented from advancing east to Charlotte.
History of Surface Water Usesin Mecklenburg CountyThe streams and rivers of Mecklenburg Countyhave been vitally important as a major sourceof raw drinking water since the 1800's.
Charlotte’s first municipal drinking waterintake was located on Sugar Creek in 1881. In1904, the water intake was moved to IrwinCreek primarily due to declining water qualityconditions in Sugar Creek brought about bysewage discharges from inadequate and oftennonexistent collection and disposal systems. In1911, the Irwin Creek intake failed to provideCharlotte with the water it desperately neededduring a water shortage brought on by anextreme drought and water had to be broughtinto town by train from the Catawba River.This near catastrophe awakened Charlotte tothe growing needs of the community for abun-dant, clean drinking water and in 1912 the Citybegan withdrawing its water from the CatawbaRiver close to the current intake alongMountain Island Lake at the end of PumpStation Road in western Mecklenburg County.
By 1900, the population of Mecklenburg Countyhad grown to 55,268. The Catawba River and
the many streams in the County continued tobe vitally important to area residents. At thattime, Mecklenburg County was very rural innature and the quality and usability of thesewaters had continued to be very good with onlysmall, isolated pockets of pollution centeredprimarily in downtown Charlotte. Little Sugarand Sugar Creeks were the most polluted watersin the County due primarily to inadequate
water
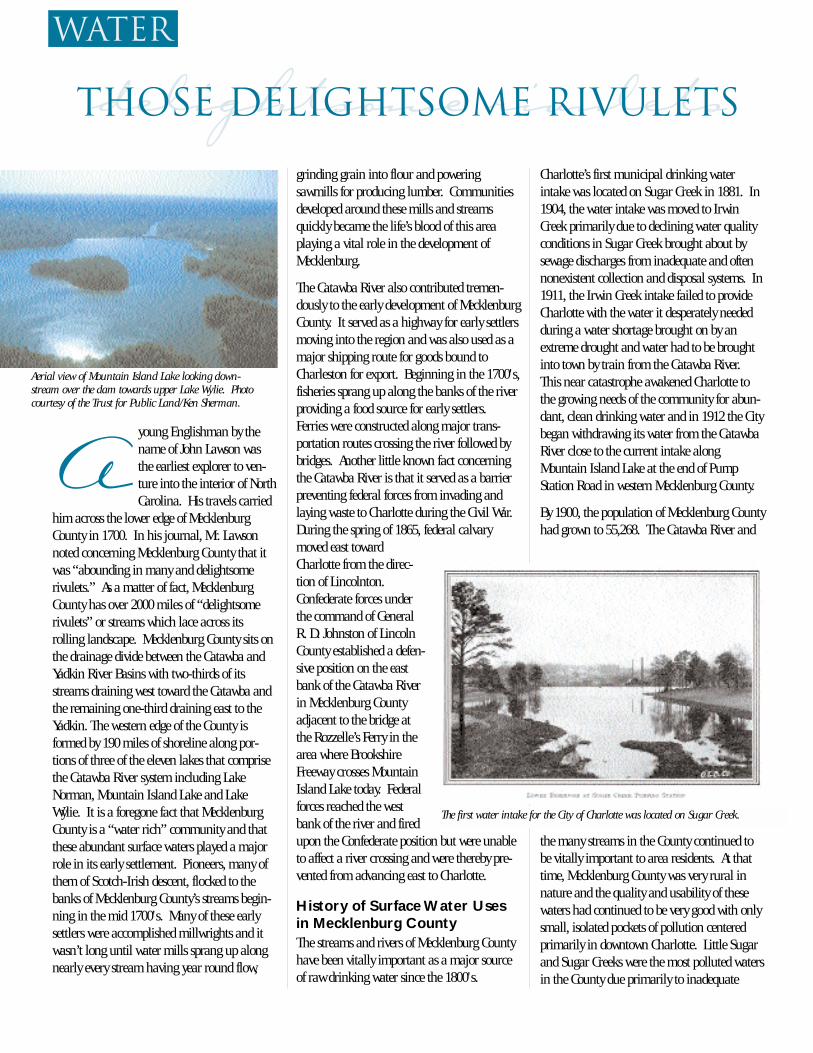
Aerial view of Mountain Island Lake looking down-stream over the dam towards upper Lake Wylie. Photocourtesy of the Trust for Public Land/Ken Sherman.
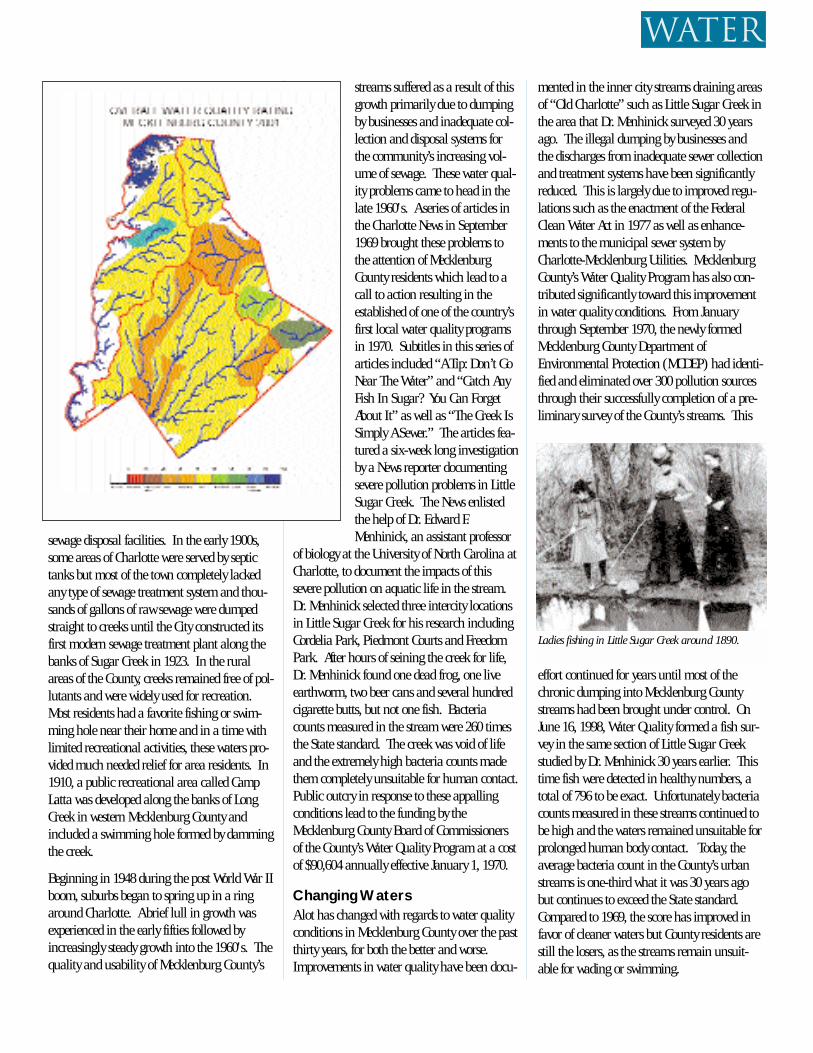
The first water intake for the City of Charlotte was located on Sugar Creek.
A
Those Delightsome Rivulets
sewage disposal facilities. In the early 1900s,some areas of Charlotte were served by septictanks but most of the town completely lackedany type of sewage treatment system and thou-sands of gallons of raw sewage were dumpedstraight to creeks until the City constructed itsfirst modern sewage treatment plant along thebanks of Sugar Creek in 1923. In the ruralareas of the County, creeks remained free of pol-lutants and were widely used for recreation.Most residents had a favorite fishing or swim-ming hole near their home and in a time withlimited recreational activities, these waters pro-vided much needed relief for area residents. In1910, a public recreational area called CampLatta was developed along the banks of LongCreek in western Mecklenburg County andincluded a swimming hole formed by dammingthe creek.
Beginning in 1948 during the post World War IIboom, suburbs began to spring up in a ringaround Charlotte. A brief lull in growth wasexperienced in the early fifties followed byincreasingly steady growth into the 1960's. Thequality and usability of Mecklenburg County’s
streams suffered as a result of thisgrowth primarily due to dumpingby businesses and inadequate col-lection and disposal systems forthe community’s increasing vol-ume of sewage. These water qual-ity problems came to head in thelate 1960's. A series of articles inthe Charlotte News in September1969 brought these problems tothe attention of MecklenburgCounty residents which lead to acall to action resulting in theestablished of one of the country’sfirst local water quality programsin 1970. Subtitles in this series ofarticles included “A Tip: Don’t GoNear The Water” and “Catch AnyFish In Sugar? You Can ForgetAbout It” as well as “The Creek IsSimply A Sewer.” The articles fea-tured a six-week long investigationby a News reporter documentingsevere pollution problems in LittleSugar Creek. The News enlistedthe help of Dr. Edward F.Menhinick, an assistant professor
of biology at the University of North Carolina atCharlotte, to document the impacts of thissevere pollution on aquatic life in the stream.Dr. Menhinick selected three intercity locationsin Little Sugar Creek for his research includingCordelia Park, Piedmont Courts and FreedomPark. After hours of seining the creek for life,Dr. Menhinick found one dead frog, one liveearthworm, two beer cans and several hundredcigarette butts, but not one fish. Bacteriacounts measured in the stream were 260 timesthe State standard. The creek was void of lifeand the extremely high bacteria counts madethem completely unsuitable for human contact.Public outcry in response to these appallingconditions lead to the funding by theMecklenburg County Board of Commissionersof the County’s Water Quality Program at a costof $90,604 annually effective January 1, 1970.
Changing WatersA lot has changed with regards to water qualityconditions in Mecklenburg County over the pastthirty years, for both the better and worse.Improvements in water quality have been docu-
mented in the inner city streams draining areasof “Old Charlotte” such as Little Sugar Creek inthe area that Dr. Menhinick surveyed 30 yearsago. The illegal dumping by businesses andthe discharges from inadequate sewer collectionand treatment systems have been significantlyreduced. This is largely due to improved regu-lations such as the enactment of the FederalClean Water Act in 1977 as well as enhance-ments to the municipal sewer system byCharlotte-Mecklenburg Utilities. MecklenburgCounty’s Water Quality Program has also con-tributed significantly toward this improvementin water quality conditions. From Januarythrough September 1970, the newly formedMecklenburg County Department ofEnvironmental Protection (MCDEP) had identi-fied and eliminated over 300 pollution sourcesthrough their successfully completion of a pre-liminary survey of the County’s streams. This
effort continued for years until most of thechronic dumping into Mecklenburg Countystreams had been brought under control. OnJune 16, 1998, Water Quality formed a fish sur-vey in the same section of Little Sugar Creekstudied by Dr. Menhinick 30 years earlier. Thistime fish were detected in healthy numbers, atotal of 796 to be exact. Unfortunately bacteriacounts measured in these streams continued tobe high and the waters remained unsuitable forprolonged human body contact. Today, theaverage bacteria count in the County’s urbanstreams is one-third what it was 30 years agobut continues to exceed the State standard.Compared to 1969, the score has improved infavor of cleaner waters but County residents arestill the losers, as the streams remain unsuit-able for wading or swimming.
water
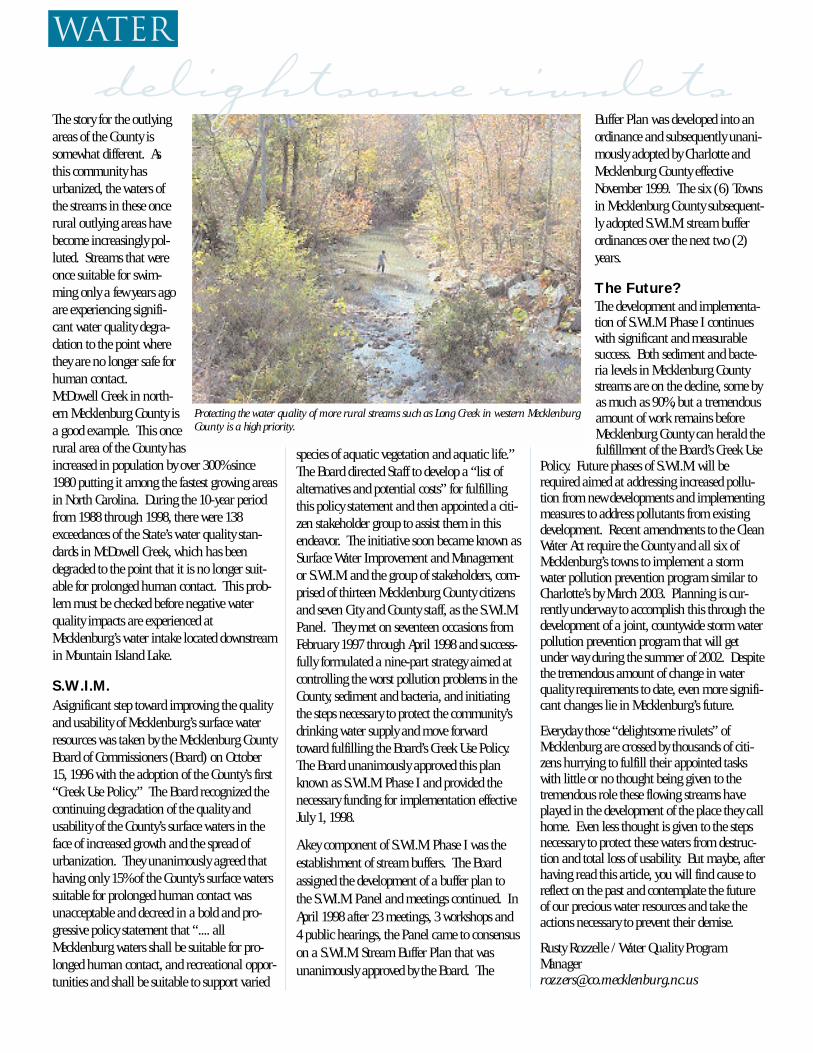
Ladies fishing in Little Sugar Creek around 1890.
The story for the outlyingareas of the County issomewhat different. Asthis community hasurbanized, the waters ofthe streams in these oncerural outlying areas havebecome increasingly pol-luted. Streams that wereonce suitable for swim-ming only a few years agoare experiencing signifi-cant water quality degra-dation to the point wherethey are no longer safe forhuman contact.McDowell Creek in north-ern Mecklenburg County isa good example. This oncerural area of the County hasincreased in population by over 300% since1980 putting it among the fastest growing areasin North Carolina. During the 10-year periodfrom 1988 through 1998, there were 138exceedances of the State’s water quality stan-dards in McDowell Creek, which has beendegraded to the point that it is no longer suit-able for prolonged human contact. This prob-lem must be checked before negative waterquality impacts are experienced atMecklenburg’s water intake located downstreamin Mountain Island Lake.
S.W.I.M.A significant step toward improving the qualityand usability of Mecklenburg’s surface waterresources was taken by the Mecklenburg CountyBoard of Commissioners (Board) on October15, 1996 with the adoption of the County’s first“Creek Use Policy.” The Board recognized thecontinuing degradation of the quality andusability of the County’s surface waters in theface of increased growth and the spread ofurbanization. They unanimously agreed thathaving only 15% of the County’s surface waterssuitable for prolonged human contact wasunacceptable and decreed in a bold and pro-gressive policy statement that “.... allMecklenburg waters shall be suitable for pro-longed human contact, and recreational oppor-tunities and shall be suitable to support varied
species of aquatic vegetation and aquatic life.”The Board directed Staff to develop a “list ofalternatives and potential costs” for fulfillingthis policy statement and then appointed a citi-zen stakeholder group to assist them in thisendeavor. The initiative soon became known asSurface Water Improvement and Managementor S.W.I.M. and the group of stakeholders, com-prised of thirteen Mecklenburg County citizensand seven City and County staff, as the S.W.I.M.Panel. They met on seventeen occasions fromFebruary 1997 through April 1998 and success-fully formulated a nine-part strategy aimed atcontrolling the worst pollution problems in theCounty, sediment and bacteria, and initiatingthe steps necessary to protect the community’sdrinking water supply and move forwardtoward fulfilling the Board’s Creek Use Policy.The Board unanimously approved this planknown as S.W.I.M. Phase I and provided thenecessary funding for implementation effectiveJuly 1, 1998.
A key component of S.W.I.M. Phase I was theestablishment of stream buffers. The Boardassigned the development of a buffer plan tothe S.W.I.M. Panel and meetings continued. InApril 1998 after 23 meetings, 3 workshops and4 public hearings, the Panel came to consensuson a S.W.I.M. Stream Buffer Plan that wasunanimously approved by the Board. The
Buffer Plan was developed into anordinance and subsequently unani-mously adopted by Charlotte andMecklenburg County effectiveNovember 1999. The six (6) Townsin Mecklenburg County subsequent-ly adopted S.W.I.M. stream bufferordinances over the next two (2)years.
The Future?The development and implementa-tion of S.W.I.M. Phase I continueswith significant and measurablesuccess. Both sediment and bacte-ria levels in Mecklenburg Countystreams are on the decline, some byas much as 90%, but a tremendousamount of work remains beforeMecklenburg County can herald thefulfillment of the Board’s Creek Use
Policy. Future phases of S.W.I.M. will berequired aimed at addressing increased pollu-tion from new developments and implementingmeasures to address pollutants from existingdevelopment. Recent amendments to the CleanWater Act require the County and all six ofMecklenburg’s towns to implement a stormwater pollution prevention program similar toCharlotte’s by March 2003. Planning is cur-rently underway to accomplish this through thedevelopment of a joint, countywide storm waterpollution prevention program that will getunder way during the summer of 2002. Despitethe tremendous amount of change in waterquality requirements to date, even more signifi-cant changes lie in Mecklenburg’s future.
Everyday those “delightsome rivulets” ofMecklenburg are crossed by thousands of citi-zens hurrying to fulfill their appointed taskswith little or no thought being given to thetremendous role these flowing streams haveplayed in the development of the place they callhome. Even less thought is given to the stepsnecessary to protect these waters from destruc-tion and total loss of usability. But maybe, afterhaving read this article, you will find cause toreflect on the past and contemplate the futureof our precious water resources and take theactions necessary to prevent their demise.
Rusty Rozzelle / Water Quality [email protected]
water
Protecting the water quality of more rural streams such as Long Creek in western MecklenburgCounty is a high priority.
delightsome rivulets
governingthe lakes
s the sun sets over Lake Norman, water skiers take advantage of the calmer waters that earlier were chop-py and busy with boaters, jet skiers, and fishermen. On Mountain Island Lake, bird watchers quietlyobserve as a great blue heron searches for a meal. Lake Norman, Lake Wylie, and Mountain Island Lake
provide an abundance of recreational opportunities for Mecklenburg County citizens. Whether you’re a fisherman,a water skier, or a bird watcher, these lakes have something for everyone.
Of course, these lakes know no political boundaries and are shared by several counties and towns. In fact, LakeWylie is the only Catawba River Lake that is shared by two states, North Carolina and South Carolina. As youmay imagine, with individual interests involving a shared resource, conflicts may arise. These conflicts come inthe form of safety, environmental, and lake use issues. The marine commissions of Lake Norman, Lake Wylie, andMountain Island Lake were formed in order to facilitate various issues regarding the lakes. The marine commis-sions are units of local government, and were created through legislative acts by the General Assembly and jointresolutions from the various counties that border each lake. Each county, through the various boards of countycommissioners, appoints each marine commissioner, which provides equal representation across the lakes. Thethree marine commissions hold public meetings once every month. The commission meetings provide a publicforum in which lake users can share their concerns and interests with the board. The marine commissions partnerwith various law enforcement, regulatory, and volunteer groups to address lake issues.
During 1999, the marine commissions were involved in several environmental issues, which helped to strengthenenvironmental protection along our lakes. Some of these issues include:
• The restoration of 2 2 acres of wetlands in Lake Wylie that were destroyed by development activities;
• The implementation of sewage pump out station regulations at marinas;
• Providing comments to various regulatory agencies regarding shoreline management guidelines, new develop-ments plans, and water quality plans; and
• Providing citizens and neighborhood groups with information on environmental protection, regulations, andappropriate contacts.
In addition to environmental issues, the marine commissions also addressed several safety issues such as: agerestrictions and safety class requirements for jet ski operators; no wake zones; and maintenance of shallow waterand channel markers. In response to citizen complaints, the marine commissions have also encouraged increasedlaw enforcement coverage on the lakes.
With the rapidly increasing population and use of our lakes, environmental and safety issues will be on the rise.The marine commissions provide a governing body, representing all jurisdictions to ensure safe and healthy lakesfor the region.
Additional information may be obtained about the Lake Wylie and Mountain Island Lake Marine Commissions from MichaelMcLaurin at (704) 372-2416. Information about the Lake Norman Marine Commission may be obtained from Ron Smith at 1-800-464-7512.
Michael McLaurin / Centralia Council of [email protected]
Governing the Lakes
water
A
outh-central Mecklenburg County
is busting at the seams with
people, homes, office buildings,
industries, shopping malls, roads,
and parking lots. The area includes places like
downtown Charlotte, Charlotte-Douglas
International Airport, Charlotte Coliseum,
South Park and Eastland Malls, and the Towns
of Pineville and Matthews. Think of all the
pollution running off places like these into our
surface waters. Not surprising, streams in
south-central Mecklenburg have among the
worst water quality in the county.
Approximately 163 miles of streams (not
including tributaries) run throughout south-
central Mecklenburg. See if you recognize any
of the following: Six Mile Creek, McAlpine
Creek, Campbell Creek, Irvins Creek, Four Mile
Creek, McMullen Creek, Briar Creek, Edwards
Branch, Little Sugar Creek, Dairy Branch, Little
Hope Creek, Sugar Creek, Irwin Creek, Stewart
Creek, Taggart Creek, Coffey Creek, Kings
Branch, and Steele Creek. All of these streams
come together as Sugar Creek, which eventually
flows into the Catawba River approximately five
miles southeast of Fort Mill, SC.
Surface Water
Quality Reflects
Land Use
The way we use the land
has always impacted the
quality of surface waters
- and not for the better.
Surface waters have gen-
erally perished at the
expense of growth, espe-
cially in south-central
Mecklenburg. Except for the westernmost and
southernmost areas of south-central
Mecklenburg, most of the land is almost com-
pletely developed. Yet growth continues at a
fast pace. Experiencing the most growth in
recent years has been the area south of I-485,
especially around Ballantyne and areas near
Union County. The result has been consistent
fair to poor-fair water quality ratings in Four
Mile and Six Mile Creeks over the past five
years.
Two major forces expect-
ed to drive future devel-
opment will be I-485 and
the proposed transit
corridors. New roads cre-
ate new places to build.
You can see it already at
existing interchanges
along I-485. Proposed
land use at the inter-
changes will be a mixture of commercial,
office, industrial, and residential zoning. A
shining star in terms of its implications for
managed growth and environmental protection
is the development of transit corridors through
water
urbanismSouth-Central Streams
Suffer Impacts of
Urbanism
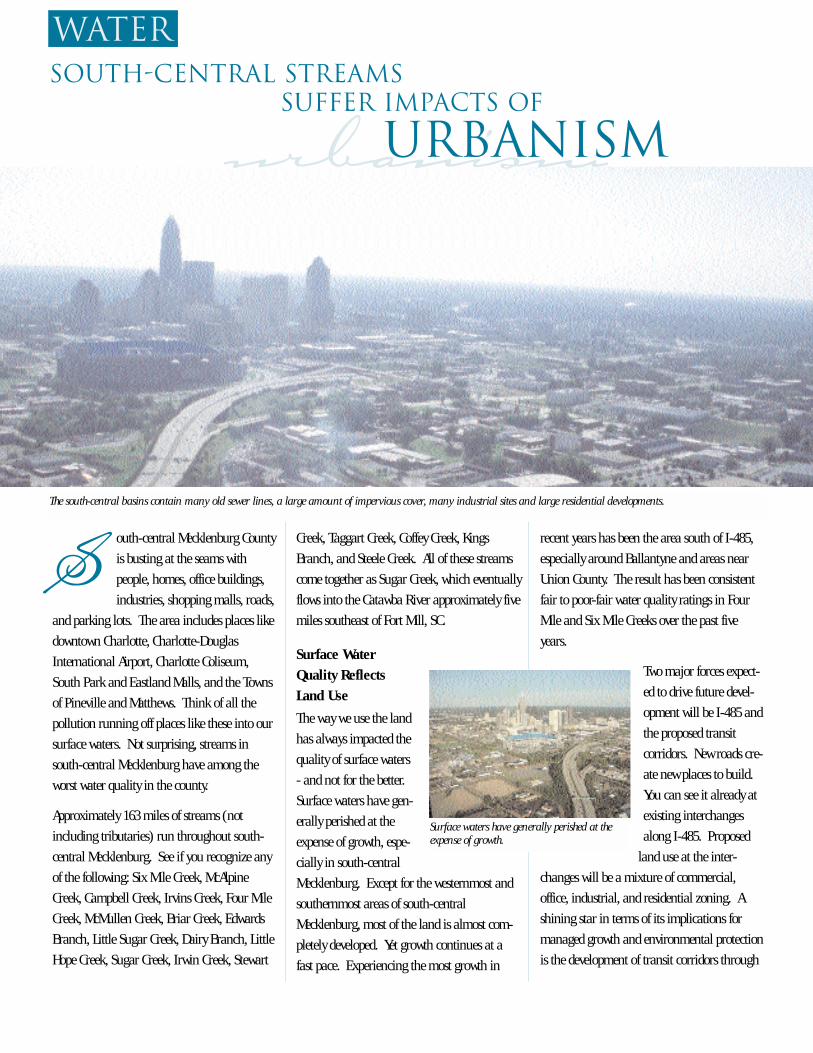
The south-central basins contain many old sewer lines, a large amount of impervious cover, many industrial sites and large residential developments.
Surface waters have generally perished at theexpense of growth.
S
south-central Mecklenburg. Light rail is rec-
ommended to run on the existing line that
parallels South Boulevard. A busway, already
partially constructed, is recommended for the
Independence corridor. Land use plans recom-
mend that density be established along these
corridors to increase ridership opportunities
near home and work and to minimize growth
in other areas of the county. Such planning is
part of the Smart Growth initiative, which
received attention in 1999. Smart Growth is a
way of balancing growth with environmental
responsibility. It involves measures such as
controlling sprawl, rural and open space
protection, and transportation alternatives.
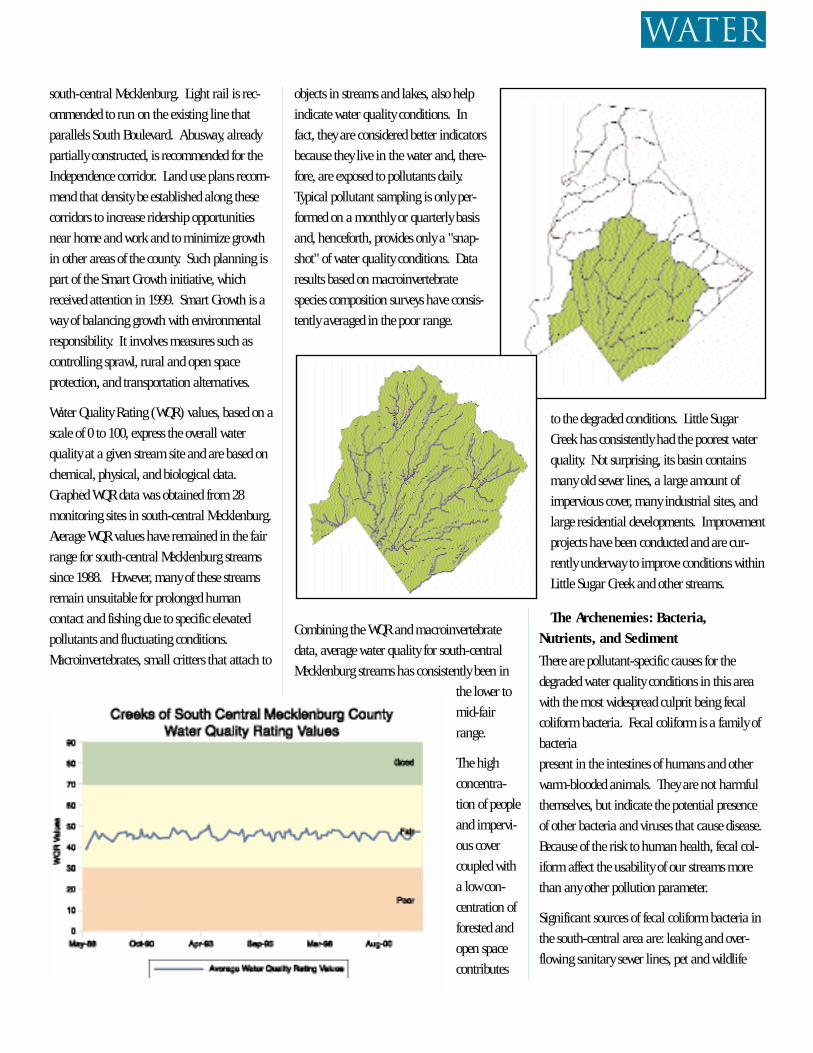
Water Quality Rating (WQR) values, based on a
scale of 0 to 100, express the overall water
quality at a given stream site and are based on
chemical, physical, and biological data.
Graphed WQR data was obtained from 28
monitoring sites in south-central Mecklenburg.
Average WQR values have remained in the fair
range for south-central Mecklenburg streams
since 1988. However, many of these streams
remain unsuitable for prolonged human
contact and fishing due to specific elevated
pollutants and fluctuating conditions.
Macroinvertebrates, small critters that attach to
objects in streams and lakes, also help
indicate water quality conditions. In
fact, they are considered better indicators
because they live in the water and, there-
fore, are exposed to pollutants daily.
Typical pollutant sampling is only per-
formed on a monthly or quarterly basis
and, henceforth, provides only a "snap-
shot" of water quality conditions. Data
results based on macroinvertebrate
species composition surveys have consis-
tently averaged in the poor range.
Combining the WQR and macroinvertebrate
data, average water quality for south-central
Mecklenburg streams has consistently been in
the lower to
mid-fair
range.
The high
concentra-
tion of people
and impervi-
ous cover
coupled with
a low con-
centration of
forested and
open space
contributes
to the degraded conditions. Little Sugar
Creek has consistently had the poorest water
quality. Not surprising, its basin contains
many old sewer lines, a large amount of
impervious cover, many industrial sites, and
large residential developments. Improvement
projects have been conducted and are cur-
rently underway to improve conditions within
Little Sugar Creek and other streams.
The Archenemies: Bacteria,
Nutrients, and Sediment
There are pollutant-specific causes for the
degraded water quality conditions in this area
with the most widespread culprit being fecal
coliform bacteria. Fecal coliform is a family of
bacteria
present in the intestines of humans and other
warm-blooded animals. They are not harmful
themselves, but indicate the potential presence
of other bacteria and viruses that cause disease.
Because of the risk to human health, fecal col-
iform affect the usability of our streams more
than any other pollution parameter.
Significant sources of fecal coliform bacteria in
the south-central area are: leaking and over-
flowing sanitary sewer lines, pet and wildlife
water
waste, illegal dumping, and illicit connections
of sanitary wastewater. There were 196 dis-
charges from municipal sanitary sewer lines
reported in south-central basins in 2001.
Sewage overflows are common in many munic-
ipalities with old sewer systems. The problem is
exacerbated in Mecklenburg County due to the
increasing number of people and businesses
connecting to the system. To address this,
Charlotte-Mecklenburg Utilities (CMU) has
taken the reigns on complying with the new
rules, including notifying the public of sewage
overflows and increasing response time to
reported overflows. They have also implement-
ed an aggressive sewer line cleaning, repair,
and rehabilitation program and an educational
campaign about proper grease disposal.
The NC state baseflow fecal coliform standard
for the class of streams located in south-central
Mecklenburg is a geometric mean of 400
colonies/100 ml of sample water. Median fecal
coliform levels exceeded the standard in many
streams in 2001, including Briar, Little Sugar,
Stewart, Taggart, Irwin, Steele, McAlpine,
McMullen, Irvins, Six Mile, and Kings Branch.
Little Sugar had the highest average at 355
colonies/100 ml, followed by Taggart with 345,
Briar with 335, and Stewart with 305.
Incidentally, these basins had among the high-
est reported numbers of sewer overflows per
land area in 2001. Briar, Little Sugar, and
McAlpine Creeks are on North Carolina’s list of
impaired waters for chronic exceedances of the
fecal coliform standard. All states are required
by the EPA to develop a list of waters, called the
303(d) list, not meeting water quality standards
or not supporting designated uses. States are
then required, on a priority basis, to develop
Total Maximum Daily Loads (TMDLs) or man-
agement strategies for 303(d) listed waters to
address impairment. A TMDL is the total daily
amount of a pollutant that a water body can
assimilate without jeopardizing water quality
standards or desig-
nated uses.
Pollutant sources are
allocated a certain
portion of this load
and are only allowed
to discharge up to
their allotted pollu-
tant load.
Nutrients are anoth-
er significant form of
pollution in south-
central Mecklenburg
streams. Nutrients are elemental forms of
phosphorus, nitrogen, and carbon that are
essential for growth and ecosystem health. In
excessive amounts (especially phosphorus),
nutrients can impair surface waters by causing
excessive algae growth, reduced transparency,
and undesirable shifts in fish populations.
Excessive algae growth sometimes causes dis-
solved oxygen to drop below levels necessary to
sustain fish and other aquatic life. The main
sources of nutrients in south-central
Mecklenburg are Wastewater Treatment Plant
(WWTP) discharges. As a result, in January
2002, Charlotte City Council leaders gave the
green light to an unprecedented three-way
agreement between North Carolina, South
Carolina, and CMU that will enhance water
quality in the Catawba River Basin. The agree-
ment includes a five-year, $47 million commit-
ment by CMU to slash phosphorus levels by
70% in water released from the McAlpine Creek,
Sugar Creek and Irwin Creek Wastewater
Treatment Plants. The 70% reduction of phos-
phorus was agreed upon by the South Carolina
Department of Health and Environmental
Control and the North Carolina Department of
Environment and Natural Resources and will
aid water quality efforts in South Carolina’s
lower Catawba region. Other sources of nutri-
ents include chemical fertilizers, leaking and
water
Little Sugar Creek winds through Cordelia Park before entering Uptown Charlotte.
urbanism
overflowing sewer lines, pet and wildlife waste,
sediment runoff, decaying organic material,
and atmospheric deposition.
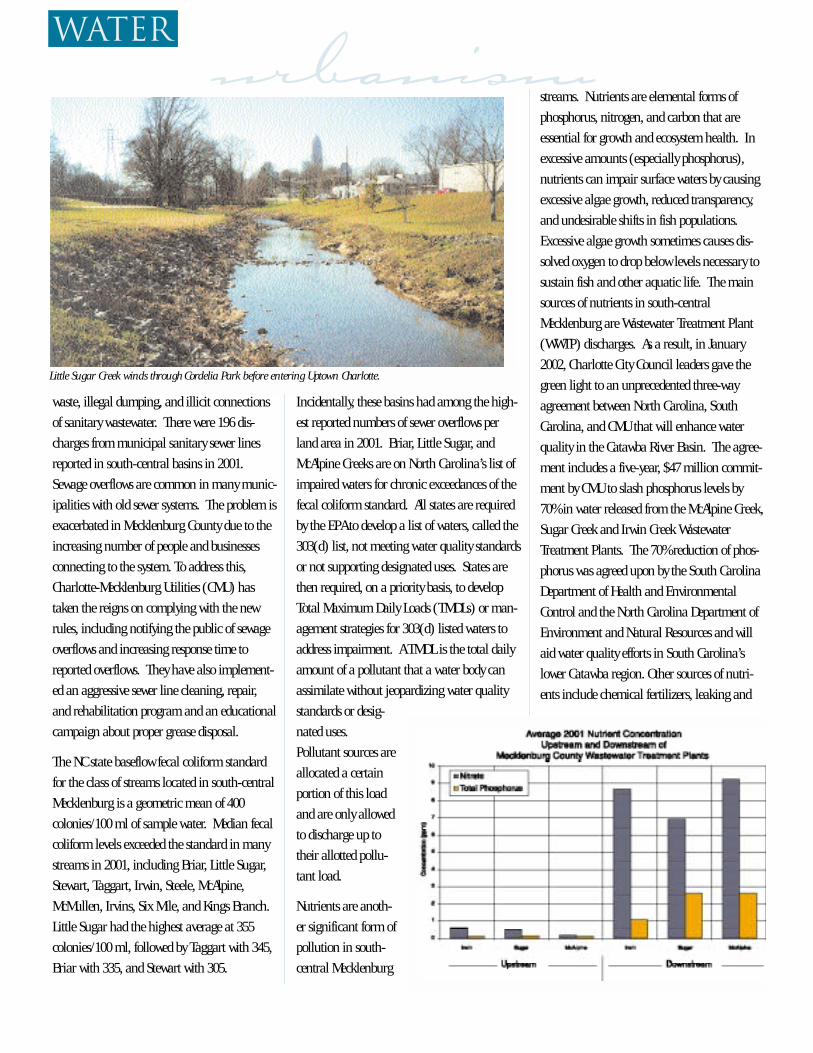
Data in 2001 and in previous years show that,
during ambient stream conditions (no rain in
past 72 hours), wastewater treatment plants are
a large source of nutrient loading to streams.
Averages in 2001 for total phosphorus and
nitrate-nitrogen levels upstream and down-
stream of the three major wastewater treatment
plants in south-central Mecklenburg show that
wastewater effluent contributes heavily to
instream nutrient concentrations.
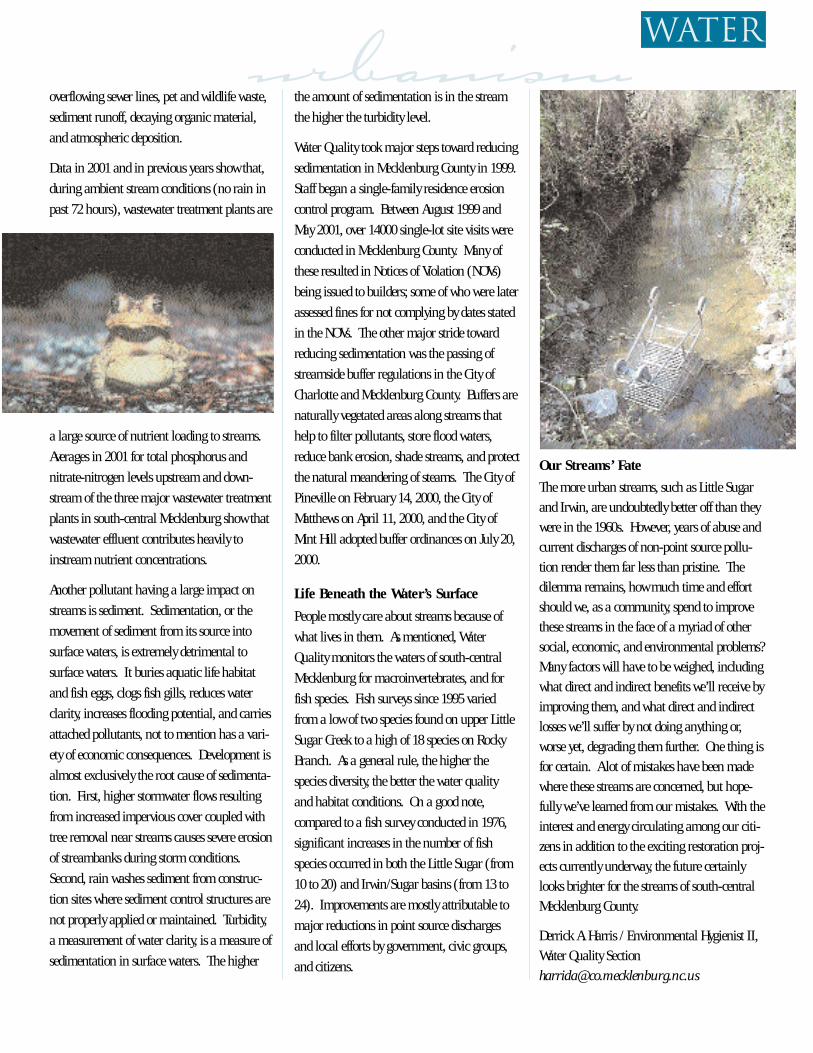
Another pollutant having a large impact on
streams is sediment. Sedimentation, or the
movement of sediment from its source into
surface waters, is extremely detrimental to
surface waters. It buries aquatic life habitat
and fish eggs, clogs fish gills, reduces water
clarity, increases flooding potential, and carries
attached pollutants, not to mention has a vari-
ety of economic consequences. Development is
almost exclusively the root cause of sedimenta-
tion. First, higher stormwater flows resulting
from increased impervious cover coupled with
tree removal near streams causes severe erosion
of streambanks during storm conditions.
Second, rain washes sediment from construc-
tion sites where sediment control structures are
not properly applied or maintained. Turbidity,
a measurement of water clarity, is a measure of
sedimentation in surface waters. The higher
the amount of sedimentation is in the stream
the higher the turbidity level.
Water Quality took major steps toward reducing
sedimentation in Mecklenburg County in 1999.
Staff began a single-family residence erosion
control program. Between August 1999 and
May 2001, over 14000 single-lot site visits were
conducted in Mecklenburg County. Many of
these resulted in Notices of Violation (NOVs)
being issued to builders; some of who were later
assessed fines for not complying by dates stated
in the NOVs. The other major stride toward
reducing sedimentation was the passing of
streamside buffer regulations in the City of
Charlotte and Mecklenburg County. Buffers are
naturally vegetated areas along streams that
help to filter pollutants, store flood waters,
reduce bank erosion, shade streams, and protect
the natural meandering of steams. The City of
Pineville on February 14, 2000, the City of
Matthews on April 11, 2000, and the City of
Mint Hill adopted buffer ordinances on July 20,
2000.
Life Beneath the Water’s Surface
People mostly care about streams because of
what lives in them. As mentioned, Water
Quality monitors the waters of south-central
Mecklenburg for macroinvertebrates, and for
fish species. Fish surveys since 1995 varied
from a low of two species found on upper Little
Sugar Creek to a high of 18 species on Rocky
Branch. As a general rule, the higher the
species diversity, the better the water quality
and habitat conditions. On a good note,
compared to a fish survey conducted in 1976,
significant increases in the number of fish
species occurred in both the Little Sugar (from
10 to 20) and Irwin/Sugar basins (from 13 to
24). Improvements are mostly attributable to
major reductions in point source discharges
and local efforts by government, civic groups,
and citizens.
Our Streams’ Fate
The more urban streams, such as Little Sugar
and Irwin, are undoubtedly better off than they
were in the 1960s. However, years of abuse and
current discharges of non-point source pollu-
tion render them far less than pristine. The
dilemma remains, how much time and effort
should we, as a community, spend to improve
these streams in the face of a myriad of other
social, economic, and environmental problems?
Many factors will have to be weighed, including
what direct and indirect benefits we’ll receive by
improving them, and what direct and indirect
losses we’ll suffer by not doing anything or,
worse yet, degrading them further. One thing is
for certain. A lot of mistakes have been made
where these streams are concerned, but hope-
fully we’ve learned from our mistakes. With the
interest and energy circulating among our citi-
zens in addition to the exciting restoration proj-
ects currently underway, the future certainly
looks brighter for the streams of south-central
Mecklenburg County.
Derrick A. Harris / Environmental Hygienist II,
Water Quality Section
waterurbanism
he Edwards Branch water quality improvement project is a demon-stration project that will evaluate the feasibility and cost effectiveness
of restoring degraded waters in an urban setting using established BestManagement Practices (BMPs). BMPs are structural and non-structuralmethods used to improve storm water quality and control storm waterquantity. Most structural BMPs work by providing a temporary storage ofstorm water runoff, allowing pollutants to settle out and be consumed by physical and biological processes before being discharged into the receiv-ing waters. Examples of a non-structural BMP include public educationinitiatives such as storm drain stenciling and fertilizer/pesticide applica-tion education programs.
The proposed BMP plan for the Edwards Branch watershed includes thedesign and implementation of wet ponds, extended detention systems,bioretention areas, riparian buffers, level spreaders, stream bank stabi-lization, riparian buffers, stream channel restoration, a constructed wet-land and targeted public education programs. In addition to water quali-ty improvement goals, the project also hopes to improve aquatic habitatthrough the construction of riffles and pools along the tributaries ofEdwards Branch.
As part of Mecklenburg County’s Surface Water Improvement andManagement (SWIM) initiative, a comprehensive restoration project inthe Edwards Branch watershed is underway. The one square mile water-shed is "built out" and highly urbanized and has multiple land usesincluding residential, commercial and industrial. It contains EdwardsBranch, a tributary to Briar Creek, with its three tributaries as well as twoponds. Its waters have been impaired by non-point source pollution suchas fecal coliform bacteria, sediment, nutrients and metals that are washedoff the land surface during storms. The goal of the project is to restore
waters in Edwards Branch to "fishable and swimmable"conditions. The North Carolina Clean WaterManagement Trust Fund is providing funding for thewater quality components of the project. This waterquality project is coordinated closely with an ongoingCity of Charlotte Storm Water services (CSWS) flood con-trol and stream restoration project. This coordinationdemonstrates that flood control and water qualityimprovement can be achieved simultaneously.
In March of 2001, volunteers from the Sierra Clubplanted some 1000 live stakes and trees around PiersonPond, which serves as storm water BMP. Vegetativebuffers help to slow storm water flows, allowing pollu-tants to settle out and infiltrate through the ground.
In July 2001 construction began on an extended deten-tion system and a constructed wetland. The extended detention system,located in the Misty Woods Apartments, will treat storm water runoff fromcommercial and residential properties located along Central Avenue. Theextended detention system will temporarily pond storm water, allowingpollutants to settle out, before slowly draining out over a 48-72 hour peri-od. The system will also utilize shoreline plantings, a grass buffer andsoil bioengineering to promote infiltration and pollutant uptake.
The constructed wetland, located in Sheffield Park, will treat storm waterrun off from 52 acres of primarily residential areas. The wetland con-tains two deep-water cells for storage and treatment as well as a perma-nent pool at the wetland outlet structure. The wetland will utilize several vegetative zones including an upland grass buffer, woody vegeta-tion as well as marsh, transitional and deep aquatic plantings. A smallercreek, Winterfield tributary, has been relocated at the wetland site. Thenew Winterfield tributary employs a natural channel design allowing fora meandering stream channel with vegetative banks as opposed to astraightened channel with riprap lined banks.
A storm water quality monitoring station has been installed at the outletof the watershed that will be used to conduct baseline, construction andpost construction monitoring. In addition, stream habitat assessment,fish and macroinvertebrate studies and channel cross section monitoringhave been and will continue to be used to collect data to justify imple-mentation of successful BMPs throughout the County. It is anticipatedthat the Edwards Branch restoration project will pave the way for futuresimilar projects in an effort to restore and protect the waters ofMecklenburg County.
Richard L. Farmer / Water Quality [email protected]
into an East Charlotte WatershedBREATHing life
water
watershed
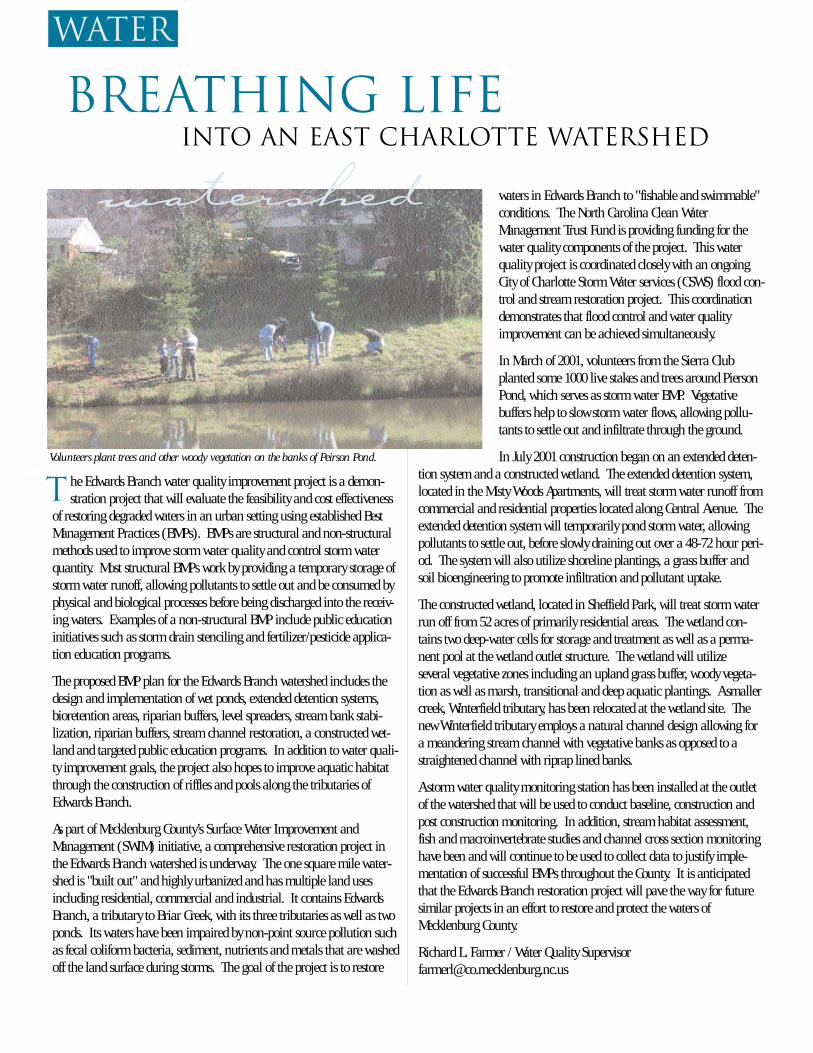
Volunteers plant trees and other woody vegetation on the banks of Peirson Pond.
T
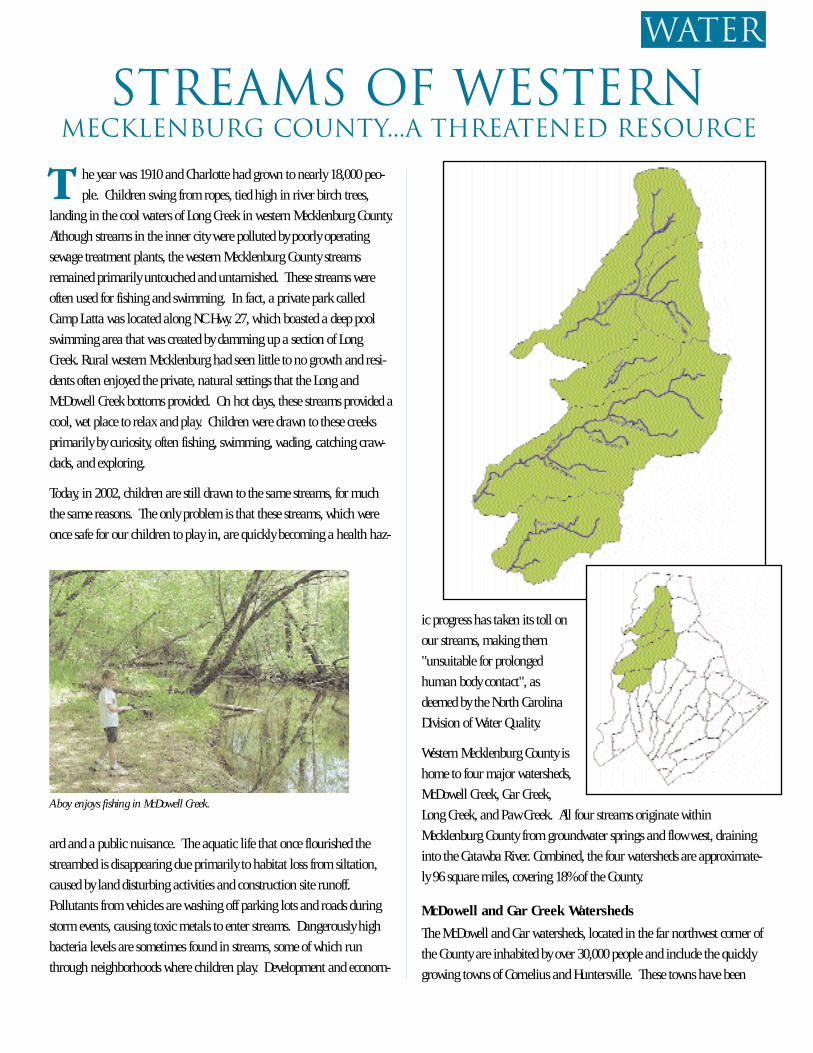
he year was 1910 and Charlotte had grown to nearly 18,000 peo-
ple. Children swing from ropes, tied high in river birch trees,
landing in the cool waters of Long Creek in western Mecklenburg County.
Although streams in the inner city were polluted by poorly operating
sewage treatment plants, the western Mecklenburg County streams
remained primarily untouched and untarnished. These streams were
often used for fishing and swimming. In fact, a private park called
Camp Latta was located along NC Hwy. 27, which boasted a deep pool
swimming area that was created by damming up a section of Long
Creek. Rural western Mecklenburg had seen little to no growth and resi-
dents often enjoyed the private, natural settings that the Long and
McDowell Creek bottoms provided. On hot days, these streams provided a
cool, wet place to relax and play. Children were drawn to these creeks
primarily by curiosity, often fishing, swimming, wading, catching craw-
dads, and exploring.
Today, in 2002, children are still drawn to the same streams, for much
the same reasons. The only problem is that these streams, which were
once safe for our children to play in, are quickly becoming a health haz-
ard and a public nuisance. The aquatic life that once flourished the
streambed is disappearing due primarily to habitat loss from siltation,
caused by land disturbing activities and construction site runoff.
Pollutants from vehicles are washing off parking lots and roads during
storm events, causing toxic metals to enter streams. Dangerously high
bacteria levels are sometimes found in streams, some of which run
through neighborhoods where children play. Development and econom-
ic progress has taken its toll on
our streams, making them
"unsuitable for prolonged
human body contact", as
deemed by the North Carolina
Division of Water Quality.
Western Mecklenburg County is
home to four major watersheds,
McDowell Creek, Gar Creek,
Long Creek, and Paw Creek. All four streams originate within
Mecklenburg County from groundwater springs and flow west, draining
into the Catawba River. Combined, the four watersheds are approximate-
ly 96 square miles, covering 18% of the County.
McDowell and Gar Creek Watersheds
The McDowell and Gar watersheds, located in the far northwest corner of
the County are inhabited by over 30,000 people and include the quickly
growing towns of Cornelius and Huntersville. These towns have been
T
water
A boy enjoys fishing in McDowell Creek.
Streams of WesternMecklenburg County...A Threatened Resource
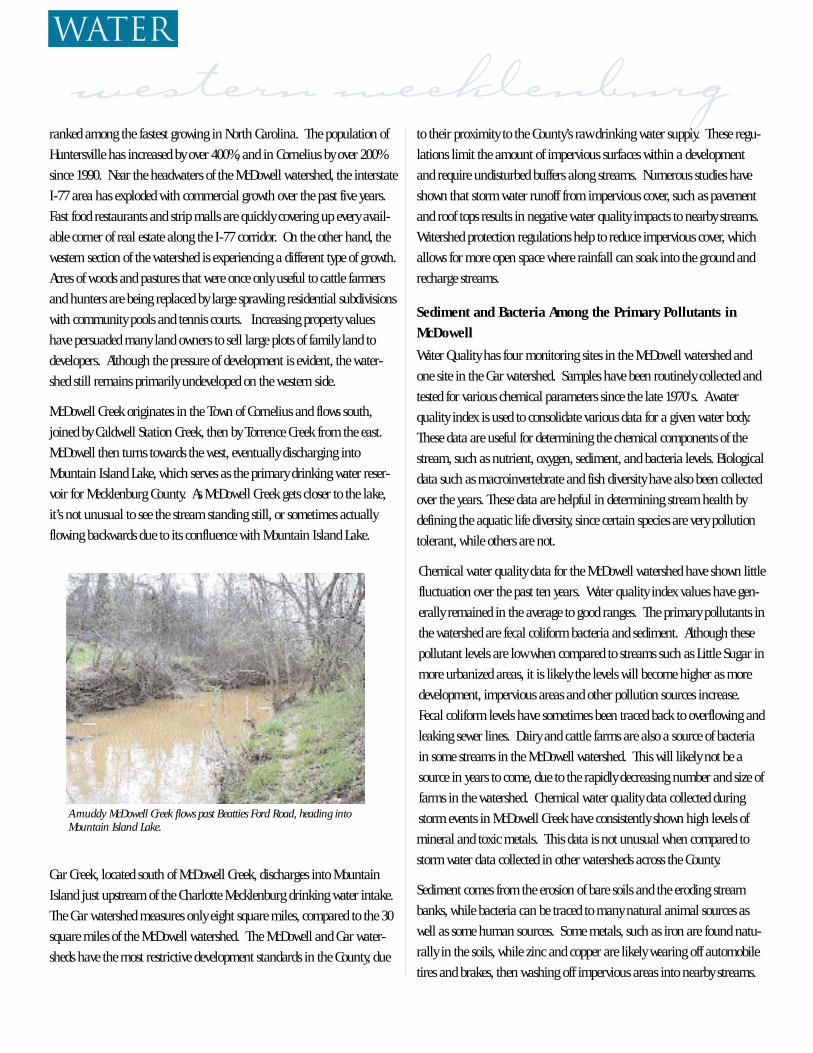
ranked among the fastest growing in North Carolina. The population of
Huntersville has increased by over 400%, and in Cornelius by over 200%
since 1990. Near the headwaters of the McDowell watershed, the interstate
I-77 area has exploded with commercial growth over the past five years.
Fast food restaurants and strip malls are quickly covering up every avail-
able corner of real estate along the I-77 corridor. On the other hand, the
western section of the watershed is experiencing a different type of growth.
Acres of woods and pastures that were once only useful to cattle farmers
and hunters are being replaced by large sprawling residential subdivisions
with community pools and tennis courts. Increasing property values
have persuaded many land owners to sell large plots of family land to
developers. Although the pressure of development is evident, the water-
shed still remains primarily undeveloped on the western side.
McDowell Creek originates in the Town of Cornelius and flows south,
joined by Caldwell Station Creek, then by Torrence Creek from the east.
McDowell then turns towards the west, eventually discharging into
Mountain Island Lake, which serves as the primary drinking water reser-
voir for Mecklenburg County. As McDowell Creek gets closer to the lake,
it’s not unusual to see the stream standing still, or sometimes actually
flowing backwards due to its confluence with Mountain Island Lake.
Gar Creek, located south of McDowell Creek, discharges into Mountain
Island just upstream of the Charlotte Mecklenburg drinking water intake.
The Gar watershed measures only eight square miles, compared to the 30
square miles of the McDowell watershed. The McDowell and Gar water-
sheds have the most restrictive development standards in the County, due
to their proximity to the County’s raw drinking water supply. These regu-
lations limit the amount of impervious surfaces within a development
and require undisturbed buffers along streams. Numerous studies have
shown that storm water runoff from impervious cover, such as pavement
and roof tops results in negative water quality impacts to nearby streams.
Watershed protection regulations help to reduce impervious cover, which
allows for more open space where rainfall can soak into the ground and
recharge streams.
Sediment and Bacteria Among the Primary Pollutants in
McDowell
Water Quality has four monitoring sites in the McDowell watershed and
one site in the Gar watershed. Samples have been routinely collected and
tested for various chemical parameters since the late 1970's. A water
quality index is used to consolidate various data for a given water body.
These data are useful for determining the chemical components of the
stream, such as nutrient, oxygen, sediment, and bacteria levels. Biological
data such as macroinvertebrate and fish diversity have also been collected
over the years. These data are helpful in determining stream health by
defining the aquatic life diversity, since certain species are very pollution
tolerant, while others are not.
Chemical water quality data for the McDowell watershed have shown little
fluctuation over the past ten years. Water quality index values have gen-
erally remained in the average to good ranges. The primary pollutants in
the watershed are fecal coliform bacteria and sediment. Although these
pollutant levels are low when compared to streams such as Little Sugar in
more urbanized areas, it is likely the levels will become higher as more
development, impervious areas and other pollution sources increase.
Fecal coliform levels have sometimes been traced back to overflowing and
leaking sewer lines. Dairy and cattle farms are also a source of bacteria
in some streams in the McDowell watershed. This will likely not be a
source in years to come, due to the rapidly decreasing number and size of
farms in the watershed. Chemical water quality data collected during
storm events in McDowell Creek have consistently shown high levels of
mineral and toxic metals. This data is not unusual when compared to
storm water data collected in other watersheds across the County.
Sediment comes from the erosion of bare soils and the eroding stream
banks, while bacteria can be traced to many natural animal sources as
well as some human sources. Some metals, such as iron are found natu-
rally in the soils, while zinc and copper are likely wearing off automobile
tires and brakes, then washing off impervious areas into nearby streams.
water
A muddy McDowell Creek flows past Beatties Ford Road, heading into Mountain Island Lake.
western mecklenburg
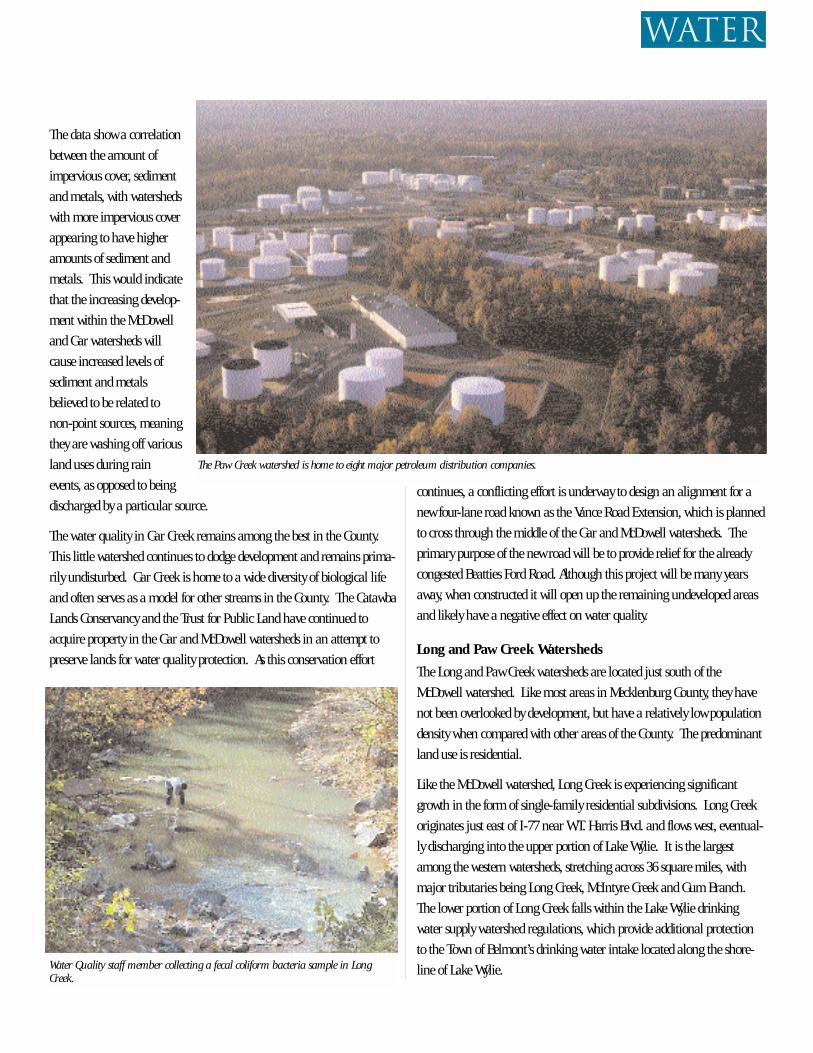
The data show a correlation
between the amount of
impervious cover, sediment
and metals, with watersheds
with more impervious cover
appearing to have higher
amounts of sediment and
metals. This would indicate
that the increasing develop-
ment within the McDowell
and Gar watersheds will
cause increased levels of
sediment and metals
believed to be related to
non-point sources, meaning
they are washing off various
land uses during rain
events, as opposed to being
discharged by a particular source.
The water quality in Gar Creek remains among the best in the County.
This little watershed continues to dodge development and remains prima-
rily undisturbed. Gar Creek is home to a wide diversity of biological life
and often serves as a model for other streams in the County. The Catawba
Lands Conservancy and the Trust for Public Land have continued to
acquire property in the Gar and McDowell watersheds in an attempt to
preserve lands for water quality protection. As this conservation effort
continues, a conflicting effort is underway to design an alignment for a
new four-lane road known as the Vance Road Extension, which is planned
to cross through the middle of the Gar and McDowell watersheds. The
primary purpose of the new road will be to provide relief for the already
congested Beatties Ford Road. Although this project will be many years
away, when constructed it will open up the remaining undeveloped areas
and likely have a negative effect on water quality.
Long and Paw Creek Watersheds
The Long and Paw Creek watersheds are located just south of the
McDowell watershed. Like most areas in Mecklenburg County, they have
not been overlooked by development, but have a relatively low population
density when compared with other areas of the County. The predominant
land use is residential.
Like the McDowell watershed, Long Creek is experiencing significant
growth in the form of single-family residential subdivisions. Long Creek
originates just east of I-77 near W.T. Harris Blvd. and flows west, eventual-
ly discharging into the upper portion of Lake Wylie. It is the largest
among the western watersheds, stretching across 36 square miles, with
major tributaries being Long Creek, McIntyre Creek and Gum Branch.
The lower portion of Long Creek falls within the Lake Wylie drinking
water supply watershed regulations, which provide additional protection
to the Town of Belmont’s drinking water intake located along the shore-
line of Lake Wylie.
water
The Paw Creek watershed is home to eight major petroleum distribution companies.
Water Quality staff member collecting a fecal coliform bacteria sample in LongCreek.
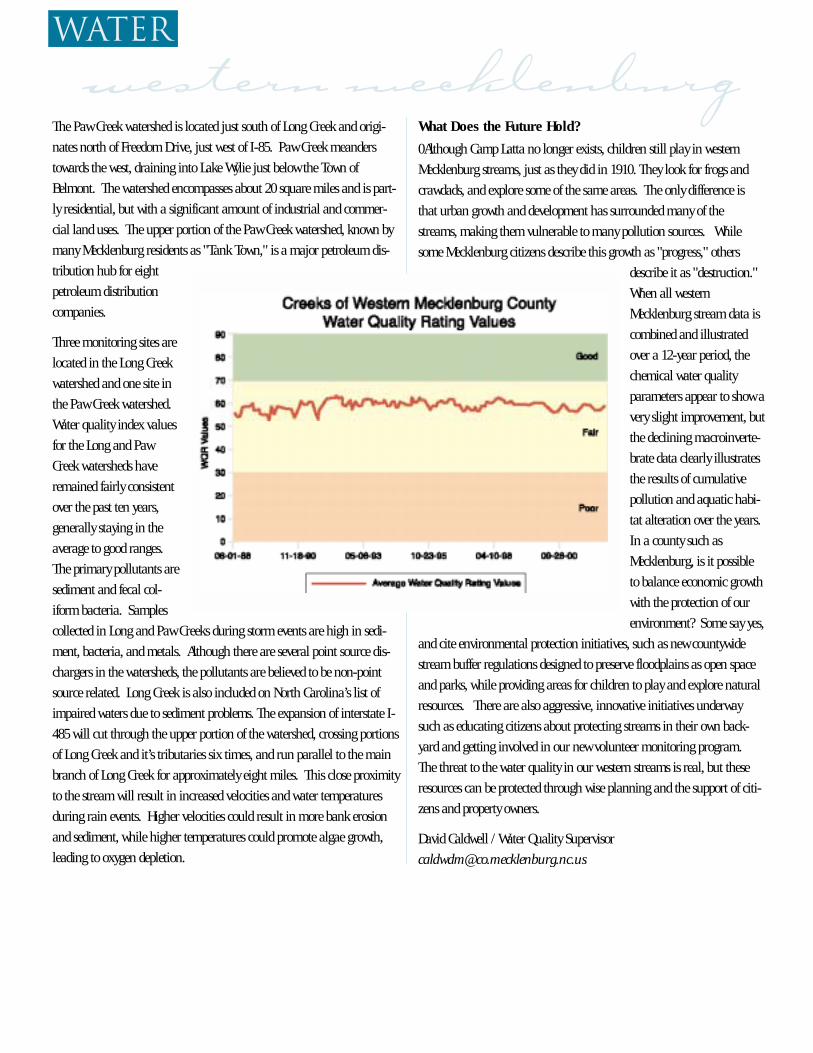
western mecklenburgThe Paw Creek watershed is located just south of Long Creek and origi-
nates north of Freedom Drive, just west of I-85. Paw Creek meanders
towards the west, draining into Lake Wylie just below the Town of
Belmont. The watershed encompasses about 20 square miles and is part-
ly residential, but with a significant amount of industrial and commer-
cial land uses. The upper portion of the Paw Creek watershed, known by
many Mecklenburg residents as "Tank Town," is a major petroleum dis-
tribution hub for eight
petroleum distribution
companies.
Three monitoring sites are
located in the Long Creek
watershed and one site in
the Paw Creek watershed.
Water quality index values
for the Long and Paw
Creek watersheds have
remained fairly consistent
over the past ten years,
generally staying in the
average to good ranges.
The primary pollutants are
sediment and fecal col-
iform bacteria. Samples
collected in Long and Paw Creeks during storm events are high in sedi-
ment, bacteria, and metals. Although there are several point source dis-
chargers in the watersheds, the pollutants are believed to be non-point
source related. Long Creek is also included on North Carolina’s list of
impaired waters due to sediment problems. The expansion of interstate I-
485 will cut through the upper portion of the watershed, crossing portions
of Long Creek and it’s tributaries six times, and run parallel to the main
branch of Long Creek for approximately eight miles. This close proximity
to the stream will result in increased velocities and water temperatures
during rain events. Higher velocities could result in more bank erosion
and sediment, while higher temperatures could promote algae growth,
leading to oxygen depletion.
What Does the Future Hold?
0Although Camp Latta no longer exists, children still play in western
Mecklenburg streams, just as they did in 1910. They look for frogs and
crawdads, and explore some of the same areas. The only difference is
that urban growth and development has surrounded many of the
streams, making them vulnerable to many pollution sources. While
some Mecklenburg citizens describe this growth as "progress," others
describe it as "destruction."
When all western
Mecklenburg stream data is
combined and illustrated
over a 12-year period, the
chemical water quality
parameters appear to show a
very slight improvement, but
the declining macroinverte-
brate data clearly illustrates
the results of cumulative
pollution and aquatic habi-
tat alteration over the years.
In a county such as
Mecklenburg, is it possible
to balance economic growth
with the protection of our
environment? Some say yes,
and cite environmental protection initiatives, such as new countywide
stream buffer regulations designed to preserve floodplains as open space
and parks, while providing areas for children to play and explore natural
resources. There are also aggressive, innovative initiatives underway
such as educating citizens about protecting streams in their own back-
yard and getting involved in our new volunteer monitoring program.
The threat to the water quality in our western streams is real, but these
resources can be protected through wise planning and the support of citi-
zens and property owners.
David Caldwell / Water Quality Supervisor
water
e know it’s there…Somewhere…Someone or something is con-tributing to polluting surface water in Mecklenburg County and it is
our job to find them. We see the writing on the wall in the form of "hot"water samples, citizen requests for service and unusual observations dur-ing scheduled inspections of industrial facilities. The difficulty often liesin linking one of these indicators with a specific pollution source, whetherit is malicious, accidental, obvious or subtle. Culprits range from failedseptic systems to penny-pinching industries, from long-term chronicsources to one-time dischargers. Whatever the circumstances, our meth-ods and resources must be comprehensive enough to expose the source.
The most important and effective way that Water Quality staff strives touncover these pollution problems is through investigations and fieldwork.Pinpointing the source of pollution is a difficult task that often takeshours of fieldwork and investigative monitoring sometimes stretchingover days, weeks or months - even after the impacts are well documented.Sanitary sewer and storm sewer maps are scrutinized, ambient water sam-ples are collected, suspected sources are bracketed, land use patterns areanalyzed and any other relevant data or information is considered. Afterthe sample results are reported and conclusions are made, another pollu-tion source in Mecklenburg County is eliminated. In a County that isexperiencing such rapid growth as we are, as well as having an extensive,aging infrastructure, every pollution source that can be eliminated has apositive effect on over-all water quality.
The last year has been very productive from an environmental standpoint.With increases in staff resources MCDEP has been able to spend moreman-hours than ever on fieldwork and investigations, sometimes yieldingstartling results. Some of the more significant point source pollutionproblems found in the last year are outlined below.
• In the spring of 2001, a concerned citizen called MCDEP to report apossible violation by his employer. A subsequent investigation by staffmembers revealed that supervisors at the metal fabrication shop wherehe worked had illegally plumbed their acid rinse wash bin to the stormdrain. Not only were they discharging an acid wash solution to a localstream; they had used a cutting torch to carve a hole in a metal stormdrain to gain access. The company was held responsible for the cost ofrestoring the impacted stream.
• Water samples collected in the Park Road Park area of Little SugarCreek had been exhibiting high concentrations of fecal coliform bacte-ria (an indication of human sewage) for almost two years beforeMCDEP staff, along with employees of Charlotte-Mecklenburg Utilitieswere able to bracket and identify a broken sewer pipe under groundnear the headwaters of a small tributary. The broken pipe had beenallowing raw sewage into a piped section of a tributary to Little SugarCreek and contributed to high in-stream fecal coliform concentrationsfor months before its discovery. The broken pipe was dug up andreplaced. Fecal coliform concentrations have since decreased.
• Acting on a tip from a citizen and with Catawba Riverkeeper, DonnaLisenby, Water Quality staff discovered a restaurant near Lake Wylie thathad straight piped their raw sewage to an open ditch, and eventuallyinto the lake, for over twenty years. The business owner was forced toclean the affected area, connect to an approved sanitary septic system,and was fined by the State.
• During a stream walk investigation (stream walks involve simply hav-ing staff members actually traverse different sections of streams wherewater quality problems have been detected but not resolved), WaterQuality staff members discovered what appeared to be a puddle of rawsewage below a small diameter pipe located in a culvert. Follow upinvestigations revealed that the pipe was connected directly to a toilet ina nearby business lobby. The toilet had been discharging directly toLittle Sugar Creek for at least eight years. The owners of the facilitywere forced to remove the offending toilet and seal the pipe to preventfuture discharges.
• A neighborhood resident observed automobile repair shop staff behav-ing suspiciously with two large 55-gallon drums of waste oil and calledWater Quality to report their concerns. Investigation by Water Qualitystaff revealed that the business owner had dumped the drums into theparking lot behind his facility. The owner of the repair shop wasrequired to clean up the discharge at a considerable expense.
• After receiving a complaint from a citizen regarding a foul smell in asmall tributary to Edwards Branch, Water Quality staff members trackedand isolated an illicit connection serving an entire strip mall. It wasestimated that the mall had discharged its waste to that stream for atleast fifteen years. The owner of the strip mall was required to dig upthe existing sewer line and connect to an approved sanitary sewer sys-tem. The owners were also required to clean up the impacted tributary.
In addition to the numerous point sources of pollution found, WaterQuality staff also identified and called for numerous non-point sources tobe eliminated or reduced thanks to activities such as the IndustrialFacilities Inspection Program, Industrial seminars, Fertilizer and Pesticideawareness materials and other community outreach projects. These pro-grams combine to create a positive impact on surface water quality inMecklenburg County.
Every source of pollution discovered is one less that contributes to waterquality degradation. Some discoveries over the last year have been shock-ing, some have been expected, some have been common-place, and somehave been unique - but now, they are all gone…
Crystal Taylor / Environmental Hygienist, Water Quality Section [email protected]
James Wilson / Environmental Hygienist, Water Quality [email protected]
Water Quality Detective Work
water
W
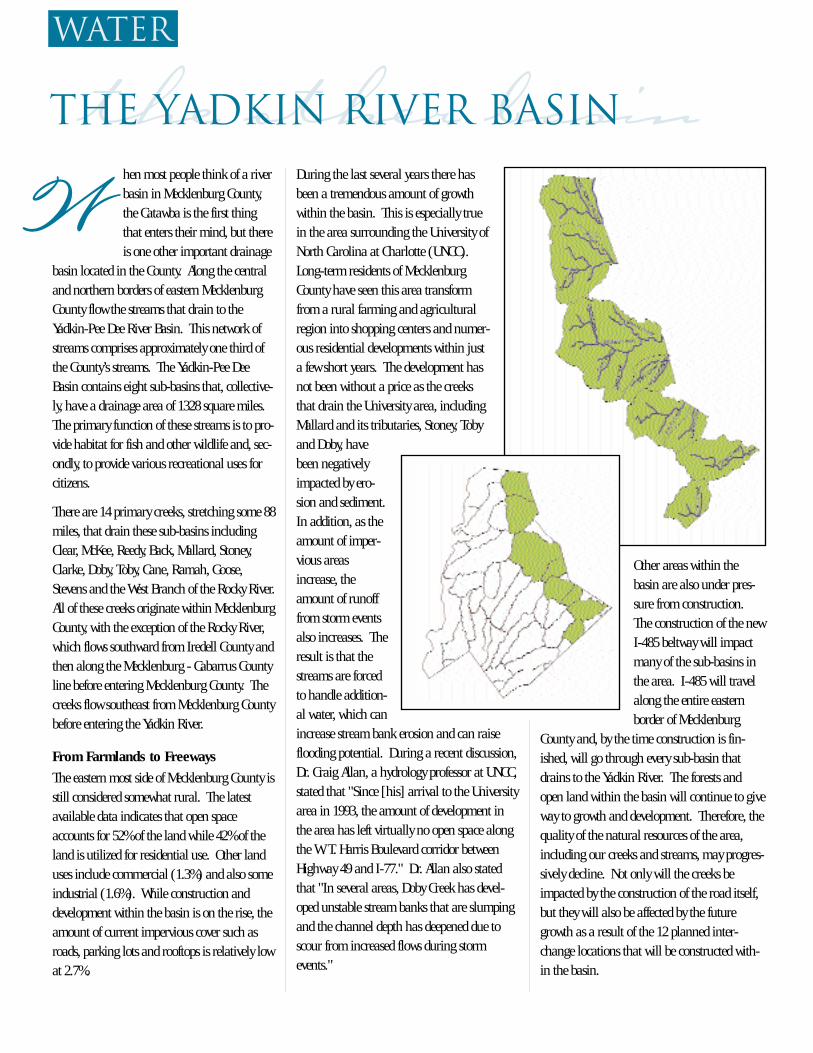
the other basinhen most people think of a riverbasin in Mecklenburg County,the Catawba is the first thingthat enters their mind, but thereis one other important drainage
basin located in the County. Along the centraland northern borders of eastern MecklenburgCounty flow the streams that drain to theYadkin-Pee Dee River Basin. This network ofstreams comprises approximately one third ofthe County’s streams. The Yadkin-Pee DeeBasin contains eight sub-basins that, collective-ly, have a drainage area of 1328 square miles.The primary function of these streams is to pro-vide habitat for fish and other wildlife and, sec-ondly, to provide various recreational uses forcitizens.
There are 14 primary creeks, stretching some 88miles, that drain these sub-basins includingClear, McKee, Reedy, Back, Mallard, Stoney,Clarke, Doby, Toby, Cane, Ramah, Goose,Stevens and the West Branch of the Rocky River.All of these creeks originate within MecklenburgCounty, with the exception of the Rocky River,which flows southward from Iredell County andthen along the Mecklenburg - Cabarrus Countyline before entering Mecklenburg County. Thecreeks flow southeast from Mecklenburg Countybefore entering the Yadkin River.
From Farmlands to Freeways
The eastern most side of Mecklenburg County isstill considered somewhat rural. The latestavailable data indicates that open spaceaccounts for 52% of the land while 42% of theland is utilized for residential use. Other landuses include commercial (1.3%) and also someindustrial (1.6%). While construction anddevelopment within the basin is on the rise, theamount of current impervious cover such asroads, parking lots and rooftops is relatively lowat 2.7%.
During the last several years there hasbeen a tremendous amount of growthwithin the basin. This is especially truein the area surrounding the University ofNorth Carolina at Charlotte (UNCC).Long-term residents of MecklenburgCounty have seen this area transformfrom a rural farming and agriculturalregion into shopping centers and numer-ous residential developments within justa few short years. The development hasnot been without a price as the creeksthat drain the University area, includingMallard and its tributaries, Stoney, Tobyand Doby, havebeen negativelyimpacted by ero-sion and sediment.In addition, as theamount of imper-vious areasincrease, theamount of runofffrom storm eventsalso increases. Theresult is that thestreams are forcedto handle addition-al water, which canincrease stream bank erosion and can raiseflooding potential. During a recent discussion,Dr. Craig Allan, a hydrology professor at UNCC,stated that "Since [his] arrival to the Universityarea in 1993, the amount of development inthe area has left virtually no open space alongthe W. T. Harris Boulevard corridor betweenHighway 49 and I-77." Dr. Allan also statedthat "In several areas, Doby Creek has devel-oped unstable stream banks that are slumpingand the channel depth has deepened due toscour from increased flows during stormevents."
Other areas within thebasin are also under pres-sure from construction.The construction of the newI-485 beltway will impactmany of the sub-basins inthe area. I-485 will travelalong the entire easternborder of Mecklenburg
County and, by the time construction is fin-ished, will go through every sub-basin thatdrains to the Yadkin River. The forests andopen land within the basin will continue to giveway to growth and development. Therefore, thequality of the natural resources of the area,including our creeks and streams, may progres-sively decline. Not only will the creeks beimpacted by the construction of the road itself,but they will also be affected by the futuregrowth as a result of the 12 planned inter-change locations that will be constructed with-in the basin.
The Yadkin River Basin
W
water
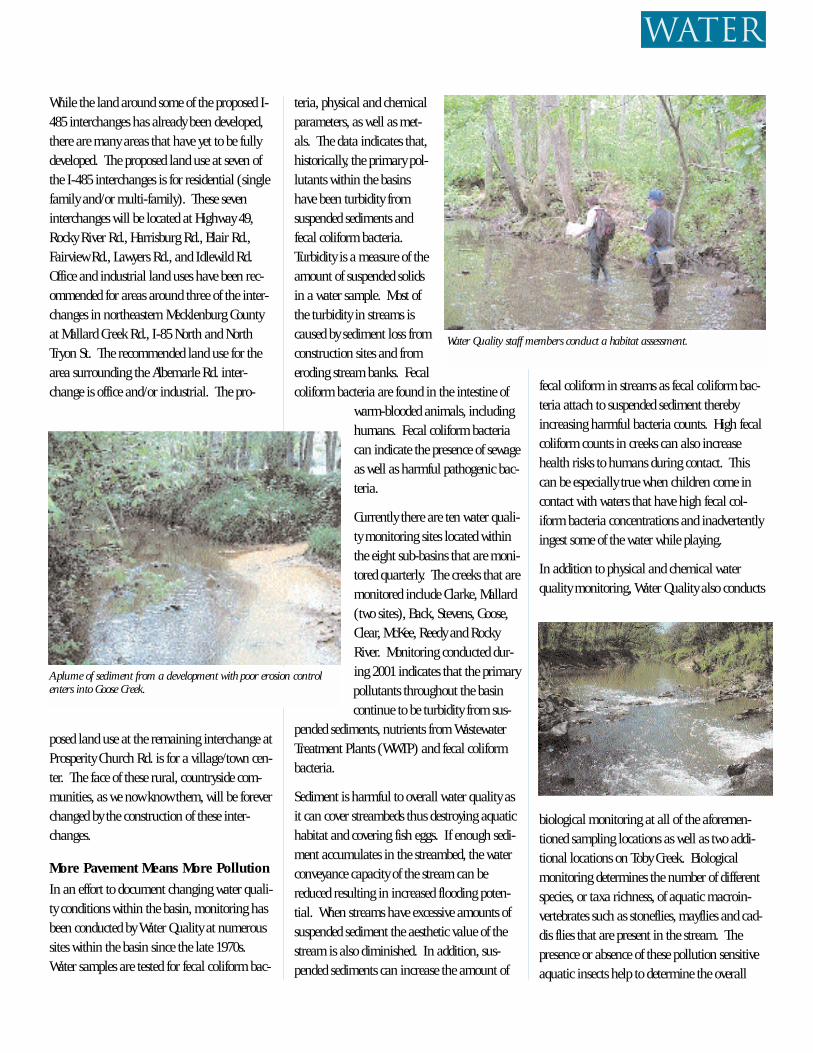
While the land around some of the proposed I-485 interchanges has already been developed,there are many areas that have yet to be fullydeveloped. The proposed land use at seven ofthe I-485 interchanges is for residential (singlefamily and/or multi-family). These seveninterchanges will be located at Highway 49,Rocky River Rd., Harrisburg Rd., Blair Rd.,Fairview Rd., Lawyers Rd., and Idlewild Rd.Office and industrial land uses have been rec-ommended for areas around three of the inter-changes in northeastern Mecklenburg Countyat Mallard Creek Rd., I-85 North and NorthTryon St. The recommended land use for thearea surrounding the Albemarle Rd. inter-change is office and/or industrial. The pro-
posed land use at the remaining interchange atProsperity Church Rd. is for a village/town cen-ter. The face of these rural, countryside com-munities, as we now know them, will be foreverchanged by the construction of these inter-changes.
More Pavement Means More Pollution
In an effort to document changing water quali-ty conditions within the basin, monitoring hasbeen conducted by Water Quality at numeroussites within the basin since the late 1970s.Water samples are tested for fecal coliform bac-
teria, physical and chemicalparameters, as well as met-als. The data indicates that,historically, the primary pol-lutants within the basinshave been turbidity fromsuspended sediments andfecal coliform bacteria.Turbidity is a measure of theamount of suspended solidsin a water sample. Most ofthe turbidity in streams iscaused by sediment loss fromconstruction sites and fromeroding stream banks. Fecalcoliform bacteria are found in the intestine of
warm-blooded animals, includinghumans. Fecal coliform bacteriacan indicate the presence of sewageas well as harmful pathogenic bac-teria.
Currently there are ten water quali-ty monitoring sites located withinthe eight sub-basins that are moni-tored quarterly. The creeks that aremonitored include Clarke, Mallard(two sites), Back, Stevens, Goose,Clear, McKee, Reedy and RockyRiver. Monitoring conducted dur-ing 2001 indicates that the primarypollutants throughout the basincontinue to be turbidity from sus-
pended sediments, nutrients from WastewaterTreatment Plants (WWTP) and fecal coliformbacteria.
Sediment is harmful to overall water quality asit can cover streambeds thus destroying aquatichabitat and covering fish eggs. If enough sedi-ment accumulates in the streambed, the waterconveyance capacity of the stream can bereduced resulting in increased flooding poten-tial. When streams have excessive amounts ofsuspended sediment the aesthetic value of thestream is also diminished. In addition, sus-pended sediments can increase the amount of
fecal coliform in streams as fecal coliform bac-teria attach to suspended sediment therebyincreasing harmful bacteria counts. High fecalcoliform counts in creeks can also increasehealth risks to humans during contact. Thiscan be especially true when children come incontact with waters that have high fecal col-iform bacteria concentrations and inadvertentlyingest some of the water while playing.
In addition to physical and chemical waterquality monitoring, Water Quality also conducts
biological monitoring at all of the aforemen-tioned sampling locations as well as two addi-tional locations on Toby Creek. Biologicalmonitoring determines the number of differentspecies, or taxa richness, of aquatic macroin-vertebrates such as stoneflies, mayflies and cad-dis flies that are present in the stream. Thepresence or absence of these pollution sensitiveaquatic insects help to determine the overall
water
Water Quality staff members conduct a habitat assessment.
A plume of sediment from a development with poor erosion controlenters into Goose Creek.
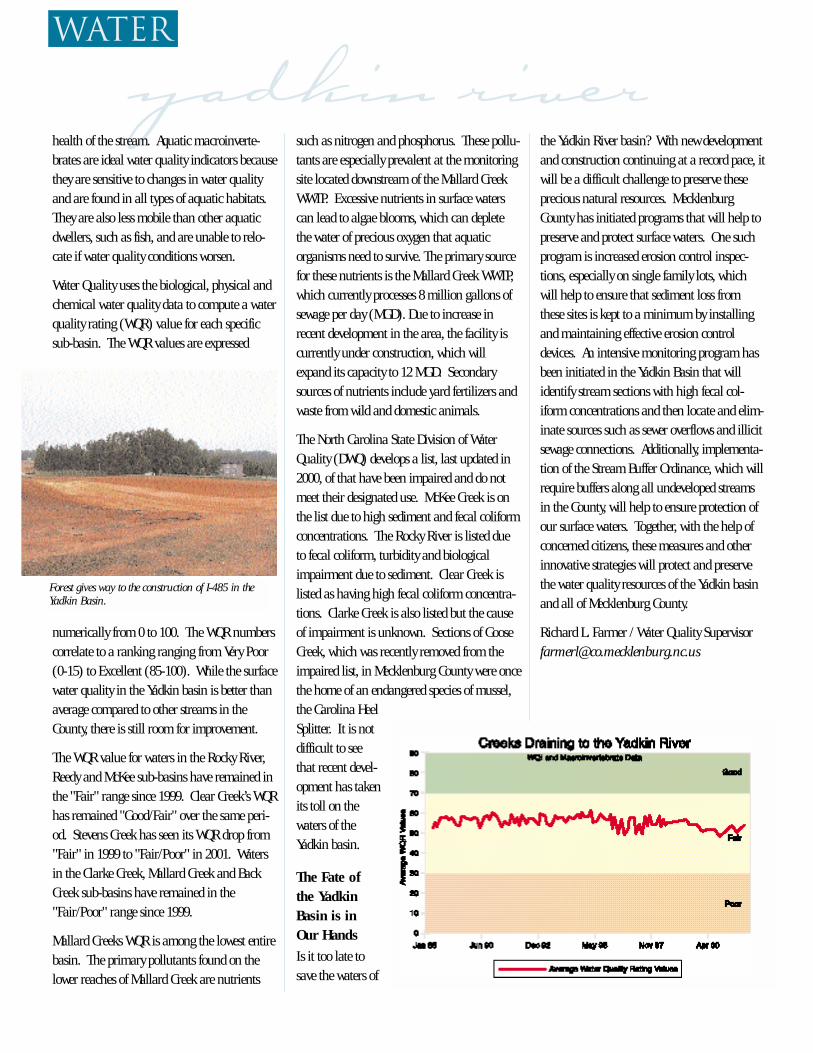
yadkin riverhealth of the stream. Aquatic macroinverte-brates are ideal water quality indicators becausethey are sensitive to changes in water qualityand are found in all types of aquatic habitats.They are also less mobile than other aquaticdwellers, such as fish, and are unable to relo-cate if water quality conditions worsen.
Water Quality uses the biological, physical andchemical water quality data to compute a waterquality rating (WQR) value for each specificsub-basin. The WQR values are expressed
numerically from 0 to 100. The WQR numberscorrelate to a ranking ranging from Very Poor(0-15) to Excellent (85-100). While the surfacewater quality in the Yadkin basin is better thanaverage compared to other streams in theCounty, there is still room for improvement.
The WQR value for waters in the Rocky River,Reedy and McKee sub-basins have remained inthe "Fair" range since 1999. Clear Creek’s WQRhas remained "Good/Fair" over the same peri-od. Stevens Creek has seen its WQR drop from"Fair" in 1999 to "Fair/Poor" in 2001. Watersin the Clarke Creek, Mallard Creek and BackCreek sub-basins have remained in the"Fair/Poor" range since 1999.
Mallard Creeks WQR is among the lowest entirebasin. The primary pollutants found on thelower reaches of Mallard Creek are nutrients
such as nitrogen and phosphorus. These pollu-tants are especially prevalent at the monitoringsite located downstream of the Mallard CreekWWTP. Excessive nutrients in surface waterscan lead to algae blooms, which can depletethe water of precious oxygen that aquaticorganisms need to survive. The primary sourcefor these nutrients is the Mallard Creek WWTP,which currently processes 8 million gallons ofsewage per day (MGD). Due to increase inrecent development in the area, the facility iscurrently under construction, which willexpand its capacity to 12 MGD. Secondarysources of nutrients include yard fertilizers andwaste from wild and domestic animals.
The North Carolina State Division of WaterQuality (DWQ) develops a list, last updated in2000, of that have been impaired and do notmeet their designated use. McKee Creek is onthe list due to high sediment and fecal coliformconcentrations. The Rocky River is listed dueto fecal coliform, turbidity and biologicalimpairment due to sediment. Clear Creek islisted as having high fecal coliform concentra-tions. Clarke Creek is also listed but the causeof impairment is unknown. Sections of GooseCreek, which was recently removed from theimpaired list, in Mecklenburg County were oncethe home of an endangered species of mussel,the Carolina HeelSplitter. It is notdifficult to seethat recent devel-opment has takenits toll on thewaters of theYadkin basin.
The Fate ofthe YadkinBasin is inOur Hands
Is it too late tosave the waters of
the Yadkin River basin? With new developmentand construction continuing at a record pace, itwill be a difficult challenge to preserve theseprecious natural resources. MecklenburgCounty has initiated programs that will help topreserve and protect surface waters. One suchprogram is increased erosion control inspec-tions, especially on single family lots, whichwill help to ensure that sediment loss fromthese sites is kept to a minimum by installingand maintaining effective erosion controldevices. An intensive monitoring program hasbeen initiated in the Yadkin Basin that willidentify stream sections with high fecal col-iform concentrations and then locate and elim-inate sources such as sewer overflows and illicitsewage connections. Additionally, implementa-tion of the Stream Buffer Ordinance, which willrequire buffers along all undeveloped streamsin the County, will help to ensure protection ofour surface waters. Together, with the help ofconcerned citizens, these measures and otherinnovative strategies will protect and preservethe water quality resources of the Yadkin basinand all of Mecklenburg County.
Richard L. Farmer / Water Quality [email protected]
water
Forest gives way to the construction of I-485 in theYadkin Basin.
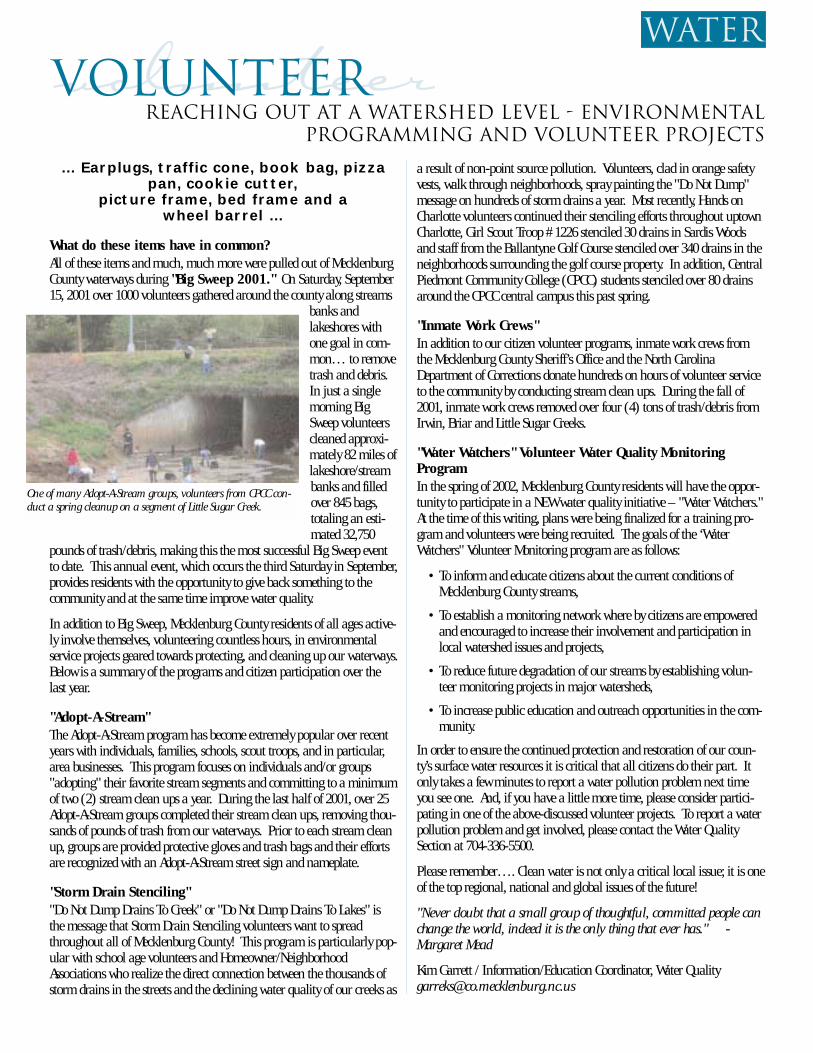
volunteer… Earplugs, traffic cone, book bag, pizza
pan, cookie cutter,picture frame, bed frame and a
wheel barrel …
What do these items have in common?All of these items and much, much more were pulled out of MecklenburgCounty waterways during "Big Sweep 2001." On Saturday, September15, 2001 over 1000 volunteers gathered around the county along streams
banks andlakeshores withone goal in com-mon… to removetrash and debris.In just a singlemorning BigSweep volunteerscleaned approxi-mately 82 miles oflakeshore/streambanks and filledover 845 bags,totaling an esti-mated 32,750
pounds of trash/debris, making this the most successful Big Sweep eventto date. This annual event, which occurs the third Saturday in September,provides residents with the opportunity to give back something to thecommunity and at the same time improve water quality.
In addition to Big Sweep, Mecklenburg County residents of all ages active-ly involve themselves, volunteering countless hours, in environmentalservice projects geared towards protecting, and cleaning up our waterways.Below is a summary of the programs and citizen participation over thelast year.
"Adopt-A-Stream" The Adopt-A-Stream program has become extremely popular over recentyears with individuals, families, schools, scout troops, and in particular,area businesses. This program focuses on individuals and/or groups"adopting" their favorite stream segments and committing to a minimumof two (2) stream clean ups a year. During the last half of 2001, over 25Adopt-A-Stream groups completed their stream clean ups, removing thou-sands of pounds of trash from our waterways. Prior to each stream cleanup, groups are provided protective gloves and trash bags and their effortsare recognized with an Adopt-A-Stream street sign and nameplate.
"Storm Drain Stenciling""Do Not Dump Drains To Creek" or "Do Not Dump Drains To Lakes" isthe message that Storm Drain Stenciling volunteers want to spreadthroughout all of Mecklenburg County! This program is particularly pop-ular with school age volunteers and Homeowner/NeighborhoodAssociations who realize the direct connection between the thousands ofstorm drains in the streets and the declining water quality of our creeks as
a result of non-point source pollution. Volunteers, clad in orange safetyvests, walk through neighborhoods, spray painting the "Do Not Dump"message on hundreds of storm drains a year. Most recently, Hands onCharlotte volunteers continued their stenciling efforts throughout uptownCharlotte, Girl Scout Troop # 1226 stenciled 30 drains in Sardis Woodsand staff from the Ballantyne Golf Course stenciled over 340 drains in theneighborhoods surrounding the golf course property. In addition, CentralPiedmont Community College (CPCC) students stenciled over 80 drainsaround the CPCC central campus this past spring.
"Inmate Work Crews"In addition to our citizen volunteer programs, inmate work crews fromthe Mecklenburg County Sheriff’s Office and the North CarolinaDepartment of Corrections donate hundreds on hours of volunteer serviceto the community by conducting stream clean ups. During the fall of2001, inmate work crews removed over four (4) tons of trash/debris fromIrwin, Briar and Little Sugar Creeks.
"Water Watchers" Volunteer Water Quality MonitoringProgramIn the spring of 2002, Mecklenburg County residents will have the oppor-tunity to participate in a NEW water quality initiative – "Water Watchers."At the time of this writing, plans were being finalized for a training pro-gram and volunteers were being recruited. The goals of the ‘WaterWatchers" Volunteer Monitoring program are as follows:
• To inform and educate citizens about the current conditions ofMecklenburg County streams,
• To establish a monitoring network where by citizens are empoweredand encouraged to increase their involvement and participation inlocal watershed issues and projects,
• To reduce future degradation of our streams by establishing volun-teer monitoring projects in major watersheds,
• To increase public education and outreach opportunities in the com-munity.
In order to ensure the continued protection and restoration of our coun-ty’s surface water resources it is critical that all citizens do their part. Itonly takes a few minutes to report a water pollution problem next timeyou see one. And, if you have a little more time, please consider partici-pating in one of the above-discussed volunteer projects. To report a waterpollution problem and get involved, please contact the Water QualitySection at 704-336-5500.
Please remember…. Clean water is not only a critical local issue; it is oneof the top regional, national and global issues of the future!
"Never doubt that a small group of thoughtful, committed people canchange the world, indeed it is the only thing that ever has." -Margaret Mead
Kim Garrett / Information/Education Coordinator, Water Quality [email protected]
Reaching Out At A Watershed Level - EnvironmentalProgramming and Volunteer Projects
Volunteerwater
One of many Adopt-A-Stream groups, volunteers from CPCC con-duct a spring cleanup on a segment of Little Sugar Creek.
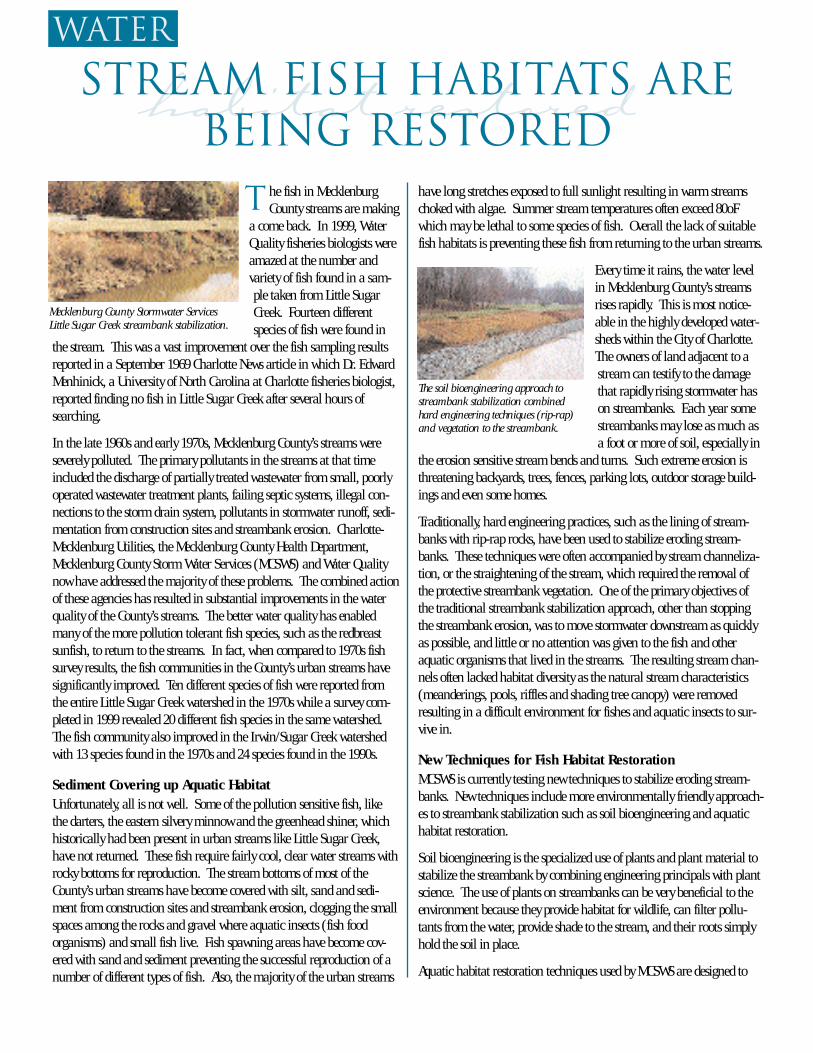
habitat restoredwater
he fish in MecklenburgCounty streams are making
a come back. In 1999, WaterQuality fisheries biologists wereamazed at the number andvariety of fish found in a sam-ple taken from Little SugarCreek. Fourteen differentspecies of fish were found in
the stream. This was a vast improvement over the fish sampling resultsreported in a September 1969 Charlotte News article in which Dr. EdwardMenhinick, a University of North Carolina at Charlotte fisheries biologist,reported finding no fish in Little Sugar Creek after several hours ofsearching.
In the late 1960s and early 1970s, Mecklenburg County’s streams wereseverely polluted. The primary pollutants in the streams at that timeincluded the discharge of partially treated wastewater from small, poorlyoperated wastewater treatment plants, failing septic systems, illegal con-nections to the storm drain system, pollutants in stormwater runoff, sedi-mentation from construction sites and streambank erosion. Charlotte-Mecklenburg Utilities, the Mecklenburg County Health Department,Mecklenburg County Storm Water Services (MCSWS) and Water Qualitynow have addressed the majority of these problems. The combined actionof these agencies has resulted in substantial improvements in the waterquality of the County’s streams. The better water quality has enabledmany of the more pollution tolerant fish species, such as the redbreastsunfish, to return to the streams. In fact, when compared to 1970s fishsurvey results, the fish communities in the County’s urban streams havesignificantly improved. Ten different species of fish were reported fromthe entire Little Sugar Creek watershed in the 1970s while a survey com-pleted in 1999 revealed 20 different fish species in the same watershed.The fish community also improved in the Irwin/Sugar Creek watershedwith 13 species found in the 1970s and 24 species found in the 1990s.
Sediment Covering up Aquatic HabitatUnfortunately, all is not well. Some of the pollution sensitive fish, likethe darters, the eastern silvery minnow and the greenhead shiner, whichhistorically had been present in urban streams like Little Sugar Creek,have not returned. These fish require fairly cool, clear water streams withrocky bottoms for reproduction. The stream bottoms of most of theCounty’s urban streams have become covered with silt, sand and sedi-ment from construction sites and streambank erosion, clogging the smallspaces among the rocks and gravel where aquatic insects (fish foodorganisms) and small fish live. Fish spawning areas have become cov-ered with sand and sediment preventing the successful reproduction of anumber of different types of fish. Also, the majority of the urban streams
have long stretches exposed to full sunlight resulting in warm streamschoked with algae. Summer stream temperatures often exceed 80oFwhich may be lethal to some species of fish. Overall the lack of suitablefish habitats is preventing these fish from returning to the urban streams.
Every time it rains, the water levelin Mecklenburg County’s streamsrises rapidly. This is most notice-able in the highly developed water-sheds within the City of Charlotte.The owners of land adjacent to astream can testify to the damagethat rapidly rising stormwater hason streambanks. Each year somestreambanks may lose as much asa foot or more of soil, especially in
the erosion sensitive stream bends and turns. Such extreme erosion isthreatening backyards, trees, fences, parking lots, outdoor storage build-ings and even some homes.
Traditionally, hard engineering practices, such as the lining of stream-banks with rip-rap rocks, have been used to stabilize eroding stream-banks. These techniques were often accompanied by stream channeliza-tion, or the straightening of the stream, which required the removal ofthe protective streambank vegetation. One of the primary objectives ofthe traditional streambank stabilization approach, other than stoppingthe streambank erosion, was to move stormwater downstream as quicklyas possible, and little or no attention was given to the fish and otheraquatic organisms that lived in the streams. The resulting stream chan-nels often lacked habitat diversity as the natural stream characteristics(meanderings, pools, riffles and shading tree canopy) were removedresulting in a difficult environment for fishes and aquatic insects to sur-vive in.
New Techniques for Fish Habitat RestorationMCSWS is currently testing new techniques to stabilize eroding stream-banks. New techniques include more environmentally friendly approach-es to streambank stabilization such as soil bioengineering and aquatichabitat restoration.
Soil bioengineering is the specialized use of plants and plant material tostabilize the streambank by combining engineering principals with plantscience. The use of plants on streambanks can be very beneficial to theenvironment because they provide habitat for wildlife, can filter pollu-tants from the water, provide shade to the stream, and their roots simplyhold the soil in place.
Aquatic habitat restoration techniques used by MCSWS are designed to
Mecklenburg County Stormwater ServicesLittle Sugar Creek streambank stabilization.
STREAm FISH HABITATS AREBEING RESTORED
The soil bioengineering approach tostreambank stabilization combinedhard engineering techniques (rip-rap)and vegetation to the streambank.
T
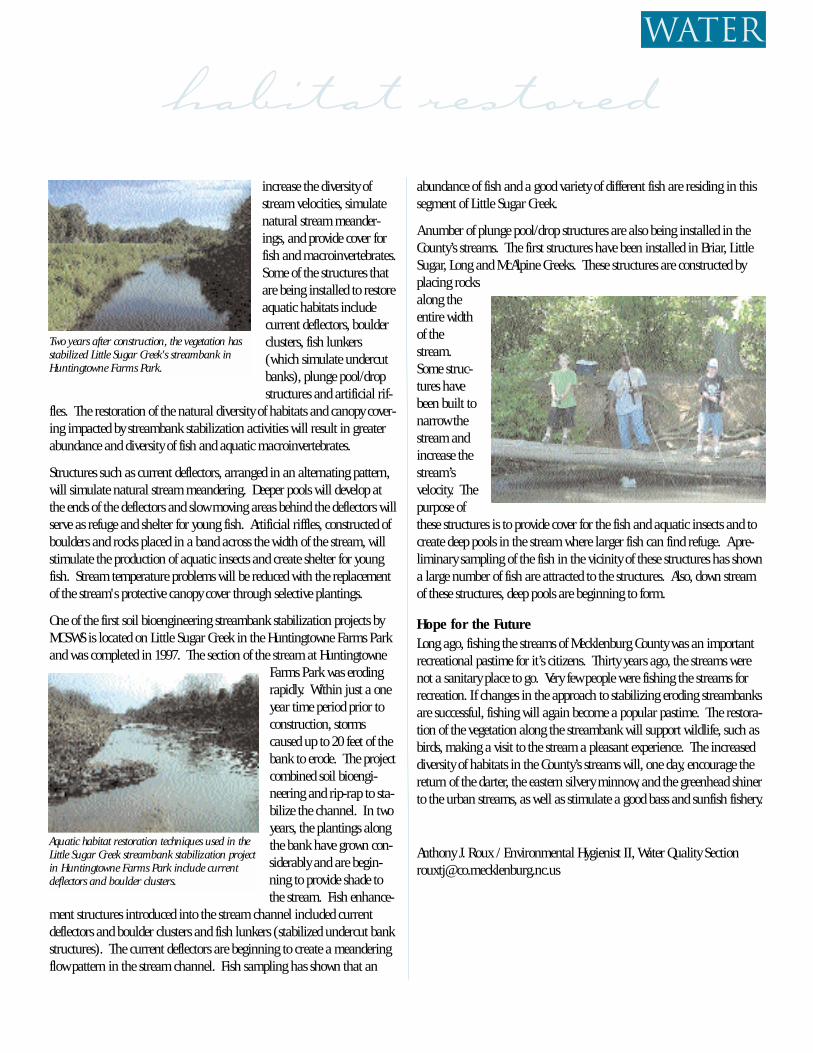
habitat restoredincrease the diversity ofstream velocities, simulatenatural stream meander-ings, and provide cover forfish and macroinvertebrates.Some of the structures thatare being installed to restoreaquatic habitats includecurrent deflectors, boulderclusters, fish lunkers(which simulate undercutbanks), plunge pool/dropstructures and artificial rif-
fles. The restoration of the natural diversity of habitats and canopy cover-ing impacted by streambank stabilization activities will result in greaterabundance and diversity of fish and aquatic macroinvertebrates.
Structures such as current deflectors, arranged in an alternating pattern,will simulate natural stream meandering. Deeper pools will develop atthe ends of the deflectors and slow moving areas behind the deflectors willserve as refuge and shelter for young fish. Artificial riffles, constructed ofboulders and rocks placed in a band across the width of the stream, willstimulate the production of aquatic insects and create shelter for youngfish. Stream temperature problems will be reduced with the replacementof the stream's protective canopy cover through selective plantings.
One of the first soil bioengineering streambank stabilization projects byMCSWS is located on Little Sugar Creek in the Huntingtowne Farms Parkand was completed in 1997. The section of the stream at Huntingtowne
Farms Park was erodingrapidly. Within just a oneyear time period prior toconstruction, stormscaused up to 20 feet of thebank to erode. The projectcombined soil bioengi-neering and rip-rap to sta-bilize the channel. In twoyears, the plantings alongthe bank have grown con-siderably and are begin-ning to provide shade tothe stream. Fish enhance-
ment structures introduced into the stream channel included currentdeflectors and boulder clusters and fish lunkers (stabilized undercut bankstructures). The current deflectors are beginning to create a meanderingflow pattern in the stream channel. Fish sampling has shown that an
abundance of fish and a good variety of different fish are residing in thissegment of Little Sugar Creek.
A number of plunge pool/drop structures are also being installed in theCounty’s streams. The first structures have been installed in Briar, LittleSugar, Long and McAlpine Creeks. These structures are constructed byplacing rocksalong theentire widthof thestream.Some struc-tures havebeen built tonarrow thestream andincrease thestream’svelocity. Thepurpose ofthese structures is to provide cover for the fish and aquatic insects and tocreate deep pools in the stream where larger fish can find refuge. A pre-liminary sampling of the fish in the vicinity of these structures has showna large number of fish are attracted to the structures. Also, down streamof these structures, deep pools are beginning to form.
Hope for the FutureLong ago, fishing the streams of Mecklenburg County was an importantrecreational pastime for it’s citizens. Thirty years ago, the streams werenot a sanitary place to go. Very few people were fishing the streams forrecreation. If changes in the approach to stabilizing eroding streambanksare successful, fishing will again become a popular pastime. The restora-tion of the vegetation along the streambank will support wildlife, such asbirds, making a visit to the stream a pleasant experience. The increaseddiversity of habitats in the County’s streams will, one day, encourage thereturn of the darter, the eastern silvery minnow, and the greenhead shinerto the urban streams, as well as stimulate a good bass and sunfish fishery.
Anthony J. Roux / Environmental Hygienist II, Water Quality [email protected]
water
Two years after construction, the vegetation hasstabilized Little Sugar Creek's streambank inHuntingtowne Farms Park.
Aquatic habitat restoration techniques used in theLittle Sugar Creek streambank stabilization projectin Huntingtowne Farms Park include currentdeflectors and boulder clusters.
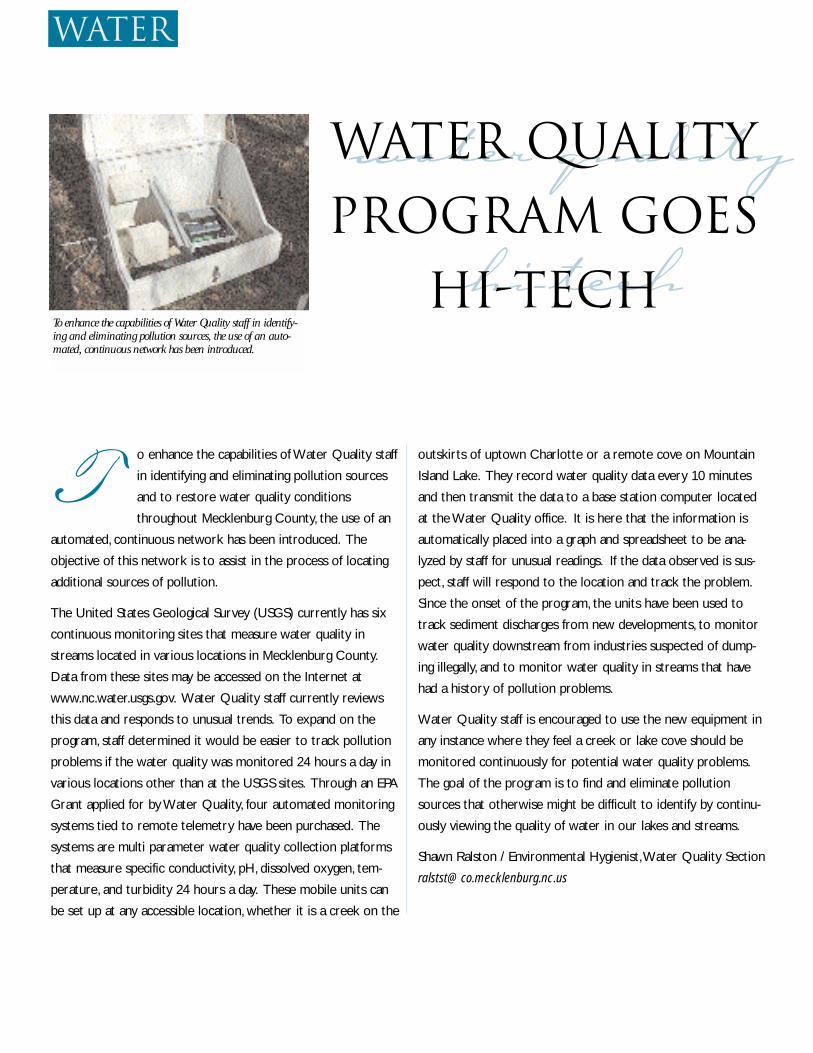
o enhance the capabilities of Water Quality staff
in identifying and eliminating pollution sources
and to restore water quality conditions
throughout Mecklenburg County, the use of an
automated, continuous network has been introduced. The
objective of this network is to assist in the process of locating
additional sources of pollution.
The United States Geological Survey (USGS) currently has six
continuous monitoring sites that measure water quality in
streams located in various locations in Mecklenburg County.
Data from these sites may be accessed on the Internet at
www.nc.water.usgs.gov. Water Quality staff currently reviews
this data and responds to unusual trends. To expand on the
program, staff determined it would be easier to track pollution
problems if the water quality was monitored 24 hours a day in
various locations other than at the USGS sites. Through an EPA
Grant applied for by Water Quality, four automated monitoring
systems tied to remote telemetry have been purchased. The
systems are multi parameter water quality collection platforms
that measure specific conductivity, pH, dissolved oxygen, tem-
perature, and turbidity 24 hours a day. These mobile units can
be set up at any accessible location, whether it is a creek on the
outskirts of uptown Charlotte or a remote cove on Mountain
Island Lake. They record water quality data every 10 minutes
and then transmit the data to a base station computer located
at the Water Quality office. It is here that the information is
automatically placed into a graph and spreadsheet to be ana-
lyzed by staff for unusual readings. If the data observed is sus-
pect, staff will respond to the location and track the problem.
Since the onset of the program, the units have been used to
track sediment discharges from new developments, to monitor
water quality downstream from industries suspected of dump-
ing illegally, and to monitor water quality in streams that have
had a history of pollution problems.
Water Quality staff is encouraged to use the new equipment in
any instance where they feel a creek or lake cove should be
monitored continuously for potential water quality problems.
The goal of the program is to find and eliminate pollution
sources that otherwise might be difficult to identify by continu-
ously viewing the quality of water in our lakes and streams.
Shawn Ralston / Environmental Hygienist,Water Quality Section
water quality
hi-tech
water
To enhance the capabilities of Water Quality staff in identify-ing and eliminating pollution sources, the use of an auto-mated, continuous network has been introduced.
T
Water Quality
Program Goes
Hi-Tech
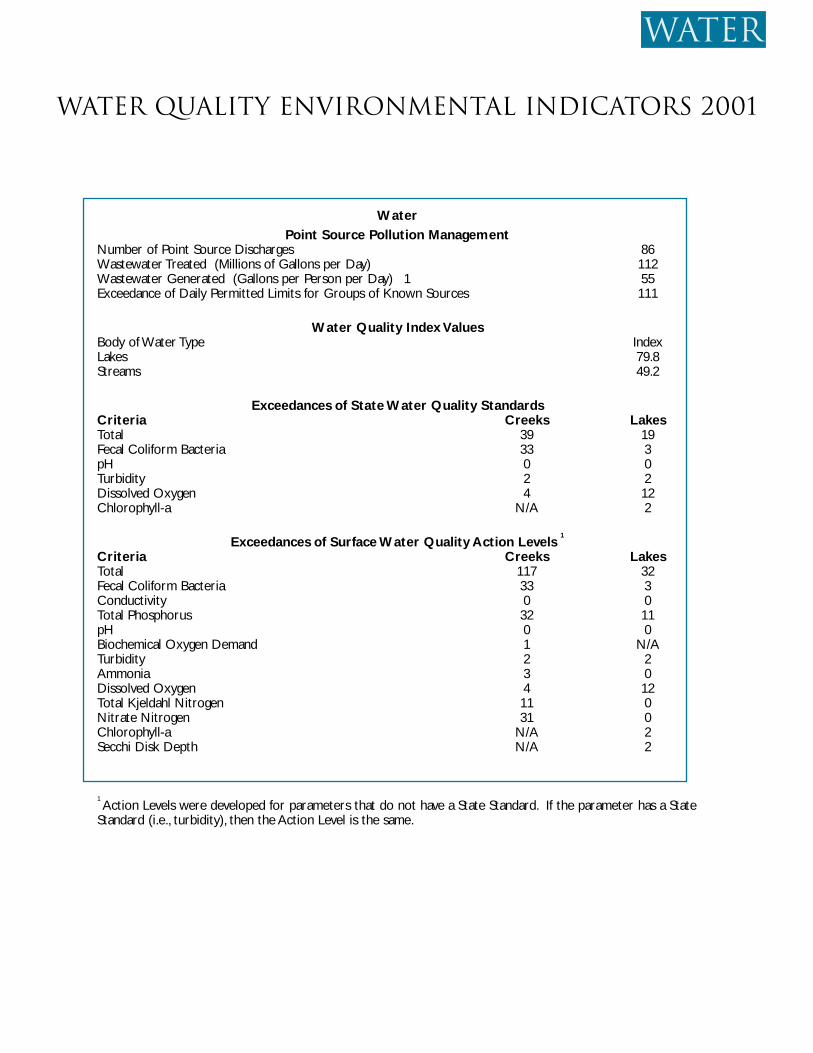
water
WaterPoint Source Pollution Management
Number of Point Source Discharges 86Wastewater Treated (Millions of Gallons per Day) 112Wastewater Generated (Gallons per Person per Day) 1 55Exceedance of Daily Permitted Limits for Groups of Known Sources 111
Water Quality Index ValuesBody of Water Type IndexLakes 79.8Streams 49.2
Exceedances of State Water Quality StandardsCriteria Creeks LakesTotal 39 19Fecal Coliform Bacteria 33 3pH 0 0Turbidity 2 2Dissolved Oxygen 4 12Chlorophyll-a N/A 2
Exceedances of Surface Water Quality Action Levels 1
Criteria Creeks LakesTotal 117 32Fecal Coliform Bacteria 33 3Conductivity 0 0Total Phosphorus 32 11pH 0 0Biochemical Oxygen Demand 1 N/ATurbidity 2 2Ammonia 3 0Dissolved Oxygen 4 12Total Kjeldahl Nitrogen 11 0Nitrate Nitrogen 31 0Chlorophyll-a N/A 2Secchi Disk Depth N/A 2
1Action Levels were developed for parameters that do not have a State Standard. If the parameter has a State
Standard (i.e., turbidity), then the Action Level is the same.
water Quality Environmental Indicators 2001