Embed Size (px)
Citation preview

Some global trends in higher education and the OECD response
Richard YellandOECD Directorate for Education
Mykolas Romeris University, Vilnius, Lithuania
17 April 2008

Tertiary education is growing … but in some places much faster
than others

Growth in all tertiary qualificationsThe percentage of persons with a minimum of 2 years of tertiary education born in the
period shown below (2005)
EAG, 2007 A1.3a

Tertiary education is expensive…but in some places
more so than in others

B6.2
Expenditure on educational core services, R&D and ancillary services in higher education institutions as
a percentage of GDP (2004)% of GDP
1. Some levels of education are included with others. 2. Total expenditure at tertiary level including R&D expenditure3. Year of reference 2005.4. Total expenditure at tertiary level excluding R&D expenditure
The US spends more than twice as much per higher education student as the European Union.

Overall expenditure is rising, and so is expenditure per student
In a few countries the change is significant, but it others it is small or
even negative

Changes in the number of students as well as changes in expenditure on educational institutions
per student, tertiary education (1995,2004)Index of change between 1995 and 2004 (1995=100, 2004 constant prices)
B1.7b

Higher education is becoming an increasingly international concern … especially in the English-speaking countries

Student mobility in tertiary education (2005)Percentage of international students enrolled in tertiary education
C3.1Note: The data on the mobility of international students presented are not comparable with data on foreign students in tertiary education (defined on the basis of citizenship) presented in pre-2006 editions of Education at a Glance .

There are big differences in tuition fee policy, but fees are
not the only cost factor for students and their families

Average annual tuition feescharged by public colleges and universities for full-time national
studentsin US Dollars converted using PPPs (school year 2004/2005)
Italy (56%)Austria (37%), Spain (43%),
Czech Republic (41%), Denmark (57%), Finland (73%), Ireland (45%), Iceland (45%), Norway (76%), Poland (76%), Sweden (76%)
Canada (m)
Israel1 (55%)
Australia (82%), Japan (41%), Korea (51%)
United Kingdom1 (52%)New Zealand (79%), Netherland1s (59%)
United States (64%)
Belgium (Fr. and Fl.) (33%)
Turkey (27%), France (m)
0
500
1000
2000
3000
4000
5000
USD
B5.11. Public institutions do not exist at this level of education and most of the students are enrolled in government dependent institutions.
This chart does not take into account grants, subsidies or loans that partially or fully offset the students’ tuition fees.

The relationship between fees, earnings and taxes is complex, but there is a clear advantage in
being better educated

A9.2
Relative earnings from employment (2005 or latest available year)
By level of educational attainment and gender for 25-to-64-year-olds (upper secondary and post-secondary non-tertiary education=100)
1. Year of reference 2002. 3. Year of reference 2004.2. Year of reference 2003. 4. Year of reference 2005.

Some demographic trends
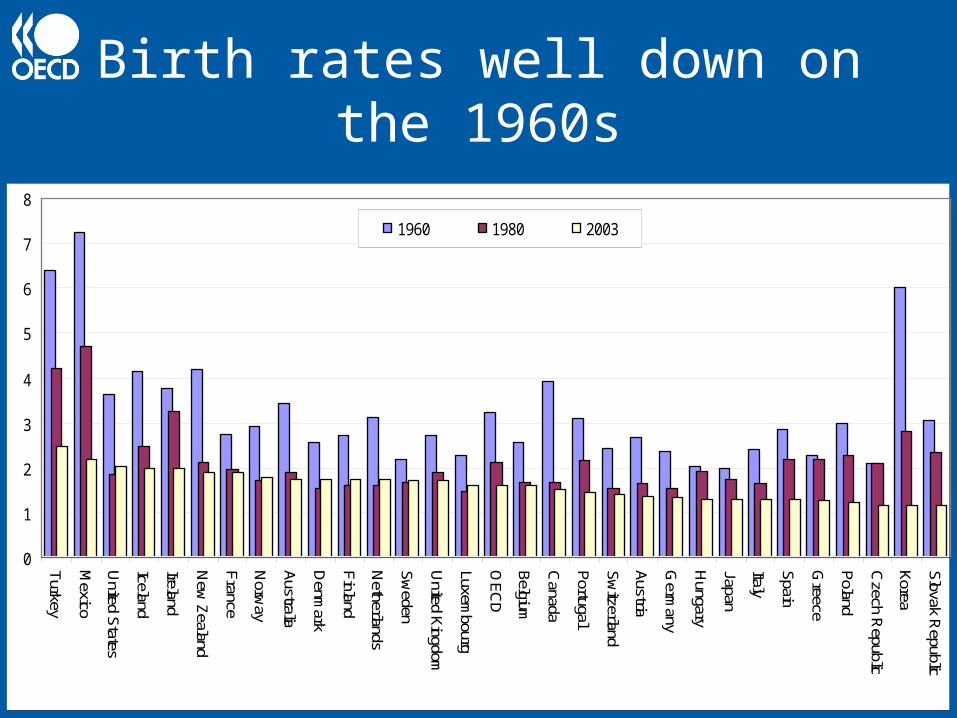
Birth rates well down on the 1960s
0
1
2
3
4
5
6
7
8
Turkey
Mexico
United States
Iceland
Ireland
New
Zealand
France
Norw
ay
Australia
Denm
ark
Finland
Netherlands
Sweden
United Kingdom
Luxembourg
OEC
D
Belgium
Canada
Portugal
Switzerland
Austria
Germ
any
Hungary
Japan
Italy
Spain
Greece
Poland
Czech R
epublic
Korea
Slovak Republic
1960 1980 2003

People live longer
0
10
20
30
40
50
60
70
80
90
WesternEurope
UnitedStates
Japan Russia LatinAmerica
Asia Africa
1820190019501999

Expected demographic changes within the population aged 20-29 (2005-2015)
50556065707580859095
100105110115120125130
Chi
leN
ew Z
eala
ndS
wed
enN
orw
ayU
nite
d S
tate
sU
nite
d Ki
ngdo
mA
ustr
alia
Luxe
mbo
urg
Net
herl
ands
Den
mar
kIs
rael
Can
ada
Sw
itze
rlan
dM
exic
oG
erm
any
Icel
and
Aus
tria
Tur
key
Bel
gium
Finl
and
Bra
zil
Fran
ceKo
rea
Irel
and
Rus
sian
Fed
erat
ion
Ital
yS
lova
k re
publ
icH
unga
ryPo
land
Cze
ch R
epub
licPo
rtug
alJap
anG
reec
eS
pain
2005= 100
A11.1

Expected demographic changes within the population aged 30 and over (2005-2015)
90
95
100
105
110
115
120
125
130
135
140M
exic
oT
urke
yBra
zil
Isra
elIr
elan
dChi
leA
ustr
alia
Kore
aIc
elan
dLu
xem
bour
gCan
ada
Slo
vak
repu
blic
New
Zea
land
Pola
ndS
pain
Uni
ted
Sta
tes
Port
ugal
Gre
ece
Cze
ch R
epub
licFi
nlan
dFr
ance
Nor
way
Aus
tria
Hun
gary
Jap
anN
ethe
rlan
dsU
nite
d Ki
ngdo
mBel
gium
Sw
eden
Sw
itze
rlan
dD
enm
ark
Ital
yG
erm
any
Rus
sian
2005= 100
A11.1
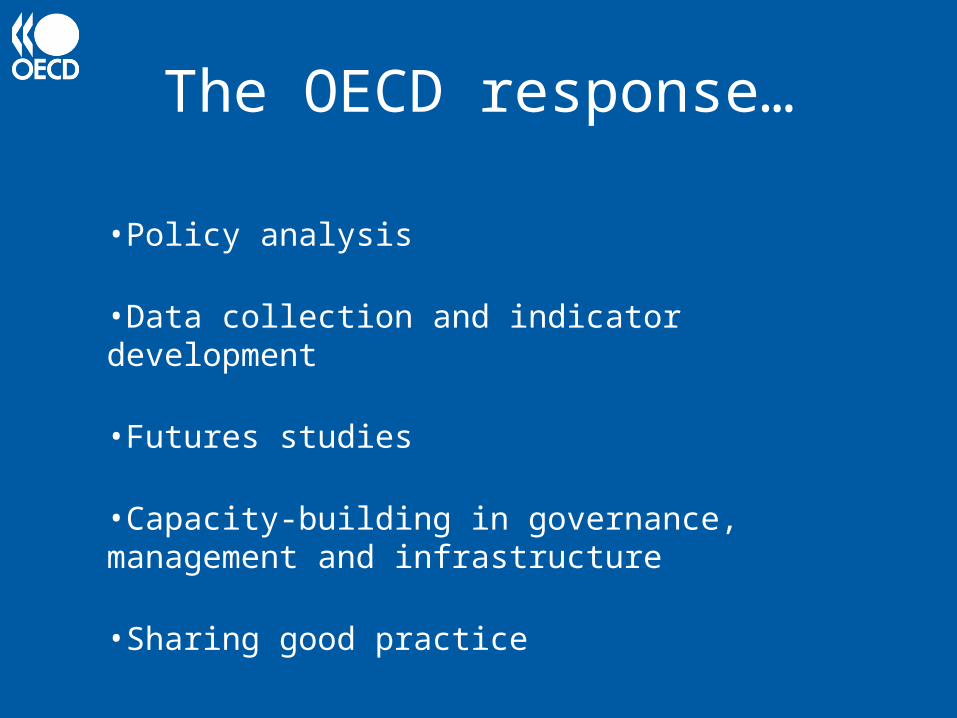
The OECD response…
•Policy analysis
•Data collection and indicator development
•Futures studies
•Capacity-building in governance, management and infrastructure
•Sharing good practice

ObjectiveRecommend policies that ensure that capabilities of tertiary education
contribute to countries’ economic and social goals
A collaborative, cross-national process to:• Synthesise research-based evidence on the impact of tertiary
education policies and disseminate this knowledge among participating countries
• Identify innovative and successful policy initiatives and practices
• Facilitate exchanges of lessons and experiences among countries
• Identify policy options and the conditions under which they are successfully implemented
OECD thematic review of tertiary education

Key features of Review
• A broad range of areas covered– Governance– Funding– Quality assurance– Equity– Role in research and innovation– Academic career– Links with the labour market– Internationalisation– Policy development and implementation
• 24 participating countries– 14 of which hosted a country review visit

• A wide range of stakeholders involved
•And … a range of outputs- 24 Country Background Reports (CBRs)- 14 Country Notes (Publication series)- Expert/Background papers commissioned- Qualitative data collected-Dissemination Conferences in countries - International Conference in Lisbon on 3-4 April 2008
Final Synthesis Report
Tertiary education in the knowledge society (3 volumes)
Brings together the evidence collected and materials produced through the OECD Review and presents the key findings and policy messages
Key features of Review
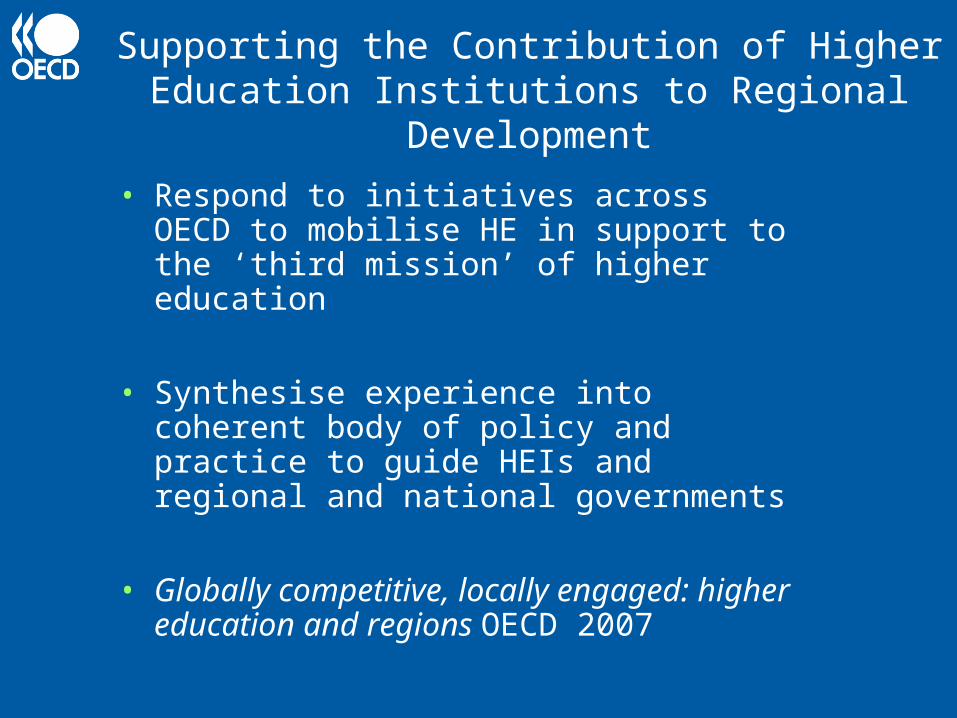
Supporting the Contribution of Higher Education Institutions to Regional
Development
• Respond to initiatives across OECD to mobilise HE in support to the ‘third mission’ of higher education
• Synthesise experience into coherent body of policy and practice to guide HEIs and regional and national governments
• Globally competitive, locally engaged: higher education and regions OECD 2007

• An abundance of action in most regions, but a lack of systematic policies•Lack of funding and other incentives•Limited co-operation among HEIs and between HEIs and stakeholders• Focus on research, technology transfer, business-related competitiveness• Human capital development ”knowledge transfer on legs” often neglected• HEIs’ role as ”good citizens” – their contribution to social, cultural and environmental development - not yet embraced• Common challenge: what to do with low tech SMEs?• Inadequate indicators to measure progress
Principal findings

Higher education facilities
These trends have profound implications for infrastructure investment:
Forthcoming conferenceHigher education: Spaces and Places For
Learning, Innovation and Knowledge Transfer
21-23 May 2008, Otaniemi, Espoo, Finland
Organised by the Programme on Educational Building (PEB)

A focus on quality
• OECD Education Ministers’ meeting Athens June 2006
• OECD/UNESCO guidelines on cross-border tertiary education
• Proposed international assessment of higher education outcomes
• IMHE Conference Paris 8-10 September 2008
– Outcomes of higher education: quality, relevance and impact

Some international drivers
• United States: the Spellings Commission; a culture of testing
• Europe: the Bologna Process; the development of learning outcomes; the ‘Tuning’ project
• Japan and Korea: loss of confidence in the quality of higher education
• China: demand from consumers and those advising them
• Australia: the development of an export industry

AHELO feasibility study
• …to assess whether reliable cross-national comparisons of higher education learning outcomes are scientifically possible and whether their implementation is feasible– At Bachelor degree level
• Cross-disciplinary skills (critical thinking, problem solving)• Discipline-specific (eg engineering)
– Choices for the feasibility study• choose from existing instruments• develop new assessment material
– Implementation in 5 institutions in 3-6 countries across multiple languages
• Countries to determine further steps on the basis of the findings

•Tertiary education in the knowledge society , 2008
•Education at a Glance 2007: OECD Indicators
•Higher Education and Regions: Globally Competitive, Locally Engaged, 2007
•Cross-border Tertiary Education: A Way towards Capacity Development, 2007
•Giving Knowledge for Free: The Emergence of Open Educational Resources, 2007
•PEB Compendium of Exemplary Educational Facilities: 3rd Edition, 2006
•Guidelines for Quality Provision in Cross-border Higher Education, 2005
•Education Policy Analysis: Focus on Higher Education -- 2005-2006 Edition
•E-learning in Tertiary Education: Where Do We Stand? 2005
•Reviews of National Policies for Higher or Tertiary Education:
•Higher Education Management and Policy
Key publications on HE