Embed Size (px)
Citation preview
Louisiana State UniversityLSU Digital Commons
LSU Historical Dissertations and Theses Graduate School
1986
Some Factors Associated With the Effectiveness ofthe Agricultural Production Component in Areasof Integrated Rural Development in Colombia asPerceived by Farmers (Crop Technology).Luis Eduardo Chaves e.Louisiana State University and Agricultural & Mechanical College
Follow this and additional works at: https://digitalcommons.lsu.edu/gradschool_disstheses
This Dissertation is brought to you for free and open access by the Graduate School at LSU Digital Commons. It has been accepted for inclusion inLSU Historical Dissertations and Theses by an authorized administrator of LSU Digital Commons. For more information, please [email protected].
Recommended CitationChaves e., Luis Eduardo, "Some Factors Associated With the Effectiveness of the Agricultural Production Component in Areas ofIntegrated Rural Development in Colombia as Perceived by Farmers (Crop Technology)." (1986). LSU Historical Dissertations andTheses. 4224.https://digitalcommons.lsu.edu/gradschool_disstheses/4224
INFORMATION TO USERS
This reproduction was made from a copy of a manuscript sent to us for publication and microfilming. While the m ost advanced technology has been used to photograph and reproduce this manuscript, the quality of the reproduction is heavily dependent upon the quality of the material submitted. Pages in any m anuscript. may have indistinct print. In all cases the best available copy has been filmed.
The following explanation of techniques is provided to help clarify notations which may appear on this reproduction.
1. Manuscripts may not always be complete. When it is not possible to obtain missing pages, a note appears to indicate this.
2. When copyrighted materials are removed from the manuscript, a note appears to indicate this.
3. Oversize materials (maps, drawings, and charts) are photographed by sectioning the original, beginning at the upper left hand comer and continuing from left to right in equal sections with small overlaps. Each oversize page is also filmed as one exposure and is available, for an additional charge, as a standard 35mm slide or in black and white paper format.*
4. Most photographs reproduce acceptably on positive microfilm or microfiche but lack clarity on xerographic copies made from the microfilm. For an additional charge, all photographs are available in black and white standard 35mm slide format. *
♦For more information about black and white slides or enlarged paper reproductions, please contact the Dissertations Customer Services Department.
T TA/f.T D'ssertationU 1 V 1 1 Information ServiceUniversity Microfilms InternationalA Bell & Howell Information Company300 N. Zeeb Road, Ann Arbor, Michigan 48106

8629158
C h av es E., Luis E d u ard o
SOME FACTORS ASSOCIATED WITH THE EFFECTIVENESS OF THE AGRICULTURAL PRODUCTION COMPONENT IN AREAS OF INTEGRATED RURAL DEVELOPMENT IN COLOMBIA AS PERCEIVED BY FARMERS
The Louisiana State University and A gricu ltura l and Mechanical Col. Ed.D. 1986
UniversityMicrofilms
International 300 N. Zeeb Road, Ann Arbor, Ml 48106
f

PLEASE NOTE:
In all cases this material has been filmed in the best possible way from the available copy. Problems encountered with this docum ent have been identified here with a check mark V .
1. Glossy photographs or p a g e s_____
2. Colored illustrations, paper or p rin t_______
3. Photographs with dark background_____
4. Illustrations are poor copy_______
5. Pages with black marks, not original co p y ______
6. Print shows through as there is text on both sides of p a g e _______
7. Indistinct, broken or small print on several pages. _ z l
8. Print exceeds m argin requirem ents______
9. Tightly bound copy with print lost in sp in e_______
10. Computer printout pages with indistinct print_______
11. P age(s)____________ lacking when material received, and not available from school orauthor.
12. P age(s)____________ seem to b e missing in numbering only as text follows.
13. Two pages n um bered . Text follows.
14. Curling and wrinkled p ag e s______
15. Dissertation contains pages with print at a slant, filmed a s received__________
16. Other____________ __________________________________________________ ____________
UniversityMicrofilms
International


SOME FACTORS ASSOCIATED WITH THE EFFECTIVENESS OF THE AGRICULTURAL PRODUCTION COMPONENT IN
AREAS OF INTEGRATED RURAL DEVELOPMENT IN COLOMBIA AS PERCEIVED BY FARMERS
A Dissertation
Submitted to the Graduate Faculty of the Louisiana State University and
Agricultural and Mechanical College in partial fulfillment of the requirements for the degree of
Doctor of Education
in
The Department of Agricultural Extension and International Education
(Extension Education)
byLuis Eduardo Chaves E.
A.I., National University of Colombia, 1966 M.S., Cornell University, 1971
May 1986
ACKNOWLEDGMENTS
The author wishes to acknowledge and thank his Graduate Com
mittee members, Dr. Lynn L. Pesson, Chairman, major professor, and
Vice Chancellor for Student Affairs; Dr. Edward W. Gassie, Professor
and Head of the Department of Extension and International Education;
Dr. Satish Verma, Professor of Extension Education; Dr. Ralph D.
Christy, Professor of Agricultural Economics; Dr. Quentin A. L.
Jenkins, Professor of Rural Sociology, and Dr. Lisandro 0. Perez,
Professor of Sociology for their direction, advice, and assistance
in his study program, and for their valuable knowledge presented in
the courses they taught.
Special recognition and gratitude is expressed to Dr. Lynn L.
Pesson for his patient, helpful counsel, guidance, encouragement,
and friendly understanding throughout the author's graduate study,
and for his valuable assistance in the conduct and writing of this
dissertation.
Grateful appreciation is expressed to Dr. Satish Verma for his
opportune and helpful assistance in the statistical analysis of the
data and interpretation of the results and for his useful suggestions
given in developing this study.
Gratitude is extended to the Organization of American States
(OAS) for the financial support during the first part of the author's
graduate study.
ii
The writer is deeply indebted to the W. K. Kellogg Foundation,
for the fellowship granted at the time when it was most needed, which
enabled him to continue and to properly complete his doctorate study
program.
Special gratitude is expressed to ICA's Regional Direction at
Ibague for its assistance and support during the author's stay in
Colombia gathering information for this dissertation.
Appreciation is also extended to the Directors, extension
personnel, and staff of the South Tolima and Fusagasuga Districts
for their opportune cooperation and assistance, which facilitated the
collection of the data for this study, and for the valuable informa
tion furnished.
The author wishes to express his gratitude to the Colombian
Agricultural Institute (ICA) and the Colombian Institute for Tech
nical Studies Abroad (ICETEX) for approving his travel to Louisiana
State University to undertake his doctoral study program.
Special appreciation is extended to Mrs. Barbara Jackson,
Mrs. Kathy Mayeax, Mrs. Mary Beth Burnett, Mrs. Estell W. Smilie
and Mrs. Denise Arnold for their understanding and opportune assis
tance when it was needed.
Thanks also go to Ms. Trudy Van Buren for typing this manus
cript.
Many other persons helped the author in one or another way
during his studies at LSU; many thanks to all of them.
iii
TABLE OF CONTENTS
Page
ACKNOWLEDGMENTS ............................................. ii
TABLE OF CONTENTS ........................................... iv
LIST OF TABLES ............................ viii
LIST OF FIGURES ............................................. xi
ABSTRACT ................................................ xii
CHAPTER
I. INTRODUCTION .................................... 1
Statement of the Problem ........................... 3
General Purposes ................................ 10
Specific Objectives ................................ 10
Definition of Terms ................................ 12
II. THEORETICAL FRAMEWORK............................. 14
Review of Literature ...................... 14
The Concepts of Agricultural and RuralDevelopment ...... 14
The Concept of Integrated Rural Development ...... 18
Factors Associated with Agricultural and RuralDevelopment ................................. 22
Agricultural Technology ........... 29
Appropriate Technology .......................... 36
Transfer of Technology .......................... 39
iv
TABLE OF CONTENTS (Continued)
Page
Adoption of Technology .... 43
Credit ......................................... 52
Marketing ..................................... 58
Land .................................... 65
Characteristics of the Selected DRI Districts ........ 70
South Tolima District (Sur Tolima) ............... 70
Fusagasuga District ..... 73
The Research Model ................................. 75
Statement of Hypotheses ............................ 77
III. RESEARCH METHODOLOGY ............................. 78
The Setting ................. 78
Selection of the Sample ........................ 78
Interview Schedule ................................. 80
Operationalization of the Variables ................ 83
Crop Productivity Limiting Factors ............... 83
Technology ..................................... 84
Adoption of Technology .......................... 86
Crop Production ................................. 87
Credit ............................... 88
Marketing ...................................... 89
Farmers' Satisfaction ........................... 91
Collection of Data ................................. 92
v

TABLE OF CONTENTS (Continued)
Page
Statistical Analysis of Data ....................... 92
IV. ANALYSIS OF DATA.................................. 96
General Aspects ................................... 98
Length of Time of DRI Services .................. 98
Size of the Farms .............................. 100
Land Tenure Status ............................. 102
Crop Productivity Limiting Factors ................. 103
Extent of Limitation ............................ 113
Crop Technology ................................... 117
Generation and Availability of AppropriateTechnology ......................... 117
Transfer of Technology .......................... 122
Means of Transferring Technology ................ 125
Satisfaction in Relation to DRI TechnicalAssistance .................................. 127
Adoption of Technology ......................... 129
Reasons for Non Adoption of Technology .......... 133
Crop Production ................................... 137
Credit ............................................ 139
Kinds of Financial Resources .................... 139
Length of Time Utilizing DRI Credit ............. 141
Difficulty in Obtaining DRI Credit .............. 142
Timeliness of the DRI Credit .................... 144
vi

TABLE OF CONTENTS (Continued)
Page
Adequacy of the Amount of the DRI Credit ......... 145
Interest Rates of the DRI Credit ................ 147
Terms for Repaying Loans ..................... 148
Satisfaction in Relation to the DRICredit Program ........... 149
Marketing ............................. 151
Major Uses of Crop Production ................... 151
Difficulty in the Marketing Process ............. 153
Sale Price of Crop Production ................... 155
Membership in Marketing Organizations ........... 156
Marketing Channels .............................. 158
Marketing Difficulties .......................... 159
Satisfaction in Relation to the DRIMarketing Program ............................ 164
Relationships Between Variables .................... 165
V. SUMMARY, CONCLUSIONS, AND RECOMMENDATIONS ......... 178
Summary........ 178
Conclusions ....................................... 203
Recommendations ................................... 217
BIBLIOGRAPHY ..................... 223
Appendix A: Interview Schedule .................... 235
Appendix B: Relationship Between Variables ......... 248
VITA.............................................. 256
vii
LIST OF TABLES
Table Page
1 A Comparison of the Length of Time Farmers Had Been Receiving DRI Services by Districts, 1985 ............... 99
2 A Comparison of the Size of Farms and the Amount of Farmland Dedicated to Crops and Pasture by Districts, 1985 ... 101
3 A Comparison of the Land Tenure Status of Farmers by Districts, 1985 .... 103
4 A Comparison among the Crop Productivity LimitingFactors, District 1 and District 2, 1985 ............... 105
5 A Comparison for each Crop Productivity Limiting Factorby Districts, 1985 .................................... 107
6 A Comparison of the Farmers' Perception in Relation to the Extent of Limitation of Crop Productivity Limiting Factors by Districts, 1985 ......................... 114
7 Selected Recommended Cultural Practices by Crops and their Sources of Generation and Adaptation to Local Conditions, Districts 1 and 2, 1985 .................... 118
8 A Comparison of the Farmers' Perception in Relation tothe Extent to which the DRI Program Was Effectively Transferring Technology by Districts, 1985 ............. 123
9 A Comparison of the Farmers' Perception in Relation tothe Means through which they Learned about Cultural Practices by Districts, 1985 ........................... 126
10 A Comparison of the Farmers' Levels of Satisfaction in Relation to the DRI Technical Assistance by Districts,1985 .................................................. 128
11 A Comparison of the Use of Cultural PracticesRecommended by the DRI Program According to the Information Provided by the Farmers by Districts, 1985 ....... 129
viii
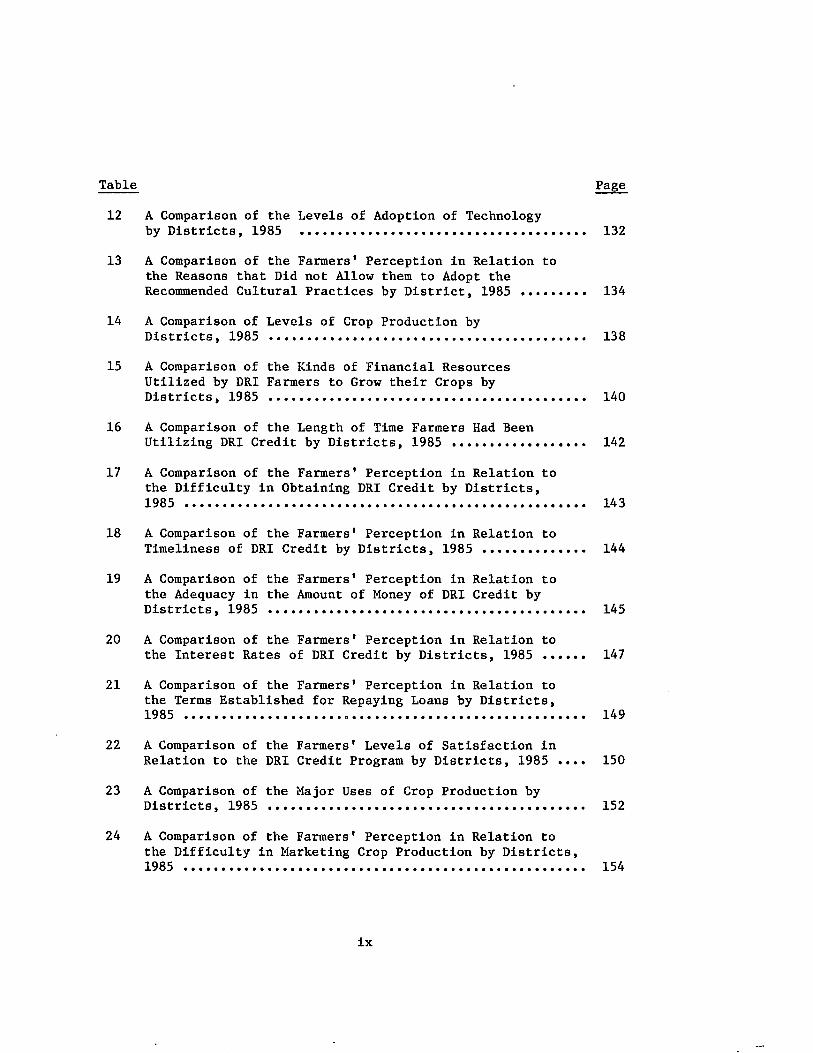
Table Page
12 A Comparison of the Levels of Adoption of Technologyby Districts, 1985 132
13 A Comparison of the Farmers' Perception in Relation to the Reasons that Did not Allow them to Adopt the Recommended Cultural Practices by District, 1985 ........ 134
14 A Comparison of Levels of Crop Production byDistricts, 1985 ................... 138
15 A Comparison of the Kinds of Financial Resources Utilized by DRI Farmers to Grow their Crops byDistricts, 1985 ....................................... 140
16 A Comparison of the Length of Time Farmers Had Been Utilizing DRI Credit by Districts, 1985 ................ 142
17 A Comparison of the Farmers1 Perception in Relation to the Difficulty in Obtaining DRI Credit by Districts,1985 .................................................. 143
18 A Comparison of the Farmers' Perception in Relation to Timeliness of DRI Credit by Districts, 1985 ............ 144
19 A Comparison of the Farmers' Perception in Relation tothe Adequacy in the Amount of Money of DRI Credit byDistricts, 1985 ....................................... 145
20 A Comparison of the Farmers' Perception in Relation tothe Interest Rates of DRI Credit by Districts, 1985...... 147
21 A Comparison of the Farmers' Perception in Relation tothe Terms Established for Repaying Loans by Districts,1985 .................... 149
22 A Comparison of the Farmers' Levels of Satisfaction in Relation to the DRI Credit Program by Districts, 1985 .... 150
23 A Comparison of the Major Uses of Crop Production by Districts, 1985 ....................................... 152
24 A Comparison of the Farmers' Perception in Relation to the Difficulty in Marketing Crop Production by Districts,1985 .................................................. 154
ix
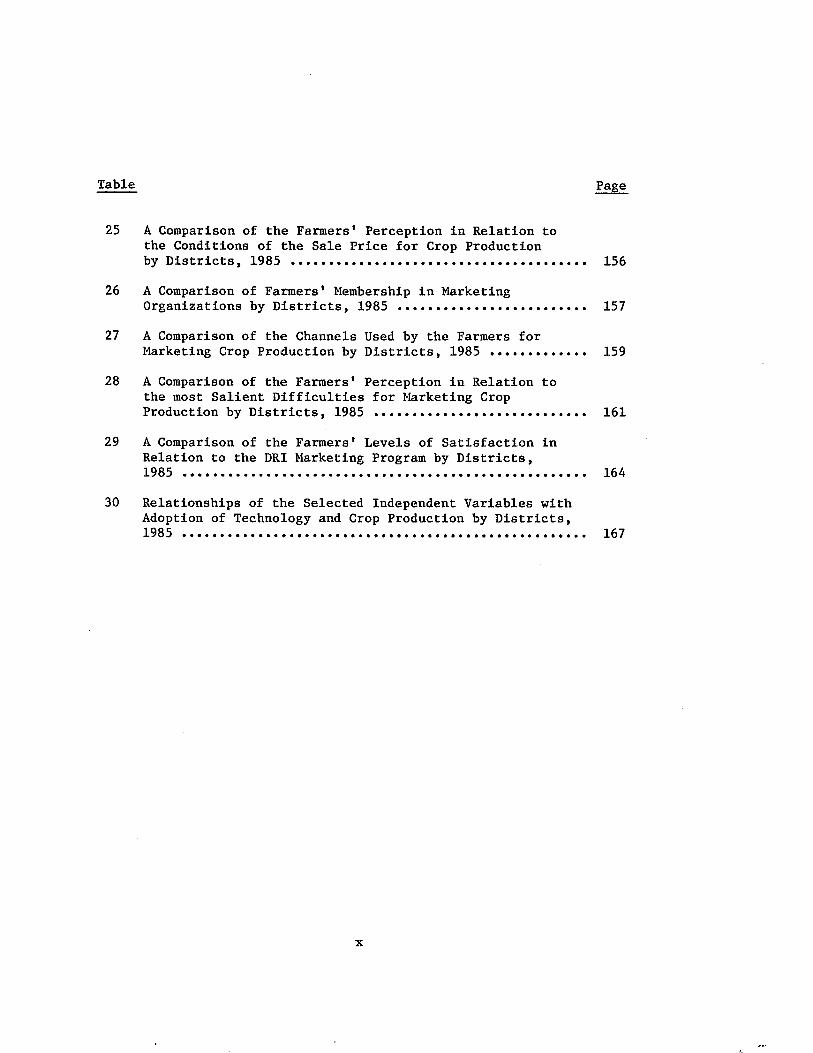
Table Page
25 A Comparison of the Farmers’ Perception in Relation to the Conditions of the Sale Price for Crop Productionby Districts, 1985 .................................... 156
26 A Comparison of Farmers' Membership in Marketing Organizations by Districts, 1985 .................. 157
27 A Comparison of the Channels Used by the Farmers for Marketing Crop Production by Districts, 1985 ............ 159
28 A Comparison of the Farmers' Perception in Relation to the most Salient Difficulties for Marketing CropProduction by Districts, 1985 .......................... 161
29 A Comparison of the Farmers' Levels of Satisfaction in Relation to the DRI Marketing Program by Districts,1985 .................................................. 164
30 Relationships of the Selected Independent Variables with Adoption of Technology and Crop Production by Districts,1985 .................................................. 167
x
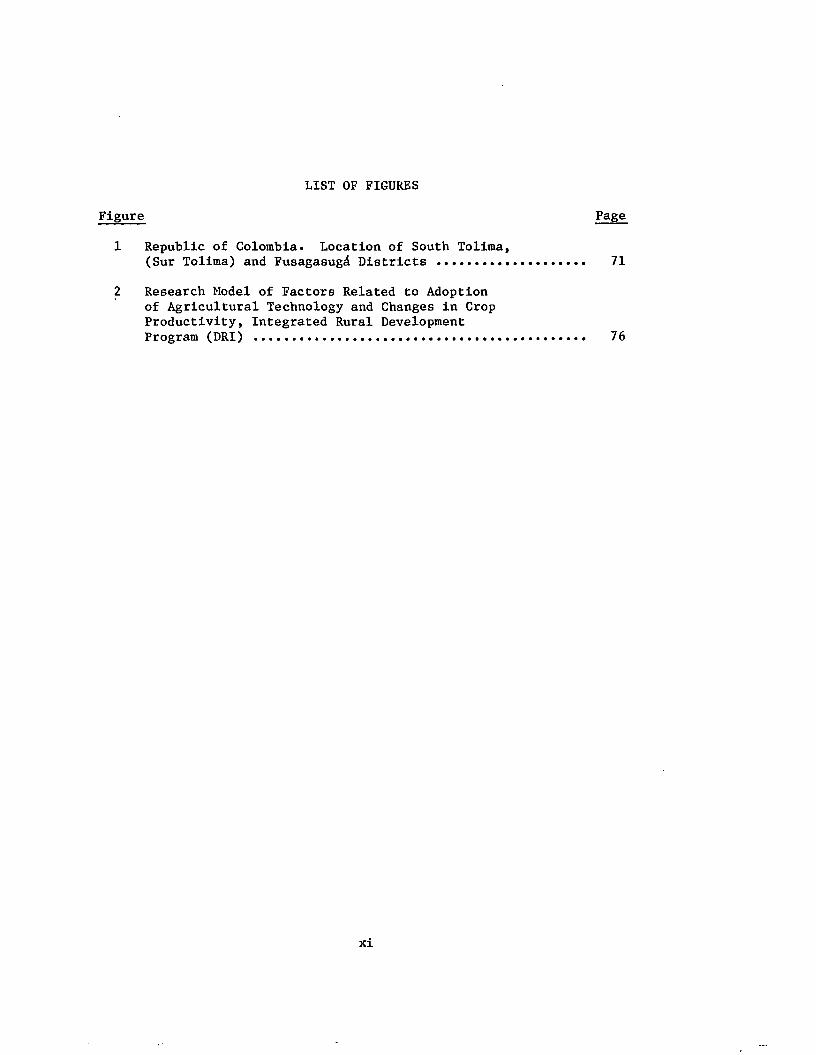
LIST OF FIGURES
Figure Page
1 Republic of Colombia. Location of South Tolima,(Sur Tolima) and Fusagasugd Districts .................. 71
2 Research Model of Factors Related to Adoption of Agricultural Technology and Changes in Crop Productivity, Integrated Rural DevelopmentProgram (DRI) ......................................... 76
xi
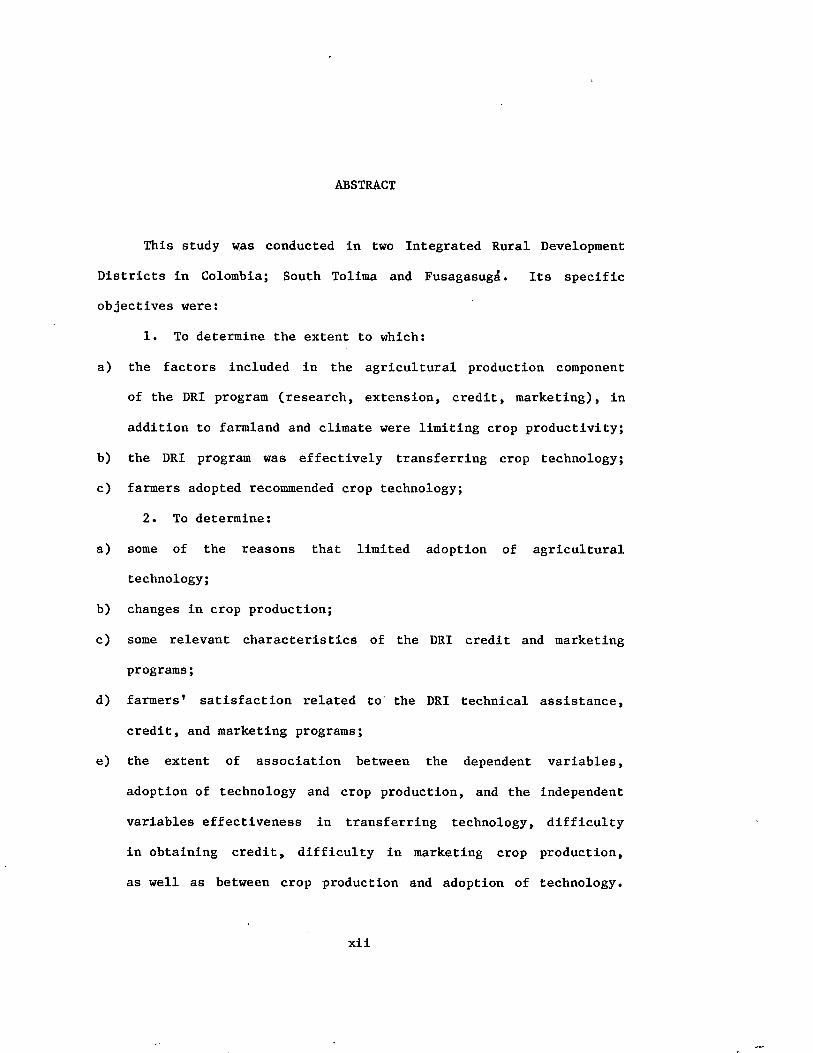
ABSTRACT
This study was conducted in two Integrated Rural Development
Districts in Colombia; South Tolima and Fusagasuga. Its specific
objectives were:
1. To determine the extent to which:
a) the factors included in the agricultural production component
of the DRI program (research, extension, credit, marketing), in
addition to farmland and climate were limiting crop productivity;
b) the DRI program was effectively transferring crop technology;
c) farmers adopted recommended crop technology;
2. To determine:
a) some of the reasons that limited adoption of agricultural
technology;
b) changes in crop production;
c) some relevant characteristics of the DRI credit and marketing
programs;
d) farmers' satisfaction related to the DRI technical assistance,
credit, and marketing programs;
e) the extent of association between the dependent variables,
adoption of technology and crop production, and the independent
variables effectiveness in transferring technology, difficulty
in obtaining credit, difficulty in marketing crop production,
as well as between crop production and adoption of technology.
xii
Sixty cooperating farmers were selected at random from each
district for a total sample of 120 respondents. Data were collected
through an interview schedule, and statistically analyzed.
The major conclusions were as follows:
1. Some progress in agricultural production was evident in
both districts as supported by some improvements in crop production.
Nevertheless, agricultural development has been taking place slowly
and it is not yet at the desired level.
2. Appropriate conditions of research, extension, credit,
marketing, farmland, and climate were not present in the most
appropriate mix in order to maximize productivity and accelerate
development. These factors affected productivity and development to
a different extent in each district. Inappropriate marketing condi
tions were perceived by the farmers as the principal constraint to
crop productivity, while credit was perceived as the least limiting
factor.
3. In order to further accelerate agricultural development,
greater emphasis is needed on generating appropriate crop technolo
gies, adapted to local farming conditions, on proper and effective
technology transfer to the farmers. Stable and effective local
organizations are necessary for these conditions to exist, particu
larly to support marketing activities. Risk and uncertainty to the
farmer must be reduced as much as possible so that change can be
facilitated.
xiii
CHAPTER I INTRODUCTION
Colombia is a typical agricultural country. Approximately
thirty six percent of its population is made up of rural people who
depend on agricultural production for their living. The total
population is estimated at 28 million. There are about 1.9 million
small rural families who live on about 1.6 million farms of less than
20 hectares (50 acres) (131, p. 7).
Agriculture and livestock are fundamental for the country's
overall economy. They provide the principal products for export, the
raw materials for • industry, and most of the food for national
consumption.
Agriculture and livestock are favored by the country's peculiar
topographic and climatic conditions. Wide variation in topography,
which heavily influences the climate, allows diversity and speciali
zation in agricultural production. As a tropical country, and due to
its position near the equator, Colombia has little variation in
seasons, which enables the cultivation of crops and the raising of
cattle the year around.
Colombia has two different types of agriculture. They are the
modern or commercial sector and the traditional sector, both charac
terized by differences in development and structure in regard to
1
farmland, capital, labor, levels of technology, use of credit, and
marketing facilities.
Modern agriculture involves both commercial and industrial
crops and large livestock enterprises. It constitutes the most
dynamic sector of the agricultural economy. Crops are grown and
livestock is raised on the more fertile lands in a modernizing setting,
with appropriate mechanization, specialized labor, availability of
credit and marketing facilities, modern technology and agricultural
inputs. The modern sector produces the majority of agricultural
export products and industrial raw materials, representing approxi
mately sixty five percent of the national income (39, p. 9).
The traditional sector is composed of rural communities with
small holdings or parcels, many of them located on marginal lands and
in isolated places, where small-scale farmers or peasants face socio
economic and technological problems. In addition, this sector is
characterized by limited access to land and the use of land, capital,
modern technology, lack of appropriate marketing and transportation
facilities, slow technological progress, and low agricultural produc
tivity. The traditional sector produces the majority of internal
consumption foods (55 percent). Although Colombia exports some
agricultural and livestock products, the country has to import other
agricultural commodities to meet national food needs. The importation
of foods and agricultural raw materials reached the amount of US
$1,167.6 millions during 1982-83 (131, p. 13).
The development of the modern agricultural sector is adequate,
but it is low in the traditional farming area. There are still many
technological, economic, and social factors associated with the poor
socio-economic conditions of traditional rural families.
The development process in the traditional rural sector in
Colombia could be accelerated at the same time as the technological,
economic, and social problems could be overcome. It is not an easy
task, but it could be possible with a major effort and participation
by the government, and with a better coordination and integration
among the agencies involved in the rural sector. Furthermore, the
active participation and interest of the farmers is also crucial.
The development of the Colombian traditional rural sector is a
pressing need for the welfare of the country's rural population.
Statement of the Problem
Like many other developing countries, Colombia is known for its
poverty in the rural area. There is a great gap between the tradi
tional and the modern agricultural sectors in relation to the techno
logical, economic, and social conditions.
With very few exceptions, most of the traditional rural sector
is characterized by low agricultural productivity. This level of pro
ductivity is due to low average crop and livestock yields, high costs
per unit of production, and unfavorable prices offered for the farm
products.
With few exceptions, most of traditional agriculture is found
on lands with low or fair levels of fertility, lacking appropriate
technology. Traditionally, little attention had been given to agri
cultural research under conditions of small farms. Only in the middle
of the 1970s the government began to pay attention to this situation.
Since then, a small part of the traditional sector has counted on
some national and external financial resources that have been invested
to generate appropriate technology for this sector. Many limitations
of former extension programs were evident due, in part, to the
inability to adapt and apply proper farm technology to the different
conditions of traditional farming. Sometimes, it seems that there is
not adequate understanding between extension personnel and agricul
tural researchers to overcome properly the technological problems of
traditonal agriculture.
In addition, the limited agricultural research findings avail
able to the traditional agricultural sector had not had a proper
impact on productivity because many of the findings had not been made
known to most of the small farmers. It was due possibly to inade
quate programs of technology transfer or inadequate dissemination of
agricultural information.
An unequal distribution of the land exists and the majority of
the farms are "minifundia”. Seventy five percent of the farms are
less than 10 hectares, representing 7.5 percent of the total farmland.
Twenty five percent of the farms are less than one hectare, repre
senting 0.5 percent of the total farmland (30, p. 177). Some

progress has been made by reallocating land resources through the
agrarian reform programs and colonization projects, but they have not
been successful enough. Nevertheless, ownership is the predominant
land tenure status, followed by renters, share-tenants, and squat
ters.
With few exceptions, agricultural credit for small farmers has
been difficult to obtain due to its many requirements and red tape.
Credit has also been insufficient and time consuming. Loans have
been granted predominantly at high interest rates and with short term
due-dates on installment-pay plans. Nevertheless, agricultural credit
has been improving, especially through specific government programs.
Official resources for credit have been increasing and the interest
rates and installments have been becoming more adequate for the small
farmers.
Generally, agricultural production in the traditional sector is
also characterized by disorderly and inefficient markets, which are
very unstable. Relative prices for farm products vary widely and, in
most cases, they are unfavorable for the farmer. There are many
intermediaries in the marketing chain. Farm and institutional storage
facilities are inadequate, limited, or nonexistent. There is a
shortage of farm-to market roads, and in many places it is necessary
to carry farm products on muleback.
Social conditions of the traditional rural sector are reflected
on its general poverty, characterized by low levels of living, mal
nutrition, poor housing conditions, poor health conditions, low levels

of formal and informal education, and poor infrastructure. In
addition, there are high rates of population growth, unemployment, and
rural-urban migration. The social public services such as schools,
health centers, communication facilities, protection for life and
property, family health and life insurance, public utilities, and
recreation facilities are poorly developed or nonexistent in many
places. Farmers' participation in organized activities and local
government decisions is also low.
Many efforts have been devoted by the government in order to
improve the socio-economic conditions of the poor rural families, but
not all of them have been successful. As a strategy for accelerating
the development of the traditional sector, the government established
the Integrated Rural Development Program - DRI - in 1975. The DRI
program is based on the integration and coordination of the govern
ment's rural services. Its objective is oriented to improve the
economic and social conditions of the rural population. The strategy
of the DRI program consists of three groups of components and their
factors. They are: 1) The agricultural production component, which
includes agricultural research, agricultural extension, farm credit,
marketing, and reforest; 2) the social component, which includes
community organization, education, health, nutrition, housing, and
drinking water; and 3) the infrastructure component, which includes
roads and transportation facilities, rural electrification, and
agroindustries.
Due to the interinstitutional character of the DRI program,
each set of factors is under the responsibility of one or several
government agencies. Their activities are oriented under the policy
of coordination and integration of services at local, regional, and
national levels. Farmers in DRI areas are supposed to benefit by all
the DRI services and components.
The agricultural production component includes the activities
related to technological development, and it is aimed to improve the
economic situation of the rural families by increasing farm income
through the improvement of agricultural production and productivity.
Some of the purposes of the DRI's production component are
oriented to develop agricultural research for the traditional sector,
to develop adequate means of transferring technology, to provide
adequate farm credit, to improve marketing facilities, to increase
basic food supplies, and to improve agricultural production and
productivity.
The accomplishment of these objectives are under the responsi
bility of different agencies. The Colombian Agricultural Institute
(ICA) is in charge of generating and transferring appropriate techno
logy through agricultural research and extension. This agency is
constantly in contact with the farmers through its extension program.
The Agrarian Credit Bank (CAJA AGRARIA) is in charge of providing
farm credit, and it is also a distributor of farm inputs and sup
plies. The Central Cooperative of Agrarian Reform (CECORA) and the
Cooperative Financial Fund (FINANCIACOP) are in charge of developing
the marketing programs for the improvement of marketing systems and
facilities.
The activities of the DRI program are carried out through DRI
districts, which are composed of several minicipalities and villages
with similar socio-economic, technological, and environmental charac
teristics.
Many improvements have been obtained through the DRI program,
but not all of its objectives have been reached successfully, as they
had been stated by the government. Up to 1984, only five percent of
the total rural families with farms less than 20 hectares had been
benefited directly by the DRI's agricultural production component
(131, p. 13). Some DRI districts are more developed than others, and
some of them are older than others.
In some DRI areas agricultural productivity has increased while
in some others it has remained the same or little Improvement has
been made. It is known that the development, influence, and impact
of each one of the factors of the agricultural production component,
especially technology, credit, and marketing, are not the same
everywhere. They vary from one district to another, thus stimulatingf
or limiting, to some extent, the agricultural production of a given
district. It seems that those production factors are associated with
adoption of technology and with crop yields.
Frequently, the failure in both the adoption of appropriate
technology on the part of the farmers and the improvement of crop
productivity has been associated with inadequate programs of diffusion

of technology or Inadequate technical assistance, without talcing into
account the influence that some other factors, such as land tenure,
availability of financial resources, agricultural inputs and supplies,
and marketing facilities could have had.
It is sound to affirm that agricultural production and produc
tivity can increase when the different factors of the agricultural
production component are available to be used and applied efficiently
by the farmers on their farms. Nevertheless, this condition is not
always given in DRI areas. The availability of appropriate techno
logy, the effectiveness in transferring this technology adequately,
the availability of sufficient financial resources, the availability
of adequate marketing systems and facilities, the farmers' interest
and motivation to adopt technology, etc., are not always the same and
they vary from one DRI district to another. In this case, agricul
tural productivity could be limited to the extent in which these
factors are lacking.
This study was oriented to determine, according to the farmers'
perception, those factors involved in the DRI's agricultural produc
tion component, that were associated with crop productivity and to
identify some of their characteristics, as well as to determine and
compare to what extent those factors were associated with the adop
tion of technology and increase of crop yields in DRI areas where the
DRI services had been provided for different length of time.
Furthermore, this study also intended to determine the levels of
farmers' satisfaction in relation to those limiting factors.

10
General Purposes
The general purposes of this study were:
1. To determine the extent to which selected factors-*- were
limiting crop productivity in areas of integrated rural development
as perceived by farmers, and to identify relevant characteristics of
some of these factors.
2. To determine to what extent these selected factors were
associated with adoption of agricultural technology and with increase
of crop yields.
3. To determine the levels of farmers' satisfaction as related
to some of the selected crop productivity limiting factors.
Specific Objectives
The specific objectives of this study were:
1. To determine the extent to which selected factors were
limiting crop productivity at the farm level in areas of integrated
rural development.
1-Most of the factors selected were those included in the DRI's agricultural production component (research, extension, credit, and marketing). In addition, farmland and "other factors" were also included in the list.

11
2. To determine the extent to which the DRI program was
effectively transferring agricultural technology in areas of inte
grated rural development.
3. To determine the extent to which farmers had adopted re
commended crop practices, and to determine some of the reasons why
farmers had not adopted new technology in areas of integrated rural
development.
4. To determine changes in crop production in areas of inte
grated rural development.
5. To determine some relevant characteristics of the DRI credit
program and the DRI marketing program in areas of integrated rural
development.
6. To determine the farmers’ satisfaction levels in relation
to the DRI technical assistance program, the DRI credit program, and
the DRI marketing program.
7. To determine the extent of association between adoption of
technology and a) effectiveness in transferring technology (techni
cal assistance), b) difficulty in obtaining credit, and c) diffi
culty in marketing crop production.
8. To determine the extent of association between increase in
crop yields and a) effectiveness in transferring technology,
b) difficulty in obtaining credit, c) difficulty in marketing crop
production, and d) adoption of technology.

12
Definition of Terms
Some terms used in this study may not be explicitly explained
in the chapters where they appear. For the purposes of this study,
the following terms and definitions were used:
Appropriate Technology: cultural practices that have been
tested and adapted under local farming conditions, which have been
proved as efficient in terms of crop productivity and profitability,
and have met the farmers' needs and expectations.
Transfer of Technology: process whereby the DRI program
communicates or disseminates and encourages the use of technological
crop recommendations that have been proved as appropriate under local
conditions in order to improve crop productivity. Transfer of
technology, technical assistance, and extension are used as inter
changeable terms.
Limiting Factor: technological, climatic, or related circum
stance that affects or limits crop productivity. The crop producti
vity limiting factors involved in this study were research, exten
sion, credit, marketing, farmland, and climate.
Crop Productivity: economic efficiency of a crop in terms of
profitability - net profit. It is measured as the difference between
the total income obtained from the sale of the crop production and
the total expenses or total production costs.
13
Crop Production: amount of crop product obtained per area or
per farm. It is also related to crop yields per hectare.
Intermediaries; merchants or traders who intervene between the
farmers (producers) and the consumers in the marketing process.
They, generally, offer unfavorable marketing conditions for the crop
products obtained by the farmers.
Satisfaction: fulfillment of aspirations, needs, and wants or
the acomplishment of goals and objectives of the farmers. In this
study, reference is done to the farmers' satisfaction in relation to
technical assistance, credit, and marketing.

CHAPTER II THEORETICAL FRAMEWORK
Review of Literature
The Concepts of Agricultural and Rural Development
Developing countries are known for their poverty in the rural
sector. The majority of rural communities face many technological,
economic, and social problems. It is well known that most of the
developing regions in the world are predominantly agricultural.
The role of agriculture in the processes of economic and social
development in these nations has received much attention by govern
ments and international organizations during recent decades. It has
been said that without progress in agriculture, development won't
occur, and the "vicious circle of poverty and low productivity will
be perpetuated" (6, p. xv).
In relation to the importance of agriculture, Gallis et al.
(46, p. 476) point out: i
Agriculture is the one sector that produces food. Mankind can survive without steel or coal or even electric power, but not without food. For most manufactured products, in fact, there are substitutes, but there is no substitute for food. Either food must be produced within a country or it must be imported.
14
15
Sixteen years ago, Mosher (96, p. 7) said that agriculture was
the only way to produce food on which human beings depend and that it
was necessary to narrow the gap between the increasing population and
the world's food supply. He also said: "This will require faster
agricultural development in the next twenty years that almost any
country has ever accomplished in the past." For this author, agri
cultural development is a social and economic accomplishment and a
part of the general development of a country.
The concepts of "agricultural development" and "rural develop
ment" have been used interchangeably to denote different and some
times conflicting approaches related to the rural sector. Before
defining these concepts, it is necessary to analyze the concept of
"development".
"Development" has been defined as a widely participatory pro
cess of social change in a society intended to bring about both
social and material advancements for the majority of people through
their gaining greater control over their environment (112, p. 121).
Ellis (40, p. 11) states that "development" is the improvement of
living conditions. Weitz (133, p. 58) defines "development" as "a
continuous process of change which is manifested in all aspects of
human life and social behavior". Todaro (129, p. 87, 580) contends
that "development" is the process of improving the quality of all
human lives, and that three equally important aspects of development
are the following: "(a) raising people's living levels, i.e., their
incomes and consumption levels of food, medical services, education,

16
etc., through 'relevant1 economic growth processes; (b) creating
conditions conducive to the growth of people's self-esteem through
the establishment of social, political, and economic systems and
institutions which promote human dignity and respect; and (c)
increasing people's freedom to choose by enlarging the range of their
choice variables, e.g., increasing varieties of consumer goods and
services."
The above definitions involve, explicitly or implicitly, social
and economic concepts. Thus, it can be said that "development" is
concerned with the social and economic changes required to improve
continuously the conditions of living of people.
Agriculture and rural are sometimes used as synonymous terms
(126, p. 4). Nevertheless, some authors recognize that rural de
velopment contains agricultural development or, in other words, that
agricultural development is required for rural development.
Aziz (7, p. 285) emphasizes the need to distinguish between
the physical characteristics of agricultural development and the
social dimensions of. rural development. This author says that the
task of increasing crop production through larger investment and
improved technological packages could lead to agricultural development
but not to rural development, because rural development has to start
with people and not with physical elements such as land and water.
Maos (85, p. 3) points out that agricultural development is viewed
as a short-term transitional phase of economic growth rather than a
way of life, and that nonquantitative properties such as social
17
stability, quality of life, well being, or even health are generally
ignored.
According to Mosher (97, p. 12-36), the term "agricultural de
velopment" involves at least six related but individual concepts:
agricultural expansion, increased production per acre, agricultural
growth, rising value of agricultural products per farmer, rising
income per person employed, and agricultural transformation. Barra-
clough (9, p. 51, 62) adds the concept of agricultural growth per
capita to those given by Mosher.
It has been pointed out that the main objective of agricultural
development is aimed usually at increasing agricultural output, while
the principal purpose of rural development is aimed at improving the
material and social welfare of the rural population (92, p. 31).
"Rural development" has been referred as a strategy designed to
improve the economic and social life of the rural poor, including
small-scale farmers, tenants, and the landless (134, p. 3; 19,
p. 147). A more integrated concept of "rural development" has been
defined by Lowdermilk and Laitos (83, p. 691) as "a continuous process
of planned social, political, and economic change in rural and urban
social structures and organizations which provides for adequate
incentives, production possibilities, and services to help rural
people achieve higher levels of living, knowledge, and skills. Rural
development helps to modify their physical and social environments
and maintain sustained progress toward desired goals which the rural
poor helps establish and implement over time."
18
Summing up, rural development involves the improvement of both
the economic and the social welfare of rural people. Agricultural
development, in terms of economic growth by increasing farm production
and productivity, is a prerequisite for rural development. Most of
the time, rural people need to improve their economic situation to
improve their social conditions.
The concepts of agricultural and rural development are useful
to analyze the integrated rural development approach.
The Concept of Integrated Rural Development
The importance of the rural sector in developing countries
began to be taken into account in the 1950s (127, p. 3). As a
result, a community development movement expanded during that decade
to Asia, Africa, and Latin America (53, p. 404). According to Hayami
and Ruttan (53, p. 405), these community development programs were
criticized for failing to improve the economic and social welfare of
rural people. It seems that little importance was given to agricul
ture in the traditional rural sector.
Agricultural development became one of the major concerns to
most developing countires during the 1960s and 1970s and each one of
these nations attempted to devise strategies which could be useful in
improving its social and economic rural conditions (104, p. 213). In
1961, the Latin American Presidents, meeting in Punta del Este,
Uruguay, signed an agreement in which they agreed to take special
19
actions on various fronts to accelerate economic and social develop
ment in their countries. Agriculture was one of the fields that
deserved special mention. It was stated:
We will modernize the living conditions of our rural population, raise agricultural productivity in general, and increase food production for the benefit of both Latin America and the rest of the world. The living conditions of the rural workers and farmers of Latin America will be transformed to guarantee their full participation in economic and social progress. For that purpose, integrated programs of modernization, land settlement, and agrarian reform will be carried out as the countries so require. Similarly, productivity will be improved and agricultural production diversified. Furthermore, recognizing that the Continent's capacity for food production entails a dual responsibility a special effort will be made to produce sufficient food for the growing needs of their own peoples and to contribute toward feeding the peoples of other regions (4, p. 9, 10).
During the decade of 1960 some production-oriented programs
such as the "green revolution" were established in different countries
around the world. Agriculture reached some degree of modernization
in various developing countries, but in the majority of them it still
remained traditional, characterized by low levels of productivity.
It seemed that the objectives of these production programs were not
accomplished as they were stated, and not every rural family equally
benefited.
In 1971 a symposium on Agricultural Institutions for Integrated
Rural Development was convoked in Rome by the FAO in order to analyze
new strategies to improve the economic and social development of
20
rural regions. On that occasion, it was recognized that rural
development depends on the interaction of several interrelated
activities and that an integrated program could contribute to the
improvement of agricultural production and rural welfare (118,
p. 394). This approach rose, in part, as a reaction to some of the
dissapointments of the green revolution and other production-oriented
programs carried out during the 1960s (117, p. 9; 127, p. 20).
The rationale for "integrated rural development" as stated by
FAO (41, p. 4) is that "this represents a coordinated - or even
simultaneous - series of measures on several fronts to tackle the
multiple constraints to improving farm livelihood."
According to Jedlicka (70, p. 108), an efficient integrated
rural development strategy must involve both a vertical and a horizon
tal linkage relationship among all of the change agencies and other
support groups involved in a given country to overcome rural problems.
This approach is related to that of Howell (59, p. 5) who points out
that the implementation of rural development programs must be the
responsibility of different ministries and government agencies in
cluding agricultural production, agricultural trade and credit, rurali
infrastructure, rural public services, and rural industry and employ
ment.
The Rehovot approach to integrated rural development as stated
by Weitz (133, p. 11) is based on a defined strategy and a planning
methodology of determining activities and the sequence of implementa
tion in order to accomplish development goals; execution (implementa
21
tion) varies from place to place according to the socio-economic
characteristics and conditions of each region. This approach is also
based on the assumptions that agricultural growth is the key to rural
development, that the development of the secondary and tertiary
sectors is required for agricultural development, and that social
forces are indispensable in agricultural development.
Based on their experiences derived from Colombian cases, Londono
and Rochin (81, p. 273) consider "integrated rural development" as
"the process by which the effort of various (multisectorial ) govern
ment agencies are integrated with those of the rural people themselves
so as to realize both agricultural development and improvement in
such other areas as health, education, and social justice."
The Bangladesh Academy for Rural Development at Comilla was
considered as the pioneer of the integrated rural development programs
(118, p. 395). This program was successful in relation to diffusion
of more productive agricultural technology, mobilization of local
resources for village improvement, and the development of cooperative
institutions. The cooperatives were in charge of providing credit,
transferring technical information, developing infrastructure faci
lities such as roads, and irrigation and drainage projects (53,
p. 408).
During the 1970s many integrated rural development programs
were established in various developing countries such as the Philip
pines, Ethiopia, Afghanistan, Nigeria, Tanzania, Malawi, Kenya, Nica
ragua, Mexico, Perd, Colombia, etc. (53, p. 407).
22
In 1975, the Integrated Rural Development Program - DRI - was
established in Colombia as a strategy for accelerating the development
of the traditional rural sector. This program was based on the
integration and coordination of the government's rural services and
attempts to overcome farmers' economic problems through agricultural
production programs, and to improve social conditions in relation to
health, education, nutrition, community organization, infrastructure,
etc. Currently, there are 31 districts in different regions of the
country where the DRI program is being carried out.
E valua tions conducted by the N ational P lanning Department (DNP)
(Departamento Nacional de P laneac idn) (33, p. 2-48; 34, p . 2, 3), the
government agency in charge of co o rd in a tin g the d i f f e r e n t a c t i v i t i e s
of the DRI program, have shown th a t t h i s program has been s u c c e s s fu l
in some d i s t r i c t s and has f a i l e d in o th e r s .
The degree o f success o r f a i l u r e has depended on s o c i a l ,
economic, te c h n o lo g ic a l , s t r u c t u r a l , i n s t i t i t u t i o n a l , and environmen
t a l f a c t o r s , bu t the e x te n t to which th e se f a c to r s a f f e c t the means
and goa ls of the program a re not w ell known, hence t h i s re se a rc h
p r o j e c t .
Factors Associated with Agricultural and Rural Development
As it was stated, rural development depends, in part, on agri
cultural development, which in turn, depends, to a great extent, on
agricultural change. Agriculture does not change by itself. It
23
requires a complex, interrelated set of factors (systems, elements,
services, ingredients, components, activities, variables, etc.) which
facilitate or limit change.
Social, economic, technological, environmental, and institu
tional factors can influence positively or negatively the processes
of agricultural and rural development. It depends on the extent to
which those factors are present or lacking in particular situations,
as well as on their characteristics and performance. The extent of
influence can also vary from place to place according to the condi
tions or characteristics of the environment, the community, the farm,
the family, or the farmer.
There are many descriptive, analytical, and empirical studies
carried out in different developing countires on factors associated
with agricultural and rural development.
According to Mosher (96, p. 47, 91), the development of agri
culture cannot be accomplished by farmers acting alone; it cannot
develop beyond simple farming without suitable improvements in other
parts of the life of a country within which agriculture exists. This
author classifies the elements or factors of agricultural development
as essentials and accelerators. The essential factors are: markets
for farm products, a continually changing technology, local sources
of supplies and equipment, production incentives for farmers, and
transportation. The accelerators are: education for development,
production credit, group action by farmers, improving and enlarging
agricultural land, and national planning for agricultural development.
24
This author points out that the essential elements "must be provided
for farmers if agriculture is to develop. Without any of them there
can be no agricultural development", and that the accelerators are
important, but "there can be agricultural development without one or
more of them."
Moris (94, p. 35) classifies the components or essential
ingredients for agricultural development in three different groups:
1) those ingredients that are the base for agricultural production
in any farming system either traditional or modern such as resources
(land, water, and climate), crops (suitable varieties, required
technology, and control of pests and diseases), and labor (farm labor
force); 2) those additional components which depend on an estab
lished communication network responding to market forces such as
demand (marketing surplus on-farm and off-farm demand and exchange),
transport (transportation facilities, intermediary storage and mar
keting systems); and 3) other additional ingredients which trans
form farming into a kind of rural industry involving changing tech
nology and specialized production such as research (development of
new varieties, technologies, and recommendations), extension (dif
fusion of innovations and training by transferring skills and manage
ment) , inputs (production and supply of inputs and specialized
supporting services), finance (crop purchasing organization, and
credit), and incentives (reduction in levels of risk, profitability
of crops, and social and administrative incentives).
25
The World Bank (135, p. 6, 72) points out that the constraints
of agricultural growth in developing countries are found in the
environment in which farmers operate, in the technology available to
them, in the incentives for production and investment, in the
availability and price of farm inputs, and in the provision of
irrigation and other appropriate infrastructure. The World Bank says
that land improvements, new farming methods, and more research are
necessary requirements for agricultural development and that, however,
these factors are not sufficient conditions for its attainment by
themselves, the reasons being that it requires some other complimen
tary but important services such as infrastructure, extension, mar
keting, credit, and rural public works.
Studies analyzed by Castillo (3, p. 19), related to the impact
of high-yielding varieties of rice in changing the socio-economic
conditions of certain rural areas in Philippines, showed that the
principal factors required to increase agricultural production were
technology (improved varieties, fertilizers, and irrigation), ex
tension (transfer of technology), credit (provision of financial
resources), and marketing and related services (milling, storage, and
transportation).
Donald (37, p. 17), analyzing the characteristics of credit in
the process of development of the rural sector in several developing
countries, concluded that besides credit, other elements such as
availability of new technology, inputs, and favorable product markets
are indispensable for small farmer development. Long (82, p. 27) has
26
a similar perception, based on his studies in developing regions;
he states that "for the success of a credit program more than money
is needed. There must be a new technology, markets that can supply
additional inputs and absorb additional outputs, institutions willing
to lend to small farmers on terms the farmers consider attractive,
and, perhaps, more important farmers willing to borrow, to invest and
repay loans."
From a comparative evaluation of 17 rural development projects
from East and West Africa, Lele (77, p. 287) concluded that lack of
profitable technology, ineffective extension, and inadequate tech
nology (i.e., fertilizers) are common constraints to improve pro
ductivity in all subsistence agriculture. This author suggests the
following to insure an efficient agricultural development process in
those countries: "... in the first phase provision of technology,
extension, inputs, manpower training, and a feeder road network ...
Credit may become the major thrust of the program. Marketing services
may also fall in the category of facilitative development at an early
stage. The initial emphasis may be on providing intermediate forms
of intervention and on improving the bargaining position of the
farmer ... through construction of public facilities for seasonal
storage, improvement of roads, provision of farmer information, and
standardization of weights and measures.”
Based on experiences in East and West Africa, Asia, and Latin
America, Abbot (1, p. 153) concludes that for a successful agricul
tural development program an efficient extension program is required
27
to disseminate appropriate technology, credit facilities must be
available, and ready access to a marketing system is imperative.
In studies carried out in Kenya, Malaysia, Indonesia, Nigeria,
and South Korea, it was found that increased agricultural productivity
requires the provision of adequate services, principally research to
generate technology appropriate for small farmers, extension, credit,
and appropriate pricing and marketing policies, as well as the pro
vision of incentives to motivate farmers to act (22, p. 349).
Other studies mentioned by Castillo (18, p. 312) and conducted
by the Rice and Corn Study Committee indicate that the low production
and productivity in rice and corn in some areas of Philippines was
due to inefficient transfer of technical information to the farmers;
inadequate financial resources and lack of credit supervision; lack
of and high cost of agricultural inputs and equipment, as well as
lack of irrigation water; inefficient organization of farmers, mil
lers, and retailers; disincentives to farmers due to inappropriate
pricing and monetary policies, inefficient marketing systems, ware
housing, and milling; lack of coordination among the agencies in
volved in the production process; inappropriate implementation of
land reform; lack of civic consciousness and national discipline;
and disastrous effects of hurricanes.
Some experiences in Colombia have demonstrated that the parti
cipation of rural people when they are motivated to change is indis
pensable in rural development programs, and that an effective inte
gration and coordination of the different government rural services
28
(research, technical assistance, credit, marketing, agrarian reform,
natural resource conservation, health, nutrition, housing, education,
infrastructure, etc.) are the primary requirements to improve the
material and social welfare of the rural families (51, p. 230).
Johnston (71, p. 297) asserts that research, extension, credit,
marketing, land reform, farmers' education and organization, and
other economic and social factors are substrategies which must be
appropriately complemented and implemented under a general integrated
strategy in designing effective development programs.
The above mentioned authors coincide in most of their appre
ciations about the factors, components, or ingredients that are
associated with agricultural and rural development. Those factors
could be grouped in two big groups, economic and technological factors
and social factors. The most important economic and technological
factors are: agricultural research to generate appropriate techno
logy, extension to transfer that technology and to provide technical
assistance, credit to encourage the use of recommended technology,
marketing to facilitate the allocation of farm surplus, provision of
agricultural inputs and transportation, and availability of appropri
ate farmland. The principal social factors are: health, education,
nutrition, housing, farmers' organization, public infrastructure, and
other public services. It also is necessary to take into account the
environmental and institutional factors. This study deals only with
those factors included in the DRI's agricultural production compo
nent; i. e. agricultural research, agricultural extension, farm
29
credit, and marketing. Land tenancy has been listed as not being
an important limitation for agricultural development in the DRI areas
in Colombia since the majority of the DRI users are owners of their
farms. Nevertheless, some references will be made in relation to the
role of the land in agricultural development.
Some of the most important aspects to take into account in any
agricultural or rural development program are effective integration
and coordination among the different intervening factors, and the
motivation of farmers to insure their participation in pursuing common
objectives; i.e. in obtaining improvements in their economic and
social conditions.
Agricultural Technology
Experiences in developed countries have demonstrated that
modernization in agricultural technology has been a prerequisite in
accomplishing high levels of agricultural and rural development (108,
p. 93).
It has also been recognized that agricultural technology is one
of the most important variables in any strategy of development in
developing countries (87, p. 29; 17, p. 226), and that the level of
production technology is an outstanding factor influencing the eco
nomic outcomes of any agricultural or rural development program (133,
p. 19). New technology is an absolutely vital component in any
strategy aimed to improve agricultural production and productivity.

30
Research in developing countries has often failed by generating
or promoting technologies not suitable for the traditional agricul
tural sector (70, p. 9). Tinnermeier (128, p. 38) states that too
often research in these countries generates new technologies for
medium and large-sized farms in experiment stations, many of which
are located on the best land, with good availability of resources,
under conditions different to those where most of the small farmers
are living. Chambers and Ghildyal (20, p. 5), analyzing the charac
teristics of agricultural research for small farmers, state:
In most agricultural sciences, the centers in which research is conducted are experimental stations, glasshouses and laboratories, supported by back-up services, with provision for controlled conditions, with excellent access to inputs, without significant cost or labor constraints, and without the requirements that a crop must be marketed and make a profit. Scientists in experimental stations, glasshouses and laboratories generate or test, new technologies and then pass them over the extension services to transmit to farmers.
Experiences in Tanzania, the Cameroons, and Kenya have demons
trated that inadequate adaptative research has been a major constraint
in improving agricultural productivity and incomes of small farmers
(77, p. 287). In 1982, the World Bank (135, p. 91) contended that
the lack of technological improvements suitable for African conditions
was a "main reason for Africa's poor performance so far", and suggested
the need to conduct research to generate agricultural technologies
that can be adapted to local conditions of small farms.
31
It has been recognized that in most traditional agricultural
areas in developing countries many new technologies have not been
tested and adapted under conditions similar to those faced by the
farmers, or if adapted, such technologies still may be unprofitable
(128, p. 38).
Based on a study carried out in Colombia to define the relevant
constraints for research resource allocation, Sanders and Lynan (119,
p. 273) concluded that "less emphasis should be put on testing for
wide adaptation of new varieties and more emphasis on better
qualifications of potential research benefits through networking in
the target area. Data collection efforts should be focused more
towards the research problem of priority definition." In relation to
the low use of improved seeds in the traditional rural sector in
Colombia, Sin Clavijo (125, p. 10, 15) states that the new crop
varieties generated by research have not benefited small farmers
because those materials were, possibly, not adapted to the conditions,
the production systems, and the resources of that type of farmer. He
adds that it seems that there is not a defined research policy oriented
toward the traditional subsector which meets the needs and expecta
tions of small farmers. In another study conducted in the South of
Tolima DRI district, Colombia, some farmers reported that they did
not use improved varieties of corn because the yields were lower than
those of traditional varieties, the production costs were higher
since they required more fertilizers and weed control practices, the
32
seed was more expensive and more difficult to obtain, and because of
increased risk (56, p. 62).
The importance of adaptative research cannot be overstated
(77, p. 287). "There is no such thing as an universally best
technology for agriculture." (46, p. 491). New technology must be
tested and adapted from area to area, taking into account the soil
and climatic conditions, and according to the economic and social
characteristics of the farmers.
Research for the traditional rural sector in developing
countries must be oriented to generate profitable technological
packages directly on the farmers' holdings. Tinnermeier (128, p. 38)
contends that research must be aimed toward the production of those
output-increasing or cost-saving technologies appropriate for small
farmers, and that any new agricultural recommendation must be finally
tested to determine its economic performance for the farmer on his
own. Based on a study conducted in Philippines in relation to on-
farm research, Potts et al. (109, p. 40) state that "even in areas
already achieving average yields, there may be groups of farmers for
whom alternative technologies would be beneficial. These technolo-(
gies may not necessarily involve an increase in agronomic yield, but
can still result in improved monetary returns. Such technologies
appear most likely to be accepted." It has been recommended that for
a higher level of adoption, new technologies must be properly
tested in terms of profitability according to the farmers' needs

33
and circumstances before any attempt to transfer it to the farmers
(101, p. 77).
Experiences in a rural development program in Caqueza, Colombia,
point out that the formulation of agricultural technological packages
meeting the farmer's needs is "a far more demanding task than
scientifically trained agronomists at first assume." (139).
Dissatisfaction with the accomplishments of research for the
traditional rural sector has been evident in developing countries.
This situation has led to the development of more appropriate research
methodologies and strategies which could be more likely to meet the
needs of the small farmers. One of these strategies has been called
farming systems research (FSR) (100, p. 813; 48).
Farming systems research has become a major issue in interna
tional circles. According to Garrett (47, p. 580), the Consultive
Group of International Agricultural Research (CGIAR) stated the
objective of this approach as "the improvement of human welfare
through sustainable increased agricultural productivity." This author
says that FSR helps orient agronomic research by improving problem
identification, designing new and/or improved production systems,
conducting and evaluating on-farm research, and assessing the impact
of recommended technologies for the traditional rural sector.
Farming systems research is a term used to cover the activities
of interdisciplinary programs carried out directly on the farmers'
fields to generate appropriate technologies to overcome agricultural
production problems (12, p. 133). FSR has evolved to strengthen
34
linkages between farmers and researchers and to emphasize agricultural
research under the different physical, economic, and sociocultural
conditions of the rural people (72, p. 82).
According to Byerlee et al. (16, p. 897), the objectives of
research with a farming systems perspective range from increasing the
knowledge about farming systems to solving specific problems in the
farming system. These authors state that the aim of FSR is to
increase farm productivity by generating new technologies appropriate
for the farmers and that "this research is often further divided into
location-specific research with a short-run objective of developing
improved technologies for a target group of farmers and research
conducted with a long time perspective to overcome major widespread
constraints in faming systems." This situation is referred as
"downstream” and "upstream" (48).
Hildebrand (58, p. 905) contends that FSR should be more than a
part of a dynamic research system, that it must be a part of a complete
technological system, and that research and extension must merge to
ensure effectiveness in agricultural production and productivity.
Some authors (58, p. 905; 72, p. 81) agree that FSR is not an
appropriate name for this approach and that it must be called faming
systems research and extension.
It has been stated that an efficient research and extension
system is crucial to agricultural development, and that farming
systems research without extension is an incomplete process (72,
p. 81, 85). Biggs (11, p. 5) says that "FSR is an applied problem

35
solving approach to technology generation and diffusion... FSR is
frequently seen as the critical research component which facilitates
the linkages and flows of information between farmers, researchers on
experiment stations and extension staff."
The following are some of the common features that characterize
a farming systems research and extension process, as perceived by
Biggs (11, p. 2): 1) all activities of the farmer are analyzed in
an holistic farming systems framework; 2) relatively homogeneous
groups of farmers are identified as the clients of research and
extension in specific agro-climatic zones; 3) it is an interdis
ciplinary approach, involving social scientists and natural scien
tists; 4) it is mainly concerned with ’downstream' (applied)
research issues and with ways of ensuring effective linkages to
influence 'upstream' (basic) research activities; 5) it involves
farmer participation; 6) it involves on-farm trials, surveys
(socioeconomic and technical), and different diffusion methods; and
7) it is a dynamic 'learning by doing' approach.
Many failures of former agricultural development programs have
been evident in Colombia due, in part, to inadequate methodologies to
generate and adapt technologies suitable for the traditional rural
sector. Extension programs attempted to transfer research findings
obtained in experiment stations to farmers without previous adaptation
to their local environmental, social, and economic conditions. There
was a lack of defined research policies oriented to solve the immediate
agricultural problems faced by the traditional rural communities.
36
Only, in the last decade, some attempts have been made to overcome
this situation, especially through the DRI program. Nevertheless, as
it was already stated, this program covers only five percent of the
small rural families. The farming systems research and extension
approach has been applied to generate and transfer technology to
these families. It has been recognized that the DRI program has
been successful in some regions and has failed in others in its
attempt to generate appropriate agricultural technologies for the
traditional rural sector.
Appropriate Technology
It seems that there is no consensus in relation to the meaning
attached to the concept of appropriate technology. It means many
things to many people and everybody perceives this concept in a
different way.
De Forest (28, p. 11) points out that appropriate technology
has not in itself an intrinsic meaning as a concept and that it can
only be understood in relation to specific social, economic, and
cultural referents.
Jedlicka (70, p. 10), talking about the organization for rural
development, states that an appropriate technology is one that
effectively utilizes the manpower, resources, and environmental and
institutional realities in a given country. According to the Ministry
of Overseas Development, HMSO, London, as referred to by Milles
37
(87, p. 2), a technology is appropriate when it maximizes the use of
those factors which are locally plentiful and minimizes the use of
those which are locally scarce. For McDivitt and Ntim (86, p. 157),
appropriate technology is that which fits best with the life style of
the people who use it, taking into account their economic, physical,
and cultural environments, and regardless of its traditional, adapted
or imported origin.
Hildebrand (57, p. 375), analyzing the change process, contends
that the reason for the resistance, on the part of many small farmers,
to adopt or to change is not one of motivation but rather one of
lacking available technology which is appropriate for their needs.
This author considers that appropriate technology is that which is
acceeptable to target farmers and can be put into practice immediately
under their agro-socioeconomic conditions.
For the purposes of this study, appropriate technology is
referred to the cultural practices that have been tested and adapted
under local farming conditions, which have been proved as efficient
in terms of crop productivity and profitability, and have met the
farmers' needs and expectations. An appropriate agricultural tech
nology can be either a traditional technology (developed by farmers
at the local level) or a new technology. Traditional technolo
gies and new technologies or innovations can be considered as appro
priate only if they satisfy the particular needs and expectations of
farmers.
38
In relation to farming, it has been said that traditional
technology is "the particular way the inputs of land, labor, seed,
hand implements, oxen, organic fertilizer, and water have been
combined and used in a particular area over a considerable period of
time" (128, p. 36). The principal characteristic of traditional
technology is that it changes very slowly (46, p. 489).
"New technology" has been defined as "a set of inputs or factors
of production which are different from a traditional set - that is,
at least one factor has been added, dropped, or changed in some way"
(46, p. 36).
Rogers (112, p. 11) says that an innovation is "an idea,
practice, or object that is perceived as new by an individual or
other unit of adoption”, and that "the perceived newness of the idea
for the individual determines his or her reaction to it.” Tinnermeier
(128, p. 36) points out that adoption of a new technology or innovation
does not imply that new practices are necessarily the result of recent
scientific discoveries, and that the word "new" means only that the
practices in question have not previously been used by the farmers in
a given area.f
Appropriate technology, therefore, is an inherent component of
agricultural and rural development. For a new technology to be
effective it must be transferred to farmers to be applied to improve
agricultural productivity, and it must work properly under the
farmer's conditions. That is appropriate technology.
39
Transfer of Technology
The success of any agricultural development program depends to
a large extent on effectiveness in disseminating and introducing
appropriate technology among the farmers so that their farm
productivity and incomes are improved. It seems that some agricul
tural projects in developing countries have not had a significant
impact on crop production and productivity because technology has
not been properly transferred. In Colombia, for instance, former
extension programs and other agricultural development projects were
not successful enough in attaining their objectives due, in part, to
inadequate methodologies of technology transfer or inadequate
dissemination of agricultural information.
Different meanings have been given to the concept of transfer
of technology. There are many definitions about this term involving
controversial points of view or approaches.
Rogers (111) considers that technology transfer is the process
in which an innovation generated in one system is adopted for use in
another system. According to Reichart (110) the transfer of
agricultural technology as a system is a group of elements which
applied in an orderly manner contribute to improved production in an
agricultural production system. Jedlicka (70, p. 12) points out that
transfer of technology is a component within the innovation diffusion
40
process and that transfer occurs when the innovation or technology is
adopted.
Diffusion has been defined by Rogers (112, p. 5) as "the process
by which an innovation is communicated through certain channels over
time among the members of a social system." He adds that it is a
type of communication of new ideas or innovations. This author
defines communication as "a process in which participants create and
share information with one another in order to reach a mutual
understanding." According to Brown (14, p. 1) diffusion is the
process by which innovations (a new product, technology, idea, or
practice) spread from one locale or one social group to another.
For the Colombian Agricultural Institute (ICA) (65, p. 3), one
of the government agencies in charge of transferring agricultural
technology to DRI farmers, the transfer of technology is a process
involving not only the diffusion but also the adoption of technical
recommendations. In this case, the adoption of technology would
depend on the feasibility of increasing farm productivity and on
other factors as considered by farmers.
For the purposes of this study, the transfer of technology is
considered as the process whereby the DRI program communicates or
disseminates and encourages farmers to use technological crop
recommendations that have been proved as appropriate under local
conditions in order to improve crop productivity. Transfer of
technology, technical assistance, and extension are used as inter
changeable terms, therefore.
41
It has been said that "if one key to rapid progress in rural
areas depends on the introduction of new inputs and new techniques,
it follows that some of the most important rural institutions are
those responsible for speeding the transfer of these new techniques
to the farmers" (46, p. 502). In fact, technology does not move from
research sources to farmers unless there is a means or vehicle to do
that (72, p. 85). Extension has been considered as one of the most
effective means to link research and farmers.
According to Tinnermeier (128, p. 42), extension is an educa
tional program in charge of disseminating new technologies among
farmers. This author says that an effective extension program would
be one which significantly increases the adoption of new technology
as compared with the level of adoption which would take place if it
does not exist.
From his studies on agricultural development in developing
countries, Mollett (92, p. 328) concludes that agricultural extension
has a key role in transferring new technologies among farmers and
that the essential ingredients for the success of extension services
are not always given, and sometimes the ability to transfer attractive
technological packages fails. It has been pointed out that the
effectiveness of transferring technology in developing countries does
not depend entirely on the abilities and capabilities of the extension
agents but also in the role of an extensive number of intervening
variables such as political commitment, development of institutional
42
resources, development of effective research, and availability of
required financial support (70, p. 31).
From the extensive review of literature conducted by Rogers
(112), it can be concluded that there are many factors influencing
the diffusion or transfer of innovations or agricultural technologies,
and that they vary among regions, communities, and individuals. The
effectiveness in transferring technology can depend, among others, on
the following factors: the characteristic of the technology or
message itself; the capabilities of the extension agent or communica
tor; the means and channels used to transfer the information; the
social, economic, technical, and cultural characteristics of the
farmers; the environmental conditions of the setting where the trans
fer of technology occurs; the organization and other characteristics
of the social system in charge of transferring technology, etc.
The means and channels of communication through which farmers
receive agricultural information are varied and their effectiveness
depends on many factors. The applicability of communication methods
differs from people to people and from region to region. An analysis
conducted by Arevalo and Alba (5, p. 80) in relation to the research
on agricultural communication in Colombia shows that the most
effective method to transfer technology among farmers in the rural
setting was interpersonal communication between change agents and
farmers, especially through farm visits, followed by different types
of group meetings, and demonstrations conducted by opinion leaders.
Secondary importance was assigned to the radio and newspapers.
43
Studies undertaken to evaluate the effectiveness of the DRI program
indicate that the most effective means to transfer technology in DRI
areas, Phase I, were result and method demonstrations, farmers'
tours, research demonstration plots, group meetings, and field days
(33, p. 45). As a consequence, it has been demonstrated that
effectiveness in transferring agricultural technology plays an
important role in the adoption process.
Adoption of Technology
Most of the traditional rural regions in developing countries
face low agricultural productivity. Agricultural technology has been
considered as a prerequisite to promote agricultural development in
these nations. It may not be the sole requisite, but it is at least
one of the most critical. In fact, the impact of agricultural
technology depends on a network of relationships with other technolo
gical, economic, social, environmental, and structural factors.
Leagans (76) contends that the pay-off in agricultural develop
ment comes only when farmers act on new knwoledge, not when they merely
have been exposed to it, and that transferring technology is a
relatively easy task, but getting people to understand, accept, and
adopt it is a difficult one.
Adoption of new agricultural technology has been considered as
an important field of study not only in developed but also in
developing countries. A large amount of descriptive, analytical,
and empirical literature has evolved. Most of the studies have
44
demonstrated that the adoption patterns are not always the same
everywhere and that they can change due to many factors. Just and
Zilberman (74, p. 435) state that the interaction among the various
factors (social, economic, technological, cultural, institutional,
and environmental) vary from place to place, presenting different
adoption behavioral patterns. It could explain why, sometimes,
studies about adoption of agricultural technology, conducted in
different regions or countries, generate conflicting conclusions' in
relation to the same variables under study.
Based on theoretical and empirical studies analyzed by Rogers
(111) and by Lionberger and Gwin (79) it can be concluded that the
following factors are associated with diffusion and adoption of agri
cultural innovations:
- Personal characteristics of the farmers: social status, social
participation, values, attitude toward change, degree of inno
vativeness, literacy and levels of formal and informal education,
levels of homophily and heterophily, fatalism, cosmopolitness,
age, health, occupation;
- Economic factors: availability of economic resources, attitudeI
toward credit, attitude toward economic rewards, uncertainty and
risk, land tenure status, etc.;
- Situational factors: size of farm, soil quality, water supply,
climatic conditions, labor supply, government policies, farm
inputs, storage and transportation facilities, availability of
extension education programs, marketing facilities, price policies;
45
- Communication behavior: exposure to mass media and interpersonal
channels of communication, appropriate use of communication
methods, characteristics of the change agent contact;
- Relationships between the characteristics of the agricultural
innovation and the needs and problems of farmers; and
- Needs and desires of the farmers.
Diaz Bordenave (36, p. 151), in his study on communication of
agricultural innovations in Latin American countries, points out that
the adoption of a new technology is a decision of the farmer based on
four ingredients: willingness to do things, knowledge of what to do,
knowledge of how to do, and availability of the means to do.
Studies conducted in developing countries have demonstrated
that the introduction and acceptance of many new agricultural
technologies have been partially successful as measured by observed
rates or adoption (44, p. 255). In fact, new technology by itself is
not a sufficient motivation and cause of success.
Experiences in some agricultural development programs carried
out in Nicaragua and Indonesia show that new agricultural technology
was not completely adopted by farmers because of constraints in land
tenure, marketing policies, lack of credit, and due to its low
profitability (37, p. 40). Based on some Colombian study cases,
Isaza (69, p. 37) concludes that agricultural technologies are adopted
if they are economically attractive, and if financial resources are
available for the farmers. Hernandez (55, p. 82) found in the
Northwest of Quindio, Colombia, that the adoption of crop technology
46
was related to the Incomes of the farmers, the size of their farms,
and the availability of marketing facilities. Information from
several developing countries shows that farm ownership, size of farm,
education, income, and social participation of the farmers are
positively associated with readiness to adopt new agricultural
technology (102, p. 43).
Perrin and Winkelman (106, p. 893), analyzing the adoption
behavior of small and large farmers based on studies undertaken by
CIMMIT, concluded that the extent of differences in adoption is due
to differences in information, in the availability of farm inputs, in
marketing opportunities, and in differences in farm size and farmer
risk aversion. The differential adoption rates in some agricultural
development programs in Bangladesh, India, and Pakistan were due to
farm size and credit constraints; in regions with high concentrations
of small farms and where credit was limited, small farmers were not
able to adopt all the cultural practices required to grow high-
yielding crop varieties (43, p. 59).
An evaluation of some DRI districts in Colombia showed that the
low level of adoption of recommended cultural practices was due to
lack of adequate technical assistance, high levels of rural-urban
migration, lack of enough training of some extension agents,
inappropriate technology in some instances, high economic risk, and
farmers uncertainty (33, p. 29).
Labor availability is often mentioned as a factor affecting
adoption of agricultural technology. Feder, et al. (44, p. 277), in
47
a survey about the patterns of adoption of agricultural innovations
based on information from Taiwan, Gambia, Philippines, and Sierra
Leone, found that frequently, shortage of labor supply is related to
adoption of crop technology, and that adoption is less attractive for
farmers with limited family labor or for those operating in areas of
difficult access to labor markets. The authors point out that
uncertainty in relation to availability of labor in peak seasons can
explain adoption of new labor-saving technologies.
Level of education is one of the variables often analyzed in
studies about the adoption of innovations. Results from several
empirical studies in developing countries show that farmers with
better education are earlier adopters of new technologies (44,
p. 276). In a survey based on information from 18 developing countries
it was found that the effect of education was much more likely to be
positive in modern agriculture than in the traditional setting (80,
p. 37).
In a study conducted in Thailand, Pontius (108, p. 93) deter
mined that the major barrier to rapid adoption was the farmers'
inadequate access to information about the crop technologies being
recommended.
The adoption of an agricultural innovation depends, in part, on
the characteristics of the innovation itself; these characteristics
are: relative advantage, compatibility, complexity, triability, and
observability (112, p. 15).
48
Other factors that have been widely analyzed in adoption studies
are related to resistance of fanners to change. Resistance has been
defined as "any conduct that serves to maintain the status quo in the
face of pressure to alter the status quo" (137, p. 63).
Rohrer (113, p. 300), in a study on conflict between modern and
traditional technologies concluded that the resistance of farmers can
be associated with the social gap between them and the change agent,
and that this resistance could indicate that development projects or
technologies are sometimes irrelevant or of little interest for
farmers. This author states:
Traditional farm families do not summarily resist new ideas. They have adopted radios, consumer goods, wage work, and health practices because clear benefits existed or because the new methods were necessary, inexpensive, subsidized, or convenient. But in farming they strongly prefer using low-risk, low cost methods validated by generations of local use.
Zaltman and Duncan (137, p. 67) classify resistance to change
in four different types: cultural, social, psychological, and
organizational barriers to change. These authors also mentioned
certain facilitative strategies to overcome resistance and to make
easier the implementation of change, assuming that a target group
recognizes a problem, agrees with the need for change and can be open
to external assistance (137, p. 90).
Resistance to change depends on the attitudes, values, and
behavioral patterns of the farmers. It has been stated that obtaining
adoption of new ideas in audiences which are resistant to change is

49
slow and requires a great deal of effort and additional cost (23,
p. 22).
In a study conducted in Colombia, Isaza (68, p. 116) found
that, based on characteristics of the farmers in East of Antioquia,
adoption of agricultural technology was associated with the availa
bility of financial resources, farmland, and technical assistance, and
that traditionalism of the farmers was not a major constraint in
agricultural production. Castillo (18, p. 118), analyzing the
characteristics of some groups of farmers in Philippines in relation
to the adoption of crop practices, points out: "resistance to change
per se is not likely to be the bottleneck in increasing productivity.
The constraints seem to be lack of infrastructure, facilities and
services."
There are evidences showing that the apparent resistance of
farmers to adopt can be overcome when the reasons for their behavior
are understood (121, p. 384; 133, p. 32). Weitz (133, p. 32) states:
"Occasionally, the reason for the peasant's indifference is less
tangible and more difficult to comprehend, and only careful studies
will disclose its nature. The task is to uncover the reasons for
the peasant's attitude and to show how his aspirations can be directed
towards the achievement of desired development goals."
According to Galjart (45, p. 31), certain characteristics of
the farmers can explain why they do not always have a positive attitude
to change. These are the following: 1) ignorance - the farmers do
not know what they can do other than what they are currently doing;
50
2) inability - the farmers know what they could do but are unable to
do that for financial or other reasons; and 3) unwillingness - the
farmers know what they should do and can do, but they do not want to.
Risk and uncertainty have been other factors considered as
important in limiting adoption of agricultural technologies. Bohlen
and Beal (13, p. 9) say: "As a farmer faces decision making and
carrying out decisions, he is confronted with risk and uncertainty."
Agriculture has been considered as an uncertain and continuously
risky enterprise; its efficiency, structure, and performance may be
influenced by agricultural decision makers' responses to risk (73, p.
1107). Evidences show that new modern technology is an important,
risky and uncertain factor in farming (13, p. 11). Thus, it is argued
that smaller farmers are less motivated to adopt new agricultural
technologies provided that they are more risk aversive (43, p. 59).
Uncertainty is a pervasive phenomenon in agricultural production
(52, 1071). According to Roumasset (115, p. 48), uncertainty refers
to the state of mind of a decision maker who perceives more than one
possible consequence of a particular act. This author says that risk
is likewise a property of uncertainty. Risk refers to a situation int
which the probability of obtaining some outcome of an event is not
precisely known (129, p. 605).
Risk and uncertainty have been considered as critical limita
tions in the process of agricultural production (37, p. 40; 42,
p. 100; 78, p. 680). In relation to this approach Donal (37, p. 40)
states:
51
Researchers are recognizing more and more that risk is a significant factor in small farmers' decision making. Even the most illiterate farmers place probabilities on the outcomes of their farming decisions. Since they cannot accept conditions which might jeopardize their family's survival, their economic decisions attempt to reduce risk and to increase security. The added risk associated with new technologies can significantly affect the extent to which they are adopted ... In sum, it should be obvious that the adoption of new technology and its profitability are significantly affected by the associated risk. Small farmers are frequently regarded as ignorant, stupid, or too 'traditional' when they reject the innovations proposed to them, but from their own standpoint they may be quite rational in their responses. The dominant failure in much developmental work related to technological innovations has been the lack of understanding of the relationship between the expected variances of the old and new techniques with the level of living of the intended clientele.
According to Moscardi (95, p. 39), socio-economic and structural
characteristics are important variables explaining the risk-bearing
capacity of farmers. Small farmers are risk aversive due to their
proximity to subsistence levels of living; modern techniques are more
profitable on the average than traditional ones, but they are riskier
as well; this situation frequently induces small farmers to use less
than the amount of crop inputs recommended for the new technology
(115, p. 55). This kind of practice is often counterproductive; if
the technology is adopted only partially productivity can be affected
negatively.
In a study conducted in Cdqueza, a rural development project in
Colombia, it was found that risk was one of the most critical
limitations to the adoption of new corn technology. Three kinds of
risks were determined: 1) production risk, which included the

52
variations in yield, depending on causes not controlled by the
farmers, such as differences in quality of soils and climatic varia
tions during the growing period; 2) marketing risk, which involved
the presence or lack of a market, changes in price, and changes in
demand; and 3) institutional risk, related to the presence or
absence of seed, fertilizer, and other material inputs at the proper
time, and the timely availability of credit, transportation, and
technical assistance (140, p. 154).
Experience has shown that farmers adopt new agricultural tech
nology only when they prove to themselves that the techniques are
not very risky (130, p. 70).
Since risk and adoption are related, and taking into account
that agricultural production depends to a large extent on adoption of
new technologies, attempts must be made to reduce risk and increase
security. Adequate results will be obtained when those in charge of
generating and transferring technology understand and pay attention
to the behavioral patterns of the farmers.
Credit
Credit has been considered as one of the most universal and
flexible transferable forms of economic resource (37, p. 17), and it
has become a most significant input into agricultural production (50,
p. 568). It has been recognized as a key component of agricultural
and rural development in developing countries. It has also been said
53
that the provision of agricultural credit not only removes financial
constraints but may also promote the adoption of new technologies and
the commercialization of the rural economy (90, p. 203).
There has been controversy regarding the role of the credit in
agricultural and rural development in developing countries and
different and conflicting approaches have been stated.
Long (82, p. 28), analyzing the conditions for success of small
farmer credit in developing countries, indicates that formerly it was
believed that the shortage of credit was an obstacle in agricultural
production for small farmers; he refers to Shult's approach (122)
stated in the 1960s in the sense that capital was not a significant
constraint on the output of farmers in traditional agriculture. This
author also refers to studies conducted by Nisbet (98, p. 37) in
Chile in 1967, by Miller (88, p. 13) in Peru in 1970, and by Gotsch
(49, p. 326) in Pakistan in 1972, which concluded that credit was not
an important constraint on agricultural production for small farmers
in certain crops.
Tinnermeier (128, p. 38, 40) points out that there is evidence
from studies related to the role of agricultural credit in developing
countries to suggest that profitable technology is not always avail
able when credit is granted to the farmers, and that further expan
sion or support of credit programs is not recommended until new, out
put-increasing and profitable technology is available and understood
by farmers. He also says that "extending credit in the absence of
this technology will lead to meager or even negative results from the
54
standpoint of both the borrower and the lender." In Caqueza,
Colombia, it was found that most of the farmers who obtained credit
did not apply all of the recommended cultural practices in corn
production or used smaller amounts of the inputs (i.e., fertilizer)
recommended due to increase of risk (140, p. 149). It shows that the
effect of credit on adoption of technology could depend on the presence
or absence of other factors. In relation to this aspect, Donald (37,
p. 40) says that "even if profitable new technology is provided with
credit, this may still not be sufficient for its rapid adoption. If
considerably more risk is associated with the new as compared with
the old (technologies), the small farmers may be unwilling to assume
such a risk."
Based on previous experiences in Africa, Moris (94, p. 83)
points out that production credit only becomes beneficial once farming
is predominantly monetized, the transfer of technology is efficient,
loans are secured against farmers' credit records, farmers have
adequate managerial skills, and there is a grass-roots organization
to handle the crops and deduct loan payments.
It has been recognized that small farmers in developing coun
tries who are not involved in particular development programs have
been limited in access to credit; thus they have to use loans from
informal lenders (37, p. 17). In studies carried out in some regions
of Bangladesh, Brazil, and Colombia, it was determined that farmers
preferred to obtain credit from moneylenders and not from formal
sources because institutional loans involved too much red tape, were
55
delayed in transaction, and were too rigid in repayments (3, p. 172;
99, p. 72). In another study conducted in Colombia to determine
the use and real cost of agricultural credit, it was found that many
small farmers preferred to use non-institutional sources due in part
to lack of formal credit, but also due to the substantial borrowing
costs associated with using institutional sources; this study showed
that a great amount of money and time was spent by farmers in the
loan transaction including costs for paperwork, travel expenses
incurred to negotiate the loan, costs and difficulties in obtaining a
co-signer or collateral, red tape and credit administrative costs,
and costs of the farmers’ time used to negotiate the loan (132).
At the present time, DRI credit is considered as one of the
most advantageous for small farmers in Colombia. According to the
National Planning Department (DNP) (34, p. 21), DRI credit finances,
at least the majority of production costs, does not require a co
signer or collateral, is timely, its interests are not deducted from
the loan and are lower in comparison to other types of formal credit,
and the terms for repayment are adequate; this type of credit requires
regular technical assistance, however. The main objective of DRI
credit is to encourage the adoption of recommended agricultural
technologies, hence the requirement of technical assistance.
The requirements for a farmer to become a DRI credit user are
the following: to possess and operate a farm less than 20 hectares,
regardless of the tenure status, to have a gross family income of no
more than 3,000,000 Colombian pesos (approximately 15,000 dollars),
56
and at least 70 percent of the family's income must be derived from
agricultural activities (31, p. 5; 64, p. 1).
In developing countries, generally, the credit resources are not
always appropriately distributed. Studies analyzed by Ross (114,
p. 31) indicated that in Kenya about 15 percent of small farmers had
access to government credit, but none was applied to subsistence
crops; in Bangladesh, farmers with the largest holdings received 80
percent of the agricultural bank loans, while in Philippines owners
of the largest farms obtained 98 percent of the institutional credit.
Castillo (18, p. 353), studying the role of agricultural credit
in adoption of high-yielding varieties of rice in a region of the
Philippines, points out that credit for agricultural production plays
an important role because it is required for purchasing the inputs
associated with new technologies. However, she says that "credit,
despite all the hue and cry about it, is not as salient a constraint
as perceived by farmers as water, diseases, insects and pests."
Studies conducted in developing countries have demonstrated
that credit is required for adopting new agricultural technologies if
they represent higher production costs, like in the case of additionalf
inputs (44, p. 277; 66, p. 119; 82, p. 31; 123, p. 1). The availa
bility of financial resources encourages farmers to accept and adopt
quicker new and appropriate technology. It has been said that
"without credit, some farmers will not adopt the more costly
procedures; others will adopt the new techniques but only more
slowly" (82, p. 70).
57
Colyer and Jimenez (24, p. 639), analyzing the use of supervised
credit by farmers involved in an institutional program in Colombia,
found that those farmers benefited by the program adopted more
technologies related to the use of fertilizers, pesticides, and other
agricultural inputs than those other farmers outside the program.
Studies carried out in Mexico, Ethiopia, and Colombia, have shown
that new and more profitable technologies have been successfully
introduced with the use of credit among farmers in some regions of
those countries (128, p. 40).
Studies conducted in several regions of Colombia have shown a
significant association between use of credit and adoption of
agricultural technology and improvements in crop productivity (56, p.
65; 68, p. 119; 91, p. 57). Other studies undertaken in that country
showed, in spite of the fact that the relationship between the two
variables was statistically not significant, a strong tendency to
adopt more cultural practices among farmers who used credit (105,
p. 703; 138, p. 44).
The World Bank (135, p. 76) contends that credit provided to
farmers is essential for modernization, growth, and equity. Whether
the use of credit is justified or not depends both on whether the
benefits will exceed the production costs and whether the costs of
other alternatives of production could be lower to obtain similar
outcomes (82, p. 27).
According to Donald (37, p. 18), other indirect benefits for
farmers and their families, derived from credit, could be the
58
following: independence from extortionate lenders, stronger posi
tion and advantage in the markets, improved nutrition, increased
self-respect, improved social status and political influence, access
to wider educational and occupational opportunities, etc.
The economic and social function of agricultural credit cannot
be underestimated. The purposes of credit programs for small farmers
in developing countries must be oriented not only to increase farm
production and productivity but also to improve social conditions.
Marketing
Agricultural marketing comprises all the operations involved in
the movement and trade of food stuffs and raw materials from the farm
to the final consumer, as well as the distribution and trade of farm
inputs, price policies, credit, storage, transportation, management,
farmers organization, related services, etc. (38, p. 125).
Marketing has been considered as a powerful tool in promoting
agricultural development. There is no doubt that this is an essential
factor required to increase agricultural productivity. This is the
reason why developing countries have tried to pay more attention to
this factor within the process of rural development.
The current literature is replete with studies about the effect
of marketing on farm productivity. According to Durand (38,
p. 128), the study of particularities of marketing has received
increased attention during the last 15 years, especially in Latin
59
American countries. This author contends that the findings of recent
studies show, above all, a steady similarity among different countries
in relation to agricultural marketing structures, problems,
difficulties, and possibilities. Unfortunately, it seems that very
little has been done to overcome agricultural marketing problems in
developing countries since this situation is actually considered as
one of the most critical limitations in agricultural development.
It has been stated that the specific conditions under which
small farmers operate at the village level in developing countries
are characterized by small marketeable surpluses, low degrees of
organization, lack of information about product demand, quality
standards, and prices, being far from national marketing structures,
and having insecure and instable marketing channels; all of these
factors naturally impede their integration into existing marketing
systems (26, p. 167).
Marketing can be one of the reasons for failure of agricultural
development programs. The adverse Impact of markets on adoption of
technological recommendations has been stated in several studies
carried out in Ecuador, India, Malaysia, and other developing
countries (82, p. 28). This situation is not new. In 1965-1966
small farmers in a region of India were encouraged to grow high-
yielding varieties of grain; adoption was evident and production
increased; nevertheless, the lack of adequate marketing channels and
storage facilities, as well as a decrease in price following
harvesting time, resulted in a failure of the program up to the point
60
that fanners became reluctant to work with change agents (114, p. 2).
Many marketing experts contend that the green revolution could have
been a greater success if the marketing systems had been more\
efficient (66, p. 21).
In most developing countries, marketing is carried out informal
ly by large numbers of traders "having a series of very particularis
tic, intricate, and sometimes shifting relationships with one another
(37, p. 81).” They are referred to as middlemen or intermediaries.
Middlemen are seen as "exploiters who get between the producer and
consumer, driving the price paid to the farmer down and that changed
to the latter up, with the middlemen reaping huge monopoly profits."
(49, p. 504). It is true that the middlmen provide services (picking,
cleaning, processing, packing, transporting, etc.) that need to be
rewarded, but it also is true that very often they perceive larger
benefits in comparison with those perceived by small producers (37,
p. 186).
In relation to the role of middlemen, Durand (38, p. 136, 137)
states: "A traditional point of view tend to consider middlemen, in
general, as necessary evils that manipulate prices and market
mechanisms and retain a large part of final value." This author adds
that in some cases, middlemen are necessary, and that places or
regions with problems of transportation, lack of credit facilities,
and inadequate accessibility to urban areas, contribute to recog
nizing the role of the middlemen. In his study, Durand (38, p. 138)
concludes that the smaller the farms and the larger the number of
61
small farmers, specially in case of food crops, the larger the number
of intermediary stages, and suggests that in order to overcome this
situation land reform programs or rural development projects should
consider the need to establish or keep enough market power to deal
with highly commercialized distributive systems.
Appropriate markets and adequate price incentives must exist
for a new agricultural technology to be adoptable and profitable. It
is sound to predict a positive relationship between efficiency in
marketing agricultural products and adoption of technology when it is
profitable.
Farmers in developing countries have generally responded eager
ly to appropriate marketing opportunities (135, p. 74). According to
the World Bank (33, p. 74), rubber growers in Malaysia, and cocoa,
groundnuts, and cotton growers in West Africa rapidly adopted the
recommended crop practices once marketing channels were established
in the late nineteen century; more recently in the Ivory Coast cocoa
production was encouraged and it increased from 80,000 to over 400,000
tons in two decades since 1960, largely due to incentives of fair
prices and availability of appropriate marketing facilities.
It seems that infrastructure, marketing, and agricultural pro
ductivity are also related. In fact, the World Bank (135, p. 82)
points out that the lack of roads in some regions in developing
countries may limit or prevent timely and cheap delivery of commercial
supplies, profitable penetration of markets, specialized agricultural
production, and efficient services of extension and research. A
62
similar approach is outlined by Gillis, et al. (46, p. 503) who say
that in large parts of developing countries, improvements in
transportation systems and hence in marketing facilities can exert a
major impact on agricultural productivity. These authors indicate
that "construction of an all-weather road system in Korea in the
1970s, for example, made it possible for millions of Korean farmers
to increase dramatically their emphasis on vegetables and cash crops
destined for urban and export markets. Even the simple device of
building paved bicycle paths connecting the main road made it
possible for Hong Kong farmers to expand their vegetables acreage.”
Basic infrastructure is essential for agricultural development.
Infrastructure and efficiency in marketing are closely related. The
World Bank (135, p. 45) states: "The existence and expansion of
basic infrastructure has contributed significantly to increased
agricultural output in Asia and Latin America... Marketed farm
produce is increasing sharply... Heavy investment in roads, railways,
ports, and other links in the marketing chain are required, together
with policies and institutional arrangements to ensure efficient
transport, processing, and storage."I
One of the reasons of poor marketing systems in developing
countries is related to lack of organization of the majority of the
farmers. The importance of improving farmers' organization is widely
recognized (2, p. 285). One strategy proposed to overcome, in part,
this critical situation is related to farmers' cooperatives. The
role and the impact of this type of organization has been largely
63
discussed (2, p. 285-299; 116, p. 579-596). Abbott (2, p. 290),
analyzing the studies conducted by FAO in relation to marketing
cooperatives in Africa, Asia, and Latin America concludes:
The desire to set up a marketing cooperative isgenerally provoked by a feeling that existing marketing channels are not providing an adequate service or are charging too much for it. By joining together to assemble, pack, store and sell produce, farmers may either obtain better prices directly or induce existing traders to give better prices under the pressure of new competition. Among small farmers more often, perhaps, than originating from their own initiative, cooperatives are established by governments. Administrative convenience is often a main consideration.Here it must be remembered that economic, cultural, or social homogeneity in the potential membership of a co-operative is important.
Farmers' marketing cooperatives have been successful in some
regions and have failed in others. Many of the disappointments or
failures in organizing and implementing cooperative systems result
from attempts to do this before farmers have recognized their common
interest and tangible benefits (2, p. 298), or from inappropriate
management or lack of capital (67, p. 169), or because farmers are
not adequately informed even on basic aspects of cooperatives (103,
p. 189), or due to inappropriate basic infrastructure (116, p. 58).
Ross (114, p. 18) states that cooperatives could be a mechanism
to solve marketing problems in the development process, and that a
multifunctional cooperative dealing with production, consumption,
credit, and marketing could be the first step in moving a small farmer
from a noncash into a cash economy.
64
Dams and Heyne (26, P. 170) suggest the following four-phase
strategy for improving marketing systems in agricultural production
in developing countires: 1) physical infrastructure at village level
(investment phase); 2) farmers’ organizations and service agencies
(institutional phase); 3) production - processing - marketing -
schemes (management phase); and 4) rural markets as service centers
(market phase).
Based on analyses of empirical studies on agricultural marketing
carried out in developing countries, Donald (37, p. 88) concludes the
following: 1) Marketing infrastructure can have a very important
influence on farm production and incomes, particularly feeder roads,
storage facilities, and retail channels for agricultural inputs (and
sometimes consumer goods); investment in these aspects may overcome
bottlenecks that could impede the viability of output-oriented credit
programs; 2) Credit to marketing organizations can contribute to
farm production and profitability; it may be considered as a supple
mentary source or as a possible substitute for production credit.
Innovative methods of stimulation to input suppliers should also be
considered in conjunction with other means of promoting agricultural
innovations; 3) Marketing organizations designed to improve bar
gaining positions of small farmers, such as cooperatives, should be
administered so as to maximize their services to farmers rather than
given unconditional protection.
The DRI strategy for agricultural marketing is oriented to
promote adequate commercialization channels at the urban level, to
65
promote farmers' organizations, especially rural cooperatives, to
provide technical assistance and training in marketing, to formulate
specific marketing projects through CECORA and FINANCIACOP, to
provide information about prices and terminal markets, and to provide
associative supervised credit (34, p. 24-27). It seems that the
efforts devoted by the DRI program to overcome marketing problems
have not been successful enough since marketing is considered as one
of the most critical limitations for agricultural development in some
of the DRI districts.
It has been stated that "affording access to large numbers of
rural people, the rural market can be an economical natural integrator
of a range of development activities” (89).
Adequate market incentives would encourage farmers to apply
more productive technologies in order to improve farm productivity
and family income. The agricultural market structure in developing
countries must change. The important role of agricultural marketing
in the total process of agricultural and rural devlelopment must be
fully recognized, and additional efforts must be made by governments
and farmers to overcome this critical situation.
Land
Land is one of the most appreciated natural and economic
resources in the world; it is considered as the main production factor
66
in agriculture. Land is used to produce food, raw materials, and
many goods. It involves the soil and its environment.
Land plays an important role in agriculture development in
developing countries. There are two different not mutually exclusive
ways to develop agriculture; one of them is related to incorporation
of additional land to cultivation, and the other is related to
improvements in productivity per unit of land; the first alternative
is possible without changing traditional farming methods, whereas the
second is entirely dependent on technological improvement (6, p. 24;
107, p. 35).
The shortage of and the poor quality of farmland have been two
of the principal restrictions to improve agricultural productivity.
The quality of land in many regions of developing countries is not
sufficient for substantial improvements in farm productivity; however,
experiences around the world have shown that some lands in arid,
saline, or severely waterlogged locations have been made adequate for
farming by means of irrigation, acidification, and drainage (15, p.
287). Of course, this has been and is a costly process.
An important factor in agricultural production is the motiva
tion, and willingness of farmers to apply certain techniques to
improve the quality of their farmlands such as leveling, irrigating,
and draining; farmers with a more secure tenure status are more
likely to be motivated to make such investments than those who have
less secure tenure on their land (135, p. 84). In his study about
67
modernization of agriculture in developing countries, Arnon (6,
p. 448) contends:
It has become increasingly clear that the adoption of improved techniques is not possible unless the farmer operates land which he owns or holds securely, and from which he obtains an equitable share of the produce. If he is a tenant, who retains only a small proportion of his yield and all investments conducive to higher yields have to be made at his own expense, he has no incentive to adopt improved practices. An equitable redistribution of the land is therefore an essential precondition to agricultural progress.
Some experiences in developing countires indicate that a dis
tribution of land from large estates into small peasant holdings
increases productivity due to a more intensive use of the land (46,
p. 487). Some other experiences show that agricultural output
declines because the redistribution of land is not accompanied by
complementary measures such as agricultural extension, support
services, training, and facilities (114, p. 31).
It seems that quality of land and land tenure are related to
access to credit. According to Gillis, et al. (46, p. 500), in many
areas of developing countries local moneylenders know the reliability
of the people to whom they are lending and the quality of the land
they are putting up as collateral; farmers without land have more
difficulties in obtaining loans even from local moneylenders.
It has been recognized that in most developing countries the
highly unequal concentration of land is probably the single most
important reason for inequitable distribution of income and wealth,
and that small farmers have little hope of economic and social
improvement when land is unevenly distributed (129, p. 313).

68
In many developing countries, most of the land is concentrated
in the hands of a small group of landowners, such as in Latin America;
this situation has become an obstacle for the development of the rural
sector (133, p. 67; 93, p. 138). Arnon (6, p. 46) points out that
the traditional and dominant forces of settlement in Latin America
have been the large estates - latifundia - on one hand and extremely
small holdings - minifundia - on the other, and that the minifundia
generally occupy the poorest and least accessible land.
According to Gillis, et al. (46, p. 480), conditions of land
tenure set the context within which all efforts to raise agricultural
output must operate; tenants, small holders, share croppers, etc.,
are less motivated to increase production than landlords. These
authors contend:
The kind of land tenure system that exists in any given country or region has an important bearing on economic development for several reasons. Prevailing land tenure arrangements have a major influence on the welfare of the farm family. Families that own the land they cultivate tend to feel they have a stake in the existing political order, even if they themselves are quite poor. Because they possess land they have something to lose from turmoil... Land tenure systems also have a major impact on agricultural productivity. An individual proprietor who owns land knows that increased effort or skill that leads to a rise in output will also improve his income. ,This result does not necessarily follow if the land is owned by someone else. Under sharecropping, for example, the landlord gets a percentage share, typically a half of any increase in output... Tenants otherwise would have no incentive to invest in improvements or even to maintain irrigation and drainage systems.
The Word Bank (135, p. 5) states that agrarian or land reform
increases security of tenure and increases productivity. "Land reform
69
has substantially improved rural income distribution and is the base
for subsequent agricultural progress in several countries; examples
include China, Japan, and the Republic of Korea" (135, p. 84).
Nevertheless, Arnon (6, p. 448) contends that land reform in itself
does not necessarily ensure economic development, and that it must be
supported by appropriate planning and a series of services and poli
cies related to credit, marketing, agricultural research, and exten
sion to be successful.
The DRI program was designed to operate in those regions where
the land tenure structure was not considered as an obstacle for rural
development (33, p. 6). Nevertheless, it seems that the selection of
some DRI districts was not the most appropriate since they present
some limitations in relation to availability and distribution of
land, situations that affect agricultural production and productivity.
Land by itself is not a factor included in the agricultural production
component of the DRI program.
There is strong consensus among development specialists on the
need for adequate land reform in developing countries. In 1979,
the World Conference on Agrarian Reform and Rural Development met in
Rome. They concluded that equitable distrubution and efficient use
of land is indispensable for rural development, for the mobilization
of human resources, and for increased production for the alleviation
of poverty in developing countires (29, p. 384). The Economic
Commission for Latin America has determined that land reform is a
prerequisite for agricultural development (129, p. 313).
70
Characteristics of the Selected DRI Districts
South Tolima District (Sur Tolima)
The South Tolima district lies between 3° 48' - 4° 15' North
latitude and 74° 53' - 75° 15' West longitude. This district is
located in Tolima State in the center of Colombia (Figure 1). The
DRI area is about 2,310 square kilometers (905 square miles). There
are 4,764 farms of less than 20 hectares (50 acres). Its population
is estimated at 28,670 (64, p.l).
The district is comprised of five municipalities (El Guamo,
San Luis, Valle de San Juan, Saldafta, and Espinal), and covers 43
villages (62, p. 3). At the time of collecting the data for this
study only 26 villages were receiving DRI services.
The climate is influenced by both the rainfall and the altitude.
There are two marked seasons, the wet and the dry. The average annual
rainfall is 1,530 millimeters (60 inches). The distribution of the
rainfall is not the most adequate for cropping because the rains are
concentrated during two periods, April - May and October - November
(32, p. 17).
The altitude ranges between 150 and 2,000 meters (492 - 6,560
feet) above sea level, averaging 300 meters (984 feet). Only 1.3
percent of the area is located above 2,000 meters. Temperatures
range between 24° C (75° F) and 35° C (95° F), averaging 28° C
(82° F). Eighty nine percent of the total area is hot, 9.7 percent

71FIGURE 1
Republic of Colombia. Location of South Tolima (Sur Tolima) and Fusagasuga DRI Districts
AtlanticOcean
PanamaVenezuela
PacificOcean
Ecuador
Peru Brazil
72
temperate, and 1.3 percent cool. The bioclimatic regions vary between
tropical arid woods and tropical very arid woods (32, p. 17).
The topography is characterized by lowland plains. A small
area is slightly hilly (64, p. 3).
The fertility of the majority of the soils varies between poor
and moderate. The main problem is the lack of water for agricultural
purposes. Drought is one of the principal characteristics of farm
lands in this district, which obviously influences heavily soil
fertility. The soil pH varies between 5.5 and 7.5, prevailing
slightly acid and neutral soils. The content of organic material in
the soils is low. The chemical status of the soils is poor in most
of the area. There is great variation in soil texture. There are
soils with differing content of clay, sand, and loam. Soil erosion
varies between moderate and severe (32, p. 20).
This district is also characterized by a high concentration of
"minifundia". Seventy eight percent of the farms are less than 10
hectares. Ownership is the prevalent land tenure status (32, p. 20).
The principal crops growing in this district are: sesame,
sorghum, and corn. Other crops used mostly for family consumption
are: cassava, plantains, and fruits. The principal livestock
enterprises are: beef cattle, swine, poultry, goats, and sheep.
The principal problems affecting the rural sector of this
district are: low levels of agricultural production and productivity,
inadequate marketing systems, poor quality of farmlands, lack of water
for irrigation, unequal distribution of land and other resources,
73
poor housing conditions, poor infrastructure, low levels of formal
education, poor nutrition and health conditions, and high levels of
rural-urban migration (32; 63; 64).
Extension programs have been carried out since 1968 in this
district. The DRI program was established in 1982.
Fusagasugd District
Fusagasuga district is located in Cundinamarca state in the
center of Colombia (Figure 1), laying between 3° 45' - 4° 25' North
latitude and 75° 07' - 74° 30' West longitude. It has a total area
of 1,875 square kilometers (733 square miles), 13,383 farms and a
population of 119,000 (60, p. 2).
This district is comprised of nine municipalities, but its
activities are more concentrated in five of them (Fusagasuga,
Arbeldez, Pasca, Silvania, and San Bernardo), covering 40 villages
(61, p. 2).
The climate is characterized by two seasons, the wet and the
dry. The average annual temperature is 20° C (68° F). The climate
is also heavily influenced by the altitude which ranges between 600
and 4,300 (1,968 - 14,100 feet) above sea level, averaging 1,800
meters (5,900 feet). Temperatures vary significantly according to
the altitude. Seventeen percent of the total area is very cold, 40
percent cool, 35.6 percent temperate, and 6.4 percent hot (60, p. 3).
74
The average annual rainfall is 1,500 millimeters (59 inches).
The rainfall has a seasonal character and varies year to year. There
are two pronounced rainfall periods, March through May and September
through November. The relative humidity averages 75 percent. The
bioclimatic regions vary between tropical arid woods and sub-tropical
very humid woods (60).
The topography is mostly hilly and mountainous. The fertility
of the majority of the soils is moderate; however, there are some
soils with low and some with high levels of fertility. The average
pH is 5.4, ranging between 5.2 and 5.8. The soil organic material
level is moderate. The texture of the soils ranges between loamy-
clayey and loamy-sandy. There is low soil erosion.
There is a high concentration of "minifundia". Seventy five
percent of the farms are less than 10 hectares (25 acres). Ownership
is the main land tenure status (60, p. 5).
The principal crops growing in this district are: green peas,
green beans, tomatoes, sugar cane, plantains, potatoes, fruits,
coffee, and other vegetables. The most important are green peas and
green beans. The main livestock enterprises are: dairy cattle,(
rabbits, poultry, swine, and bees (60, p. 12).
The National Planning Department (DNP) (31, p. 22) has identi
fied the following as the most important problems affecting the rural
sector of this district: low agricultural production and productivi
ty, low levels of income, inadequate use of natural resources, defi
cient physical infrastructure, low levels of education and health, low
75
community participation, high concentration of minifundia, unequal
resource distribution, and increasing rural-urban migration.
The DRI program was established in 1978; however, the extension
service had been operating in some municipalities of this district
since 1968.
The Research Model
Figure 2 shows the research model used in this study. This
model presents the DRI's agricultural production component and its
different factors (independent variables) as related to adoption of
technology and crop production yields (dependent variables).
The framework shows the process by means of which technology
generated by research is transferred to farmers through the extension
service. Agricultural credit and marketing act as important support
ing factors to facilitate adoption. Farmers adopting technology are
supposed to increase crop production yields which could represent
changes in crop productivity and farm income.
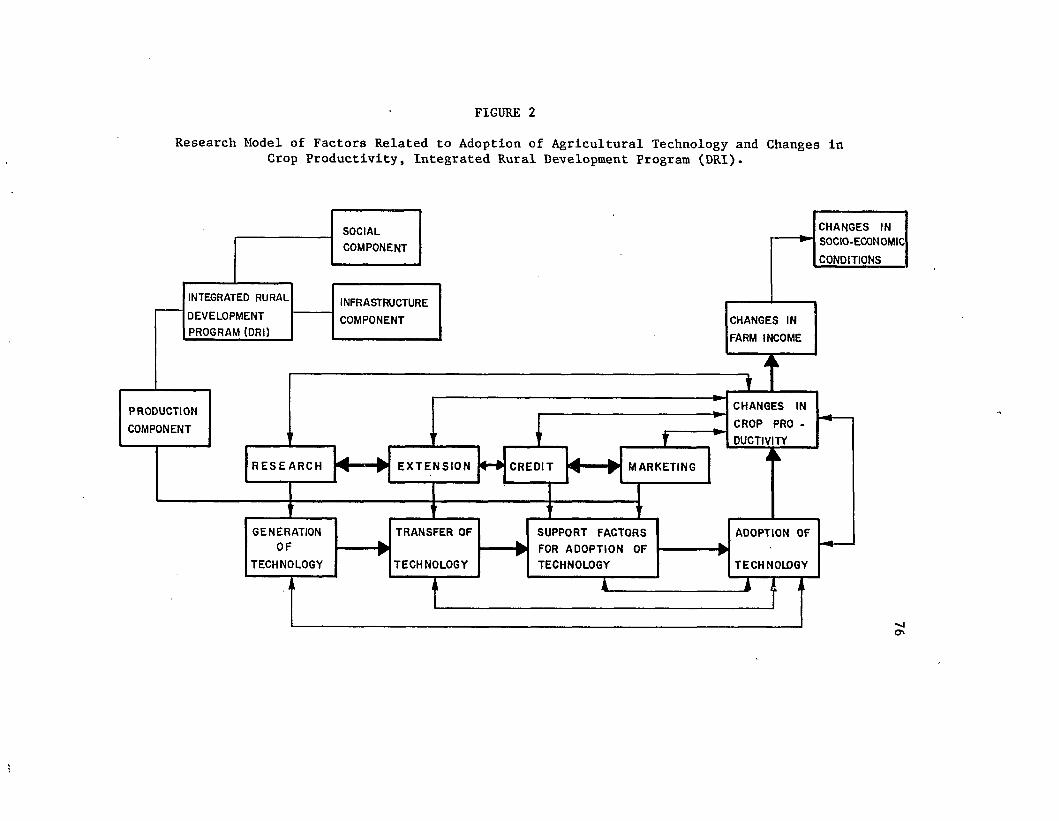
FIGURE 2
Research Model of Factors Related to Adoption of Agricultural Technology and Changes in Crop Productivity, Integrated Rural Development Program (DRI).
SOCIAL
COMPONENT
INTEGRATED RURAL
DEVELOPMENT
PROGRAM (DRI)
INFRASTRUCTURE
COMPONENT
PRODUCTION
COMPONENT
R E S E ARCH
GENEROF
TECHNC
ATION
)LOGY
E X T E N S IO N
1r
TRANSFER OF
TECHNOLOGY
C R E D IT M ARKETING
SUPPORT FACTORS
FOR ADOPTION OF
TECHNOLOGY
-------- ►CHANGES IN SOCIO-ECONOMIC
CONDITIONS
CHANGES IN
FARM INCOME
CHANGES IN
CROP PRO -
DUCTIVITY
ADOPTION OF
TECHNOLOGY
T
■vjO'
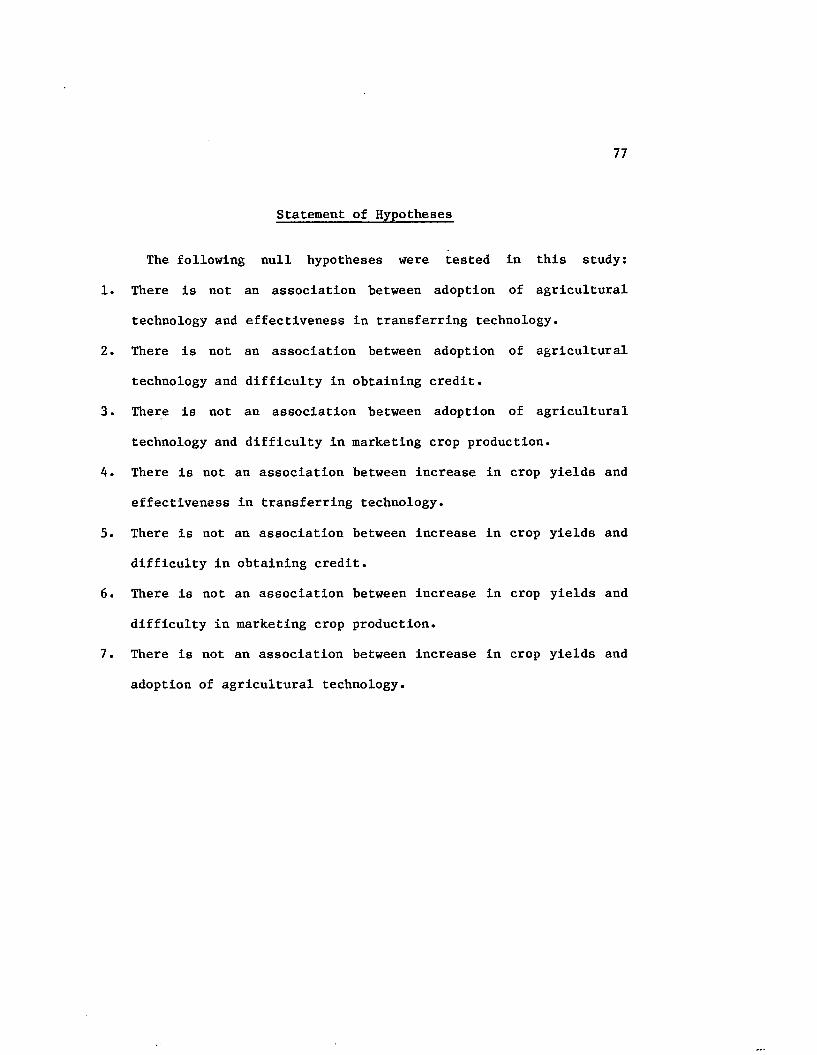
77
Statement of Hypotheses
The following null hypotheses were tested in this study:
There is not an association between adoption of agricultural
technology and effectiveness in transferring technology.
There is not an association between adoption of agricultural
technology and difficulty in obtaining credit.
There is not an association between adoption of agricultural
technology and difficulty in marketing crop production.
There is not an association between increase in crop yields and
effectiveness in transferring technology.
There is not an association between increase in crop yields and
difficulty in obtaining credit.
There is not an association between increase in crop yields and
difficulty in marketing crop production.
There is not an association between increase in crop yields and
adoption of agricultural technology.
CHAPTER III RESEARCH METHODOLOGY
The Setting
This study was conducted in two districts where the integrated
Rural Development Program - DRI - was being carried out, South Tolima
District, located in Tolima State, and Fusagasuga District, located
in Cundinamarca State.
In this study South Tolima District is referred as District 1
and Fusagasug^ District as District 2.
District 1 is considered as one of the newest DRI districts
since it was inaugurated in 1982, under what was called, "DRI Phase
II”. District 2 is considered as one of the oldest DRI districts
since its activities began in 1975 when the DRI program was established
in Colombia. It is considered as a district in the "DRI Phase I".
The principal characteristics of these two districts are presented in
Chapter II.
Selection of the Sample
Since the proportions of the farmers growing the various crops
selected in this study were different, a proportionate stratified
random sample was drawn to assure that they would be equally
78
79
represented in the sample of each district (10, p. 49; 21, p. 27;
136, p. 27). Sixty DRI farmers were selected from the total number
of clients in each district for a total sample of 120 respondents to
be interviewed.
The principal crops grown in District 1 were sesame, sorghum,
and corn, while in District 2 they were green peas and green beans.
In District 1, fifty percent of the farmers were growing sesame, 30
percent sorghum, and 20 percent corn, while in District 2, sixty
seven percent were growing green peas and 33 percent green beans.
The names of the respondents were selected at random from the
updated lists of growers for each crop provided by the district
directors in the district offices. Thirty sesame growers, 18 sorghum
growers, and 12 corn growers were selected in District 1. Forty
green peas growers and 20 green beans growers were selected in District
2. Only active DRI clients were selected as respondents in order to
insure more homogeneous samples.
Although the crops were used as strata in drawing the samples,
they were not considered as variables because it was not pertinent to
the purpose of this study. Nevertheless, the statistical analysis
performed indicated that there were no significant differences among
and between the crops in District 1 and District 2, respectively, in
relation to each dependent and independent variable used.
Farmers from four municipalities and 11 villages in District 1,
and from three municipalities and 12 villages in District 2 were
involved in the samples.

80
Interview Schedule
An interview schedule was used to collect the data for this
study (Appendix A). The interview schedule was first prepared in
English and then translated into Spanish. Most of the questions of
the interview schedule were closed questions for more unbiased
information.
The interview schedule was divided in the following five parts:
The first part included some general questions related to the
length of time farmers were receiving services from the DRI program,
the fanners' land tenure status, the area of the farms, the area of
farmland designated for crop and livestock production, the farmers1
satisfaction in relation to the overall DRI program, and the changes
in farm income.
The second part was designed to find out the factors limiting
crop productivity in the selected DRI areas as perceived by the
respondents, and the extent to which those factors were presumed to
affect crop productivity.
The third part was used to determine the availability' of
appropriate crop technology and its sources of generation and adapta
tion under local conditions, the extent of effectiveness in trans
ferring appropriate agricultural technology, the means through which
farmers obtained information about crop cultural practices, the
extent of adoption of technology, the reasons impeding farmers in
81
adopting new technology, the crop yields obtained before and after
adopting new practices, and the farmers' satisfaction in relation to
DRI technical assistance. The information pertaining to availability
of appropriate crop technology was provided by the extension personnel
in charge of agricultural research in each district.
The fourth part was related to the DRI credit program and
included questions pertaining to sources of credit, requirements
and procedures for obtaining credit, levels of difficulty to get
a loan, timeliness and adequacy of amount of credit, interest rates,
terms for paying off loans, and farmers' satisfaction in relation to
the DRI credit program.
Questions included in the fifth part were designed to obtain
information about the characteristics of agricultural marketing in
DRI areas. They were related to use of crop production, levels
of difficulty in the marketing process, level of prices, farmers'
membership in marketing organizations, marketing channels, difficul
ties in marketing crop products, and farmers' satisfaction in
relation to the DRI marketing program.
The interview schedule was pre-tested by the author with six
farmers in District 1. It was necessary to adjust some questions
in order to avoid misunderstandings and to improve the validity of
the questionnaire.
Some questions included in the interview schedule were re
lated to the components of the research model and to the objectives
previously stated. Specific questions were used to determine the
82
characteristics of the independent and dependent variables as
perceived by farmers. These variables as used in this study were the
following:
Independent Variables;
- Transfer of technology (extension), in terms of effectiveness in
transferring technology, (Question No. 5);
- Credit, in terms of difficulty in obtaining credit, (Question
No. 17); and
- Marketing, in terms of difficulty in marketing crop produc
tion, (Question No. 24).
Dependent Variables;
- Adoption of technology, in terms of levels of adoption of
recommended cultural practices, (Question No. 9); and
- Crop production, in terms of changes in crop yields (Question
No. 12).
The data obtained through these questions were also used to
determine the extent of association between independent and
dependent variables.
The other questions were used to measure other variables
related to the extent of limitation of crop productivity limiting
factors, the characteristics of the DRI transfer of technology, some
of the reasons why farmers did not adopt crop recommendations, the
characteristics of the DRI credit program, the characteristics of
83
the DRI marketing program, the most salient difficulties in market
ing crop products, and the levels of farmers' satisfaction in
relation to some selected limiting factors.
O p e ra tio n a liz a tio n o f th e V ariab les
The fo llow ing d e s c r ip t io n in d ic a te s the o p e ra t io n a l iz a t io n of
th e p r in c ip a l v a r ia b le s used in th i s s tu d y :
Crop P ro d u c tiv ity L im itin g F ac to rs
Question No. 2 was used to determine the factors that were
limiting crop productivity. The selected factors were related to
agricultural research, agricultural extension, credit, marketing,
farmland, and other possible limiting factors. Farmers had the
opportunity to choose all the factors that they considered were
affecting the productivity of their crops.
Question No. 3 was used to determine the extent to which the
selected factors were limiting crop productivity. Respondents had
the opportunity to indicate if the extent of limitation of the factors
they chose through question No. 2 was "low", "fair", or "high".
Score values of 1, 2, and 3 were assigned to each category, respec
tively.

84
Technology
Information in relation to the generation, adaptation, and
availability of appropriate technology for each one of the selected
crops was provided by the extension personnel in charge of research
in each district.
Generation of Technology (Research). Question No. 4 was used
to define the principal crops grown in each district and the three
most important cultural practices (appropriate technology) recommended
by the DRI program for each one of the selected crops, as well as to
determine the sources that generated and adapted that technology
to the local farming conditions.
The crops and the recommended cultural practices were defined
according to the economic importance of each crop in the region, and
according to the impact of each recommendation on the yield of a
particular crop.
Transfer of Technology (Extension). Question No. 5 was used
to determine the extent to which the DRI program was perceived as
effectively transferring technology to the farmers. It was based
on the knowledge of the farmers in relation to each recommendation.
The same crops and the same recommended cultural practices
selected through question No. 4 were used in question No. 5.
Responses of the farmers were compared with the information provided
85
by the extension personnel in question No. 4. If the response coin
cided, a "correct answer" (C) was computed. If the response did
not coincide, an "incorrect answer" (I) was assigned. There was a
maximum of three possible correct answers, one for each recommended
cultural practice.
The extent of effectiveness in transferring technology was
determined based on the responses of the farmers and according to
the following categories, number of correct answers, and score
values:
- "No effective" transfer of technology, (NE); zero correct answers;
(0);
- "Slightly effective" transfer of technology, (SE); one correct
answer; (1);
- "Fairly effective" transfer of technology, (FE); two correct
answers; (2); and
- "Effective" transfer of technology, (E); three correct answers;
(3).
Score values were assigned to each category ranking from zero
to three according to the extent of effectiveness. Zero indicated
"no effective" transfer of technology and three "effective" transfer
of technology. This variable was used as the first independent
variable in this study.
86
Means of Transferring Technology. Question No. 6 was used to
determine the means through which farmers obtained information about
crop cultural practices. The respondents had the opportunity to
indicate the sources through which they learned about the recommen
dations, from a list of six means previously selected.
Adoption of Technology
Question No. 9 was used to determine the extent to which
farmers had adopted recommended crop practices. Adoption of tech
nology was related to the information provided through question No. 4,
so the same crops and the same technological recommendations were
used.
Farmers were asked to indicate the cultural practices they were
using on their crops. The responses were compared with the informa
tion given by the extension personnel through question No. 4. If the
response coincided, a "correct answer' (C) was computed. If the
response did not coincide, an "incorrect answer" (I) was assigned.
There was a maximum of three possible correct answers, one for each
recommended cultural practice.
The extent to which farmers had adopted technology was given in
terns of levels of adoption according to the following categories,
number of correct answers, and scale values:
- "Non adoption" of technology, (NA); zero correct answers; (0);
87
- "Low level of adoption" of technology, (LA); one correct answer;
(1);- " F a ir le v e l of adop tion" o f techno logy , (FA); two c o r re c t answ ers;
(2 ) ; and
- "High level of adoption" of technology, (HA); three correct
answers; (3).
Score v a lu es were a ss ig n ed to each ca teg o ry rank ing from zero
to th re e accord ing to th e e x te n t o r le v e l o f ad o p tio n . Zero in d i
ca ted "non adop tion" and th re e "h igh le v e l o f adop tion" o f techno logy .
A doption of techno logy was th e f i r s t dependent v a r ia b le used in
th i s s tu d y .
Reasons for Non-Adoption of Technology. Question No. 13 was
used to determine what reasons, if any, had deterred farmers from
using or adopting the cultural practices recommended by the DRI
program. The respondents were given the opportunity to indicate
up to five reasons that impeded them from adopting new technology,
from a list of 26 reasons previously selected.
Crop P roduction
Question No. 12 was used to determine the levels of crop
production. Farmers were asked about their crop yields per hectare
"before" and "after" using or adopting recommended cultural practices.

88
Their responses were compared to determine the changes in crop
production which were classified in the following categories: "lower"
crop production, (LY); "similar" crop production, (SY); or "higher"
crop production, (HY). Score values of 0, 1, or 2 were assigned to
each category, respectively. Level of crop production was used as
the second dependent variable in this study.
Credit
Information to characterize credit as the second independent
variable was sought in terms of difficulty in obtaining a loan
(Question No. 17). Questions Nos. 16 through 22 were used to determine
some characteristics of the DRI credit program, such as:
Difficulty in Obtaining a Loan. Question No. 17 was used to de
termine the levels of difficulty in obtaining DRI credit. Farmers had
the opportunity to select one out of the following four alternatives:
"very difficult", "difficult", "simple", or "very simple". Score
values of 1, 2, 3, or 4 were assigned to each category, respectively.
Timeliness of the Credit. Question No. 18 was used to determine
the opportuneness for the receipt of the loan by the farmers. The
respondents had two alternatives to choose, "delayed" or "timely".
Score values of 1 or 2 were assigned to each category, respectively.
89
Adequacy of the Amount of Credit. Question 19 was used to
determine the adequacy of the amount of credit the farmers had
received, using a scale of "not adequate", "fairly adequate", or
"adequate" to put in practice all the recommended cultural practices
to grow their crops. Score values were assigned to each category as
follows: 0 for "not adequate"; 1 for "fairly adequate", or 2 for
"adequate".
Interest Rates. Question No. 20 was used to determine if the
interest rates charged to the farmers for a loan were considered as
"low”, "moderate", or "high". Score values assigned to each category
were 1, 2, or 3, respectively.
Terms for Repaying Loans. Question No. 21 was used to determine
if the terms for repaying loans were considered by the farmers as
"short”, "moderate" or "long". Score values of 1, 2, or 3 were
assigned to each category, respectively.
M arketing
Information to characterize marketing as the third independent
variable was given in terms of difficulty in marketing crop production
(Question No. 24). Questions Nos. 23 through 29 were used to
determine some characteristics of the marketing process in DRI
areas, such as:
90
Major Uses of Crop Production. Question No. 23 was used to de
termine the major uses of crop production obtained by the farmers.
The respondents had the opportunity to choose only one alternative
from a list of eight.
Difficulty in Marketing Crop Production. Question No. 24 was
used to determine the level of difficulty in the process of marketing
crop production. Respondents had the opportunity to select one out
of the following four alternatives: "very difficult”, "difficult",
"easy", or "very easy". Score values of 1, 2, 3, or 4 were assigned
to each category, respectively.
Sale Price of Crop Products. Question No. 25 was used to deter
mine if the prices paid for crop products were favorable or unfavorable
to the farmer. The respondents had the opportunity to choose one
out of the following five alternatives: "very unfavorable",
"unfavorable", "just”, "favorable", or "very favorable" prices.
Score values of 1, 2, 3, 4, or 5 were assigned to each category,
respectively.
Farmer Membership in Marketing Organizations. Question No. 26
was used to determine if the farmer was or was not a member of any
marketing organization. Two categories, "no" and "yes", were the
alternatives, with score values of zero and one, respectively.

91
Marketing Channels. Question No. 27 was used to determine the
channels through which farmers marketed their crop products. The
respondents had the opportunity to indicate the channels they had used
in marketing their crop products in priority order, according to the
amount of product sold. A list of five marketing channels previously
selected was used to make the selections.
Marketing Difficulties. Question No. 28 was used to determine
some of the most salient difficulties farmers faced in marketing
their crop production. The respondents had the opportunity to
indicate up to five from a list of 11 marketing difficulties pre
viously selected.
Farmers' Satisfaction
Questions Nos. 7, 22, and 29 were used to determine the levels
of satisfaction of the farmers in relation to the DRI technical
assistance (transfer of technology), the DRI credit program, and the
DRI marketing program.
Farmers had the opportunity to choose one of the following three
levels of satisfaction, according to their perceptions: "not
satisfied", "fairly satisfied", or "satisfied". Score values of
0, 1, or 2 were assigned to the three categories or alternatives,
respectively.

92
Collection of Data
The data for this study were collected through a personal
interview schedule. In conducting the interviews, the author was
assisted by three extension agents from the Regional No. 6 of the
Colombian Agricultural Institute, ICA.
Previous to the interviews, the author met with the other
interviewers to analyze each one of the questions on the interview
schedule to ascertain that the information collected was consistent.
The assistants were trained to use the research instrument profi
ciently in conducting the interviews. Special care was taken to
protect the integrity of the data.
The author interviewed the extension personnel in each district
to obtain the information related to generation, adaptation, and
availability of appropriate crop technology, as well as to define the
crops and the recommended cultural practices to be used in this study.
All farmers were interviewed on their farms. The interviews
were conducted during July, 1985.
Statistical Analysis of Data
After the respondents were interviewed, data were coded using a
predetermined coding system. Data were processed through the faci
lities of the System Network Computer Center (SNCC) at Louisiana
State University.

93
The statistical methods applied to analyze the data were the
Chi-Square (X^) goodness-of-fit test, the Chi-Square (X^) test of
independence when the data were measured at a nominal level, the
Kolmogorov-Smirnov (K-S) one-sample and two-sample tests, and the
Goodman and Kruskal "gamma” (G) procedure when the data were measured
at an ordinal level.
The Chi-Square (X^) goodness-of-fit test is a statistical
method appropriate for defining the significance of differences
between the observed and the expected frequencies of variables or
categories in a sample representing a population (124, p. 42; 27,
p. 255; 25, p. 189; 54, p. 188). This test was used to determine
differences in frequency distribution in relation to crop productivity
limiting factors in each district.
The Chi-Square (X^) test of independence is a statistical
method suitable for defining the significance of differences between
two independent samples with respect to some characteristic and,
therefore, with respect to the relative frequency with which group
members fall in several categories (124, p. 104; 27, p. 174; 25,
p. 189; 54, p. 192). This test was used to determine differences
in frequency distributions between District 1 and District 2 in
relation to the following variables: crop productivity limiting
factors, means of transfer technology, timeliness of DRI credit,
farmers' membership in marketing organizations, and marketing
channels used.
<
94
The Kolmogorov-Smirnov (K-S) one-sample test is a type of
goodness-of-fit test. This statistical method is appropriate for
determining the significance of difference between an observed
and an expected frequency distribution (21, p. 259; 84, p. 328;
124, p. 47). This test was used to determine differences in fre
quency distribution in each district in relation to the following
variables: effectiveness in transferring technology, adoption of
technology, levels of crop production, difficulty in obtaining DRI
credit, and difficulty in marketing crop products.
The Kolmogorov-Smirnov (K-S) two-sample test is a statistical
method appropriate for determining the significance of difference
between two independent samples when each sample has been arranged
into a cumulative frequency distribution through several categories
(21, p. 266; 84, p. 374; 124, p. 127). This test was used to
determine differences in frequency distribution between District 1
and District 2 in relation to the following variables: extent of
limitation of crop productivity factors, effectiveness in trans
ferring technology, adoption of technology, levels of crop pro
duction, difficulty in obtaining DRI credit, adequacy of the amount
of DRI credit, interest rates of DRI credit, installments for
reimbursing a loan, difficulty in marketing crop products, sale
price of crop products, and farmers' satisfaction in relation to
DRI technical assistance, the DRI credit program, and the DRI
marketing program.

95
It was considered not necessary to apply a particular test to
some variables. In this event, percentages, frequencies, and
averages were used to present and describe the data. This was
applied to the following variables: length of time of DRI services,
size of the farms and amount of farmland in crops and pasture,
land tenure status, use of recommended cultural practices, reasons for
nonadoption of technology, kinds of financial resources, length of
time utilizing DRI credit, major uses of crop production, and
marketing difficulties.
The Goodman and Kruskal Coefficient "gamma" (G) is a measure
of relationship or association appropriate for determining the extent
of association between variables measured at the ordinal level.
This measure is based on the difference of probabilities between
frequencies in agreement or concordance and frequencies in disagree
ment or discordance among variables or categories (75, p. 121; 84,
p. 170, 438; 120, p. 309; 10, p. 303). This measure was used to
test the hypothesized associations between the independent and the
dependent variables.
The 0.05 level of probability was used to indicate statistically
significant differences among categories, variables, or between
districts. The actual significance level (P) is presented in the
respective Tables for each one of the tests performed. In the events
where no significant differences were found, they are shown in the
Tables by means of a (N.S.) indication.
CHAPTER IV ANALYSIS OF DATA
This study was conducted in two integrated rural development
(DRI) areas in Colombia. Its general purposes were oriented to
determine, according to the farmers' perception, relevant charac
teristics of some of the factors included in the agricultural
production component of the DRI program; the extent to which these
factors were limiting crop productivity; the extent of adoption of
recommended crop technology; the changes in crop yields; the levels
of farmers' satisfaction in relation to some of those limiting
factors; and the association between some selected limiting factors
and adoption of technology and changes in crop yield, as well as
between adoption of technology and crop production.
The data required to accomplish the objectives were collected
by means of an interview schedule which was administered to a sample
of 60 farmers in each one of the two DRI districts selected, for a
total sample of 120 farmers.
The data were analyzed through the statistical methods des
cribed in Chapter III, that is,
- the Chi-Square (X^) goodness-of-fit test and the Chi-Square (X^)
test of independence, used when the data were measured at a nominal
level;
T
96
97
- the Kolmogorov-Smirnov (K-S) one-sample and two-sample tests,
used when the data were measured at an ordinal level;
- the Goodman and Kruskal Coefficient "gamma" (G), used to determine
the degree of association among selected variables, since they
were measured at an ordinal level; and
- frequencies, percentages, and averages to present and describe
the data when it was considered not necessary to apply any
particular statistical test.
The 0.05 level of probability (P) was used to determine
statistically significant differences in distribution of frequencies
among the various categories of the variables in each district and
between districts, as well as for determining significant differences
in the degree of association among variables.
The independent and dependent variables selected for the pur
poses of determining the associations previously indicated were the
following:
Independent variables;
- Transfer of technology (extension) - in terms of effectiveness in
transferring technology;
- Credit - in terms of difficulty in obtaining credit; and
- Marketing, in terms of difficulty in marketing crop production.
Dependent variables;
- Adoption of technology - in terms of levels of adoption of
recommended cultural practices; and
98
- Crop production - in terms of changes in crop yields.
In some cases, when the independent and dependent variables
were studied, the data were analyzed independently for each one of
the districts, and then compared between the two districts (Tables
8, 12, 14, 17, and 24). In most of the other cases, the comparisons
of the variables were made between the two districts, only.
This chapter presents the findings of the study, based on the
perceptions of the farmers interviewed. The analysis of the data is
presented under the following major headings: general aspects, crop
productivity limiting factors, crop technology, (generation, transfer,
adoption), crop production, credit, marketing, and relationships
between variables.
General Aspects
Length of Time of DRI Services
As it was already mentioned, the Integrated Rural Development
Program - DRI - was established in 1982 in District 1, and in 1975
in District 2. Since its origin, the DRI program has been providing
services to the farmers primarily by means of community organization
activities, technical assistance, and financial resources.
Data in Table 1 indicate percentage distributions, according to
the length of time farmers had been receiving DRI services. The
majority of the farmers (95 percent) in District 1, the newer one,
had been receiving the services from one to five years. More than
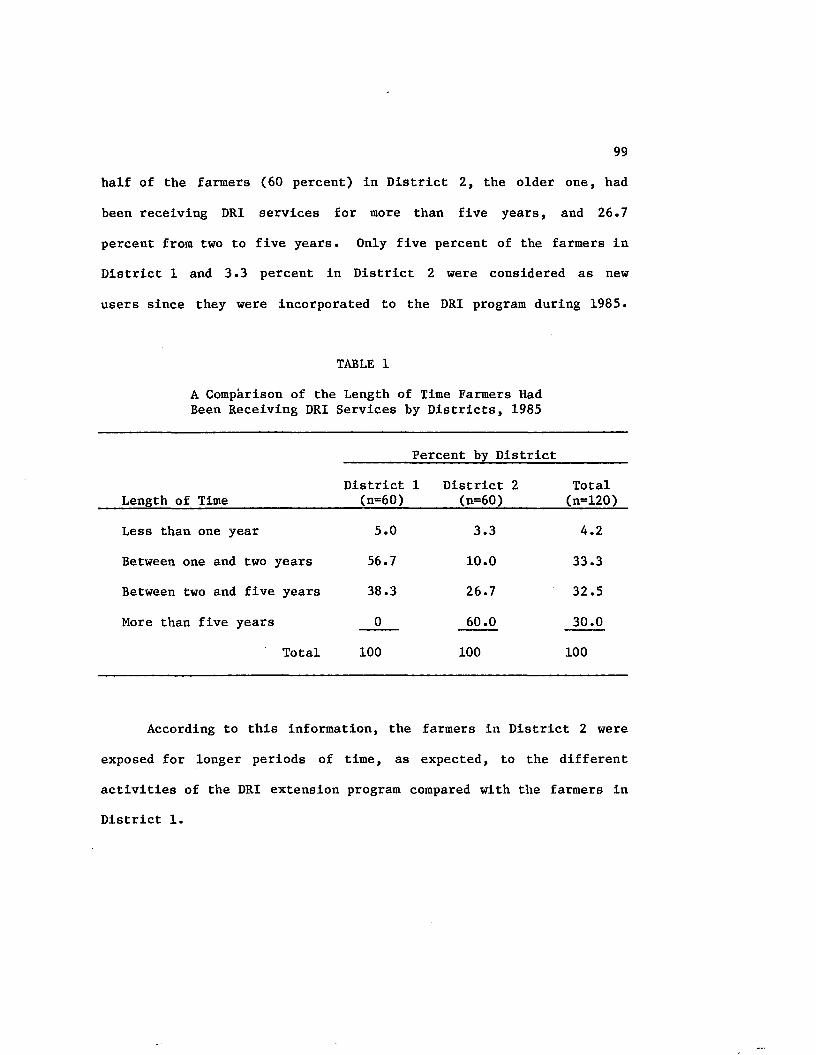
99
half of the farmers (60 percent) in District 2, the older one, had
been receiving DRI services for more than five years, and 26.7
percent from two to five years. Only five percent of the farmers in
District 1 and 3.3 percent in District 2 were considered as new
users since they were incorporated to the DRI program during 1985.
TABLE 1
A Comparison of the Length of Time Farmers Had Been Receiving DRI Services by Districts, 1985
Length of Time
Percent by District
District(n=60)
1 District 2 (n=60)
Total(n=120)
Less than one year 5.0 3.3 4.2
Between one and two years 56.7 10.0 33.3
Between two and five years 38.3 26.7 32.5
More than five years 0 60.0 30.0
Total 100 100 100
According to this information, the farmers in District 2 were
exposed for longer periods of time, as expected, to the different
activities of the DRI extension program compared with the farmers in
District 1.
100
Size of the Farms
As it was indicated previously, one of the requirements for
affiliation with the DRI program Is to operate a farm of no more than
20 hectares (has.) regardless of tenure status. Farmers in District 1
possessed farms with sizes, ranging between 1.5 and 20 has., while
farmers in District 2 were operating farms ranging in size from 0.9
to 20 has. The average size of farm was nine has. in District 1 and
4.4 has. in District 2.
Most of the DRI farmers possessed farms of no more than 10 has.
Data in Table 2 show that 68.3 percent of the farmers in District 1 and
95 percent in District 2 had farms of less than 10 has. It can also be
noted that 71.7 percent of the farmers in Dsitrict 2 operated farms
of less than five hectares. It confirms that one of the characteris
tics of this District is its high concentration of "minifundia".
Table 2 also provides information in relation to the amount
of farmland dedicated by farmers to crops and pasture. Frequently,
and especially in District 1, farmland is not utilized completely
in cropping and pasturing. The average amount of farmland utilized
in these activities was 8.3 has. per farm in District 1 and 4.3 has.
in District 2 in comparison with the average size of the farms of
nine and 4.4 has., respectively.
According to the ratio between the average amount of farmland
utilized in crops and pasture and the average size of farms, farmers
in District 1 utilized an average of 92.2 percent of their farmland

TABLE 2
A Comparison of the Size of Farms and the Amount of Farmland Dedicated to Crops and Pasture by
Districts, 1985
Characteristics
P e r c e n t b y D i s t r i c t
Size of FarmsAmount of Farmland in Crops and Pasture
District 1 (n=60)
District 2 Total (n=60) (n=120)
District 1 (n=60)
District 2 Total (n=60) (n=120)
Number of Hectares
Five or less than five
Between five and ten
Between ten and fifteen
Between fifteen and twenty
Total
33.3
35.0
15.0
16.7
100
71.7
23.3
1.7
3.3
100
52.5
29.1
8.4
10.0100
41.7
30.0
16.7
11.6100
71.7
25.0
03.3
100
56.7
27.5
8.4
7.4
100
Range in farm size (has.)
Average size of farms (has.)
Average Amount of farmland in crops and pasture (has.)
1.5-20
9
0.9-20
4.4
0.9-20
6.7
8.3 4.3 6.3 101

102
In agricultural production, while farmers in District 2 utilized
97.7 percent.
The average size of farms in District 2 is smaller, but its
soils present better physical and chemical characteristics than
those of District 1 where the soils are characterized by their poor
fertility and drought. It could explain, at least in part, why
farmers in District 2 try to utilize the maximum land resource in
growing crops and pasture. Farmers in District 1 have left small
areas of their farms unutilized, primarily because those areas are
not appropriate for farming due to poor quality soils.
Land Tenure Status
The DRI program does not have special entry requirements as
far as the land tenure status of the farmers is concerned. It was
found that ownership was the predominant land tenure status in the
two districts, followed by lessees and share-tenants. No other
category of land tenure was reported (Table 3).
In District 1, seventy one point seven percent of the farmers
were owners of their farms, 26.7 percent lessees, and only 1.6
percent share-tenants, while in District 2, seventy six point seven
percent of the farmers were owners, 16.7 percent lessees, and 6.6
share-tenants. It seems to indicate that there were, relatively
speaking, less problems of land tenure in District 2 than in
District 1.
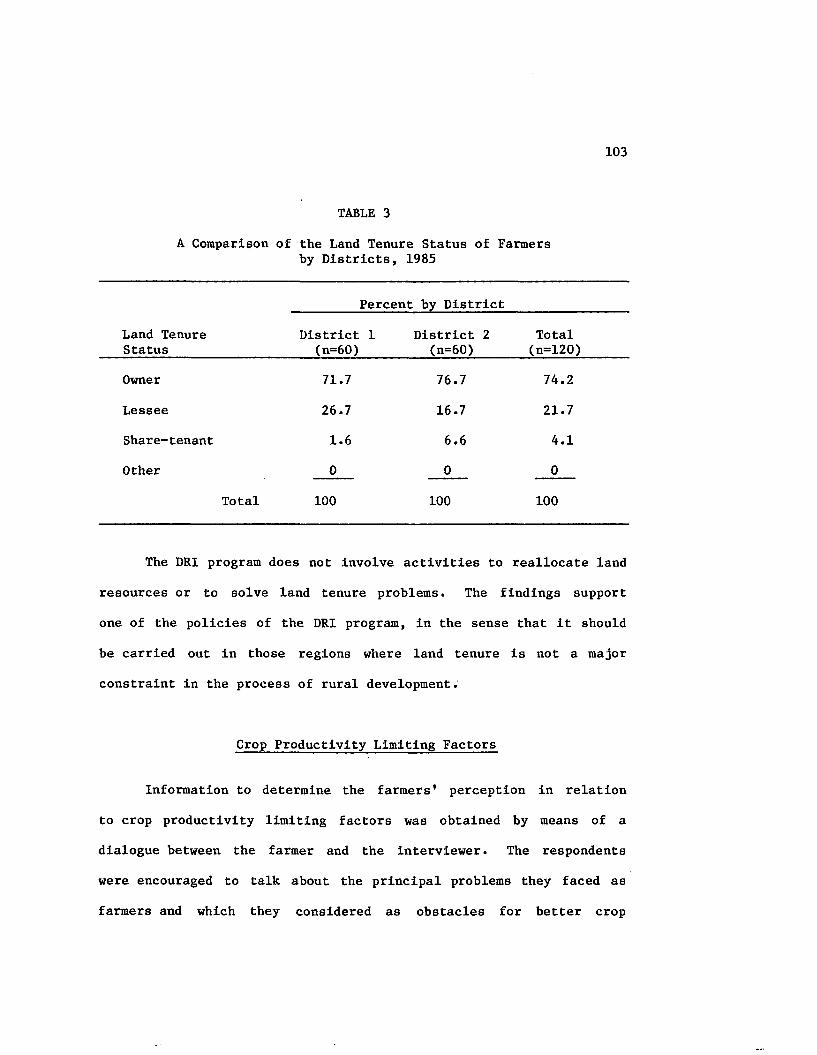
103
TABLE 3
A Comparison of the Land Tenure Status of Farmers by Districts, 1985
Land Tenure Status
Percent by District
District 1 (n=60)
District 2 (n=60)
Total(n=120)
Owner 71.7 76.7 74.2
Lessee 26.7 16.7 21.7
Share-tenant 1.6 6.6 4.1
Other 0 0 0
Total 100 100 100
The DRI program does not Involve activities to reallocate land
resources or to solve land tenure problems. The findings support
one of the policies of the DRI program, in the sense that it should
be carried out in those regions where land tenure is not a major
constraint in the process of rural development.
Crop Productivity Limiting Factors
Information to determine the farmers' perception in relation
to crop productivity limiting factors was obtained by means of a
dialogue between the farmer and the interviewer. The respondents
were encouraged to talk about the principal problems they faced as
farmers and which they considered as obstacles for better crop

104
productivity on their farms. Information provided by the respon
dents was related to the following factors previously selected in
question No. 2:
1. Research - in terms of lack of or inappropriate technology
(cultural practices) for growing crops.
2. Extension - in terms of lack of or inadequate transfer of crop
technology or technical assistance.
3. Credit - in terms of lack of or insufficient financial resources
for growing crops.
4. Marketing - in terms of lack of or inappropriate facilities for
marketing crop production.
5. Farmland - in terms of lack of or inadequate farmland for
growing crops.
6. Other limiting factor (e.g., climate) - in terms of dampness
or drought of soils caused by excessive or by lack of rain
water. Climate was included in this category as a limiting
factor taking into account that adverse climatic conditions
were frequently mentioned by a high number of farmers.
The farmers had the opportunity to select all the factors they
considered as limiting crop productivity. Since the majority of
the respondents mentioned more than one factor, the total number of
responses obtained was larger than the total number of farmers in
each District. The total number of responses was 128 in District 1
and 127 in District 2.
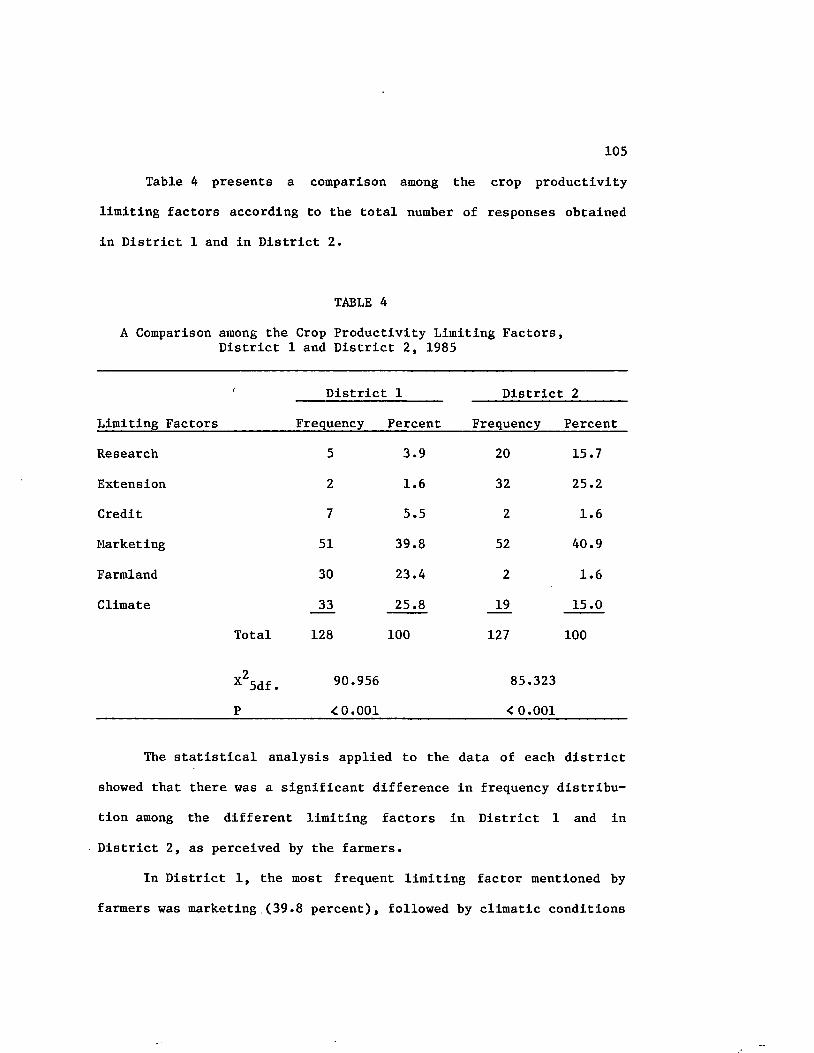
105
Table 4 presents a comparison among the crop productivity
limiting factors according to the total number of responses obtained
in District 1 and in District 2.
TABLE 4
A Comparison among the Crop Productivity Limiting Factors, District 1 and District 2, 1985
Limiting Factors
' District: 1 District 2
Frequency Percent Frequency Percent
Research 5 3.9 20 15.7
Extension 2 1.6 32 25.2
Credit 7 5.5 2 1.6
Marketing 51 39.8 52 40.9
Farmland 30 23.4 2 1.6
Climate 33 25.8 19 15.0
Total 128 100 127 100
X2x 5df. 90.956 85.323
P <0.001 < 0.001
The statistical analysis applied to the data of each district
showed that there was a significant difference in frequency distribu
tion among the different limiting factors in District 1 and in
District 2, as perceived by the farmers.
In District 1, the most frequent limiting factor mentioned by
farmers was marketing (39.8 percent), followed by climatic conditions
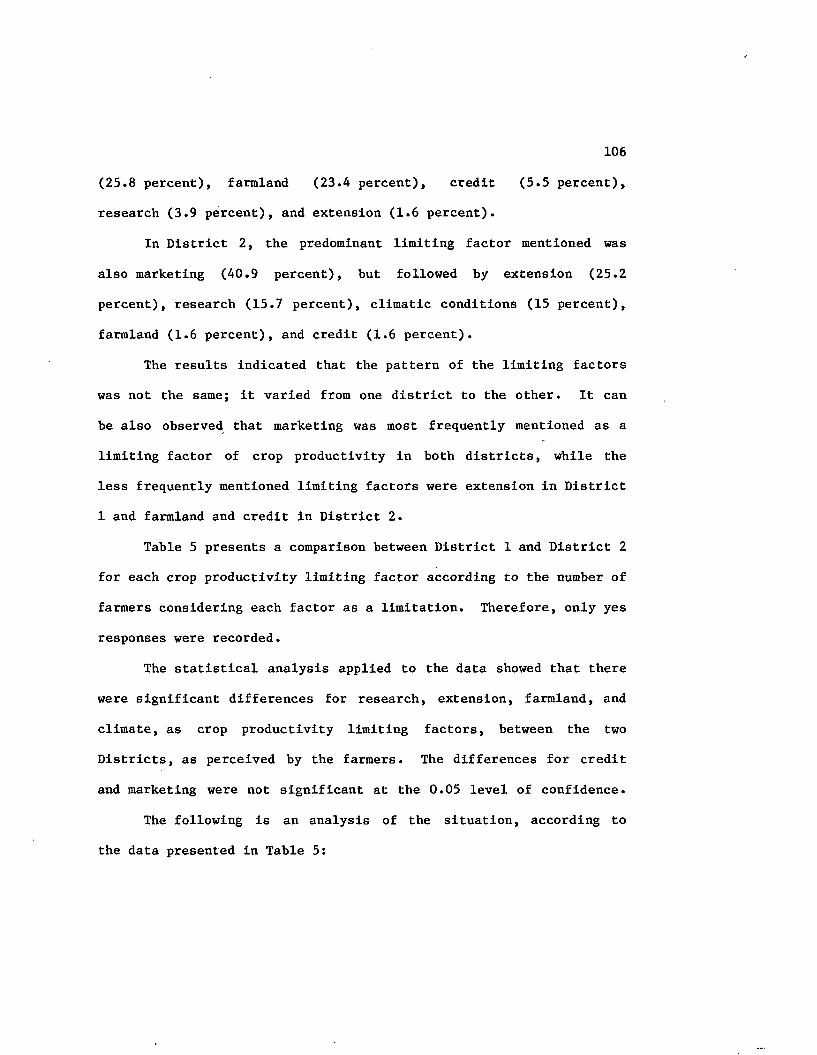
106
(25.8 percent), farmland (23.4 percent), credit (5.5 percent),
research (3.9 percent), and extension (1.6 percent).
In District 2, the predominant limiting factor mentioned was
also marketing (40.9 percent), but followed by extension (25.2
percent), research (15.7 percent), climatic conditions (15 percent),
farmland (1.6 percent), and credit (1.6 percent).
The results indicated that the pattern of the limiting factors
was not the same; it varied from one district to the other. It can
be also observed that marketing was most frequently mentioned as a
limiting factor of crop productivity in both districts, while the
less frequently mentioned limiting factors were extension in District
1 and farmland and credit in District 2.
Table 5 presents a comparison between District 1 and District 2
for each crop productivity limiting factor according to the number of
farmers considering each factor as a limitation. Therefore, only yes
responses were recorded.
The statistical analysis applied to the data showed that there
were significant differences for research, extension, farmland, and
climate, as crop productivity limiting factors, between the two
Districts, as perceived by the farmers. The differences for credit
and marketing were not significant at the 0.05 level of confidence.
The following is an analysis of the situation, according to
the data presented in Table 5:
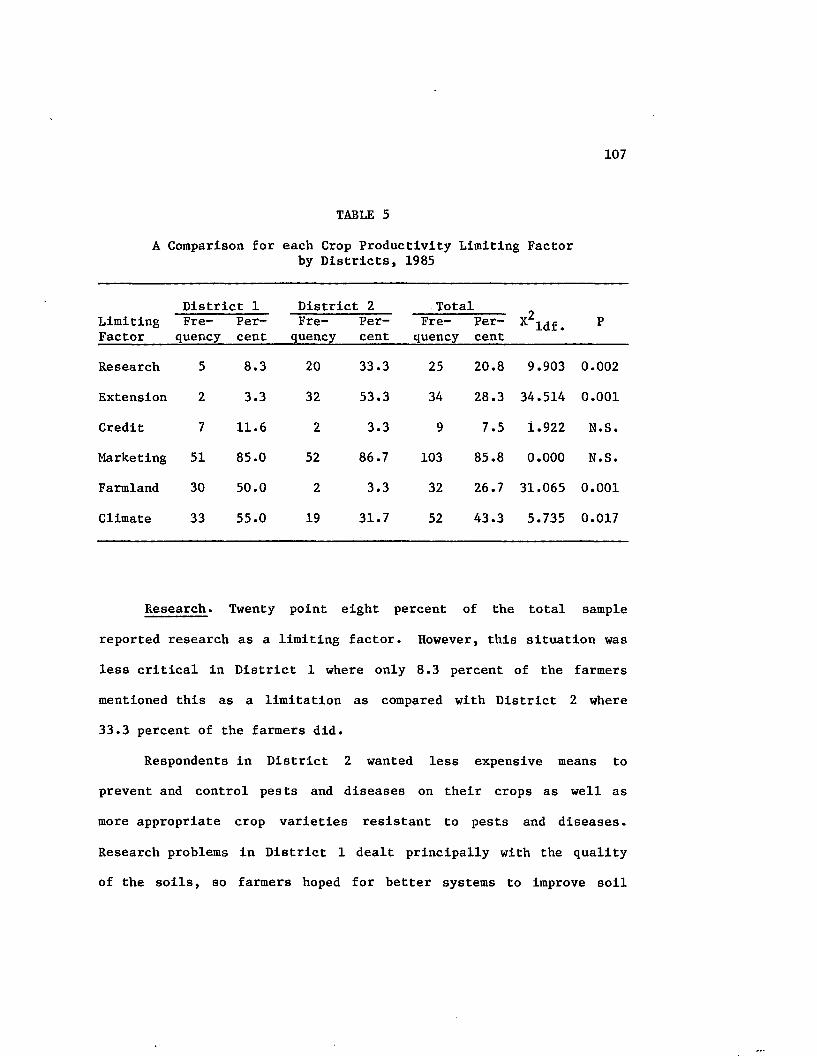
107
TABLE 5
A Comparison for each Crop Productivity Limiting Factorby Districts, 1985
District 1 District 2 TotalLimitingFactor
Frequency
Percent
Frequency
Percent
Frequency
Percent x Idf. P
Research 5 8.3 20 33.3 25 20.8 9.903 0.002
Extension 2 3.3 32 53.3 34 28.3 34.514 0.001
Credit 7 11.6 2 3.3 9 7.5 1.922 M.S.
Marketing 51 85.0 52 86.7 103 85.8 0.000 M.S.
Farmland 30 50.0 2 3.3 32 26.7 31.065 0.001
Climate 33 55.0 19 31.7 52 43.3 5.735 0.017
Research. Twenty point eight percent of the total sample
reported research as a limiting factor However, this situation was
less critical in District 1 where only 8.3 percent of the farmers
mentioned this as a limitation as compared with District 2 where
33.3 percent of the farmers did.
Respondents in District 2 wanted less expensive means to
prevent and control pests and diseases on their crops as well as
more appropriate crop varieties resistant to pests and diseases.
Research problems in District 1 dealt principally with the quality
of the soils, so farmers hoped for better systems to improve soil
108
conditions at lower costs in order to increase fertility levels.
Also, pest and disease problems were mentioned by some farmers.
The generation of appropriate technology is a responsibility of
the DRI program. Research is carried out at local levels on farms and
in experiment stations. The two districts were undertaking adaptative
research projects in order to solve the most pressing technological
problems of the principal crops growing in their areas of influence.
District 1 has a Regional Center of agricultural research "Nataima"
which is located very close to its area of influence. Although
District 1 is the newer of the two, it seems that it has been more
successful than District 2 in generating appropriate technology to
overcome farm problems. Of course, the situation and the problems
are different.
Extension. Technical assistance or transfer of technology
was reported as a limiting factor by 28.3 percent of the total
sample. There was a marked difference in perception between the
respondents of the two district in relation to this factor. In
District 1, very few farmers (3.3 percent) considered the lack of
technical assistance or its inadequacy as a limitation for better crop
productivity, while more than half of the farmers (53.3 percent) in
District 2 did. Data also showed that extension was the less
frequent factor mentioned by the respondents in District 1, while in
District 2 it was, after marketing, the second most limiting factor
as perceived by farmers.
109
Some of the respondents in this situation in District 2 indi
cated that they were not visited by the extension agent during the
last six months, while most of them said that they were visited
rarely. Some of the farmers stated that they were visited by the
extension agent only when they required the planning for credit̂ -.
Information obtained from this district indicated that there had
been many obstacles in replacing those technical assistants who,
for one or other reason, had to leave their areas of work. At the
time of collecting the data for this study, it was observed that some
areas of work in District 2 lacked an extension agent, and some others
were being assisted by temporary extension workers.
Due to the lack of enough field extension personnel this
District was emphasizing the work with groups of farmers to transfer
technology, but it was not possible to know to what extent this
extension method was efficient.
In contrast with District 2, it seems that extension was not
perceived as a major limitation in District 1.
Credit. Only 7.5 percent of the total sample perceived credit
as a limiting factor of crop productivity. It was the less frequent
factor mentioned by the respondents considering the two districts
1-The planning of the credit is a detailed plan of investments stating the necessary amount of money for financing each activity or cultural practice required to grow a crop, a group of crops, or to operate a farm. The DRI program requires that all credit projects be planned and supervised during their execution by an extension agent.
110
together. Just 3.3 percent of the farmers in District 2 and 11.6
percent in District 1 perceived credit as a problem to grow their
crops. The problems were not related to the lack of financial
resources but to the amount of red tape and requirements demanded to
obtain a loan, the timeliness to receive the money, the interest
rates, the terms for repaying the loan, and in very few instances, to
the insufficiency in the amount of money lent. In fact, only one
farmer in District 1 was not provided with DRI credit because he
did not meet all the requirements demanded by the DRI program. It
can be considered that credit was not a major constraint among the
DRI farmers in these two districts.
Since credit has been considered as a very important factor
in the process of agricultural development in Colombia, many efforts
have been devoted by the DRI program in order to provide the farmers
with the financial resources needed to apply the recommended cultural
practices in the growing of their crops.
Marketing. This factor, in terms of inappropriate facilities
for marketing the crop production, was perceived by the majority of
the respondents as the outstanding problem in agricultural producti
vity in the two districts. No major differences in frequency distri
butions between the two districts were observed. Eighty five percent
of the farmers in District 1 and 86.7 percent in District 2 considered
marketing as the principal factor limiting better crop productivity
Ill
on their farms. In fact, this factor was the most frequently
mentioned by the respondents in the two districts.
Many difficulties for marketing farm production were pointed
out by the farmers, especially those related to unfavorable prices
paid for their farm products, market intermediaries, lack of farmer
cooperatives or similar marketing organizations, and lack of suffi
cient marketing channels.
The DRI program is responsible for carrying out actions oriented
to help farmers market their farm production. When the DRI program
was established 11 years ago, it was believed that marketing could be
one of the crucial limitations to improve farm productivity (34,
p. 23). It seems that the efforts devoted by the DRI program to
overcome this situation have not been highly successful because the
marketing problem persists, at least in these two districts.
Farmland. This factor was perceived as a problem by 26.7
percent of the total sample. As it was indicated previously, there
was a significant difference in the distribution of frequencies in
relation to this factor between the two districts. Fifty percent of
the farmers in District 1 and only 3.3 percent in District 2 con
sidered farmland as a limiting factor of crop productivity.
Most of the respondents in District 1 under this situation
pointed out that a great amount of the land on their farms was
inadequate for growing crops. This claim seemed to be related, at
least in part, to the poor fertility of the soils in many areas of
112
this district. The few farmers in District 2 who mentioned farmland
as a limiting factor indicated that their small-sized farms did not
allow them to improve crop productivity.
Unfortunately, these situations are out of the hands of the
DRI program, since it does not involve projects oriented to reallocate
land resources.
Climate. As it was stated previously, this factor was included
as a limitation under the category of "other limiting factors", taking
into account that a high number of farmers considered climatic
conditions as a problem associated with low farm productivity. In
fact, climate was the second most frequent limiting factor perceived
by the respondents (43.3 percent of the total sample). There was
a significant difference between the frequencies observed in each
District. The situation seemed to be more critical in District 1,
where it was reported by 55 percent of the farmers, than in District
2, where 31.7 percent of the farmers did.
Respondents, under this situation, referred to inadequate
conditions of dampness or drought in the soils due to excessive or
to lack of rain water respectively. District 1 had an inadequate
distribution of rain fall during the year, and a great part of its
soils were characterized by excessive drought. This condition
seemed to be associated with the poor quality of the lands. Problems
in District 2 were related to dampness, sometimes causing a partial
113
or a total damage or loss In the crops. Its lands are more fertile
than In District 1, nevertheless.
Extent of Limitation
Data to determine the extent of perceived limitation of the
selected limiting factors were obtained through question No. 3 of the
interview schedule. Farmers were asked to indicate to what extent
each one of the factors they had considered previously was limiting
better crop productivity on their farms. Farmers had the opportunity
to select among "low", "fair", or "high" alternatives.
According to the results of the statistical analysis no sig
nificant differences in perception were found for any of the
limiting factors between the two Districts (Table 6) at the 0.05
level of confidence. Nevertheless, the following tendencies can
be observed:
Research. The extent of limitation of this factor seemed to
be slightly higher in District 2 than in District 1. In fact, the
farmers affected by research in District 1 assigned only a low
extent of limitation to this factor, while in District 2, fifty
five percent of the respondents perceived the extent of limitation
as low, 40 percent as fair, and five percent as high. The tendency
of the extent of limitation for this factor was low in District 1 and
between low and fair in District 2.
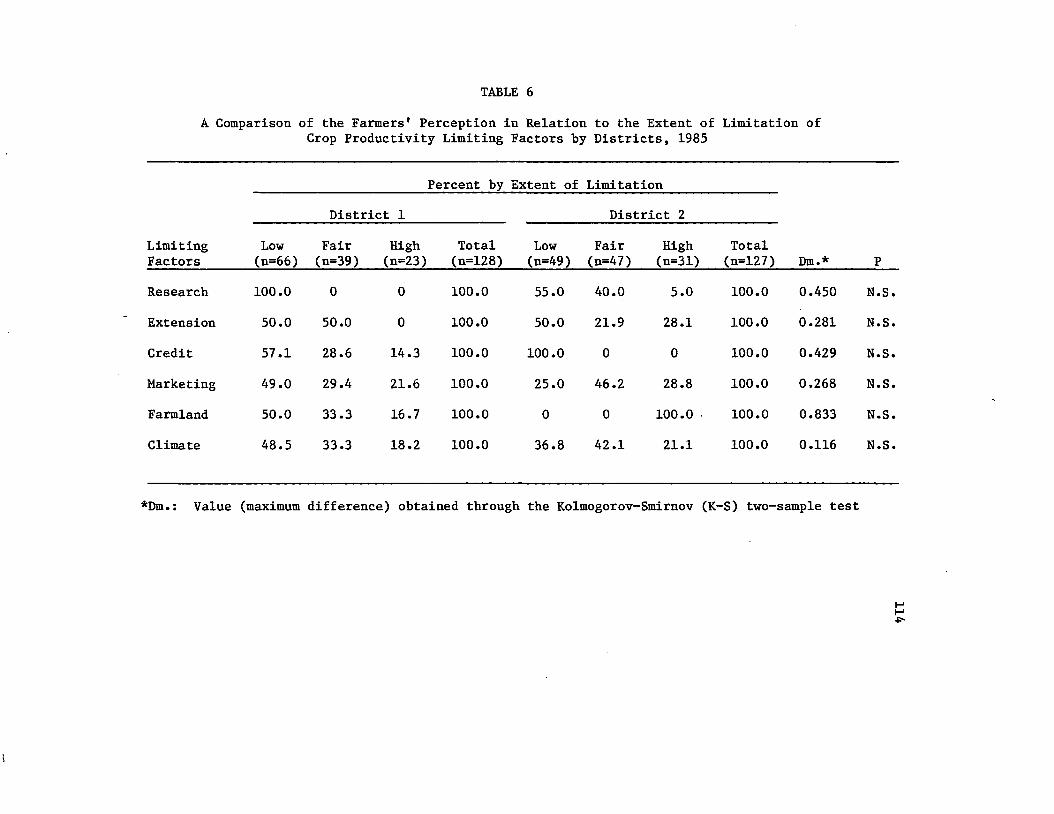
TABLE 6
A Comparison of the Farmers' Perception in Relation to the Extent of Limitation of Crop Productivity Limiting Factors by Districts, 1985
Percent by Extent of Limitation
District 1 District 2
LimitingFactors
Low(n=66)
Fair(n=39)
High(n=23)
Total(n=128)
Low(n=49)
Fair(n=47)
High(n=31)
Total(n=127) Dm.* P
Research 100.0 0 0 100.0 55.0 40.0 5.0 100.0 0.450 N.S.
Extension 50.0 50.0 0 100.0 50.0 21.9 28.1 100.0 0.281 N.S
Credit 57.1 28.6 14.3 100.0 100.0 0 0 100.0 0.429 N.S
Marketing 49.0 29.4 21.6 100.0 25.0 46.2 28.8 100.0 0.268 N.S
Farmland 50.0 33.3 16.7 100.0 0 0 100.0 100.0 0.833 N.S
Climate 48.5 33.3 18.2 100.0 36.8 42.1 21.1 100.0 0.116 N.S
*Dm.: Value (maximum difference) obtained through the Kolmogorov-Smirnov (K-S) two-sample test
115
Extension. As in the case of research, the perceived extent
of limitation of extension in crop productivity seemed to be higher
in District 2 than in District 1. In District 1 no one assigned a high
extent of limitation to this factor, while in District 2, about 28
percent of the farmers did. However, the tendency of the extent of
limitation of extension was between low and fair in the two districts.
Credit. The majority of the respondents (100 percent in
District 2 and 57.1 in District 1) assigned a low extent of limitation
to this factor. This perception seemed to be related to the low
percentage of farmers who considered credit as a crop productivity
limiting factor. The tendency of the extent of limitation for this
factor was low in District 2 and between low an fair in District 1.
According to the farmers' perception, and taking into account
the number of respondents affected by this factor in both districts,
it can be said that credit was considered the least important factor
among the selected crop productivity limiting factors.
Marketing. According to the data, the perceived extent of
limitation of marketing seemed to be slightly higher in District 2
than in District 1. The tendency of the extent of limitation varied
between low and fair for both districts. However, in comparison with
the other limiting factors, and taking into account the number of
116
farmers affected particularly by this factor (85 percent in District 1
and 86.7 percent in District 2), marketing presented the highest
perceived extent of limitation in the two districts. Twenty one
point six percent of the respondents in District 1 and 28.8 percent
in District 2 perceived the extent of limitation as high.
In accordance with the above information, it would be fair to
say that, among the selected factors, marketing was perceived as the
most critical limiting factor of crop productivity.
Farmland. According to the proportion of the farmers who
reported being affected, this factor was considered more critical in
District 1 than in District 2. However, the only two farmers in
District 2 who perceived this factor as a limitation assigned to it
a high extent of limitation. In District 1, sixteen point seven
percent of the respondents considered the extent of limitation of
farmland as high, 33.3 percent as fair, and 50 percent as low.
The tendency of the extent of limitation for this factor was
high for District 2 and between low and fair for District 1, high
lighting the aforementioned differences in soil conditions.
Climate. Although a high number of farmers (55 percent in
District 1 and 31.7 in District 2) perceived climatic conditions
as a limitation for better crop productivity, only 18.2 percent of them
in District 1 and 21.1 percent in District 2 considered the extent
of limitation of this factor as high. The tendency of the extent of
limitation for climate varied between low and fair for both districts.
117
Crop Technology
Generation and Availability of Appropriate Crop Technology
Data related to the generation of appropriate crop technology
were obtained through question No. 4 of the interview schedule.
As it was mentioned previously, information in relation to the
generation, adaptation, and availability of appropriate technology
for each one of the selected crops was provided by the extension
personnel in charge of research in each one of the two districts-*-.
Table 7 presents the data gathered from the two districts in
relation to the three most important cultural practices recommended
by the DRI program for each one of the selected crops, and the
sources that generated and adapted that technology to local condi
tions. These cultural practices were used then to determine the
effectiveness in transferring technology and the levels of adoption
of technology.
The relative importance of the selected crops was related to
,,the number of farmers growing the crops, the area grown, and thef
-*-Each one of the DRI districts has extension personnel in charge of conducting agricultural research activities at the local level, following the farming systems research and extension approach. They are responsible for the adjustment of crop technology, which involves the generation and adaptation of appropriate crop technology,according to the local farming conditions, and taking into account the technological, social, and economic characteristics of the farmers. Technology is delivered to the farmers in the form of packages of recommended crop practices.
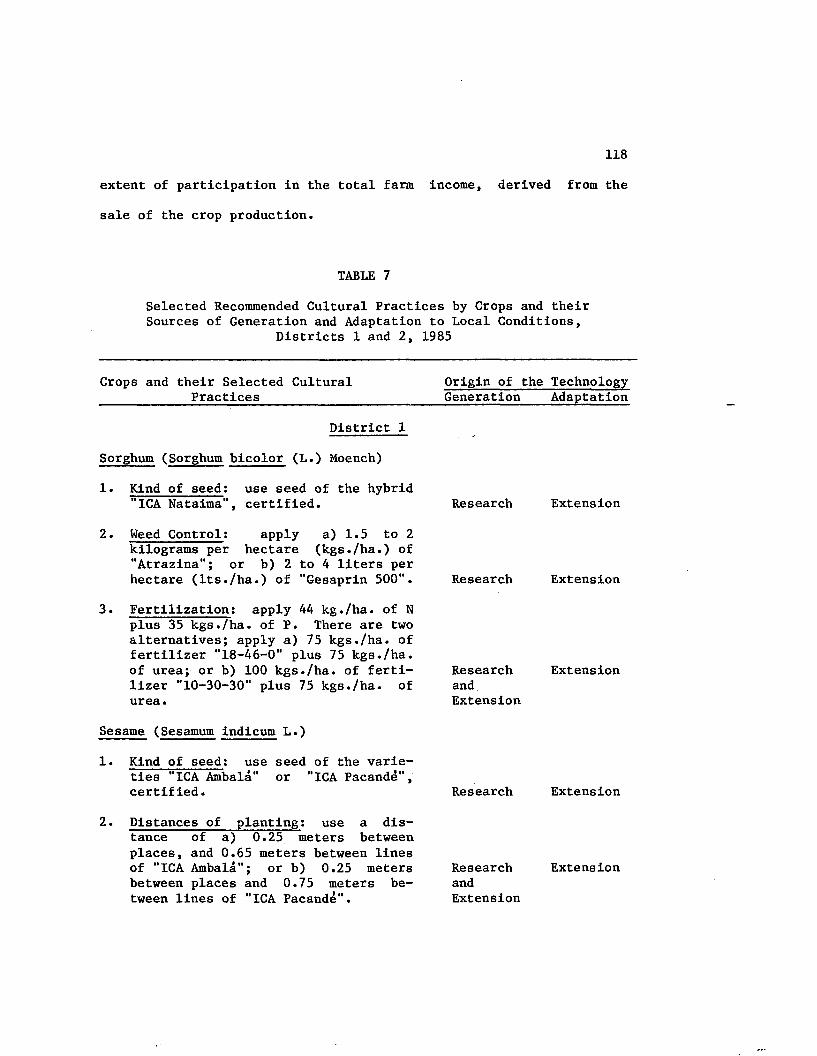
118
extent of participation in the total farm income, derived from the
sale of the crop production.
TABLE 7
Selected Recommended Cultural Practices by Crops and their Sources of Generation and Adaptation to Local Conditions,
Districts 1 and 2, 1985
Crops and their Selected Cultural Practices
Origin of the Technology Generation Adaptation
District 1
Sorghum (Sorghum bicolor (L.) Moench)
1. Kind of seed: use seed of the hybrid"ICA Nataima", certified. Research Extension
2. Weed Control; apply a) 1.5 to 2 kilograms per hectare (kgs./ha.) of "Atrazina"; or b) 2 to 4 liters perhectare (Its./ha.) of "Gesaprin 500". Research Extension
3. Fertilization: apply 44 kg./ha. of Nplus 35 kgs./ha. of P. There are two alternatives; apply a) 75 kgs./ha. of fertilizer "18-46-0" plus 75 kgs./ha.of urea; or b) 100 kgs./ha. of ferti- Research Extensionlizer "10-30-30" plus 75 kgs./ha. of andurea. Extension
Sesame (Sesamum indicum L.)
Kind of seed: use seed of the varieties "ICA Ambala" or "ICA Pacandd", certified. Research Extension
2. Distances of planting: use a distance of a) 0.25 meters between places, and 0.65 meters between lines of "ICA Ambala"; or b) 0.25 meters between places and 0.75 meters between lines of "ICA Pacande".
ResearchandExtension
Extension
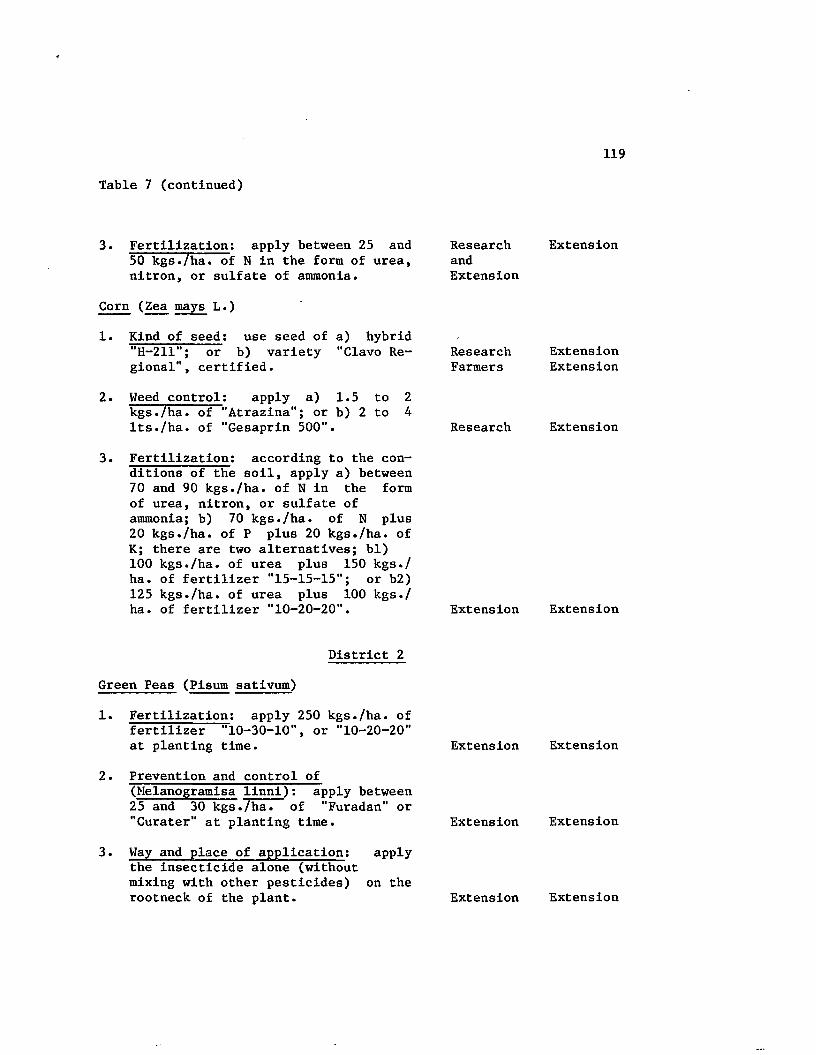
Table 7 (continued)
3. Fertilization: apply between 25 and Research50 kgs./ha. of N in the form of urea, andnitron, or sulfate of ammonia. Extension
Corn (Zea mays L.)
1. Kind of seed: use seed of a) hybrid"H-211"; or b) variety "Clavo Regional", certified.
ResearchFarmers
2. Weed control: apply a) 1.5 to 2kgs./ha. of "Atrazina"; or b) 2 to 4 Its./ha. of "Gesaprin 500". Research
3. Fertilization: according to the conditions of the soil, apply a) between 70 and 90 kgs./ha. of N in the form of urea, nitron, or sulfate of ammonia; b) 70 kgs./ha. of N plus 20 kgs./ha. of P plus 20 kgs./ha. of K; there are two alternatives; bl)100 kgs./ha. of urea plus 150 kgs./ ha. of fertilizer "15-15-15”; or b2)125 kgs./ha. of urea plus 100 kgs./ha. of fertilizer "10-20-20". Extension
District 2
Green Peas (Pisum sativum)
1. Fertilization: apply 250 kgs./ha. offertilizer "10-30-10", or "10-20-20"at planting time. Extension
2. Prevention and control of (Melanogramisa linni): apply between25 and 30 kgs./ha. of "Furadan” or"Curater" at planting time. Extension
3. Way and place of application: apply the insecticide alone (without mixing with other pesticides) on therootneck of the plant. Extension
Extension
ExtensionExtension
Extension
Extension
Extension
Extension
Extension
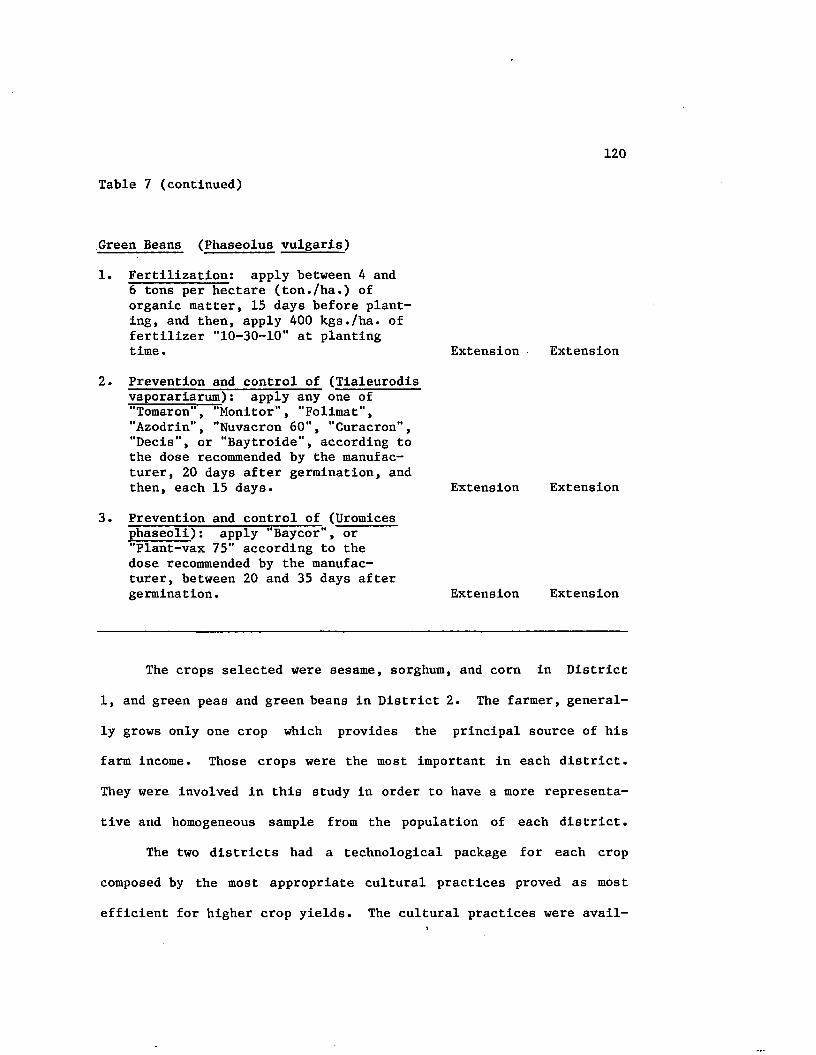
120
Table 7 (continued)
Green Beans (Phaseolus vulgaris)
1. Fertilization: apply between 4 and6 tons per hectare (ton./ha.) of organic matter, 15 days before planting, and then, apply 400 kgs./ha. of fertilizer "10-30-10" at plantingtime. Extension Extension
2. Prevention and control of (Tialeurodis vaporariarum): apply any one of"Tomaron", "Monitor", "Folimat","Azodrin", "Nuvacron 60", "Curacron","Decis", or "Baytroide", according to the dose recommended by the manufacturer, 20 days after germination, andthen, each 15 days. Extension Extension
3. Prevention and control of (Uromices phaseoli): apply "Baycor", or "Plant-vax 75" according to the dose recommended by the manufacturer, between 20 and 35 days aftergermination. Extension Extension
The crops selected were sesame, sorghum, and corn in District
1, and green peas and green beans in District 2. The farmer, general
ly grows only one crop which provides the principal source of his
farm income. Those crops were the most important in each district.
They were involved in this study in order to have a more representa
tive and homogeneous sample from the population of each district.
The two districts had a technological package for each crop
composed by the most appropriate cultural practices proved as most
efficient for higher crop yields. The cultural practices were avail-
121
able to the farmers and they were recommended and transferred by
means of different extension methods.
The selection of the recommended cultural practices by extension
personnel, for the purposes of this study, was based on the relative
importance of these recommendations facing the most pressing
technological problems of each one of the crops.
According to Table 7, the cultural practices selected in
District 1 were related to the kind of seed, weed control, and
fertilization for sorghum and corn, and to the kind of seed, distance
of planting, and fertilization for sesame. It can be observed that
special emphasis was being given to the kind of seed and fertiliza
tion rates, taking into account the low crop yields per hectare due
to soil fertility problems.
Most of the technology recommended by the DRI program in
District 1 was generated by the research programs of the Colombian
Agricultural Institute, ICA, through its Regional Center of
agricultural research "Nataima". In some instances, like in fertili
zation, the generation of the recommendations was the result of joint
work, at the district level, between the research programs of the
experiment station and the extension service. Only in the case of
corn, extension was responsible for determining the kinds and levels
of fertilizers to be recommended. Another situation that deserves to
be mentioned is related to the variety of corn identified as "Clavo
Regional” which was considered as a local generated technology of
production because it was generated by the farmers. The extension

122
service recommended this variety, but emphasized the use of certified
seed. The adaptation of these technologies to farm conditions in the
different areas of District 1 was carried out by the extension program.
In District 2, the cultural practices selected for green peas
and green beans were related to fertilization and prevention and
control of pests and diseases. In this instance, both the generation
and adaptation of the technologies were carried out by the extension
program.
Transfer of Technology
Transfer of technology has been considered as the basis of the
DRI extension, program. In this study, transfer of technology or
extension is considered as one of the independent variables.
As it was previously indicated, the extent to which the DRI
program was effectively transferring appropriate technology was
determined according to the number of correct responses given by
the farmers in relation to the recommended cultural practices they
knew. Question No. 5 of the interview schedule provided the data
to determine this extent of effectiveness.
The statistical analyses applied showed the following (Table 8):
a) There was a significant difference in relation to the extent of
effectiveness of the DRI program in transferring technology in
District 1.
b) There was not a significant difference, at the 0.05 level of

123
TABLE 8
A Comparison of the Farmers' Perception in Relation to the Extent to which the DRI Program Was Effectively Transferring
Technology by Districts, 1985
Percent by District
Extent of District 1 District 2 TotalEffectiveness (n=60) (n=60) (n=120) Dm.* P
Not effective 6.7 20.0 13.3
Slightly effective 13.3 31.7 22.50.434 <0.01
Fairly effective 28.3 40.0 34.2
Effective 51.7 8.3 30.0
Total 100 100 100
Dm.** 0.300 0.167
P < 0.001 N.S.
*Dm.: Value (maximum difference) obtained through the Kolmogorov-Smirnov two-sample test.
**Dm.: Value (maximum difference) obtained through the Kolmogorov-Smirnov one-sample test.

124
confidence, in relation to the extent of effectiveness of the
DRI program in transferring technology in District 2.
c) There was a significant difference in relation to the extent of
effectiveness of the DRI program in transferring technology
between District 1 and District 2.
In fact, 51.7 percent of the respondents in District 1 con
sidered the transfer of technology as effective and only 6.7 percent
as not effective. In District 2, forty percent of the farmers
perceived the extent of effectiveness as fairly effective, 31.7
percent as slightly effective, 20 percent as not effective, and only
8.3 percent as effective. This indicated that the tendency of the
extent of effectiveness in transferring appropriate technology
varied between fairly effective and effective in District 1 (80
percent), while in District 2 it varied between slightly and fairly
effective (71.7 percent).
According to the data, it can be determined that the transfer
of technology was perceived to be more effective in District 1 than
in District 2. These results seem to be related to those found when
the perceived extent of limitation of extension as a limiting factor
of crop productivity was analyzed. In that instance it was observed
that a lower extent of limitation of extension was perceived by the
farmers in District 1 than in District 2.
125
Means of Transferring Technology
Question No. 6 of the interview schedule provided the data
to determine through what means of information farmers learned
about cultural practices.
Data provided by the respondents is presented in Table 9.
The Chi-Square (X^) test was not calculated because of inadequacies
in some cell frequencies. Nevertheless, the following can be ob
served:
By far, the most frequent means of information as perceived
by the respondents was the DRI extension agent in both, District 1
(63.3 percent) and District 2 (66.6 percent), followed by the com
bination of the DRI extension agent and a friend or neighbor (28.3
percent in District 1 and 10 percent in District 2). Following in
frequency was the combination of the DRI extension agent and written
material (6.7 percent in each one of the two districts). A friend
or neighbor as a means of information accounted 1.7 percent in
District 1 and 3.3 percent in District 2. In District 2, farmers
mentioned other means or combination of means with very low frequen
cies such as the radio and "others" (agricultural supply and input
dealers).
The DRI extension agent alone, or in combination with other
means, was perceived as the principal means of information of
cultural practices by 98.3 percent of the farmers in District 1 and
91.7 percent in District 2. Thirty percent of the respondents in
District 1 and 21.6 percent in District 2 perceived a friend or
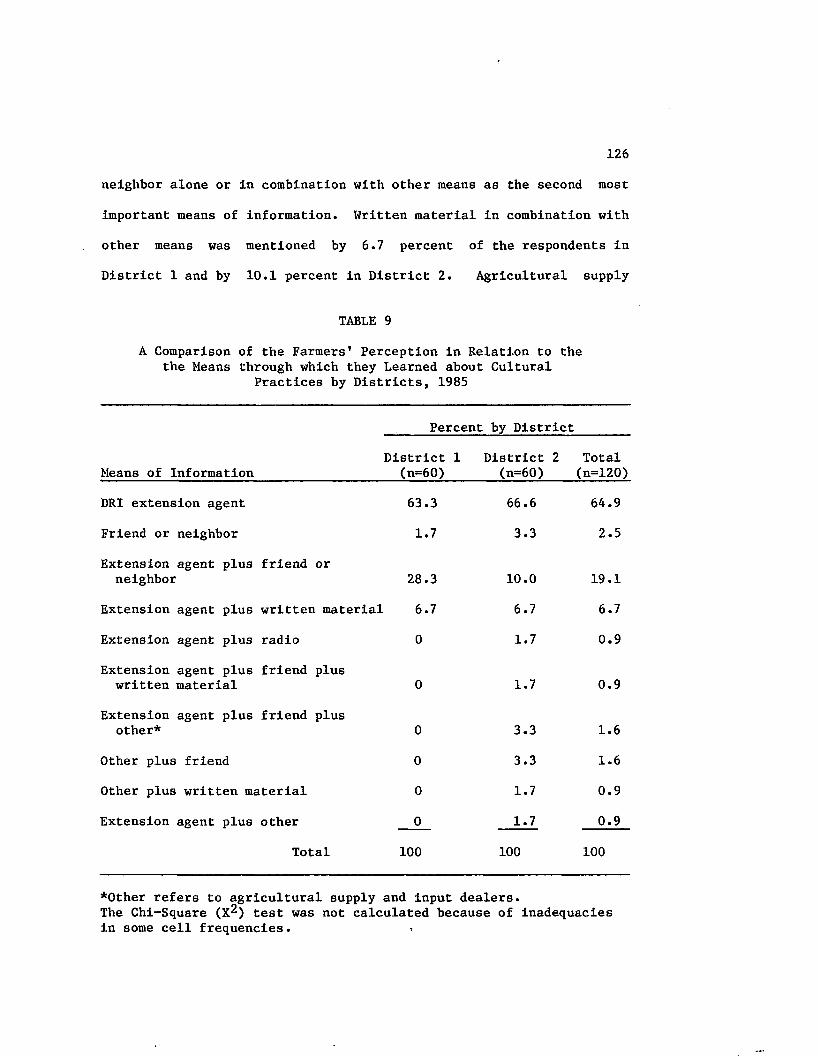
126
neighbor alone or in combination with other means as the second most
important means of information. Written material in combination with
other means was mentioned by 6.7 percent of the respondents in
District 1 and by 10.1 percent in District 2. Agricultural supply
TABLE 9
A Comparison of the Farmers' Perception in Relation to the the Means through which they Learned about Cultural
Practices by Districts, 1985
Means of Information
Percent by District
District 1 District 2 (n=60) (n=60)
Total(n=120)
DRI extension agent 63.3 66.6 64.9
Friend or neighbor 1.7 3.3 2.5
Extension agent plus friend or neighbor 28.3 10.0 19.1
Extension agent plus written material 6.7 6.7 6.7
Extension agent plus radio 0 1.7 0.9
Extension agent plus friend plus written material 0 1.7 0.9
Extension agent plus friend plus other* 0 3.3 1.6
Other plus friend 0 3.3 1.6
Other plus written material 0 1.7 0.9
Extension agent plus other 0 1.7 0.9
Total 100 100 100
*0ther refers to agricultural supply and input dealers.The Chi-Square (X^) test was not calculated because of inadequacies in some cell frequencies.
127
and input dealers alone or in combination with other means were
mentioned by 10 percent of the farmers in District 2, while they
were not mentioned in District 1 as a means of information.
It can be determined that the most important means through
which farmers learned about cultural practices for their crops was
the DRI extension agent, followed by a friend or neighbor and by
written material, both in District 1 and in District 2. Dealers
had relatively minor importance as a means of information, and only
in District 2.
Satisfaction in Relation to DRI Technical Assistance
Question No. 7 of the interview schedule provided the data to
determine the levels of satisfaction of the respondents in relation
to the technical assistance they were receiving from the DRI program.
The statistical analysis indicated a significant difference in
levels of farmers' satisfaction between the two districts (Table 10).
In fact, 78.4 percent of the farmers in District 1 were
satisfied with the DRI technical assistance, while in District 2,
only 31.7 of the farmers felt the same way. More than half of the
respondents (53.3 percent) in District 2 were faily satisfied with
technical assistance.
These results are consistent with the findings obtained through
the analysis of the perceived extent of limitation of extension as
a crop productivity limiting factor, and through the analysis of the
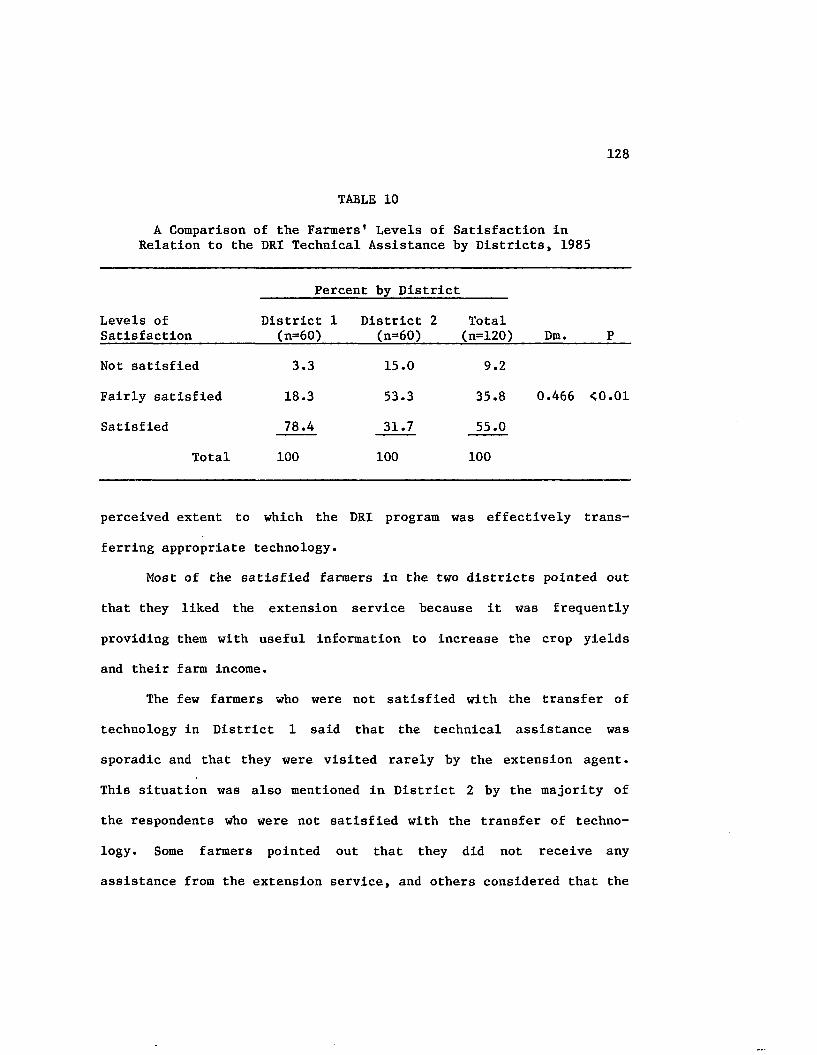
128
TABLE 10
A Comparison of the Farmers' Levels of Satisfaction in Relation to the DRI Technical Assistance by Districts, 1985
Percent by District
Levels of Satisfaction
District 1 (n=60)
District 2 (n=60)
Total(n=120) Dm. P
Mot satisfied 3.3 15.0 9.2
Fairly satisfied 18.3 53.3 35.8 0.466 <0.01
Satisfied 78.4 31.7 55.0
Total 100 100 100
perceived extent to which the DRI program was effectively trans-
ferring appropriate technology.
Most of the satisfied farmers in the two districts pointed out
that they liked the extension service because it was frequently
providing them with useful information to increase the crop yields
and their farm income.
The few farmers who were not satisfied with the transfer of
technology in District 1 said that the technical assistance was
sporadic and that they were visited rarely by the extension agent.
This situation was also mentioned in District 2 by the majority of
the respondents who were not satisfied with the transfer of techno
logy. Some farmers pointed out that they did not receive any
assistance from the extension service, and others considered that the
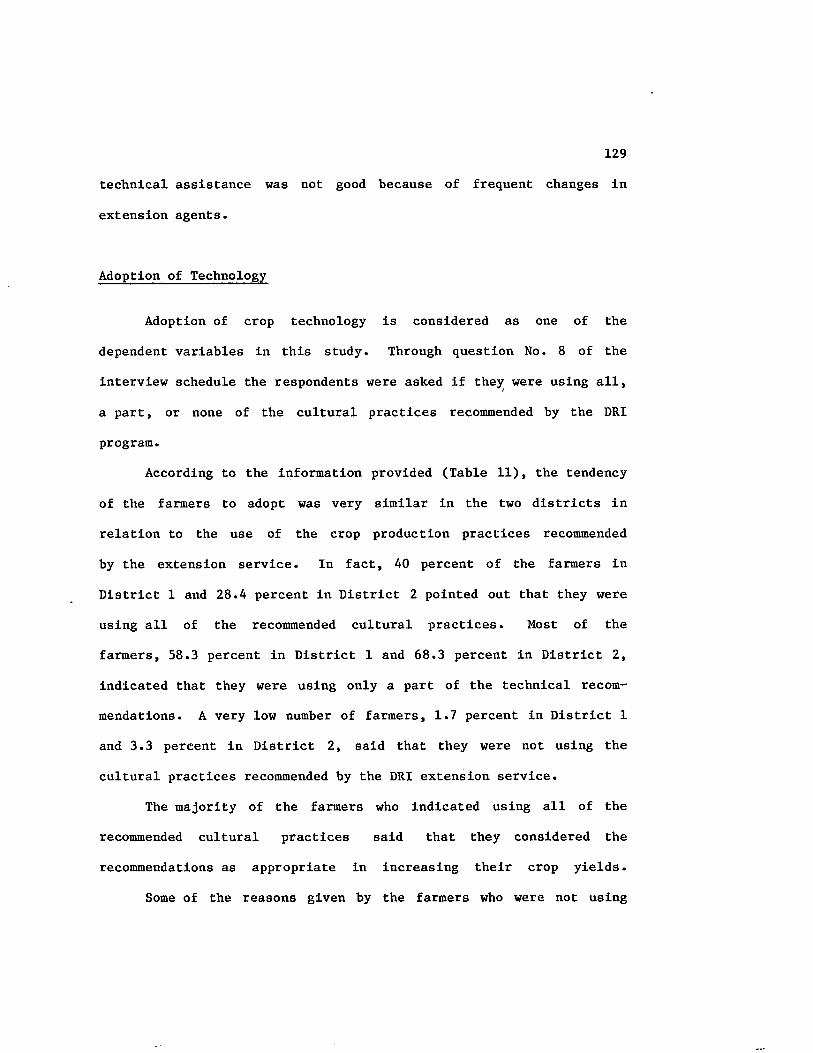
129
technical assistance was not good because of frequent changes in
extension agents.
Adoption of Technology
Adoption of crop technology is considered as one of the
dependent variables in this study. Through question No. 8 of the
interview schedule the respondents were asked if they were using all,
a part, or none of the cultural practices recommended by the DRI
program.
According to the information provided (Table 11), the tendency
of the farmers to adopt was very similar in the two districts in
relation to the use of the crop production practices recommended
by the extension service. In fact, 40 percent of the farmers in
District 1 and 28.4 percent in District 2 pointed out that they were
using all of the recommended cultural practices. Most of the
farmers, 58.3 percent in District 1 and 68.3 percent in District 2,
indicated that they were using only a part of the technical recom
mendations. A very low number of farmers, 1.7 percent in District 1
and 3.3 percent in District 2, said that they were not using the
cultural practices recommended by the DRI extension service.
The majority of the farmers who indicated using all of the
recommended cultural practices said that they considered the
recommendations as appropriate in increasing their crop yields.
Some of the reasons given by the farmers who were not using
130
any or only a part of the cultural practices transferred by the DRI
program were the following: expensiveness of agricultural inputs
which increased production costs; lack of sufficient information
about the recommendations; some traditional practices were better than
TABLE 11
A Comparison of the Use of Cultural Practices Recommended by the DRI Program According to the
Information Provided by the Farmers by Districts, 1985
Percent by District
Use of Cultural Practices
District 1 (n=60)
District 2 (n=60)
Total(n=120)
None 1.7 3.3 2.5
In part 58.3 68.3 63.3
All 40.0 28.4 34.2
Total 100 100 100
the new ones; it was risky to apply certain new practices; pesticides
and fertilizers were sometimes scarce and of poor quality; lack of
sufficient financial resources; the new technology was not always
favorable for small farmers; some practices were time-consuming; the
kind of land was not appropriate to apply some new recommendations;
and the uncertainty due to changes in weather conditions did not
encourage use of some of the recommended cultural practices.
Question 9 of the interview schedule provided the data to
determine the levels of adoption of technology.
131
Three questions related to each one of the three previously
selected recommendations or cultural practices were asked of the
respondents. The level of adoption was determined according to
the number of correct responses given, that is, according to the
number of cultural practices used by the farmers matching the DRI's
recommendations. No adoption, low, fair, and high levels of adoption
of technology were assigned if farmers were using none, one, two, or
three recommended cultural practices for the growing of their crops,
respectively.
Table 12 presents a comparison of the levels of adoption of
technology between District 1 and District 2. The statistical
analyses applied showed the following:
a) There was a significant difference among farmers in relation to
the levels of adoption of technology in District 1.
b) There was not a significant difference in relation to the levels
of adoption of technology among farmers in District 2, at the
0.05 level of confidence.
c) There was a significant difference in relation to the levels of
adoption of technology by farmers between District 1 and District
2 .
In fact, most of the farmers (60 percent) in District 1 had a
fair level of adoption of technology, 16.6 percent a high level of
adoption, and only 1.7 percent did not adopt any recommended cultural
practice.
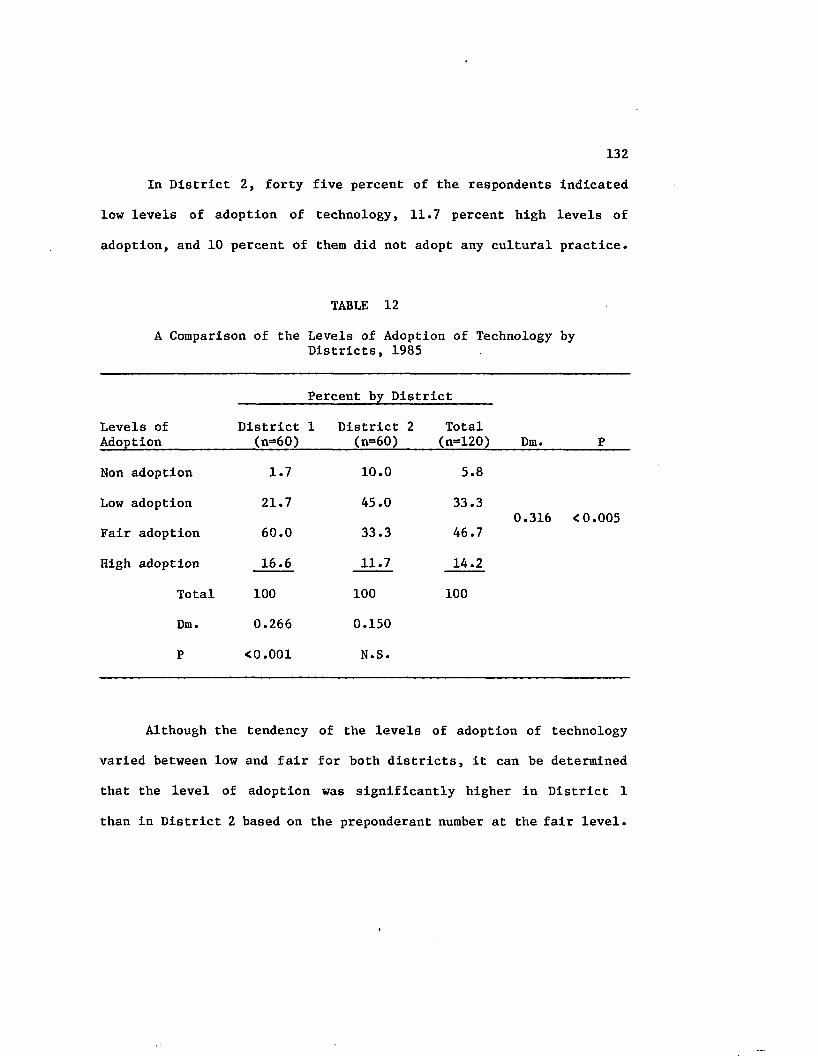
132
In District 2, forty five percent of the respondents indicated
low levels of adoption of technology, 11.7 percent high levels of
adoption, and 10 percent of them did not adopt any cultural practice.
TABLE 12
A Comparison of the Levels of Adoption of Technology byDistricts, 1985
Levels of Adoption
District(n=60)
Percent by District
1 District 2 Total(n=60) (n=120) Dm. P
Non adoption 1.7 10.0 5.8
Low adoption 21.7 45.0 33.30.316 <0.005
Fair adoption 60.0 33.3 46.7
High adoption 16.6 11.7 14.2
Total 100 100 100
Dm. 0.266 0.150
P <0.001 N.S.
Although the tendency of the levels of adoption of technology
varied between low and fair for both districts, it can be determined
that the level of adoption was significantly higher in District 1
than in District 2 based on the preponderant number at the fair level.

133
Reasons for Non Adoption of Technology
Question No. 13 of the interview schedule provided the informa
tion to determine the reasons that did not allow farmers to use or
adopt the cultural practices recommended by the DRI program.
This question was applied only to those farmers who previously
pointed out that they were using none or only a part of the
recommended cultural practices. Farmers had the opportunity to
indicate up to five reasons that they considered as limitations in
adopting technology. Since the majority of the farmers mentioned
more than one reason, the total frequencies obtained were larger than
the total number of respondents in each district. They were 135 in
District 1 and 152 in District 2.
Table 13 presents the results obtained in relation to the
reasons that did not allow farmers to adopt the recommended cultural
practices. The reasons are listed following in descending frequency
order.
It can be observed that the most frequent reasons considered
by the total respondents dealt with economic aspects. These reasons
were related to higher costs of production, apprehension in investing
more money, and expensiveness of agricultural supplies, considered
by 16; 16; and 14.7 percent of the total sample, respectively. Very
slight differences in the percentages were observed between the two
districts as far as these three reasons were concerned. It is true
that most of the new technologies (use of certified seeds, fertili-
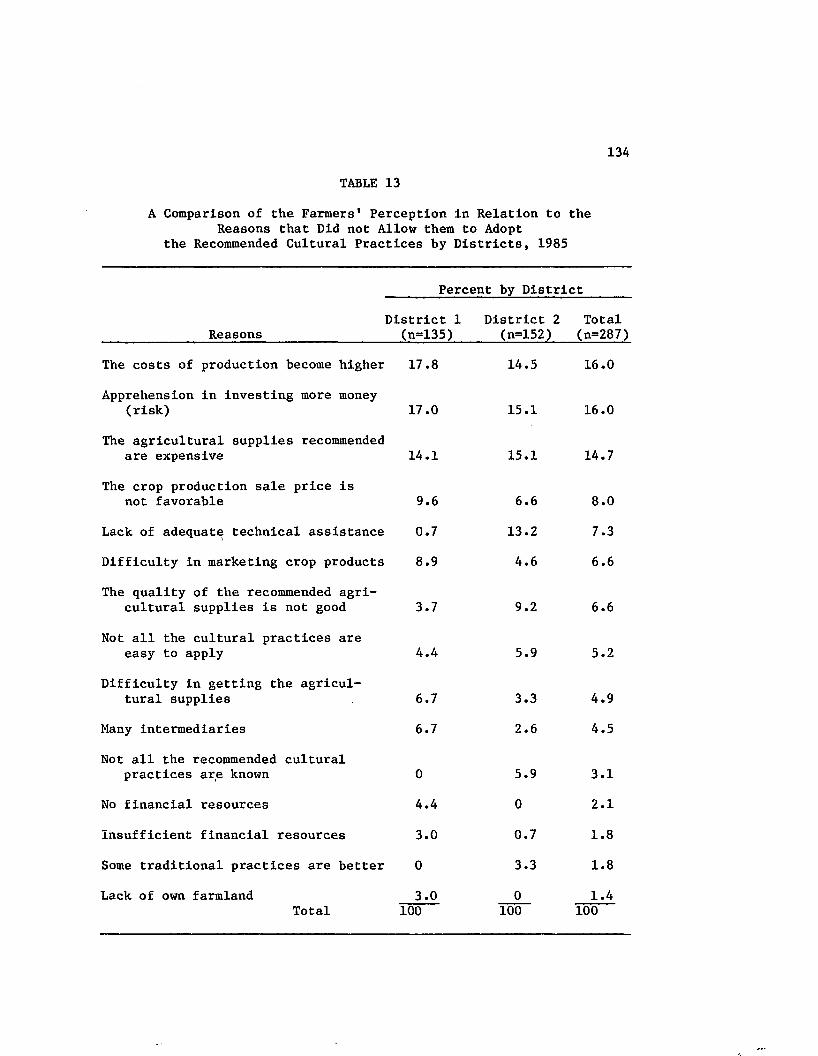
134
TABLE 13
A Comparison of the Farmers' Perception in Relation to the Reasons that Did not Allow them to Adopt
the Recommended Cultural Practices by Districts, 1985
Percent by District
District 1 District 2 Total_____________ Reasons_________________ (n=135)_____(n=152) (n=287)
The costs of production become higher 17.8 14.5 16.0
Apprehension in investing more money(risk) 17.0 15.1 16.0
The agricultural supplies recommendedare expensive 14.1 15.1 14.7
The crop production sale price isnot favorable 9.6 6.6 8.0
Lack of adequate technical assistance 0.7 13.2 7.3
Difficulty in marketing crop products 8.9 4.6 6.6
The quality of the recommended agricultural supplies is not good 3.7 9.2 6.6
Not all the cultural practices areeasy to apply 4.4 5.9 5.2
Difficulty in getting the agricultural supplies 6.7 3.3 4.9
Many intermediaries 6.7 2.6 4.5
Not all the recommended culturalpractices are known 0 5.9 3.1
No financial resources 4.4 0 2.1
Insufficient financial resources 3.0 0.7 1.8
Some traditional practices are better 0 3.3 1.8
Lack of own farmland 3.0 0 1.4Total 100 100 100
135
zers, insecticides, and fungicides) raise production costs. Never
theless, the new cultural practices were proved to be more profitable
because they increased crop yields and improved crop productivity.
It seems that the perception of the respondents was not con
sistent with the credit policy of the DRI program which enabled
farmers to obtain the necessary resources to apply the recommended
cultural practices. It could support the hypothesis that not all
of the farmers were fully using the credit obtained for the growing
of their crops. This situation also indicated that the credit did
not necessarily encourage all farmers to adopt new crop technology.
There were other factors that intervened probably.
The next most frequent reason was related to the unfavorable
prices farmers received for their crop production. Eight percent
of the total sample gave this reason. Nevertheless, it was more
frequently mentioned in District 1 (9.6 percent) than in District 2
(6.6 percent). This perception seems to be consistent with the
findings found in relation to the principal difficulties faced by the
farmers in marketing their crop production in each district.
Next in the frequency order was mentioned the lack of ade-f
quate technical assistance. This reason was considered by 7.3 percent
of the total sample. Nevertheless, a great difference was noticed
between the two districts, since only 0.7 percent of the farmers in
District 1 and 13.2 percent in District 2 perceived this reason as
a limitation for adopting new technology. These results are con
sistent with the findings obtained previously through the analyses of
136
extension as a crop productivity limiting factor (Tables 4 and 5),
the effectiveness in transferring technology (Table 8), and the
farmers' levels of satisfaction in relation to DRI technical
assistance (Table 10).
The difficulty in marketing crop production, and the poor
quality of the recommended agricultural supplies were the next most
frequently mentioned reasons as perceived by the respondents.
Although each one of these two reasons was considered by an equal
proportion of the total sample (6.6 percent), the frequencies varied
from one district to the other. In fact, the difficulty in marketing
crop production was more frequently mentioned in District 1 (8.9
percent) than in District 2 (4.6 percent), while the poor quality
of the agricultural supplies was more frequently mentioned in
District 2 (9.2 percent) than in District 1 (3.7 percent).
Other reasons affecting the adoption of crop technology were
related to the difficulty in applying some new cultural practices,
the difficulty in getting the agricultural supplies, and the presence
of intermediaries in the process of marketing the crop production.
It was also observed that some other less frequently mentioned
reasons were perceived only in one of the two Districts. For
instance, 5.9 percent of the farmers in District 2 indicated that not
all the recommended cultural practices were known, and 3.3 percent
considered that some traditional practices were better than the new
ones, while in District 1, three percent of the farmers indicated
that the financial resources were not sufficient enough to apply

137
certain recommendations, and three percent considered that the lack
of their own farmland was a limitation to adopting all of the re
commended cultural practices.
Some other reasons previously selected in the interview schedule
were not considered by any farmer as'direct limitations to adopting
new technology. They were related to inappropriate conditions of
credit, inappropriate transportation facilities for agricultural
supplies and farm products, difficulties in storing recommended
agricultural supplies or farm products, and inappropriate conditions
of farmland.
Crop Production
Levels of crop production (yield per hectare) is considered
as the second dependent variable in this study.
Question No. 12 of the interview schedule provided the data
to determine the levels of crop production. A comparison was made
between the yields of the crops when they were grown using the
recommended cultural practices and when they were grown using
traditional cultural practices.
Farmers who pointed out usage of a part or all of the re
commendations were asked for their crop yields before and after
using the recommended cultural practices. Farmers who used none of
the DRI recommendations were only asked for the yields of the crops
grown with traditional technology. In this instance, the crop
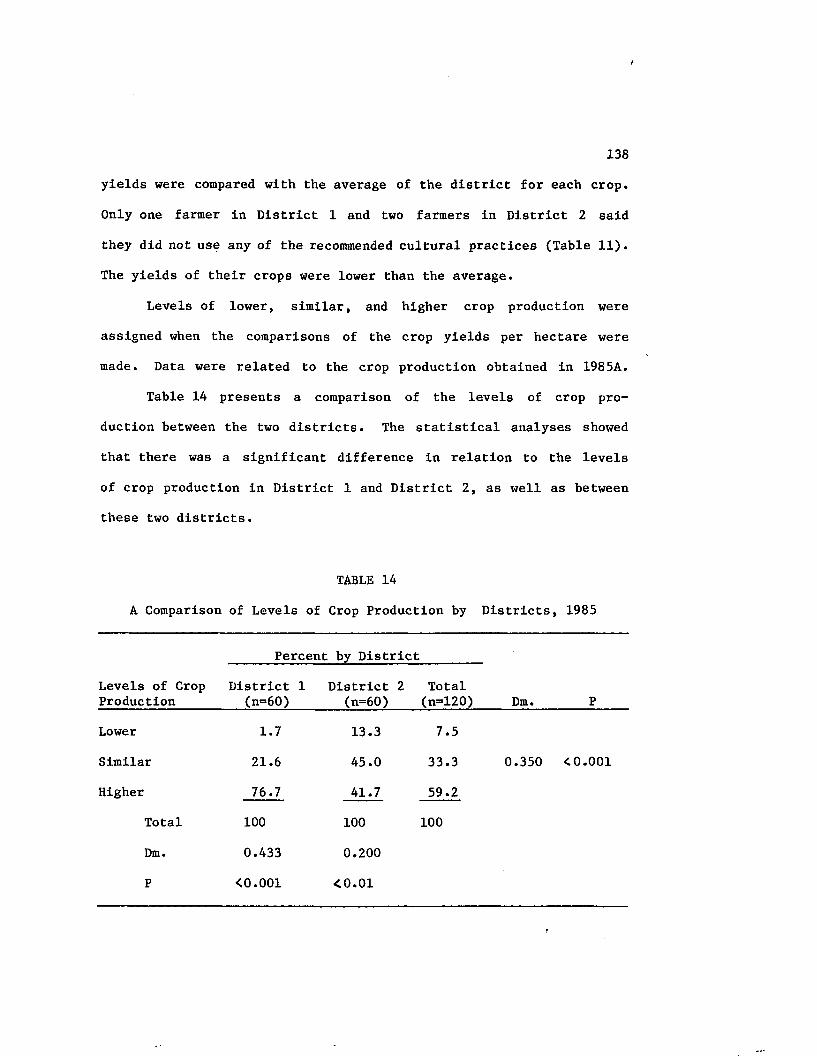
138
yields were compared with the average of the district for each crop.
Only one farmer in District 1 and two farmers in District 2 said
they did not use any of the recommended cultural practices (Table 11).
The yields of their crops were lower than the average.
Levels of lower, similar, and higher crop production were
assigned when the comparisons of the crop yields per hectare were
made. Data were related to the crop production obtained in 1985A.
Table 14 presents a comparison of the levels of crop pro
duction between the two districts. The statistical analyses showed
that there was a significant difference in relation to the levels
of crop production in District 1 and District 2, as well as between
these two districts.
TABLE 14
A Comparison of Levels of Crop Production by Districts, 1985
Percent by District
Levels of Crop District 1 District 2 TotalProduction_________ (n=60)______ (n=60)___ (n=120) Dm.
Lower
Similar
Higher
Total
Dm.
P
1.7
21.676.7
1000.433
<0.001
13.3
45.0
41.7
1000.200
< 0.01
7.5
33.3
59.2
100
0.350 <0.001
139
In fact, most of the respondents (76.7 percent) In District 1
obtained higher levels of crop production per hectare, while only
1.7 percent obtained lower levels. In District 2, forty five
percent of the farmers had similar levels of crop production, less
than half of them (41.7 percent) had higher levels, and 13.3 percent
had lower levels.
In District 1, the levels of crop production tended to be
higher, while in District 2 the tendency varied between similar and
higher levels of crop production. It can also be observed that a
larger percentage of the respondents in District 1 reached higher
levels of crop production in comparison with the respondents in
District 2.
These findings seem to be consistent with the extent of
effectiveness in transferring technology and with the levels of
adoption of technology determined previously for each one of the
districts. It could indicate that the transference of technology
and the adoption of technology had a positive impact on crop pro
duction, and it was more evident in District 1 than in District 2.
Credit
Kinds of Financial Resources
Question No. 14 of the interview schedule provided the informa
tion to determine the kinds of financial resources utilized by DRI
farmers for the growing of their crops.

140
Data In Table 15 Indicate that most of the farmers, 63.3
percent in District 1 and 80 percent in District 2, utilized only
DRI credit for financing their crops. Other farmers utilized
personal resources in addition to DRI credit. The percentage of
farmers under this situation was higher in District 1 (35 percent)
than in District 2 (20 percent). It could indicate that the amount
of credit received by these farmers was not sufficient to grow
appropriately their crops.
TABLE 15
A Comparison of the Kinds of Financial Resources Utilized by DRI Farmers to Grow their Crops by Districts, 1985
( Percent by District
Kinds of Financial ResourcesDistrict 1
(n=60)District 2
(n=60)Total(n=120)
DRI credit 63.3 80.0 71.7
Personal resources 1.7 0 0.8
DRI credit plus personal resources
35.0 20.0 27.5
Other 0 0 0
Total 100 100 100
One of the respondents in District 1 utilized only personal
resources, representing 1.7 percent of the sample in that district and
just 0.8 percent of the total sample. This farmer was not provided
with DRI credit because he did not meet all the requirements demanded
141
by th e DRI program. N e v e rth e le ss , he was re c e iv in g te c h n ic a l
a s s is ta n c e from th e DRI ex ten s io n program.
It can be determined that the majority of the farmers (99.2
percent) in both districts were provided with DRI credit to allow
them to apply the recommended cultural practices.
Length of Time U ti l iz in g DRI C red it
Question No. 16 of the interview schedule provided the in
formation to determine how long the respondents had been utilizing
DRI credit.
Table 16 shows that farmers in District 2 had been benefited
by the DRI credit program during a longer length of time than
farmers in District 1. In fact, most of the respondents (64.4
percent) in District 1 had been utilizing DRI credit for less than
two years, and only 35.6 percent during two to five years. In
District 2, most of the farmers (60 percent) had been receiving
DRI credit for more than five years, 26.7 percent during two to
five years, and only 13.3 percent for less than two years.
The d a ta a re c o n s is te n t w ith rthe le n g th of tim e the DRI
program had been p ro v id in g i t s s e rv ic e s to the farm ers in each
d i s t r i c t .
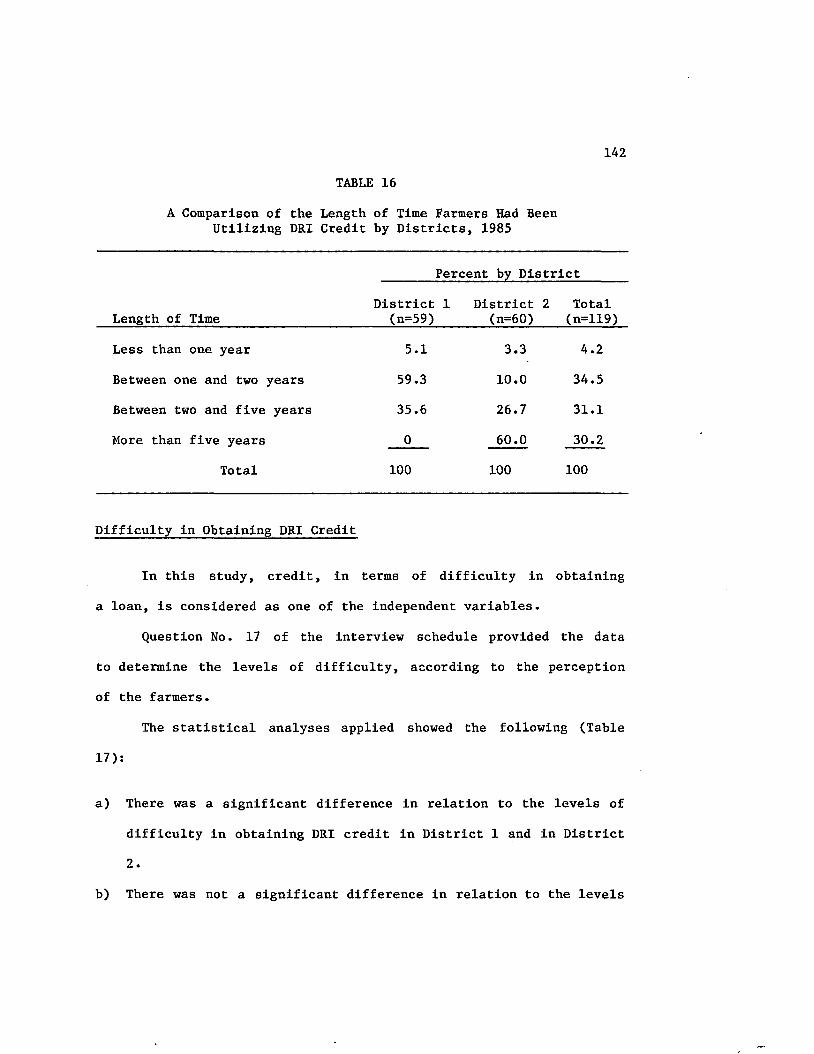
142
TABLE 16
A Comparison of the Length of Time Farmers Had Been Utilizing DRI Credit by Districts, 1985
Percent by District
Length of TimeDistrict
(n=59)1 District 2
(n=60)Total(n=119)
Less than one year 5.1 3.3 4.2
Between one and two years 59.3 10.0 34.5
Between two and five years 35.6 26.7 31.1
More than five years 0 60.0 30.2
Total 100 100 100
Difficulty in Obtaining DRI Credit
In this study, credit, in terms of difficulty in obtaining
a loan, is considered as one of the independent variables.
Question No. 17 of the interview schedule provided the data
to determine the levels of difficulty, according to the perception
of the farmers.
The statistical analyses applied showed the following (Table
17):
a) There was a significant difference in relation to the levels of
difficulty in obtaining DRI credit in District 1 and in District
2.b) There was not a significant difference in relation to the levels

143
of difficulty in obtaining DRI credit between District 1 and
District 2, at the 0.05 level of confidence.
In fact, most of the farmers in District 1 (80 percent)
perceived the process of getting loans as simple, 10 percent as
very simple, and 10 percent as difficult. In District 2, eighty
three point three percent of the farmers considered the level of
difficulty as simple, and the remainder (16.7 percent) as difficult.
TABLE 17
A Comparison of the Farmers' Perception in Relation to the Difficulty in Obtaining DRI Credit by Districts, 1985
_____ Percent by District______
Levels of District 1 District 2 TotalDifficulty_____________ (n=60)_______(n=60)___ (n=120) Dm._____P
Very difficult 0 0 0
Difficult 10.0 16.7 13.3
Simple 80.0 83.3 81.7
Very simple 10.0 0 5.0
Total 100 100 100
Dm. 0.400 0.333
P <0.001 <0.001
Although the difficulty was slightly more evident in District 2
than in District 1, the process of obtaining DRI credit tended to
be simple in the two districts. It could explain, at least In part,
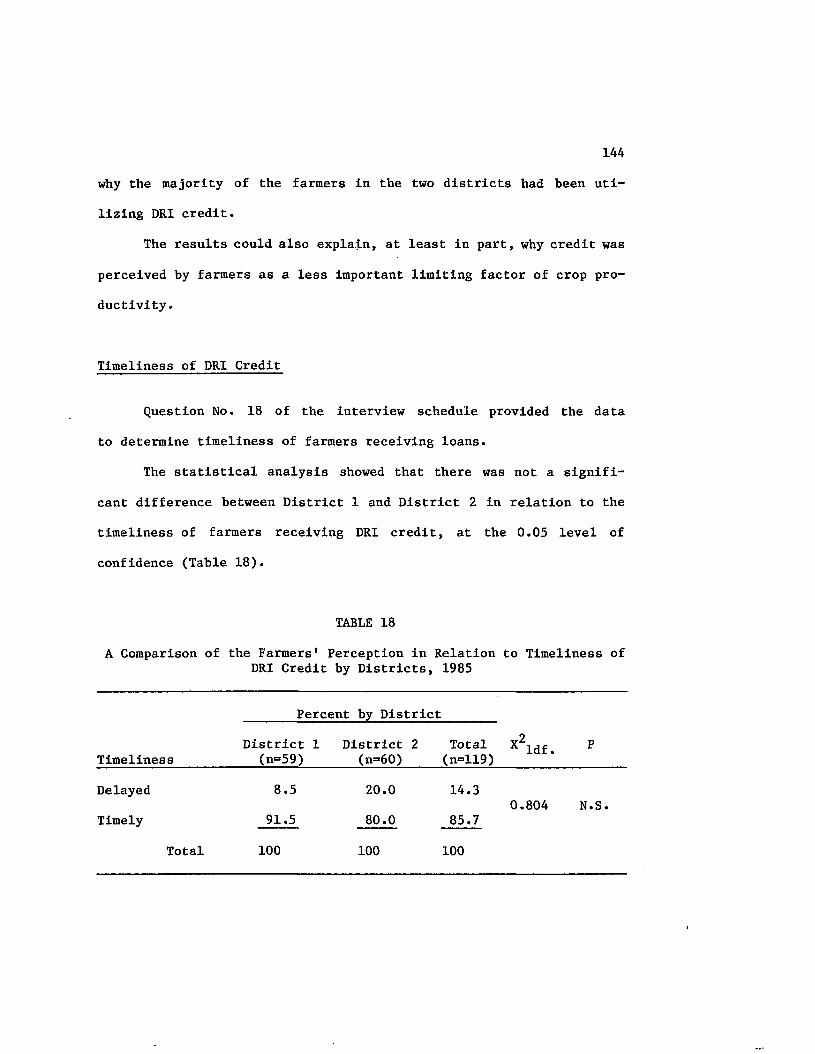
144
why the majority of the farmers in the two districts had been uti
lizing DRI credit.
The results could also explain, at least in part, why credit was
perceived by farmers as a less important limiting factor of crop pro
ductivity.
Timeliness of DRI Credit
Question No. 18 of the interview schedule provided the data
to determine timeliness of farmers receiving loans.
The statistical analysis showed that there was not a signifi
cant difference between District 1 and District 2 in relation to the
timeliness of farmers receiving DRI credit, at the 0.05 level of
confidence (Table 18).
TABLE 18
A Comparison of the Farmers' Perception in Relation to Timeliness ofDRI Credit by Districts, 1985
Percent by District
TimelinessDistrict 1 District 2 Total
(n=59)_______ (n=60) (n=119)______P
Delayed 8.5 20.0 14.30.804 N.S
Timely 91.5 80.0 85.7
Total 100 100 100
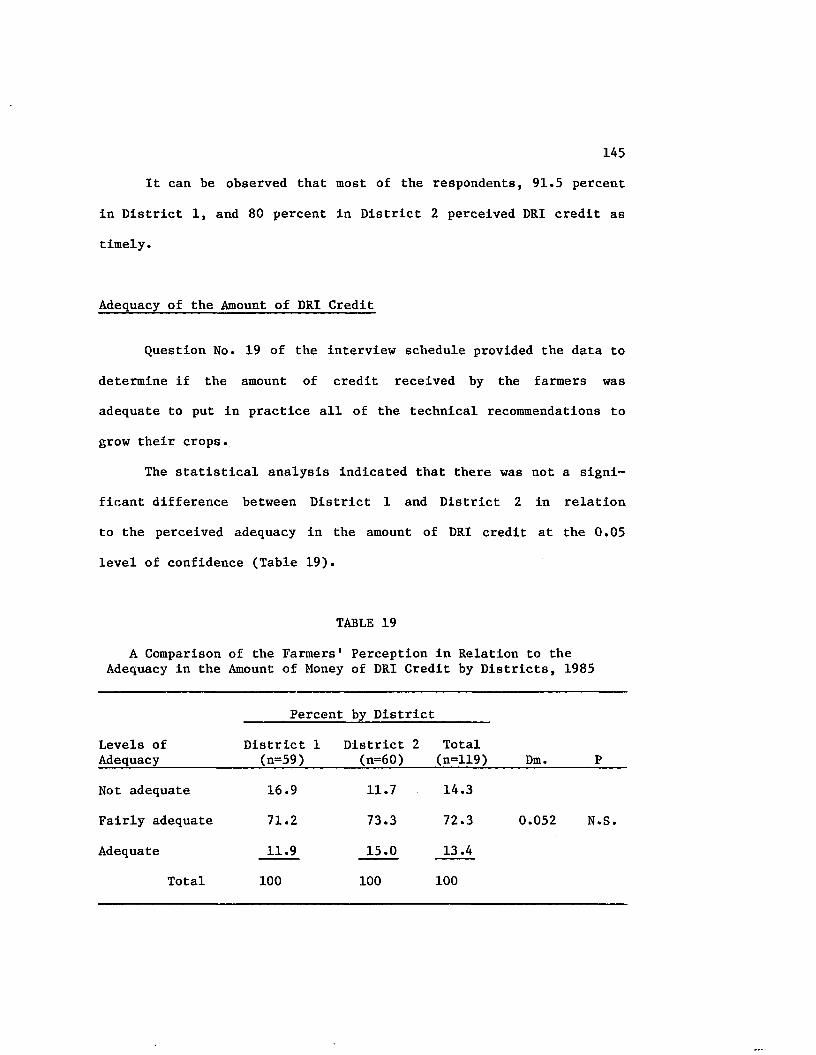
145
It can be observed that most of the respondents, 91.5 percent
in District 1, and 80 percent in District 2 perceived DRI credit as
timely.
Adequacy of the Amount of DRI Credit
Question No. 19 of the interview schedule provided the data to
determine if the amount of credit received by the farmers was
adequate to put in practice all of the technical recommendations to
grow their crops.
The statistical analysis indicated that there was not a signi
ficant difference between District 1 and District 2 in relation
to the perceived adequacy in the amount of DRI credit at the 0.05
level of confidence (Table 19).
TABLE 19
A Comparison of the Farmers' Perception in Relation to the Adequacy in the Amount of Money of DRI Credit by Districts, 1985
_____ Percent by District_______
Levels of District 1 District 2 TotalAdequacy____________ (n=59)_______(n=60)___ (n=119)_____Dm.______P
Not adequate 16.9 11.7 14.3
Fairly adequate 71.2 73.3 72.3 0.052 N.S.
Adequate 11.9 15.0 13.4
Total 100 100 100
146
Data show that most of the respondents, 71.2 percent in Dis
trict 1 and 73.3 percent in District 2, perceived DRI credit as
fairly adequate regarding the amount of money lent.
Only 11.7 percent of the farmers in District 2 perceived the
amount of credit as not adequate, while 16.9 percent of the farmers
in District 1 did. Inversely, only 11.9 percent of the farmers
in District 1 and 15 percent in District 2 considered the amount of
credit as adequate to put in practice the technical recommendations.
As it was previously pointed out, the DRI credit program
finances almost all of the technical activities or cultural practices
required for the growing of the crop. The amount of credit is
determined by the extension agent based upon a detailed plan of
investments which includes all of the costs of the cultural practices.
Since most of the farmers considered the amount of credit as
fairly adequate for the growing of their crops, it could be assumed
that those farmers were either using larger amounts of agricultural
inputs than those recommended, or they were spending part of the
credit for other purposes. If this was true, it seems that there was
not sufficient supervision of credit by the DRI program.
Regardless, those assumptions and according to the perception
of the farmers, it can be determined that DRI credit tended to be
fairly adequate to put into practice all of the technical recommen
dations on their crops.

147
Interest Rates of DRI Credit
Question No. 20 of the interview schedule provided the data
to determine the perceived levels of interest rates of DRI credit
as perceived by the farmers.
The statistical analysis showed that there was not a significant
difference between District 1 and District 2 in relation to the
perceived levels of interest rates of DRI credit, at the 0.05 level
of confidence (Table 20).
TABLE 20
A Comparison of the Farmers' Perception in Relation to the Interest Rates of DRI Credit
by Districts, 1985
Percent by District
Levels of Interest Rates
District 1 (n=60)
District 2 (n=60)
Total(n=120) Dm. P
Low 30.0 33.3 31.6
Moderate 63.3 60.0 61.7 0.033 N.S.
High 6.7 6.7 6.7
Total 100 100 100
The pattern of the levels of interest rates as perceived by
the respondents was very similar in the two districts. Most of the
farmers, 63.3 percent in District 1 and 60 percent in District 2,
considered credit interest rates as moderate. Only 6.7 percent of
148
the farmers in each one of the districts pointed out that interest
rates were high.
It has been considered that the rate of interest of DRI credit
is one of the lowest among all of the different agricultural credit
programs around the country.
It can be determined, according to the perception of the
majority of the farmers, that the interest rates of DRI credit
tended to vary between moderate and low in both districts.
Terms for Repaying Loans
Question No. 21 of the interview schedule provided the data to
determine the characteristics of DRI credit in relation to the
terms for repaying loans as perceived by the farmers.
The statistical analysis indicated that there was not a
significant difference in perception between farmers in District 1
and farmers in District 2, at the 0.05 level of confidence, re
garding the conditions of terms to pay back loans (Table 21).
The characteristics of DRI credit regarding the terms estab
lished for repaying loans was perceived very similarly by the respon
dents in the two districts. In fact, most of the farmers, 85 percent
in District 1 and 76.7 in District 2, considered the terms as
moderate. A very low number of farmers, 1.7 percent in District 1
and 6.7 percent in District 2, pointed out the terms as short.
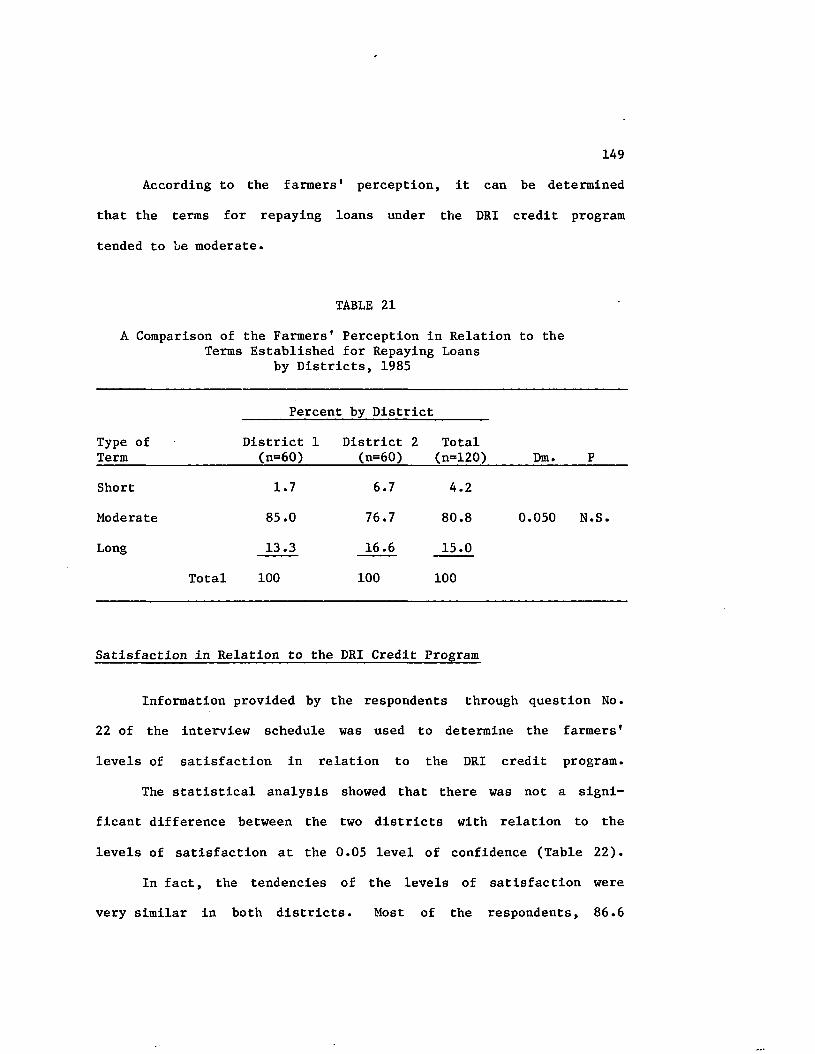
149
According to the farmers' perception, it can be determined
that the terms for repaying loans under the DRI credit program
tended to be moderate.
TABLE 21
A Comparison of the Farmers' Perception in Relation to the Terms Established for Repaying Loans
by Districts, 1985
Percent by District
Type of Term
District 1 (n=60)
District 2 (n=60)
Total(n=120) Dm. P
Short 1.7 6.7 4.2
Moderate 85.0 76.7 80.8 0.050 N.S.
Long 13.3 16.6 15.0
Total 100 100 100
Satisfaction in Relation to the DRI Credit Program
Information provided by the respondents through question No.
22 of the interview schedule was used to determine the farmers'
levels of satisfaction in relation to the DRI credit program.
The statistical analysis showed that there was not a signi
ficant difference between the two districts with relation to the
levels of satisfaction at the 0.05 level of confidence (Table 22).
In fact, the tendencies of the levels of satisfaction were
very similar in both districts. Most of the respondents, 86.6
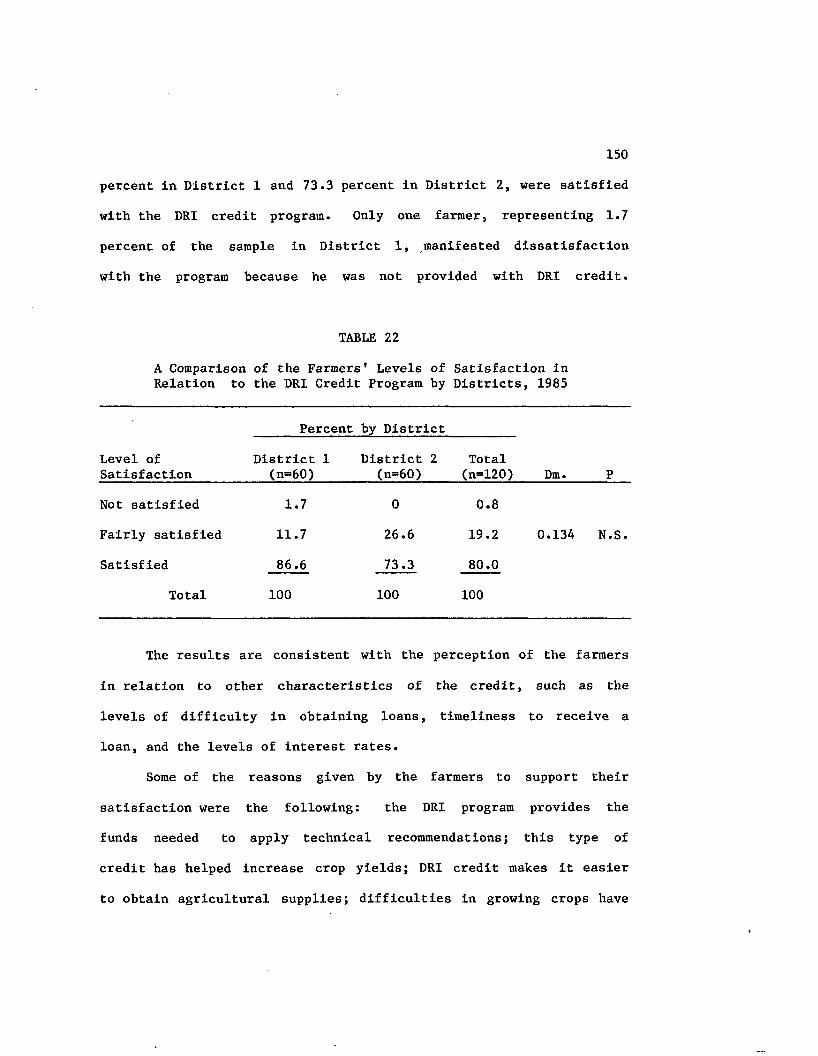
150
percent in District 1 and 73.3 percent in District 2, were satisfied
with the DRI credit program. Only one farmer, representing 1.7
percent of the sample in District 1, manifested dissatisfaction
with the program because he was not provided with DRI credit.
TABLE 22
A Comparison of the Farmers' Levels of Satisfaction in Relation to the DRI Credit Program by Districts, 1985
Percent by District
Level of Satisfaction
District 1 (n=60)
District 2 (n=60)
Total(n=120) Dm. P
Not satisfied 1.7 0 0.8
Fairly satisfied 11.7 26.6 19.2 0.134 N.S.
Satisfied 86.6 73.3 80.0
Total 100 100 100
The results are consistent with the perception of the farmers
in relation to other characteristics of the credit, such as the
levels of difficulty in obtaining loans, timeliness to receive a
loan, and the levels of interest rates.
Some of the reasons given by the farmers to support their
satisfaction were the following: the DRI program provides the
funds needed to apply technical recommendations; this type of
credit has helped increase crop yields; DRI credit makes it easier
to obtain agricultural supplies; difficulties in growing crops have
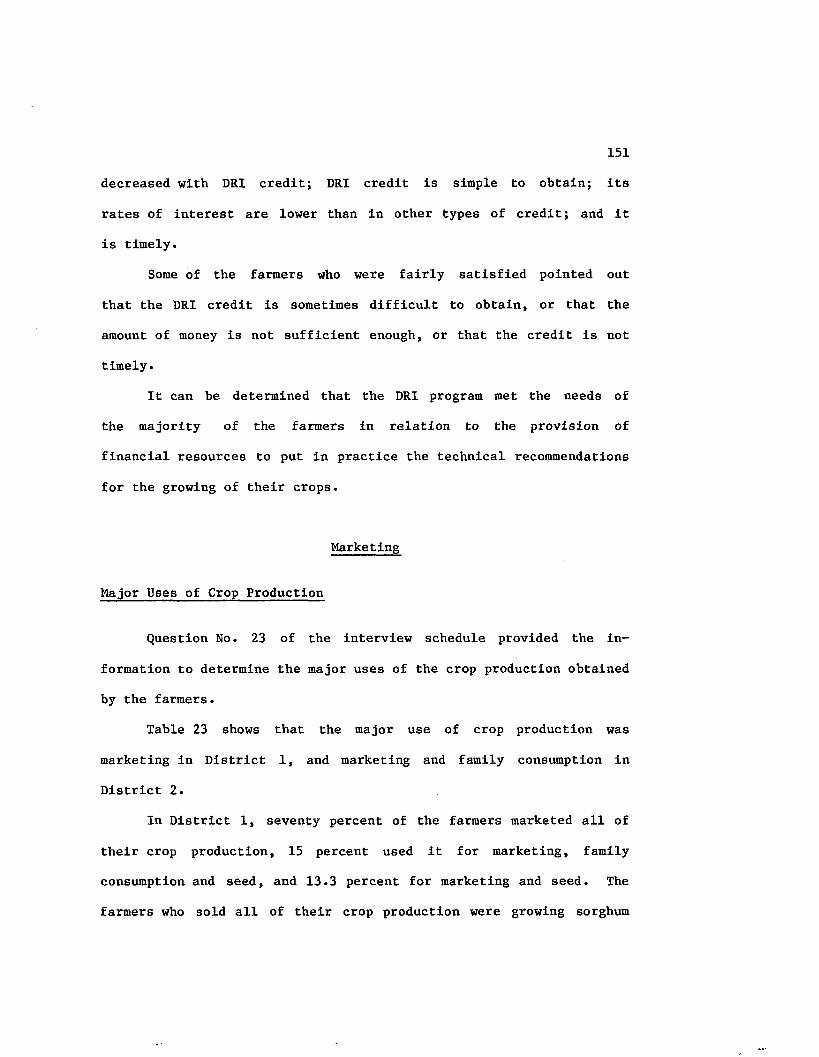
151
decreased with DRI credit; DRI credit is simple to obtain; its
rates of interest are lower than in other types of credit; and it
is timely.
Some of the farmers who were fairly satisfied pointed out
that the DRI credit is sometimes difficult to obtain, or that the
amount of money is not sufficient enough, or that the credit is not
timely.
It can be determined that the DRI program met the needs of
the majority of the farmers in relation to the provision of
financial resources to put in practice the technical recommendations
for the growing of their crops.
Marketing
Major Uses of Crop Production
Question No. 23 of the interview schedule provided the in
formation to determine the major uses of the crop production obtained
by the farmers.
Table 23 shows that the major use of crop production was
marketing in District 1, and marketing and family consumption in
District 2.
In District 1, seventy percent of the farmers marketed all of
their crop production, 15 percent used it for marketing, family
consumption and seed, and 13.3 percent for marketing and seed. The
farmers who sold all of their crop production were growing sorghum
152
or sesame, two crops used for industry. The few farmers who used
their crop production for marketing, family consumption, and seed
were growing corn.
TABLE 23
A Comparison of the Major Uses of Crop Production by Districts, 1985
Percent by District
Major Uses District 1 (n=60)
District 2 (n=60)
Total(n=120)
Marketing 70.0 30.0 50.0
Marketing and family consumption 1.7 55.0 28.3
Marketing and seed 13.3 11.7 12.5
Marketing, family consumption, and seed 15.0 3.3 9.2
Total 100 100 100
In District 2, thirty percent of the farmers sold all of their
crop production, 11.7 percent used it for marketing and seed, and 55
percent for marketing and family consumption. The use of a part of
the crop production for family consumption can be explained since
farmers in this district were growing green peas and green beans.
It can be observed that 28.3 percent of the farmers in District
1 and 15 percent in District 2 used a part of their crop production
for seed. This practice is not recommended since the seed obtained
is not of good quality. The DRI program has recommended the use of
153
new certified seed for each one of the crops involved in this study.
It was determined that these farmers did not adopt this technology.
It could explain, at least in part, the findings obtained in Tables
11 and 12, in relation to the levels of adoption of technology.
None of the farmers used their crop production for family
consumption and/or for seed, only. It shows that the major use
of crop production was for sale since it represented the principal
source of the farm income.
Difficulty in the Marketing Process
In this study, marketing, in terms of difficulty in marketing
crop production, is considered as one of the independent variables.
Question No. 24 of the interview schedule provided the data to
determine the levels of difficulty, according to the perception of
the farmers.
The statistical analyses showed the following (Table 24):
a) There was a significant difference in farmers' perception in
relation to the levels of difficulty for marketing crop
production in District 1 and in District 2. i
b) There was not a significant difference in farmers' perception
in relation to the levels of difficulty for marketing crop
production between District 1 and District 2, at the 0.05 level
of confidence.
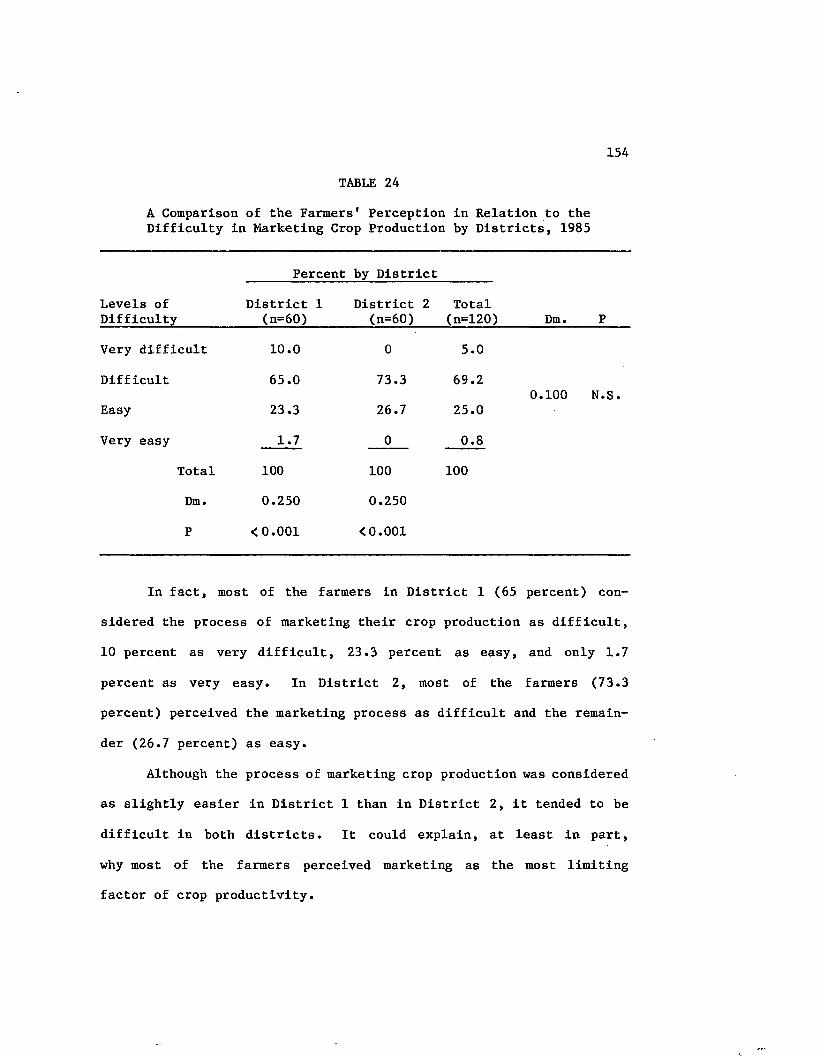
154
TABLE 24
A Comparison of the Farmers' Perception in Relation to theDifficulty in Marketing Crop Production by Districts, 1985
_____ Percent by District______
Levels of District 1 District 2 TotalDifficulty___________ (n=60)________(n=60) (n=120)_____ Dm. P
Very difficult 10.0 0 5.0
Difficult 65.0 73.3 69.2
Easy 23.3 26.7 25.0
Very easy 1.7 0 0.8
Total 100 100 100
Dm. 0.250 0.250
P <0.001 <0.001
In fact, most of the farmers in District 1 (65 percent) con
sidered the process of marketing their crop production as difficult,
10 percent as very difficult, 23.3 percent as easy, and only 1.7
percent as very easy. In District 2, most of the farmers (73.3
percent) perceived the marketing process as difficult and the remain
der (26.7 percent) as easy.
Although the process of marketing crop production was considered
as slightly easier in District 1 than in District 2, it tended to be
difficult in both districts. It could explain, at least in part,
why most of the farmers perceived marketing as the most limiting
factor of crop productivity.
155
Sale Price of Crop Production
Question No. 25 was used to obtain the opinion of the respon
dents in relation to the prices they received for their crop produc
tion.
The statistical analysis showed that there was not a signi
ficant difference in farmers' perception between District 1 and
District 2 in relation to the conditions of the sale price for the
crop products at the 0.05 level of confidence (Table 25).
The data indicated that most of the respondents, 68.3 percent
in District 1 and 61.7 in District 2, perceived prices as unfavo
rable. It was also observed that 15 percent of the farmers in
District 1 and 38.3 percent in District 2 considered the sale
prices as just. In District 1, only five percent of the farmers
pointed out favorable prices and 11.7 percent unfavorable sale
prices.
Although the sale conditions seemed to be perceived slightly
more just in District 2 than in District 1, the perception of
sale prices of crop production tended to be unfavorable in both
districts.
These results could also explain, at least in part, why
marketing was considered by the farmers as the principal limitation
for better crop productivity.
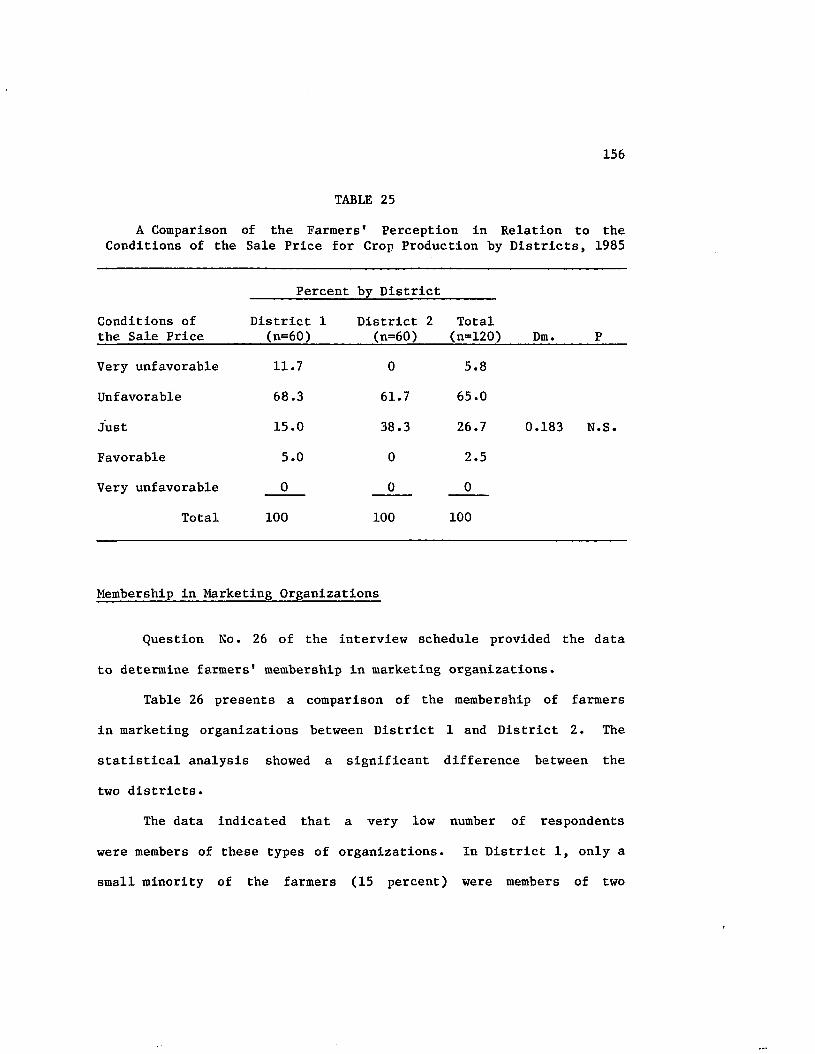
156
TABLE 25
A Comparison of the Farmers' Perception in Relation to theConditions of the Sale Price for Crop Production by Districts, 1985
Percent by District
Conditions of the Sale Price
District 1 (n=60)
District 2 (n=60)
Total(n=120) Dm. P
Very unfavorable 11.7 0 5.8
Unfavorable 68.3 61.7 65.0
Just 15.0 38.3 26.7 0.183 N.S.
Favorable 5.0 0 2.5
Very unfavorable 0 0 0
Total 100 100 100
Membership in Marketing Organizations
Question No. 26 of the interview schedule provided the data
to determine farmers' membership in marketing organizations.
Table 26 presents a comparison of the membership of farmers
in marketing organizations between District 1 and District 2. The
statistical analysis showed a significant difference between the
two districts.
The data indicated that a very low number of respondents
were members of these types of organizations. In District 1, only a
small minority of the farmers (15 percent) were members of two

157
TABLE 26
A Comparison of Farmers' Membership in MarketingOrganizations by Districts, 1985
Membership
Percent by District
District 1 District 2 (n=60) (n=60)
Total(n=120) x2ldf. p
No 85.0 96.7 90.83.606 0.058
Yes 15.0 3.3 9.2
Total 100 100 100
pre-cooperative groups organized by the DRI program. In this ins-
tance, farmers felt they were receiving fairer prices for their
products. In District 2, the situation was more critical since
only 3.3 percent of the farmers were members of private marketing
organizations. Nevertheless, they did not sell their products to
those organizations.
The majority of the farmers were selling their production
to intermediaries under perceived unfavorable conditions of sale
prices.
It can be determined that the majority of the farmers covered
by the DRI program were not organized for marketing their crop
production. They lacked sufficient appropriate marketing organiza
tions .
158
Marketing Channels
Question No. 27 of the interview schedule provided the data
to determine where the farmers sold their crop production.
Table 27 presents a comparison of the channels used by the
farmers for marketing their crop production. The statistical
analysis was not applied because of inadequacies in some cell
frequencies.
The data showed that the majority of the farmers, 81.7 per
cent in District 1 and 100 percent in District 2, sold their crop
production to intermediaries. Only 18.3 percent of the farmers
in District 1 used a marketing organization for selling their
products.
It can be determined that the intermediaries were the
principal channel through which farmers marketed their farm pro
duction. It could indicate that the farmers covered by the DRI
program, and affected by this unfavorable situation, were restraining
their possibilities for improving farm incomes since the sale prices
they received from the intermediaries were not the best.
These results could also support, at least in part, why
marketing was considered by the farmers as the principal limitation
for better crop productivity.
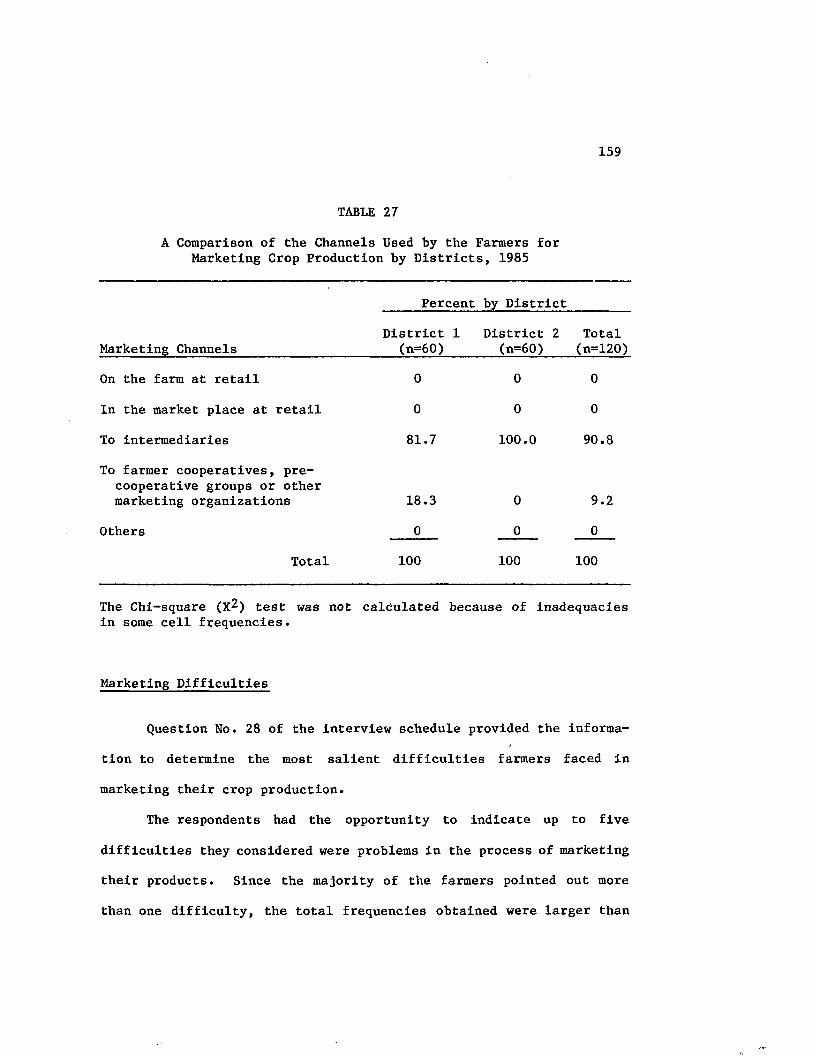
159
TABLE 27
A Comparison of the Channels Used by the Farmers for Marketing Crop Production by Districts, 1985
Percent by District
Marketing ChannelsDistrict 1
(n=60)District 2
(n=60)Total(n=120)
On the farm at retail 0 0 0
In the market place at retail 0 0 0
To intermediaries 81.7 100.0 90.8
To farmer cooperatives, precooperative groups or other marketing organizations 18.3 0 9.2
Others 0 0 0
Total 100 100 100
The Chi-square (X^) test was not calculated because of inadequacies in some cell frequencies.
Marketing Difficulties
Question No. 28 of the interview schedule provided the informa-f
tion to determine the most salient difficulties farmers faced in
marketing their crop production.
The respondents had the opportunity to indicate up to five
difficulties they considered were problems in the process of marketing
their products. Since the majority of the farmers pointed out more
than one difficulty, the total frequencies obtained were larger than
160
the total number of respondents in each district. They were 145 in
District 1 and 218 in District 2.
Table 28 presents the results obtained in relation to the
identification of the most salient difficulties faced by the farmers
in the process of marketing their crop products. The difficulties
are listed following a descending frequency order.
The most frequent difficulty mentioned by 25.1 percent of the
total sample was that the intermediaries were the only buyers of
crop production. A little higher proportion was observed in District
1, where 25.5 percent of the farmers mentioned this difficulty as
compared with 24.8 percent of the farmers in District 2.
Unfavorable sale prices offered for crop products was the next
difficulty considered by 23.2 percent of the total sample. A much
higher proportion was observed in District 1, where 32.4 percent of
the farmers mentioned this difficulty, as compared with 17 percent
of the farmers in District 2. These results are consistent with
the findings obtained in Table 25, where it was found that 38.3 percent
of the farmers in District 2 felt they received just prices for
their crop production, compared with 15 percent of the farmers in
District 1.
Those two difficulties seem to be closely related since it
has been demonstrated that, in most of the cases, the intermediaries
have been considered as the worst marketing channels because of
unfavorable price conditions they offer to the farmers for their
crop production.
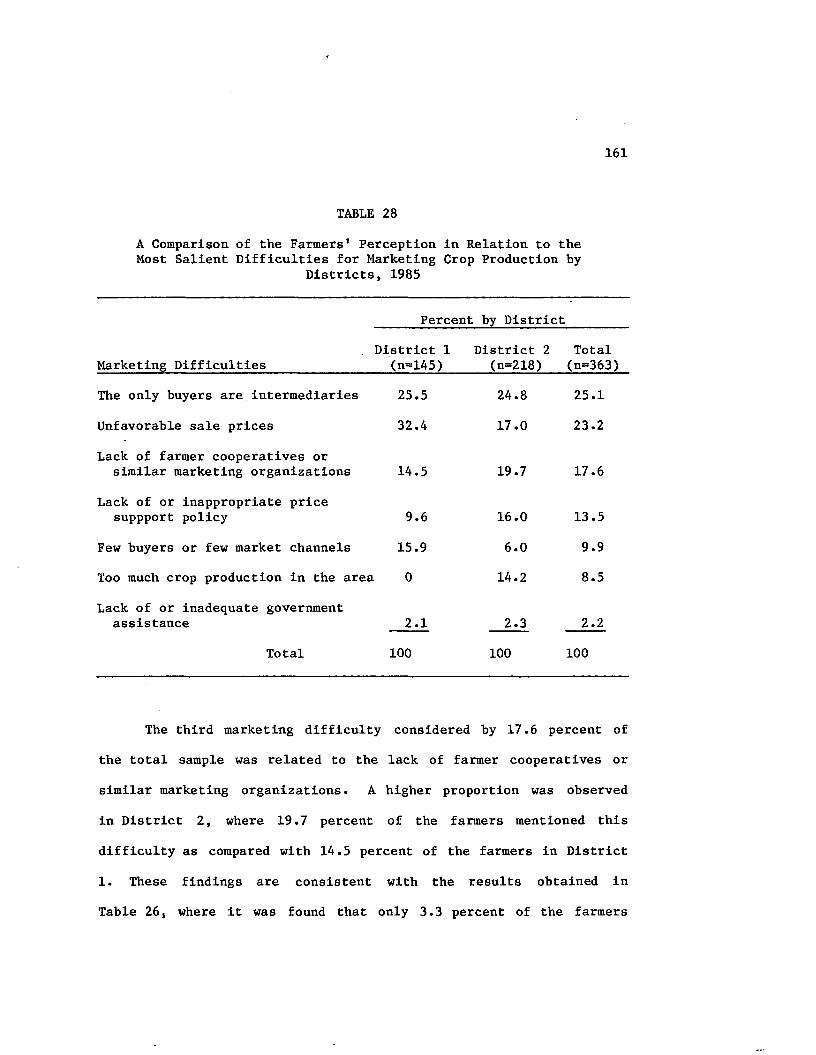
161
TABLE 28
A Comparison o f th e Farm ers ' P e rcep tio n in R e la tio n to th e Most S a lie n t D i f f i c u l t i e s fo r M arketing Crop P roduction by
D i s t r i c t s , 1985
P ercen t by D is t r i c t
D i s t r i c t 1 D is t r i c t 2 T o ta lM arketing D i f f i c u l t i e s (n=145) (n=218) (n=363)
The on ly buyers a re in te rm e d ia r ie s 25.5 24.8 25.1
U nfavorable s a le p r ic e s 32.4 17.0 23.2
Lack o f farm er c o o p e ra tiv e s or s im ila r m arketing o rg a n iz a tio n s 14.5 19.7 17.6
Lack o f o r in a p p ro p r ia te p r ic e suppport p o lic y 9.6 16.0 13.5
Few buyers o r few m arket channels 15.9 6.0 9.9
Too much crop p ro d u c tio n in th e a re a 0 14.2 8.5
Lack o f o r inadequate government a s s is ta n c e 2.1 2.3 2.2
T o ta l 100 100 100
The th i r d m arketing d i f f i c u l ty considered by 17.6 p e rc e n t of
the total sample was related to the lack of farmer cooperatives or
similar marketing organizations. A higher proportion was observed
in District 2, where 19.7 percent of the farmers mentioned this
difficulty as compared with 14.5 percent of the farmers in District
1. These findings are consistent with the results obtained in
Table 26, where it was found that only 3.3 percent of the farmers

162
in District 2 were members of any marketing organization compared
with 15 percent of the farmers in District 1.
The lack of or inappropriate price support policy was another
marketing limitation considered by 13.5 percent of the total sample.
A higher proportion was observed in District 2, where 16 percent of
the farmers mentioned this difficulty as compared with 9.6 percent
of the farmers in District 1. It seems that the government price
support policies did not benefit small farmers as they did with
large farmers. In fact, prices for small volumes of crop production
are imposed by the chain of intermediaries, and according to the
supply and demand of the product. On the other hand, there are
not appropriate price support policies appropriate for perishable
products. In this instance, the situation was more critical in
District 2, where the crops grown were green peas and green beans,
as compared with District 1, where the crops grown were sorghum,
sesame, and corn.
The amount of crop production in the area as a marketing
difficulty was considered only in District 2 by 14.2 percent of
the farmers. In fact, green peas and green beans are harvested
by the farmers generally three times in a year, almost at the same
time. These perishable products can not be stored for any length of
time. Crop production has to be sold as quickly as possible. As
the volumes of crop production increase, the amount offered increases
and the sale price decreases.
163
Few buyers or few market channels were considered as another
marketing difficulty by 9.9 percent of the total sample. A higher
proportion was observed in District 1, where 15.9 percent of the
farmers mentioned this difficulty as compared with six percent of
the farmers in District 2. It is not easy to determine the real
reason for this tendency. Nevertheless, the farmers' perception in
relation to this difficulty seemed to be related to the first one
listed when the respondents considered the intermediaries as the
only buyers of the crop production.
Finally, the lack of or inadequate government assistance was
also considered as a difficulty in marketing crop production by 2.1
percent of the respondents in District 1 and by 2.3 percent in
District 2. It seemed that this claim was related by the farmers
to an inadequate marketing policy of the DRI program which had not
benefited them.
The lack of or inappropriate transportation facilities, and
the lack of or inappropriate storage facilities were not considered
by the farmers in any of the two districts as marketing difficulties.
In fact, the intermediaries or the pre-cooperative groups picked up
most of the crop products directly from the farms as soon as they
were harvested and packed up.

164
Satisfaction in Relation to the DRI Marketing Program
Information provided by the respondents through question
No. 29 of the interview schedule was used to determine the farmers'
levels of satisfaction in relation to the DRI marketing program.
The statistical analysis showed that there was not a signifi
cant difference between the two districts in relation to the levels
of satisfaction (Table 29), at the 0.05 level of confidence.
TABLE 29
A Comparison of the Farmers' Levels of Satisfaction in Relation to the DRI Marketing Program by Districts, 1985
Percent by District
Levels of Satisfaction
District 1 (n=60)
District 2 (n=60)
Total(n=120) Dm. P
Not satisfied 75.0 96.7 85.8
Fairly satisfied 25.0 3.3 14.2 0.217 N.S.
Satisfied 0 0 0
Total 100 100 100
In fact, the tendency of the levels of satisfaction was similar
since most of the respondents, 75 percent in District 1 and 96.7
percent in District 2, were not satisfied with the DRI marketing
program. Only 25 percent of the farmers in District 1 and 3.3
percent in District 2 were fairly satisfied with this program.
165
The results are consistent with the perception of the farmers
in relation to other characteristics of the marketing process, such
as the levels of difficulty for marketing their crop production,
the conditions of sale prices for crop production, the availability of
farmers' marketing organizations, and the marketing channels available
to sell the crop production.
The majority of the farmers claimed that they did not have an
appropriate marketing program to help them sell their crop production
under more favorable conditions. Some of the farmers who were
fairly satisfied were those who made use of the facilities offered
by the pre-cooperative groups in District 1.
It can be determined that the DRI marketing program had not
met the expectations and needs of the farmers in relation to an
appropriate marketing policy which facilitates the marketing of
crop products under more favorable conditions.
Relationships Between Variables
Data used to determine the relationships or degrees of asso
ciation between dependent and independent variables are presented
in Appendix B.
The independent variables transfer of technology (extension),
in terms of effectiveness in transferring technology; credit, in
terms of difficulty in obtaining credit; and marketing, in terns of
difficulty in marketing crop production, were related to the dependent
166
variables adoption of technology, in terms of levels of adoption of
recommended cultural practices, and crop production, in terms of
changes in crop yields. The variable, adoption of technology, was
considered as an independent variable when it was related to the
dependent variable crop production. Seven hypotheses of association
between variables were stated.
The Goodman and Kruskal Coefficient "gamma" (G) was used as a
measure of correlation to determine the degree of association
between the independent and the dependent variables. The gamma
values vary between -1, indicating a perfect negative relationship
or association, and +1, indicating a perfect positive relationship
or association. A value of 0 indicates no association; i.e., the
variables may be independent of each other (8, p. 412).
Table 30 shows the sizes of the samples (n), the gamma (G)
values, and the levels of probability (P) used to determine
statistically significant differences of the variables that were
measured. Those farmers who did not use any of the selected crop
practices recommended by the DRI program (non adoption category)
were not included in determining changes in crop production (lower,
similar, higher), since it was not possible to make a comparison
between the crop yields "before" and "after" adoption of the
recommended cultural practices. Only one farmer in District 1 and
two farmers in District 2 were included in the non adoption category.
The missing values in the set of data in Table 30 correspond to
these farmers.
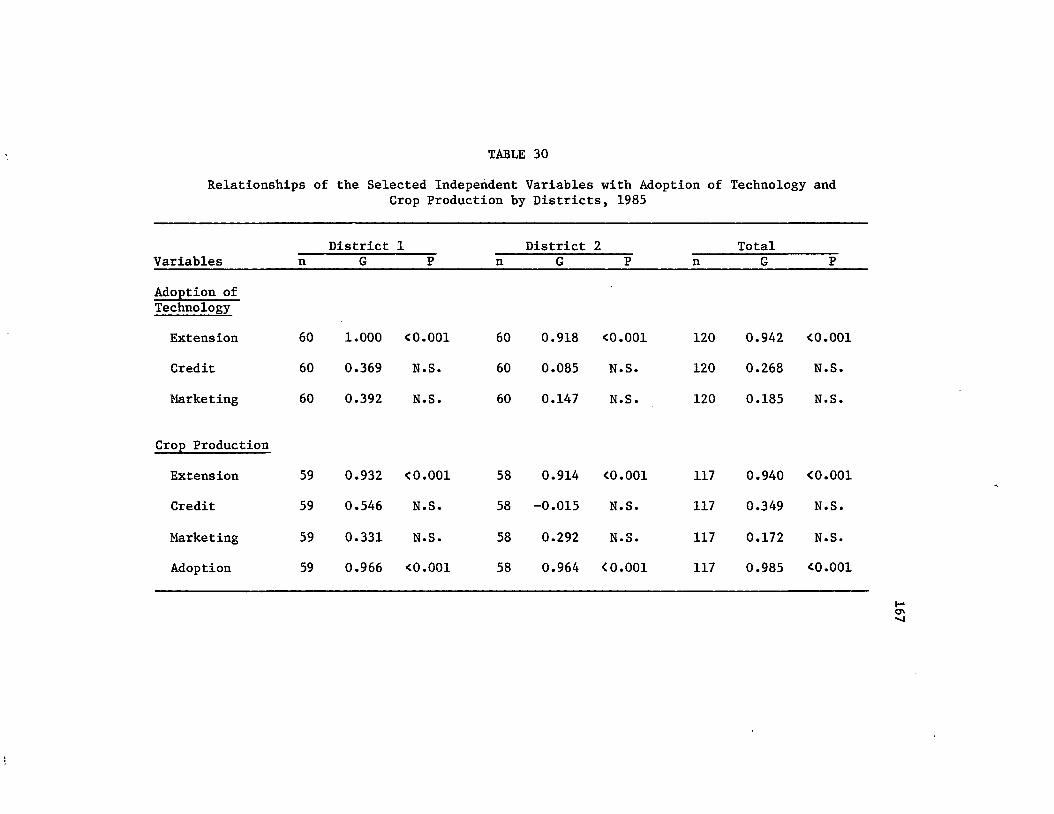
TABLE 30
Relationships of the Selected Independent Variables with Adoption of Technology andCrop Production by Districts, 1985
District 1 District 2 TotalVariables n G P n G P n G P
Adoption of Technology
Extension 60 1.000 <0.001 60 0.918 <0.001 120 0.942 <0.001
Credit 60 0.369 N.S. 60 0.085 N.S. 120 0.268 N.S.
Marketing 60 0.392 N.S. 60 0.147 N.S. 120 0.185 N.S.
Crop Production
Extension 59 0.932 <0.001 58 0.914 <0.001 117 0.940 <0.001
Credit 59 0.546 N.S. 58 -0.015 N.S. 117 0.349 N.S.
Marketing 59 0.331 N.S. 58 0.292 N.S. 117 0.172 N.S.
Adoption 59 0.966 <0.001 58 0.964 <0.001 117 0.985 <0.001
167
168
The following are the results of the tests performed in
relation to each one of the stated hypothesis:
Hypothesis 1 "There is not an association between adoption of agricultural technology and effectiveness in transferring technology."
As it can be observed from Table 30 the gamma values obtained
were 1.000; 0.918; and 0.942 for District 1, District 2, and the
total sample, respectively. These values indicated a strong positive
association between the two variables.
In fact, it can be seen from the data in Table 1, Appendix B,
that the levels of adoption tended to be higher as the extent of
effectiveness in transferring technology tended to be more effective.
The few farmers who did not adopt (1.7 percent in District 1;
10 percent in District 2; and 5.8 percent in the total sample)
were those who provided the information that said that the transfer
of technology was not effective. The majority of the farmers who
reported low levels of adoption (21.6 percent in District 1; 45
percent in District 2; and 33.3 percent in the total sample) were
those who felt that the information received in the transfer of
technology process was slightly effective. Most of the farmers who
obtained fair and high levels of adoption (76.7 in District 1; 45
percent in District 2; and 60.9 in the total sample) were those who
felt that the information provided in the transfer of technology
process was effective or fairly effective.
169
The test of significance indicated that the relationships
observed were statistically significant (Table 30), so the null
hypothesis is rejected. The gamma values were not likely to have
occurred only by chance. It is concluded, therefore, that there was
a significant association between adoption of agricultural technology
and effectiveness in transferring technology.
Hypothesis 2. "There is not an association between adoptionof agricultural technology and difficulty in obtaining credit."
As it can be observed from Table 30, the gamma values obtained
were 0.369; 0.085; and 0.268 for District 1, District 2, and the
total sample, respectively. These values indicated low positive
but not significant associations between the two variables in
District 1 and in the total sample, and a highly insignificant
association in District 2.
From the data in Table 2, Appendix B, it can be seen that
the respondents who obtained fair and high levels of adoption
(76.7 percent in District 1; 45 percent in District 2; and 60.9
percent in the total sample) tended to consider as simple the process
of obtaining DRI credit. Only 10 percent of the farmers in District 1
and five percent in the total sample, under this situation, considered
this process as very simple. Similarly, most of the farmers who
obtained low levels of adoption or who did not adopt tended to
perceive as simple the process of obtaining credit. Only 1.7 percent
of the farmers in District 2 and 0.8 percent in the total sample,
170
under this situation, considered as difficult the process of obtaining
credit. In other words, the majority of the respondents (80 percent
in District 1; 83.3 percent in District 2; and 81.7 percent in the
total sample) considered as simple the process of obtaining credit,
but only 11.7 percent of the farmers in District 1; 10 percent in
District 2; and 10.8 percent in the total sample adopted all of the
selected recommended cultural practices.
The test of significance indicated that the tendencies ob
served were not statistically significant (Table 30) for the purposes
of this study, so the null hypothesis is accepted. It is concluded,
therefore, that there was not a significant association between
adoption of agricultural technology and difficulty in obtaining
credit.
The findings indicated that only 14.2 percent of the total
sample adopted all of the recommended cultural practices, that
80 percent adopted partially those new technologies, and that 5.8
percent did not adopt any recommendation. The findings also indicated
that DRI credit was not difficult to obtain, and that the majority
of the farmers (99.2 percent) (Table 15) were provided with financial
resources by the DRI program for growing their crops. It can be
inferred that credit was not necessarily a determinant factor to
facilitate or to encourage adoption of technology. It could be also
inferred that not all the financial resources were invested by the
farmers in the growing of their crops.
171
Hypothesis 3. "There is not an association between adoption of agricultural technology and difficulty in marketing crop production."
As it can be observed from Table 30, the gamma values obtained
were 0.392; 0.147; and 0.185 for District 1, District 2, and the total
sample, respectively. These values indicated a low positive, but
insignificant association between the two variables.
From the data in Table 3, Appendix B, it can be seen that
more than half of the respondents (55 percent in District 1; 53.3
in District 2; and 54.2 in the total sample) considered the process
of marketing crop production as difficult and presented low or fair
levels of adoption. The farmers who did not adopt technology (1.7
percent in District 1; 10 percent in District 2, and 5.8 percent in
the total sample) also considered the marketing process as difficult.
Only 6.7 percent of the farmers in District 1; 1.7 percent in
District 2; and 4.1 percent in the total sample, perceived this
process as easy or very easy and presented high levels of adoption
of technology.
The test of significance indicated that the relationships
observed were not statistically significant (Table 30) for the pur
poses of this study, so the null hypothesis is accepted. The low
associations observed in the data could be merely due to sampling
error. It is concluded that there was not a significant association
between adoption of agricultural technology and difficulty in
marketing crop production.
172
The findings indicated that 74.2 percent of the total sample
had difficulties in marketing crop production and that 25.8 percent
did not. The results show also that 39.1 percent of the farmers
had low levels of adoption or that they did not adopt any recommended
cultural practices, and that 60.9 percent had fair to high levels of
adoption. It can be inferred that the difficulty in marketing crop
production was not necessarily a determinant factor impeding many
farmers to' adopt technology. Nevertheless, this factor could be
affecting, at least in part, the adoption process. It could indi
cate the presence of other factors or variables limiting the adoption
of agricultural technology.
Hypothesis 4. "There is not an association between increasein crop yields and effectiveness in transferring technology."
As it can be observed from Table 30, the gamma values obtained
were 0.932; 0.914; and 0.940 for District 1, District 2, and the
total sample, respectively. These values indicated a strong positive
association between the two variables.
In fact, it can be seen from the data in Table 4, Appendix B,
that the proportion of the farmers increases as the levels of crop
yields become higher and the extent of effectiveness in transferring
technology also become more effective.
The few farmers who had a lower level of crop yield (zero
percent in District 1; 10.3 percent in District 2; and 5.1 percent
in the total sample) were those who provided the information
173
considering that the transfer of technology was not effective or
slightly effective. The farmers who obtained a similar level of crop
yield (22 percent in District 1; 46.6 percent in District 2; and 34.2
percent in the total sample) provided different information in rela
tion to the effectiveness of the transfer of technology, ranging
from not effective to very effective. Finally, 78 percent of the
farmers in District 1; 43.1 percent in District 2; and 60.7 percent
in the total sample, obtained a higher level of crop yield. The
majority of these farmers provided information considering the
transfer of technology as fairly effective or effective. Only 1.7
percent of the farmers in District 1; 5.2 percent in District 2;
and 3.4 percent in the total sample, with a higher level of crop
yield, provided information considering the transfer of technology
as slightly effective.
The test of significance indicated that the differences
observed were statistically significant (Table 30), so the null
hypothesis is rejected. The gamma values are not likely to have
occurred by chance. It is concluded, therefore, that there was a
significant association between increase in crop yields and effective
ness in transferring technology.
Hypothesis 5. "There is not an association between increasein crop yields and difficulty in obtaining credit."
As it can be observed from Table 30, the gamma values obtained
were 0.546; -0.015; and 0.349 for District 1, District 2, and
174
the total sample, respectively. These values indicated a moderate
positive but insignificant association between the two variables in
District 1, a low positive but insignificant association in the
total sample, and an insignificant negative association in District 2.
From the data in Table 5, Appendix B, it can be seen that 79.6
percent of the farmers in District 1; 75.9 percent in District 2;
and 77.8 percent in the total sample, considered credit as simple to
obtain and had a similar or a higher level of crop yield. Only 8.6
percent of the farmers in District 2 and 4.3 percent in the total
sample considered credit as simple to obtain and had a lower level
of crop yield. The data from District 1 and from the total sample
seemed to indicate that there was a tendency of crop yields to be
higher when the farmers considered as simple the process of obtaining
credit, while in District 2 the crop yields tended to be similar or
higher when the process of obtaining a credit was also considered
as simple.
The test of significance indicated that the tendencies ob
served were not statistically significant (Table 30) for the
purposes of this study, so the null hypothesis is accepted. The
low and insignificant associations observed in the data could be
merely due to sampling error. It is concluded that there was not
a significant association between increase in crop yields and
difficulty in obtaining credit.
175
Hypothesis 6 "There is not an association between increasein crop yields and difficulty in marketing crop production."
As it can be observed from Table 30, the gamma values obtained
were 0.331; 0.292; and 0.172 for District 1, District 2, and the
total sample, respectively. These values indicated a low positive
but insignificant association between the two variables.
From the data in Table 6, Appendix B, it can be seen that a
high proportion of the respondents (64.4 percent in District 1;
72.4 percent in District 2; and 68.4 percent in the total sample)
corresponded to those farmers who considered the process of mar
keting crop production as difficult. The majority of those farmers
had similar or higher levels of crop yield. Only 10.3 percent of
the farmers in District 2 and 5.1 percent in the total sample obtained
a lower level of crop yield. On the other hand, the majority of
the farmers (100 percent in District 1; 89.7 percent in District 2;
and 94.9 percent in the total sample) reported similar or higher
levels of crop yields. Due to the large proportion of farmers
considering the marketing process as difficult and the large
proportion of farmers in the higher level of crop yields, the data
seemed to indicate that in District 1 and in the total sample the
level of crop yield tended to be higher when the marketing process
was difficult, while in District 2 the level of crop yield tended to
be similar when the marketing process was difficult.
The test of significance indicated that the tendencies ob
served were not statistically significant (Table 30) for the purposes
176
of this study, so the null hypothesis is accepted. The low association
observed in the data could be merely due to sampling error. It is
concluded that there was not a significant association between
increase in crop yields and difficulty in marketing crop production.
Hypothesis 7. "There is not an association between increase incrop yields and adoption of agricultural technology."
As it can be observed from Table 30, the gamma values obtainedI
were 0.966; 0.964; and 0.985 for District 1, District 2, and the
total sample, respectively. These values indicated a strong positive
association between the two variables.
In fact, it can be seen from the data in Table 7, Appendix B,
that the levels of crop yield tended to be higher as the levels of
adoption tended also to be higher.
The few farmers who obtained a lower level of crop yield
(zero percent in District 1; 10.3 percent in District 2; and 5.1
percent in the total sample) were non adopters or presented low levels
of adoption. The farmers who obtained a similar level of crop yield
(22 percent in District 1; 46.6 percent in District 2; and 34.2
percent in the total sample) tended to have low levels of adoption,
while the farmers who obtained a higher level of crop yield (78
percent in District 1; 43.1 percent in District 2; and 60.7 percent
in the total sample) tended to have fair to high levels of adoption.
The test of significance indicated that the tendencies observed
were statistically significant (Table 30), so the null hypothesis
177
is rejected. The gamma values were not likely to have occurred only
by chance. It is concluded, therefore, that there was a significant
association between increase in crop yields and adoption of agri
cultural technology.
In conclusion, no statistically significant associations were
found between the independent variables credit and marketing and each
one of the dependent variables adoption of technology and crop pro
duction.
A strong positive association was found between the independent
variable transfer of technology (extension) and each one of the
dependent variables adoption of technology and crop production. From
the findings it can also be inferred a significant positive associa
tion between adoption of technology and crop production.
CHAPTER VSUMMARY, CONCLUSIONS, AND RECOMMENDATIONS
Summary
The development of the traditional rural sector in Colombia has
been slow due to its many technological, economic, and social prob
lems . Most of this sector is characterized by low agricultural
production and productivity, due principally to its limitations in
relation to availability of and access to appropriate farm tech
nology, availability of sufficient financial resources, and availa
bility of adequate marketing systems and facilities.
As a strategy for accelerating the development of the rural
sector, the government established the Integrated Rural Development
Program - DRI - In 1975. Its purpose is oriented to improve the
economic and social conditions of the rural population.
The DRI program includes the agricultural production component
which is aimed at improvement of the economic situation of rural
families by increasing farm income through increased agricultural
production and productivity.
Agricultural production and productivity can improve when the
different factors of the agricultural production component (research,
extension, credit, and marketing) are available for efficient
178
179
application by the farmers on their farms. Nevertheless, this
condition is not always present in DRI areas. The availability of
appropriate technology, the effectiveness in transferring this
technology, the availability of sufficient financial resources, the
availability of adequate marketing systems and facilities, the
farmers' interest and motivation to adopt technology, etc., are not
always the same, varying from one DRI district to another. In this
case, agricultural productivity could be limited to the extent in
which these factors are lacking.
Purposes and Objectives of the Study
The general purposes of this study were:
1. To determine the extent to which selected factors were
limiting crop productivity in areas of integrated rural development
as perceived by farmers, and to identify relevant characteristics of
some of these factors.
2. To determine the extent to which these selected factors
were associated with the adoption of agricultural technology and with
the increase of crop yields.
3. To determine the levels of farmers' satisfaction as related
to the selected crop productivity limiting factors.
The specific objectives of this study were:
1. To determine the extent to which research, extension,
credit, marketing, farmland, and other factors were limiting crop
180
productivity at the farm level in areas of integrated rural develop
ment as perceived by farmers.
2. To determine the extent to which the DRI program was
effectively transferring agricultural technology in areas of inte
grated rural development.
3. To determine the extent to which farmers had adopted recom
mended crop production practices, and to determine some of the
reasons why farmers had not adopted new technology in areas of
integrated rural development.
4. To determine changes in crop production in areas of inte
grated rural development.
5. To determine some relevant characteristics of the DRI
credit program and the DRI marketing program in areas of integrated
rural development as perceived by farmers.
6. To determine the farmers' satisfaction levels in relation
to the DRI technical assistance program, the DRI credit program, and
the DRI marketing program.
7. To determine the extent of association between adoption
of technology and a) effectiveness in transferring technology (tech
nical assistance), b) difficulty in obtaining credit, and c) diffi
culty in marketing crop production.
8. To determine the extent of association between increase
in crop yields and a) effectiveness in transferring technology,
181
b) difficulty in obtaining credit, c) difficulty in marketing crop
production, and d) adoption of technology.
Research Methodology
This study was conducted in two districts where the Integrated
Rural Development program is being carried out, the South Tolima Dis
trict (District 1), the newer one, and the Fusagusagi District (Dis
trict 2), the older one. The principal crops grown and selected in
each district were sesame, sorghum, and corn in District 1 and green
peas and green beans in District 2.
A proportionate stratified random sample was drawn to assure
that the total number of farmers growing the various crops selected
in this study were equally represented in the sample.
Sixty DRI farmers were selected at random for the total
number of clients in each district for a total sample of 120 respon
dents to be interviewed. The sample in District 1 was composed of
30 sesame growers, 18 sorghum growers, and 12 corn growers. The
sample in District 2 was composed of 40 green peas growers and 20
green beans growers.
An interview schedule was used to collect the data. It was
pretested and some adjustments were made to avoid misunderstandings
and to improve the validity of the questionnaire. Questions were
related to the components of the research model and to the objectives
previously stated. Specific questions were used to determine the
182
characteristics of the independent and dependent variables as
perceived by farmers. These variables as used in this study were the
following:
Independent Variables;
- Transfer of technology, in terms of effectiveness in transferring
technology;
- Credit, in terms of difficulty in obtaining credit; and
- Marketing, in terms of difficulty in marketing crop production.
Dependent Variables;
- Adoption of technology, in terms of levels of adoption of
recommended cultural practices; and
- Crop production, in terms of changes in crop yields.
The data obtained through the questions were also used to
determine the extent of association between independent and depen
dent variables, as well as to measure other variables related to the
extent of limitation of crop productivity factors, the characteristics
of the DRI transfer of technology process, some of the reasons why
farmers did not adopt crop recommendations, the characteristics of
the DRI credit program, the characteristics of the DRI marketing
program, the most salient difficulties in marketing crop products,
and the levels of farmers' satisfaction in relation to the DRI
technical assistance program, the DRI credit program, and the DRI
marketing program.
183
After the respondents were interviewed, data were coded and
processed through the facilities of the System Network Computer
Center (SNCC) at Louisiana State University.
The statistical methods applied to analyze the data were the
Chi-Square (X^) goodness-of-fit test, the Chi-Square (X^) test of
independence when the data were measured at a nominal level, the
Kolmogorov-Smirnov (K-S) one-sample and two-sample tests, and the
Goodman and Kruskal "gamma" (G) procedure when the data were
measured at an ordinal level.
The Chi-Square (X^) goodness-of-fit test was used to determine
differences in frequency distribution in relation to the crop pro
ductivity limiting factors in each district.
The Chi-Square (X^) test of independence was used to determine
differences in frequency distributions between District 1 and
District 2 in relation to the following variabales: crop producti
vity limiting factors, means of transferring technology, timeliness
of DRI credit, farmers' membership in marketing organizations, and
marketing channels used.
The Kolmogorov-Smirnov (K-S) one-sample test was used to de
termine differences in frequency distribution in each district in
relation to the following variables: effectiveness in transferring
technology, adoption of technology, levels of crop production,
difficulties in obtaining DRI credit, and difficulty in marketing
crop products.
184
The Kolmogorov-Smirnov (K-S) two-sample test was used to
determine differences in frequency distribution between District 1
and District 2 in relation to the following variables: extent of
limitation of crop productivity factors, effectiveness in trans
ferring technology, adoption of technology, crop production,
difficulty in obtaining DRI credit, sufficiency of DRI credit,
interest rates of DRI credit, terms for repayment of loans, difficultyi
in m arketing crop p ro d u c ts , s a le p r ic e of crop p ro d u c ts , and fa rm e rs '
s a t i s f a c t io n in r e l a t io n to DRI te c h n ic a l a s s is ta n c e , th e DRI c r e d i t
program, and th e DRI m arketing program.
Percentages, frequencies, and averages were used to present and
describe the following variables: length of time of DRI services,
size of the farms and amount of farmland in crops and pasture, land
tenure status, use of recommended cultural practices, reasons for
non adoption of technology, kinds of financial resources, length of
time utilizing DRI credit, major uses of crop production, and
marketing difficulties.
The Goodman and Kruskal Coefficient "gamma" (G) was used to
test the hypothesized associations between the independent and
dependent variables.
The 0.05 level of probability was used to indicate statisti
cally significant differences among categories, variables, or
between districts.
185
F ind ings
The following are the principal findings obtained in this
study:
1. Length of Time of DRI Services. Farmers in District 2 were
exposed for longer periods of time, as expected, to the different
activities of the DRI extension program, compared with the farmers in
District 1.
2. Size of Farms. The average size of farm In District 1 was
nine hectares compared with 4.4 hectares in District 2. It confirms
that one of the characteristics of the two districts was the high
concentration of "minifundia". Nevertheless, this situation was
more critical in District 2 than in District 1.
3. Amount of Farmland Dedicated to Crops and Pasture. The
average amount of farmland per farm dedicated to these activities was
8.3 hectares in District 1 compared with 4.3 hectares in District 2.
The ratio between the average amount of farmland utilized in crops
and pastures and the average size of farm showed that farmers in
District 1 utilized an average of 92.2 percent of their farmland in
agricultural production compared with 97.7 percent in District 2. It
indicates that farmers in District 2 utilized more intensively their
land resource.

186
4. Land Tenure Status. Ownership was the predominant land
tenure status in the two districts (71.7 percent in District 1 and
76.7 percent in District 2), followed by lessees and share-tenants.
It supported one of the policies of the DRI program in the sense that
land tenure status must not be a major constraint in DRI areas.
5. Crop Productivity Limiting Factors in each District. In
District 1, the most frequent limiting factor, as perceived by the
farmers, was marketing (39.8 percent), followed by climatic condi
tions (25.8 percent), farmland (23.4 percent), credit (5.5 percent),
research (3.9 percent), and extension (1.6 percent). These differen
ces were statistically significant (P<0.001).
In District 2 the most frequent limiting factor, as perceived
by the farmers, was also marketing (40.9 percent), but followed by
extension (25.2 percent), research (15.7 percent), climatic condi
tions (15 percent), farmland (1.6 percent), and credit (1.6 percent).
These differences were statistically significant (P <0.001).
A comparison between District 1 and District 2 in relation to
the farmers' perception about the limitation of each one of the
selected factors showed the following:
5.1. Research. Twenty point eight percent of the total sample
reported research as a limiting factor. However, this situation was
less critical in District 1 where only 8.3 percent of the farmers
mentioned this as a limitation compared with District 2 where
187
33.3 percent of the farmers did. This difference was statistical
ly significant (P=0.002).
5.2. Extension. Technical assistance or transfer of tech
nology was reported as a limiting factor by 28.3 percent of the
total sample. There was a marked difference in perception between the
respondents of the two districts in relation to this factor. In
District 1, very few farmers (3.3 percent) considered the lack of
technical assistance or its inadequacy as a limitation for better
crop productivity, while more than half of the farmers (53.3 percent)
in District 2 did. Extension was the less frequent factor mentioned
by the respondents in District 1, while in District 2 it was, after
marketing, the second most frequently mentioned limiting factor. The
difference in relation to this factor between District 1 and District
2 was statistically significant (P=0.001).
5.3. Credit. Only 7.5 percent of the total sample perceived
credit as a limiting factor of crop productivity. It was the less
frequent factor mentioned by the respondents considering the two
districts together. Just 3.3 percent of the farmers in District 2
and 11.6 percent in District 1 perceived credit as a problem to grow
their crops. This difference was not statistically significant at
the 0.05 level of confidence.
5.4. Marketing. This factor was considered by the majority of
the total sample (85.8 percent) as the most critical limitation in crop

188
productivity. Marketing was the most frequently mentioned factor in
each of the two districts. Eighty five percent of the farmers in
District 1 and 86.7 percent in District 2 perceived marketing as the
principal factor limiting better crop productivity on their farms.
This difference was not statistically significant at the 0.05 level
of confidence.
5.5. Farmland. This factor was reported as a limitation by
26.7 percent of the total sample. There was a marked difference in
perception between the respondents of the two districts in relation
to farmland. Fifty percent of the farmers in District 1 and only 3.3
percent in District 2 considered farmland as a limiting factor of
crop productivity. This difference was statistically significant
(P=0.001).
5.6. Climate. This factor was the second most frequent
limiting factor mentioned by the total sample (43.3 percent). The
situation was most critical in District 1 where 55 percent of the
farmers mentioned climatic conditions as a limitation of crop produc
tivity compared with District 2 where 31.7 percent of the farmers
did. This difference was statistically significant (P=0.017).
6. Extent of Limitation. No significant statistical differ
ences in perception were found, at the 0.05 level of confidence,
between District 1 and District 2 in relation to the extent of limi-

189
t a t lo n of each one of th e crop p ro d u c tiv ity l im it in g f a c to r s .
N e v e rth e le ss , th e fo llo w in g ten d en c ies were observed:
6.1 Research. The extent of limitation of this factor seemed
to be slightly lower in District 1 than in District 2. Farmers
affected by research in District 1 assigned only a low extent of
limitation to research, while in District 2, fifty five percent of
the respondents perceived the extent of limitation as low, 40 percent
as fair, and five percent as high. The tendency of the extent of
limitation for this factor was low in District 1 and between low and
fair in District 2.
6.2. Extension. The perceived extent of limitation of exten
sion seemed to be lower in District 1 than in District 2. In
District 1, no one assigned a high extent of limitation to this
factor, while in District 2, about 28 percent of the farmers did.
However, the tendency of the extent of limitation of extension was
between low and fair in the two districts.
6.3 Credit. Hundred percent of the farmers in District 2 and
57.1 percent in District 1 assigned a low extent of limitation to this
factor. The tendency of the extent of limitation of credit was con
sidered as low in District 2 and between low and fair in District 1.
6.4. Marketing. The perceived extent of limitation of mar
keting seemed to be slightly higher in District 2 than in District 1.
The tendency of the extent of limitation varied between low and fair
190
for both districts. However, in comparison with the other limiting
factors, and taking into account the number of farmers affected
particularly by this factor, marketing presented the highest perceived
extent of limitation in the two districts. In fact, 21.6 percent of
the respondents in District 1 and 28.8 percent in District 2 perceived
the extent of limitation of this factor as high.
6.5. Farmland. This factor was considered more critical in
District 1 than in District 2. In fact, 16.7 percent of the farmers
in District 1 perceived the extent of limitation of farmland as high,
33.3 percent as fair, and 50 percent as low. In District 2, the only
two farmers who perceived this factor as a limitation assigned to it
a high extent of limitation. The extent of limitation for this
factor tended to be between low and fair in District 1 and high in
District 2.
6.6. Climate. Only 18.2 percent of the farmers in District 1
and 21.1 percent in District 2 perceived the extent of limitation of
this factor as high. The tendency of the extent of limitation for
climate varied between low and fair for both districts.
7. Generation and Adaptation of Crop Technology. In District
1, fifty percent of the recommended cultural practices (selected for
this study) were generated by research programs, 30 percent by re
search and extension programs, 10 percent by the extension program,
and 10 percent by farmers. All those crop technologies were adapted
191
to local conditions by the extension program. In District 2 both the
generation and adaptation of the selected cultural practices were
carried out by the extension program.
8. Effectiveness in Transferring Technology. Fifty one point
seven percent of the respondents in District 1 considered the transfer
of technology as effective and only 6.7 percent as not effective. In
District 2, forty percent of the farmers perceived the extent of
effectiveness as fairly effective and 8.3 percent as effective. The
tendency of the extent of effectiveness in transferring technology
varied between fairly effective and effective in District 1 (80
percent), while in District 2 it varied between slightly and fairly
effective (71.7 percent).
The differences in extent of effectiveness in District 1 were
statistically significant (P<0.001). The differences in extent of
effectiveness in District 2 were not statistically significant at
the 0.05 level of confidence. The difference in extent of effective
ness between District 1 and District 2 was statistically significant
(PC0.01).
9. Means of Transferring Technology. By far, the most frequent
means of information of cultural practices as perceived by farmers
was the DRI extension agent in both, District 1 (63.3 percent) and
District 2 (66.6 percent), followed by the combination of the DRI
extension agent and a friend or neighbor (28.3 percent in District 1
and 10 percent in District 2). Following in frequency was the
192
combination of the DRI extension agent and written material (6.7
percent in each District). A friend or neighbor as a means of infor
mation accounted for 1.7 percent in District 1 and 3.3 percent in
District 2. In District 2, farmers mentioned other means or combina
tion of means with very low frequencies such as radio and agri
cultural supply and input dealers. The Chi-Square (X^) test was
not calculated because of inadequacies in some cell frequencies.
10. Satisfaction in Relation to DRI Technical Assistance.
Farmers in District 1 tended to be more satisfied with the DRI
technical assistance than did the farmers in District 2. In fact,
78.4 percent of the respondents in District 1 and 31.7 percent in
District 2 reported satisfaction with the DRI technical assistance
program. More than half of the farmers in District 2 (53.3 percent)
were fairly satisfied and 15 percent not satisfied, while in District
1 only 18.3 percent of the farmers were fairly satisfied and just 3.3
percent not satisfied with DRI technical assistance. The differences
between District 1 and District 2 were statistically significant
(P<0.01).
11. Adoption of Technology. The level of adoption of technology
was higher in District 1 than in District 2. Most of the farmers (60
percent) in District 1 had a fair level of adoption of technology,
16.6 percent a high level of adoption, and only 1.7 percent did not
adopt any recommended cultural practice as compared with District 2
where 45 percent of the farmers had low levels of adoption of

193
technology 11.7 percent a high level of adoption, and 10 percent
did not adopt any recommended cultural practice.
The differences in relation to levels of adoption of technology
by farmers in District 1 were statistically significant (P<0.001).
The differences in relation to levels of adoption of technology
by farmers in District 2 were not statistically significant at the
0.05 level of confidence. There was a significant statistical
difference in relation to the levels of adoption of technology by
farmers between District 1 and District 2 (P<0.005).
12. Reasons for non Adoption of Technology. Farmers expressed
that the following reasons, listed in descending frequency order,
did not allow them to use or to adopt the cultural practices recom
mended by the DRI program:
- Higher production costs (16 percent in total sample, 17.8 percent
in District 1, and 14.5 percent in District 2).
- Apprehension in investing more money (risk) (16 percent In total
sample, 17 percent in District 1, and 15.1 percent in District 2).
- Expensive agricultural supplies recommended (14.7 percent in total
sample, 14.1 percent in District 1, and 15.1 percent in District
2).- Unfavorable sale prices (8 percent in total sample, 9.6 percent
in District 1, and 6.6 percent in District 2).
- Inadequate technical assistance (7.3 percent in total sample, 0.7
percent in District 1, and 13.2 percent in District 2).
194
- Difficulty in marketing crop production (6.6 percent in total
sample, 8.9 percent in District 1, and 4.6 percent in District 2).
- Poor quality of the recommended agricultural supplies (6.6 percent
in total sample, 3.7 percent in District 1, and 9.2 percent in
District 2).
- Difficulty in applying some cultural practices (5.2 percent in
total sample, 4.4 percent in District 1, and 5.9 percent in
District 2).
- Difficulty in getting agricultural supplies (4.9 percent in
total sample, 6.7 percent in District 1, and 3.3 percent in
District 2).
- Many intermediaries (4.5 percent in total sample, 6.7 percent in
District 1, and 2.6 percent in District 2).
- Not all the recommended cultural practices are known (3.1 percent
in total sample, zero percent in District 1, and 5.9 percent in
District 2).
- Lack of financial resources (2.1 percent in total sample, 4.4
percent in District 1, and zero percent in District 2).
- Insufficient financial resources (1.8 percent in total sample,
three percent in District 1, and 0.7 percent in District 2).
- Better traditional practices in some cases (1.8 percent in total
sample, zero percent in District 1, and 3.3 percent in Dis
trict 2).
- Lack of own farmland (1.4 percent in total sample, three percent
in District 1, and zero percent in District 2).
195
Some other reasons previously selected such as inappropriate
conditions of credit, inappropriate transportation facilities,
difficulties in storing farm production and agricultural supplies,
and inappropriate conditions of farmland were not considered by any
of the farmers as direct limitations to adopting recommended cultural
practices.
13. Crop Production. Levels of crop production (yield per
hectare) were higher in District 1 than in District 2. Most of the
farmers (76.7 percent) in District 1 obtained higher levels of crop
production per hectare, while only 1.7 percent obtained lower levels.
In District 2, forty five percent of the farmers had similar levels
of; crop production, 41.7 percent higher levels, and 13.3 percent
lower levels of crop production.
The differences in levels of crop production were statistically
significant in District 1 (P<0.001), and in District 2 (P<0.01), as
well as between District 1 and District 2 (P<0.001).
14. Kinds of Financial Resources (Credit). Most of the farmers
(63.3 percent in District 1 and 80 percent in District 2) utilized
only DRI credit for financing their crops. Thirty five percent of
the farmers in District 1 and 20 percent in District 2 utilized
personal resources in addition to DRI credit. Only 1.7 percent of
the farmers in District 1 utilized personal resources for growing the
crops.
196
15. Length of Time Utilizing DRI Credit. Farmers in District 2
benefited by the DRI credit program during a longer period of time
than did the farmers in District 1. Most of the respondents (64.4
percent) in District 1 had been utilizing DRI credit for less than
two years, and only 35.6 percent during two to five years. In
District 2, sixty percent of the farmers had been receiving DRI
credit for more than five years, 26.7 percent during two to five
years, and only 13.3 percent for less than two years.
16. Difficulty in Obtaining DRI Credit. In District 1,
eighty percent of the farmers perceived the process of getting a loan
as simple, 10 percent as very simple, and 10 percent as difficult.
In District 2, most of the farmers (83.3 percent) considered the
level of difficulty as simple, and the remainder (16.7 percent) as
difficult. Although the difficulty was slightly more evident in
District 2 than in District 1, the process of obtaining credit tended
to be simple in the two districts.
The differences in relation to the levels of difficulty in
obtaining DRI credit were statistically significant in District 1
(P<0.001) and in District 2 (P < 0.001), while the difference in
relation to the levels of difficulty in obtaining DRI credit between
District 1 and District 2 was statistically not significant at the
0.05 level of confidence.
197
17. Timeliness of DRI Credit. Most of the respondents (91.5
percent in District 1 and 80 percent in District 2) perceived the
DRI credit as timely. The remaining (8.5 percent in District 1 and
20 percent in District 2) perceived the DRI credit as delayed. These
differences between District 1 and District 2 were not statistically
significant at the 0.05 level of confidence.
18. Adequacy in the Amount of DRI Credit. Most of the
respondents (71.2 percent in District 1 and 73.3 percent in District
2) perceived DRI credit as fairly adequate regarding the amount of
money lent. Only 11.7 percent of the farmers in District 2 and 16.9
percent In District 2 perceived the amount as not adequate, while
11.9 percent of the farmers in District 1 and 15 percent in District
2 considered the amount of credit as adequate to put in practice the
technical recommendations. The differences between District 1 and
District 2 were not statistically significant at the 0.05 level of
confidence.
19. Interest Rates of DRI Credit. Most of the farmers (63.3
percent in District 1 and 60 percent in District 2) considered
credit interest rates as moderate. Only 6.7 percent of the farmers
in each one of the districts pointed out that interest rates were
high. The differences between District 1 and District 2 were not
statistically significant at the 0.05 level of confidence.
198
20. Terms for Repaying Loans. Most of the farmers (85 percent
in District 1 and 76.7 percent in District 2) considered the terms
established for repaying loans as moderate. A very low proportion
of farmers (1.7 percent in District 1 and 6.7 percent in District 2)
pointed out the terms as short. The differences between District 1
and District 2 were not statistically significant at the 0.05 level
of confidence.
21. Satisfaction in Relation to the DRI Credit Program. The
tendencies of the levels of satisfaction were very similar in both
Districts. Most of the respondents (86.6 percent in District 1 and
73.3 percent in District 2) were satisfied with the DRI credit pro
gram. Only 1.7 percent of the farmers in District 1 manifested
dissatisfaction with the program. These differences between Dis
trict 1 and District 2 were not statistically significant at the
0.05 level of confidence.
22. Major Uses of Crop Production. In District 1, seventy per
cent of the farmers marketed all of their crop production, 15 percent
used it for marketing, family consumption, and seed, 13.3 percent for
marketing and seed, and only 1.7 for marketing and family consump
tion. In District 2, fifty five percent of the farmers used their
crop production for marketing and family consumption, 30 percent for
marketing, 11.7 percent for marketing and seed, and only 3.3 percent
for marketing, family consumption, and seed.
199
23. Difficulty In the Marketing Process. Most of the farmers
(65 percent) in District 1 considered the process of marketing
crop production as difficult, 10 percent as very difficult, 23.3
percent as easy, and only 1.7 percent as very easy. In District 2,
most of the farmers (73.3 percent) perceived the marketing process
as difficult and the remainder (26.7 percent) as easy. Although the
process of marketing crop production was considered as slightly
easier in District 1 than in District 2, it tended to be difficult in
both districts.
The differences in relation to the levels of difficulty in the
marketing process were statistically significant in District 1
(P<0.001), and in District 2 (P < 0.001), while the difference in
relation to the levels of difficulty in the marketing process between
District 1 and District 2 was not statistically significant at the
0.05 level of confidence.
24. Sale Price of Crop Production. Most of the respondents
(68.3 percent in District 1 and 61.7 in District 2) perceived prices
received for crop production as unfavorable. Fifteen percent of the
farmers in District 1 and 38.3 percent in District 2 considered the
sale prices as just. In District 1, only five percent of the respon
dents perceived the prices as favorable, while 11.7 percent as very
unfavorable. The differences between District 1 and District 2 were
not statistically significant at the 0.05 level of confidence.
t

200
25. Membership in Marketing Organizations. In District 1, only
a small minority of the farmers (15 percent) were members of two
pre-cooperative groups organized by the DRI program. In District 2,
the situation was more critical since only 3.3 percent of the farmers
were members of private marketing organizations; nevertheless, they
did not sell their products to those organizations. The differences
between District 1 and District 2 were statistically significant
(P=0.058).
26. Marketing Channels. The majority of the farmers (81.7
percent in District 1 and 100 percent in District 2) sold their crop
production to intermediaries. Only 18.3 percent of the farmers in
District 1 used a marketing organization for selling their products.
The Chi-Square (X^) test was not calculated because of inadequacy
in some cell frequencies.
27. Marketing Difficulties. Farmers considered the following
most salient difficulties in marketing their crop production; they
are listed in descending frequency order:
- Only intermediaries as buyers (25.1 percent in total sample, 25.5
percent in District 1, and 24.8 percent in District 2).
- Unfavorable sale prices offered for the crop products (23.2 per
cent in total sample, 32.4 percent in District 1, and 17 percent
in District 2).
- Lack of farmer cooperatives or similar marketing organizations
201
(17.6 percent in total sample, 14.5 percent in District 1, and
19.7 percent in District 2).
- Lack of or inappropriate price support policy (13.5 percent in
total sample, 9.6 percent in District 1, and 16 percent in District
2).- Few buyers or few marketing channels (9.9 percent in total sample,
15.9 percent in District 1, and six percent in District 2).
- Too much crop production in the area (8.5 percent in total sample,
zero percent in District 1, and 14.2 percent in District 2).
- Lack of or inadequate government assistance (2.2 percent in total
sample, 2.1 percent in District 1, and 2.3 percent in District 2).
The lack of or inappropriate transportation facilities, and the
lack of or inappropriate storage facilities were not mentioned by the
farmers in any of the two districts.
28. Satisfaction in Relation to the DRI Marketing Program. The
tendency of the levels of satisfaction was similar in both districts.
Most of the respondents (75 percent in District 1 and 96.7 percent in
District 2) were not satisfied with the DRI marketing program. Only
25 percent of the farmers in District 1 and 3.3 percent in District 2
were fairly satisfied with this program. None of the farmers in
either of the two districts reported satisfaction with the DRI
marketing program. The differences between District 1 and District 2
were not statistically significant at the 0.05 level of confidence.
202
29. Tests of Null Hypotheses of Association
29.1. The null hypothesis 1 was rejected; therefore, there was
a significant association between adoption of agricultural technology
and effectiveness in transferring technology (P < 0.001 for District
1, District 2, and total sample).
29.2. The null hypothesis 2 was accepted; therefore, there was
not a significant association at the 0.05 level of confidence between
adoption of agricultural technology and difficulty in obtaining
credit.
29.3. The null hypothesis 3 was accepted; therefore, there was
not a significant association at the 0.05 level of confidence between
adoption of agricultural technology and difficulty in marketing crop
.production.
29.4. The null hypothesis 4 was rejected; therefore, there was
a significant association between increase in crop yields and effec
tiveness in transferring technology (P< 0.001 for District 1, District
2, and total sample).f
29.5. The null hypothesis 5 was accepted; therefore, there was
not a significant association at the 0.05 level of confidence between
increase in crop yields and difficulty in obtaining credit.
203
29.6. The null hypothesis 6 was accepted; therefore, there
was not a significant association at the 0.05 level of confidence
between increase in crop yields and difficulty in marketing crop
production.
29.7. The null hypothesis 7 was rejected; therefore, there
was a significant association between increase in crop yields and
adoption of agricultural technology (P<0.001 for District 1, District
2, and total sample).
Conclusions
Most of the conclusions in this study are specific for the
circumstances of the DRI districts of South Tolima (District 1) and
Fusagasuga (District 2), and are not necessarily valid for other DRI
districts. Findings show that the performance of certain vari
ables can change from one district to the other.
Using the objectives as a base, the following conclusions are
drawn from this study:
1. Some progress in agricultural production has been evident in
both districts as supported by some improvements in crop production
in terms of increase of yields of crop per hectare. Nevertheless,
the level of agricultural development is not yet at the desired level.
Agricultural development, in terms of efficiency in crop producti
vity, is taking place slowly since it has been affected by certain
204
limiting factors. This situation has been more critical in District
2 than in District 1.
The appropriate conditions to accelerate agricultural develop
ment have not always been present among the different factors of
the DRI agricultural production component. The extent of limitation
of research, extension, credit, marketing, as well as farmland and
climatic conditions varies from one district to another, affecting
adoption of technology and crop production and productivity.
In District 2, improved crop productivity has been limited
because marketing of agricultural production has not been efficient,
technology has not been properly transferred to many farmers, and
because of lack of a more appropriate technology to solve pressing
agronomic problems. In District 1, better crop productivity has also
been limited because marketing systems have not been efficient and
because climatic conditions and the quality of farmland have been
adverse for most of the farmers for the growing of their crops.
An ideal situation to accelerate agricultural development
should be present when appropriate crop technology is generated
and adapted according to local farming conditions, and when it is
properly and effectively transferred to the farmers, supported by
adequate credit facilities and efficient marketing systems, all of
them under an appropriate integrated framework or environment to
encourage its adoption by willing and motivated farmers in order
to improve their crop production and productivity. These conditions
could assure a proper impact on agricultural and rural development.
205
Among the factors included in the DRI agricultural production
component, inappropriate marketing conditions for crop products was
perceived by the farmers as the principal constraint limiting better
crop productivity, and credit facilities were perceived as the least
important limitation of crop productivity in the two districts
totally.
Research as a limiting factor was more critical in District 2
than in District 1. Its extent of limitation was perceived as low in
District 1 and between low and fair in District 2. The marked
difference in farmers' perception in relation to the availability of
appropriate crop technology seemed to be related to the kinds of
agronomic problems faced by the farmers in the two districts. In
District 2, where research was considered as one of the principal
limiting factors of crop productivity, the most pressing technolo
gical problems were those dealing with pests and diseases. Most of
the actual means to prevent and control pests and diseases were too
expensive, the reason why many of the farmers did not adopt or
adopted only partially the recommended crop practices. In addition,
this district was not adequately supported by research programs to
generate apppropriate technology as in the case of District 1 where
extension, research, and farmers were working in a more integrated
environment. This situation could explain, at least in part, why
District 1 has been more successful than District 2 in generating
appropriate technology to overcome farm problems.
206
Extension was considered as a major limitation of crop pro
ductivity in District 2, while in District 1 it was considered as
a less important limiting factor. The marked difference in farmers'
perception in relation to this factor seemed to be consistent with the
quality of technical assistance provided to the farmers by the two
districts. In District 2, where transfer of technology was considered
as slightly or fairly effective by most of the farmers, technical
assistance was sporadic in some cases or it was not provided in
others. On the other hand, the quality of technical assistance
also depended to a large extent on the capabilities of the extension
agents. In District 1, where this factor was not perceived as a
major limitation, the extension personnel had been provided with
more training opportunities. These situations could explain, in
part, why farmers in District 1 adopted more recommended cultural
practices than farmers in District 2.
Credit was not considered by the farmers as a major constraint
of crop productivity. The extent of limitation for this factor was
low in District 2 and between low and fair in District 1. In spite of
the fact that this factor was not significantly related to adoption
of technlogy, and changes in crop yields, the tendency, in both dis
tricts, showed that credit encouraged and promoted the adoption of
technology, especially, when adoption represented higher production
costs, (i.e., use of fertilizers, pesticides, etc.) and when it was
accompanied by other factors such as appropriate profitable tech
nology, low risk, security of marketing, etc.
207
According to the proportion of farmers affected, marketing was
perceived as the principal factor limiting better crop productivity.
Its extent of limitation varied between low and fair in both districts.
In spite of the fact that there were not significant relationships
between marketing and adoption of technology and changes in crop
yields, it is obvious that an appropriate marketing system encourages
farmers to adopt technology, which in turn improves crop productivity
due to larger amounts of agricultural product and more favorable
marketing conditions (i.e., prices).
There was a marked difference in perception in relation to
farmland as a limiting factor of crop productivity. The tendency
of the extent of limitation for this factor was perceived by the
farmers as high in District 2 and between low and fair in District 1.
This difference was consistent with the characteristics of the soils
in both districts. In District 1, where the soils are of poorer
quality than in District 2, this factor was perceived as one of the
principal limitations of crop productivity. However, it seemed that
this situation did not prevent most of the farmers to adopt technology,
but it increased production costs due to higher applications of
fertilizers.
Climate was the second most important limiting factor con
sidered by the farmers in the two districts together, but the situation
was perceived as more critical in District 1 than in District 2.
Its extent of limitation varied between low and fair in both districts.
The marked difference in farmers' perception in relation to this
208
factor seemed to be related to the preponderant climatic conditions
in each district. District 1, where this factor was considered as
one of the principal limitations of crop productivity, and more
critical than in District 2, was characterized by excessive dryness of
the soils due to lack of and inappropriate distribution of rainfall.
This situation is one of the reasons for poor fertility of the lands
in many areas of that district. In District 2, the problem was
related to dampness, which was also affecting somewhat crop producti
vity since its soils were more fertile than in District 1.
2. Transfer of technology was significantly more effective in
District 1 than in District 2. The tendency of the extent of
effectiveness in transferring technology varied between fairly
effective and effective in District 1, and between slightly effective
and fairly effective in District 2.
These tendencies, and the marked difference between the two
districts, seemed to be consistent with the quality of the technical
assistance provided to the farmers. This situation was also reflected
in the levels of adoption and crop yields. In District 1, where the
tranfer of technology was considered as effective by most of the
farmers, the levels of adoption of technology and the increase in
crop yields were higher than in District 2, where the transfer of
technology was perceived as only slightly or fairly effective.
The success or effectiveness in transferring technology do not
depend only on the capabilities of the extension agent but also on

209
many other interrelated factors such as the characteristics of the
recommended cultural practice, the means and channels used to
disseminate information, the motivation of the farmers, the social,
economic, cultural, technological, and environmental conditions of
the farmers, and the setting where transfer it taking place.
The effectiveness in transferring agricultural technology plays
an outstanding role in the adoption process and, therefore, in the
development of the agricultural sector.
3. The levels of adoption of recommended cultural practices tended
to be fair in District 1 and low in District 2. Adoption of agri
cultural technology was significantly higher in District 1, the newer
one, than in District 2, the older one. Therefore, longer periods of
exposure to extension programs did not necessarily represent higher
levels of adoption of technology.
The majority of the farmers were aware of the new technologies
recommended by the DRI program. Nevertheless, some farmers did not
adopt any recommendations or partially adopted only some of them.
Therefore, awareness of new crop technology did not necessarily mean
adoption. There were several reasons that did not allow farmers to
adopt new technologies.
The fo llow ing reaso n s were co n sidered as l im i ta t io n s in adop ting
recommended crop p r a c t ic e s : in c re a se in p ro d u c tio n c o s ts , appre
h ension in in v e s tin g more money ( r i s k and u n c e r ta in ty ) , expensiveness
o f a g r ic u l tu r a l in p u ts and s u p p lie s , u n fav o rab len ess o f crop produc

210
tion sale price, inadequacy of technical assistance, difficulty in
marketing crop production, poor quality of recommended agricultural
inputs and supplies, presence of too many intermediaries in the
marketing process, ignorance of some recommended cultural practices,
inadequacy of financial resources, relative advantage of traditional
practices compared with the new ones, lack of owned farmland or
inappropriate conditions of farmland, and uncertainty due to changes
in weather conditions.
The most frequently perceived reasons that did not allow
farmers to adopt technology were related to economic circumstances.
This perception was not consistent with the DRI credit policy which
facilitated the procurement of the necessary financial resources to
apply recommended cultural practices. Therefore, credit did not
necessarily encourage all the farmers to adopt all the recommen
dations. It means that there were other reasons that intervened
probably. It seemed that risk and uncertainty, derived from the need
of investing more money in growing the crops, were the most powerful
economic reasons limiting adoption of new technology.
Agriculture is an uncertain and continuously risky enterprise.
Since risk and adoption are related, attempts must be made to reduce
risk and increase security to encourage higher levels of adoption of
technology.
211
Reasons related to difficulties in marketing crop production
followed in importance as limitations in adopting new technology.
This perception seemed to be also related to the uncertainty of farmers
in obtaining favorable prices for their crop products which could
compensate for the investment associated with new technology.
Therefore, favorable marketing conditions should be offered to the
farmers to encourage higher levels of adoption of technology.
Following in importance, reasons related to inadequate tech
nical assistance were perceived as limitations in adopting agricul
tural technology. This situation was consistent with the farmers'
perception in relation to the effectiveness in technology transfer.
It supports the hypothesis that effectiveness in transferring
technology is directly related to adoption. Therefore, new tech
nology should be properly transferred to be accepted and adopted
by the farmers.
Other reason for nonadoption was related to the inappropriate
ness of some recommended cultural practices. New agricultural
technologies that were difficult to apply or that had a relative
disadvantage in comparison with the traditional technologies were
not adopted. Since appropriateness of new technology is also
related to adoption, attempts should be made to provide farmers with
technologies that meet their needs and expectations.
Adoption of technology is related to crop production (crop
yields per hectare), but not necessarily to crop productivity (net
profit per hectare). Crop productivity depends on production costs
212
and/or sale price of crop products. Therefore, cost-saving tech
nologies and/or favorable marketing conditions are important pre
requisites to improve crop productivity.
Higher levels of adoption will take place when profitable
and low risk technology, appropriate for the needs and conditions
of the farmers, supported by adequate financial resources and
favorable marketing conditions, is properly transferred to them.
This situation could assure improvements in agricultural productivity.
4. Crop production, in terms of crop yields per hectare, increased
after farmers used the recommended cultural practices. It was
more evident in District 1, where crop production was significantly
higher as compared with District 2. In District 1, the levels of
crop production tended to be higher after using new technology,
while in District 2 they tended to be similar or higher.
Those tendencies were consistent with the extent of effective
ness of the DRI program in transferring technology and with the levels
of adoption of technology determined for each district. Effectiveness
in transferring technology and adoption of technology had a positive
impact on crop production. Therefore, effectiveness in transferring
technology, adoption of technology, and crop production were directly
related, as it was expected.
5.1. Farmers in both districts perceived similarly the characteris
tics of DRI credit. DRI credit was simple to obtain, timely, fairly
adequate in terns of amount of money to apply the recommended
213
cultural practices, with interest ranging betwen low and moderate,
and with moderate terms for repayment. It required technical
assistance from the DRI program, however.
The amount of money to put in practice the technology recom
mended by the DRI program was considered only as fairly adequate
by most of the farmers. Most of them tried to utilize part of the
credit for other expenditures not related directly to their crops.
In this case, the remaining amount of money was not enough to
apply completely the package of recommended cultural practices.
Under the above circumstances, DRI credit can be considered
as very favorable for the farmers and it should encourage the adop
tion of technology.
5.2. Farmers in both districts perceived similarly the characteris
tics of the marketing process. It was considered as difficult and
characterized by relatively large amounts of crop products for sale,
few and inappropriate marketing channels, prevailing large chains
of intermediaries, unfavorable prices offered, unorganized farmers and
lack of appropriate marketing organizations, inadequate price support
policies, and inadequate government assistance.
In te rm e d ia rie s were f e l t to be r e s t r a in in g crop p ro d u c tiv ity
and farm incomes s in c e they m anipulated p r ic e s and m arket mechanisms
to o b ta in b e t te r b e n e f i ts in com parison w ith those perce ived by
sm all fa rm ers . This ch a in must be reduced i f improvements in farm
p ro d u c tiv ity a re to tak e p la c e .
214
6.1. Farmers in District 1 were significantly more satisfied than
farmers in District 2 in relation to DRI technical assistance.
Most of the farmers in District 1 tended to be satisfied, while
most of the farmers in District 2 tended to be only fairly satisfied.
These tendencies were consistent with the tendencies observed in
each district concerning the extent of limitation of extension as
a crop productivity limiting factor, and concerning the extent to
which the DRI program was effectively transferring agricultural
technology.
It can be said that farmers in District 1 met their needs
as far as technical assistance was concerned, while farmers in
District 2 only met their needs partially.
6.2. The majority of the farmers in both districts were satisfied
with the DRI credit program. This situation was consistent with
the farmers' perception in relation to the other characteristics
of DRI credit.
The DRI credit program met the needs of the majority of the
farmers in relation to the provision of financial resources to
encourage 'the adoption of technology. When it did not occur, it
was because of the presence of other more powerful factors which
limited adoption of technology.
6.3 Farmers in both districts tended to be dissatisfied with the
DRI marketing program. This situation was consistent with the

215
farmers' perception in relation to the characteristics of the
marketing process in DRI areas.
The DRI marketing program had not met the needs and expecta
tions of the farmers. There was not an appropriate marketing program,
based on adequate policies, which helped and facilitated farmers to
market their crop products under more favorable conditions.
7.1. Adoption of agricultural technology and effectiveness in
transferring technology presented a high positive association in
both districts; that is, the more effective the tranfer of technology
the higher the level of adoption of technology.
7.2. Adoption of agricultural technology and difficulty in obtaining
credit presented a low positive but not statistically significant
association in District 1, and a highly insignificant association
in District 2.
Credit was not necessarily a determinant to facilitate or to
encourage by itself adoption of technology by some farmers. The
impact of credit in crop productivity depends on the presence or
absence of other factors, at least that was the situation observed
in the two districts.
7.3. Adoption of agricultural technology and difficulty in market
ing crop production presented a low positive but insignificant
association in both districts.
216
The difficulty in marketing crop production was not necessarily
a determining and unique factor that impeded many farmers to adopt
new technology. Nevertheless, this factor could be affecting, in
part, the adoption process. This situation could indicate the
presence of other factors limiting the adoption of agricultural
technology.
7.4. Increase in crop yields (crop production) and effectiveness
in transferring technology presented a high positive association in
both districts; that is, the more effective the transfer of technology
the higher the level of crop yields.
75. Increase in crop yields and difficulty in obtaining credit
presented a moderate positive but insignificant association in
District 1, and an insignificant negative association in District 2.
7.6. Increase in crop yields and difficulty in marketing crop
production presented a low positive but insignificant association
in both districts.
7.7. Increase in crop yield and adoption of agricultural technology
presented a high positive association in both districts; that is,
the higher the level of adoption of technology the higher the level
of crop yields.
217
Recommendations
According to the analysis of data and the conclusions drawn in
this study, the following recommendations are made:
- The findings obtained in this study should be tested in other DRI
areas to determine their validity under differing conditions.
Similar studies should be conducted in other districts.
- More "appropriate" agricultural technology should be developed
to improve crop production and productivity. New technology
should meet the needs and expectations of the farmers, taking
into account their economic, social, and cultural realities, as
well as the environmental conditions of the regions and the farms.
- Appropriate agricultural technology should be generated to solve
the most pressing production problems faced by farmers. Research
should be oriented to 1) develop appropriate crop varieties more
resistant to pests and diseases; more resistant to dampness,
drought, and climatic changes, and less consumption of costly
inputs (i.e., fertilizers, pesticides, etc.); with faster vegeta
tive maturity, and good acceptance in the market and for family con
sumption; 2) find less expensive means to prevent and control
pests, diseases, and weeds; and 3) find better systems to improve
soil conditions at lower costs to increase fertility levels.
Research should be oriented to develop less expensive technologies
in order to decrease production costs and increase profitability,
as well as to reduce risk and uncertainty. Efforts should be
devoted to generate appropriate agricultural technologies that
require more labor and less capital.
New agricultural technologies should be adapted and tested under
local farming conditions and should be proved as efficient in terms
of crop productivity and profitability before any attempt to trans
fer them to farmers is done.
Farmers, extension personnel, and researchers should participate,
coordinately, in designing and implementing programs for generating
agricultural technologies; much more emphasis should be given
in following a faming systems research and extension strategy
to generate appropriate agricultural technologies for small or
traditional farmers.
Government should define a more appropriate policy for agricultural
research for small and traditional farmers and should support
its implementation with more financial resources and more qualified
personnel.
Extension agents should contact farmers more frequently to assist
them more effectively.
The agency in charge of providing the extension services should

replace quickly those extension agents who have to leave their
areas of work. Continuity in providing appropriate technical
assistance should be kept in mind as a condition for success in
transferring technology.
Extension agents should be adequately recruited and selected.
They should like to work with rural people; understand the rural
living, customs, and traditions; have ability to communicate with
farmers; possess technical qualifications, as well as a certain
degree of homophily, etc.
Recommended cultural practices should be adequately transferred
to farmers taking into account their social, economic, technolo
gical, and cultural characteristics. The most appropriate means
(i.e., interpersonal contacts farmer-extension agent) or strategies
of communication should be used to transfer technology.
Government should analyze the possibility to implement a program
(or strategy) for distributing agricultural inputs of good
quality, when they are the basis of technological recommendations,
at lower prices, in appropriate amounts and packaging to encourage
their use among small farmers.
The DRI credit program should revise its policy concerning the
amount of money lent and make pertinent adjustments if it is con
sidered that the credit is, sometimes, insufficient for farmers to
apply all the recommended cultural practices.
220
Supervision of credit should be improved. The DRI program should
pay more attention to assure that the moneys lent to farmers
are invested completely in the growing of the crops. Emphasis
should be given through the education process to encourage
farmers to be responsible for the engagements and obligations
they acquire when they obtain a loan.
The DRI program should devote much more effort to help solve
agricultural marketing problems in DRI areas. Adjustments should
be made in the structure of commercialization for the traditional
rural sector if improvements in crop productivity and agricultural
development are to take place.
Appropriate marketing policies and adequate price incentives
(i.e., stability in prices) should exist for efficient agricultu
ral marketing in DRI areas.
Group action should be the base for improving marketing conditions
in DRI areas. The DRI program should encourage the organization
of the farmers in operationally efficient cooperatives or in
other type or marketing organization to assure some bargaining
power on the market. It should result in provision of larger
quantities of crop products for marketing, more efficient use of
transportation facilities and basic infrastructure, etc., dis
incentive for intermediaries, and more favorable prices for
crop production. Cooperatives or other marketing organizations
221
should also be used to integrate other development activities.
The DRI program should provide appropriate support and supervision
to those formal marketing organizations to assure success, by means
of training in organization, management, etc., provision of asso
ciative credit, development of basic infrastructure, etc.
Provision of improved basic marketing infrastructure should be
implemented within an appropriate structure of commercialization.
The chain of intermediaries should be reduced to improve the
agricultural market structure and to benefit producers and
consumers.
The information system on prices and terminal markets should be
improved in terms of timeliness and greater coverage of farmers.
The DRI program should stimulate the participation of more effi
cient and secure channels of commercialization.
The DRI program should conduct studies to determine the feasi
bility to develop agro-industries in DRI areas to process surplus
of crop production.
The DRI program should revise its policy pertaining land tenure
in DRI areas to determine the feasibility to include this com
ponent in those districts where land tenure status is considered as
a constraint of agricultural and rural development.
222
- The DRI program should devote much more effort, through appropriate
research projects, to develop technologies more appropriate to
improve the quality of the soils, especially in some areas of
District 1. Farmland in use could increase the fertility level and
farmland not in use could be adequated for agricultural purposes.
As it was pointed out agricultural productivity could increase
when the different factors of the agricultural production component
are appropriately available to be used and applied efficiently by
the farmers on their farms. The development process in the traditi
onal rural sector in Colombia is not an easy task, but it could be
possible with a major effort and participation by the government and
the rural people, and with a better coordination and integration
among the agencies involved in the rural sector.
BIBLIOGRAPHY1. Abbot, J. C. "Fertilizer Marketing Components in Rural Devel
opment Projects," Agricultural Administration, 13(1983): 153-163.
2. Abbot, J. C. "Consideration of Alternative Marketing Organizations to Serve Small Tropical Farmers," Agricultural Administration, 9(1982): 285-299.
3. Adams, D. W. and G. I. Nehman. "Borrowing Costs and the Demandof Rural Credit," Journal of Developmental Studies, 15(1979): 165-176.
4. Aquino, F. "Latin America Agriculture in the Next Decade. TheContext of the Inter-American Bank's Activities," in Agricultural Development in Latin America: The NextDecade. Washington D.C.: Inter-American DevelopmentBank, 1967.
5. Arevalo, Manuel and Vicente Alba. "Analisis de la Investiga-ci6n en Comunicaciones Agropecuarias en Colombia," Bole- tin de Investigacion No. 8, ICA. Bogota, Colombia: Instituto Colombiano Agropecuario, 1974.
6. Arnon, I. Modernization of Agriculture in Developing Countries. Resources, Potentials and Problems. New York: John Wiley and Sons, 1981.
7. Aziz, Sartaj. "Rural Development - Some Essential Prerequisites," International Labour Review, 123(1984): 277-285.
8. Bailey, Kenneth. Methods of Social Research. New York: TheFree Press, 1982.
9. Barraclough, S. H. "Responses to the Papers by A. T. Mosherand K. W. Deutsch,” in Behavioral Change in Agriculture, J. P. Leagans and C. P. Loomis (eds.). Ithaca: Cornell University Press, 1971.
10. Besag, Frank P. and Peter L. Besag. Statistics for the HelpingProfessions. Beverly Hills, CA.: Sage Publications,Inc., 1985.
223
224
11. Biggs, Stephen D. "A Farming Systems Approach: Some Unanswered Questions," Agricultural Administration, 18(1985): 1-12.
12. Biggs, Stephen D. "On-farm Research in an Integral Agricultural Technology Development System: Case Study of Triticale for the Himalayan Hills," Agricultural Administration, 7(1980): 135-145.
13. Bohlen, Joe M. and George M. Beal. "Sociological and SocialPsychological Factors Related to Credit Use Patterns," Paper Presented at Annual Conference of TVA Cooperators, Knoxville, Tennessee, 1960.
14. Brown, Lawrence A. Innovation Diffusion. A New Perspective.New York: Methuen & Co., 1981.
15. Bunting, A. H. "Changing Perspectives in Agriculture in Developing Countries: An Agronomist's View,” Journal ofAgricultural Economics, 32(1981): 287-302.
16. Byerlee, Derek; Larry Harrington; and Donald L. Winkelman."Farming Systems Research: Issues in Research Strategyand Technology Design," American Journal of Agricultural Economics, 64(1982): 897-904.
17. Cathie, John. "Agricultural Research and Technology in EconomicDevelopment," Journal of Agricultural Economics, 34(1983): 226-227.
18. Castillo, Gelia T. All in a Grain of Rice. Los Bahos, Philippines: Southeast Asian Regional Center for Graduate Study and Research in Agriculture, 1975.
19. Chambers, Robert. Rural Development: Putting the Last First.London: Longman, 1983.
20. Chambers, Robert and B. P. Ghildyal. "Agricultural Researchfor Resource-Poor Farmers: The Farmer-First-and-LastModel," Agricultural Administration, 20(1985): 1-30.
21. Champion, Dean J. Basic Statistics for Social Research. NewYork: Macmillan Publishing Co., Inc., 1981.
22. Clayton, Eric. "Agricultural Development and Farm IncomeDistribution in LDCs,” Journal of Agricultural Economics, 34(1983): 349-360.
23. Colette, W. Arden and Gail Easley. "Communication and SmallFarm Problems," Rural Development Research and Education, 2(1978): 20-23.
225
24. Colyer, Dale and Guillermo Jimenez. "Supervised Credit as aTool in Agricultural Development," Research Note, American Journal of Agricultural Economics, 53(1971): 639-642.
25. Conover, W. J. Practical Nonparametric Statistics. New York:John Wiley & Sons, 1980.
26. Dams, T. and H. Heyne. "The Role of Marketing in IntegratedRural Development," in Integrated Rural Regional Development, A Workshop Report. Theodor Dams (ed.). Munchen: Kaiser-Grunewald, 1982.
27. Daniel, Wayne W. Applied Nonparametric Statistics. Hopewell,New Jersey: Houghton Mifflin Company, 1978.
28. De Forest, Paul H. "Technology Choice in the Context of SocialValues - A Problem of Definition," in Appropriate Technology and Social Values - A Critical Appraisal. Long A. Franklin and Alexandra Oleson (eds.). Cambridge, Massachusetts: Ballinger Publishing Company, 1980.
29. De Janvry, Alain. "The Role of Land Reform in Economic Development: Policies and Politics," American Journal of Agricultural Economics, 63(1981): 384-392.
30. Departamento Administrative Nacional de Estadistica, (DANE).Colombia Estadistica. Bogota, Colombia: DANE, 1982.
31. Departamento Nacional de Planeacion, (DNP)• Plan de DesarrolloDistrital, Fusagasuga, Volumen III. Bogota, Colombia: DNP, 1983.
32. Departamento Nacional de Planeacion, (DNP). Plan de DesarrolloDistrital. AnAlisis de la Problematica, Distrito Guamo, Volumen II. Guamo, Colombia: ICA, 1983.
33. Departamento Nacional de Planeacion, (DNP). "ExperienciasObtenidas en la Fase I DRI y Recomendaciones para la Fase II," Primera Version, DNP, Division Evaluacion DRI, Unidad Estudios Agrarios, Bogotd, Colombia, 1982 (Mimeographed).
34. Departamento Nacional de Planeacion, (DNP). "El Programa DRI-PAN en el Plan de Desarrollo con Equidad," DNP, Programa DRI-PAN, Bogota, Colombia, 1983 (Mimeographed).
35. Departamento Nacional de Planeacion, (DNP). Programa de Desa-rrollo. Rural Integrado DRI. Manizales, Colombia: DNP,1982.
226
36. Diaz Bordenave, Juan. "Communication of Agricultural Innovations in Latin America. The Need for New Models," Communication Research, 3(1976): 135-154.
37. Donald, Gordon. Credit for Small Farmers in Developing Countries. Boulder, Colorado: Westview Press, 1976.
38. Durand, Eduardo. "The Process of Commercialization of Agricultural Produce and Inputs in New Settlements in Latin America," in Integrated Rural Regional Development, A Workshop Report. Theodor Dams (ed.). Munchen: Kaiser- Grunewald, 1982.
39. Economics Intelligence Unit, (EIU). "Colombia-Agriculture,Forestry, and Fishing,” Quarterly Economic Review ofColombia, Annual Supplement (1985): 9-12.
40. Ellis, W. N. "Overview," in Technologies for Rural Development . Unesco (ed.). Brussels: The Unesco Press, 1981.
41. FAO. Report on the FAO/SIDA/DSE, Inter-Regional Symposiumon Integrated Rural Development. Rome: Food and Agricultural Organization of the United Nations, 1978.
42. Feder, Gershon. "Adoption of Interrelated Agricultural Innovations: Complementarity and the Impacts of Risk, Scale,and Credit," American Journal of Agricultural Economics, 64(1982): 94-101.
43. Feder, Gershon and Gerald T. O'Mara. "Farm Size and the Diffusion of Green Revolution Technology," Economic Development and Cultural Change, 30(1981): 59-76.
44. Feder, Gershon; Richard E. Just; and David Zilberman. "Adoption of Agricultural Innovations in Developing Countries: A Survey," Economic Development and Cultural Change, 33(1985): 255-298.
45. Galjart, Benno. "Rural Development and Sociological Concepts,A Critique," Rural Sociology, 36(1971): 31-41i.
46. Gillis, Malcolm; Dwight, H. Perkins; Michael Roemer; and DonaldR. Snodgrass. Economics of Development. New York:W. W. Norton & Company, Inc., 1983.
47. Garrett, Patricia. "The Relevance of Structural Variables for Farming Systems Research," Rural Sociology, 49(1984): 580-589.
227
48.
49.
50.
51.
52.
53.
54.
55.
56.
57.
58.
Gilbert, E. H.; D. W. Norman; and F. E. Winch. Farming Systems Research: A Critical Evaluation. Rural DevelopmentPaper No. 6, East Lansing: Michigan State University,1980.
Gotsch, C. "Technical Change and the Distribution of Income in Rural Areas,” American Journal of Agriculture Economics, 54,(1972): 326-341.
Green, Gary P. "Credit and Agriculture: Some Consequences ofthe Centralization of the Banking System," Rural Sociology, 49(1984): 568-579.
Haney, Emil B., Jr. and Wava G. Haney. "Social and Ecological Contradictions of Community Development and Rural Modernization in a Colombian Peasant Community," Human Organization, 37(1978): 225-234.
Harry P. Mapp, Jr.; Michael L. Hardin; Odell L. Walter; and Tillak Persaud. "Analysis of Risk Management Strategies for Agricultural Producers," American Journal of Agricultural Economics, 61(1979): 1071-1077.
Hayami, Yujiro and Vernon W. Ruttan. Agricultural Development. An International Perspective. Baltimore: The JohnsHopkins University Press, 1985.
Healey, Joseph F. Statistics: A Tool for Social Research.Belmont, California: Wadsworth Publishing Company, 1984.
Hernandez J., Juan P. "Factores que Influyen en la Adopcion deTecnolog£a en el Noreste de Quindio," Unpublished M. S.Thesis. ICA-National University, Bogotd, Colombia, 1975.
Hernandez, Kevin G. and Jose L. Peralta. "Adopcidn Relativa de Semilla de Maices Mejorados y Fertilizantes por Agricul- tores en el Municipio del Valle de San Juan," Unpublished I. A. Thesis, University of Tolima, Ibague, Colombia, 1985.
Hildebrand, Peter E. "Motivating Small Farmers, Scientistsand Technicians to Accept Change,” Agricultural Administration, 8(1981): 375-383.
Hildebrand, Peter E. "Farming Systems Research: Issues inResearch Strategy and Technology Design; Discussion," American Journal of Agricultural Economics, 64(1982): 905-906.
228
59.
60.
61.
62.
63.
64.
65.
66.
67.
68.
69.
70.
Howell, John. Administering Agricultural Development for Small Farmers. Rome, Food and Agricultural Organization of the United Nations, 1981.
Instituto Colombiano Agropecuario, (ICA). "Diagndstico Distrito Transferencia de Tecnologia No. 3. ICA, Fusagasuga, Colombia: ICA, 1981 (Mimeographed).
Instituto Colombiano Agropecuario, (ICA). "Distrito DRI, Fusagasuga. Informe de Actividades, Semestre A 1985," Fusagasuga, Colombia: ICA, 1985 (Mimeographed).
Instituto Colombiano Agropecuario, (ICA). "Distrito DRI Sur Tolima-Guamo. Informe de Actividades Anual, 1984," Guamo, Colombia: ICA, 1984 (Mimeographed).
Instituto Colombiano Agropecuario, (ICA). "Informe Presentado a la Reunion de Evaluacion de Actividades en Desarrollo Rural, Neiva, 1983," Guamo, Colombia: ICA, 1983(Mimeographed).
Instituto Colombiano Agropecuario, (ICA) and Departamento Nacional de Planeacion, (DNP). "Diagndstico Microregio- nal Distrito Guamo-Sur Tolima," Guamo, Colombia: ICA,1983.
Instituto Colombiano Agropecuario, (ICA). Pollticas para Transferencia de Tecnologia a Pequeftos Productores. Bogotd, Colombia: ICA, 1982.
Idaikkadar, N. M. Agricultural Statistics. A Handbook for Developing Countries. Oxford: Pergamon Press, 1979.
Ijere, M. 0. "The Future of Co-operatives in Developing Countries: A Case Study of Co-operative Management in Nigeria," Agricultural Administration, 7(1980): 169-179.
Isaza R., Jaime. "Analysis of Factors Associated with Agricultural Production at Minifundio Level in the Oriente de Antioqula, Colombia," Unpublished Ph.D. Thesis, University of Wisconsin, Madison, 1974.
Isaza R., Jaime. "Falta de Adopcion, un Problema de Transferencia: de la Opinion a la Realidad. Hipdtesis para unEnfoque Diferente," Boletin Tdcnico No. 96, ICA. Medellin, Colombia: Instituto Colombiano Agropecuario, 1982.
Jedlicka, Allen D. Organization for Rural Development. Risk Taking and Appropriate Technology. New York: PraegerPublishers, 1977.
229
71. Johnston, B. F. "Criteria for the Design of AgriculturalDevelopment Strategies," in Development Economics and Policy; Readings. Ian Livingstone (ed). London: George Allen & Unwin, 1981.
72. Johnson, Sam H. and John B. C la a r . "FSR/E: S h if t in g th eIntersection Between Research and Extension," Agricultural Administration, 21(1986): 81-93.
73. Jolly, Robert W. "Risk Management in Agriculture Production,”American Journal of Agricultural Economics, 65(1983):1107-1113.
74. Just, Richard E. and David Zilberman. "Risk Aversion, Technology Choice, and Equity Effects of Agricultural Policy," American Journal of Agricultural Economics, 67 (1985): 435-440.
75. Korin, Basil P. Statistical Concepts for the Social Sciences.Cambridge, M assachuse tts : W inthrop P u b lis h e rs , I n c . ,1975.
76. Leagans, J. Paul "Extension Education and Modernization," inBehavioral Change in Agriculture, Concepts and Strategies for Influencing Transition. J. Paul Leagans and Charles P. Loomis (eds.). Ithaca, N. Y.: Cornell UniversityPress, 1971.
77. Lele, Uma. "Designing Rural Development Programs: Lessons fromP as t E xperience in A fr ic a : Economic Development andC u ltu ra l Change, 24(1976): 287-308.
78. L e le , Uma. "The Role of R isk in an A g r ic u ltu ra lly Led S tra te g yin Sub-Saharan Africa," American Journal of AgriculturalEconomics, 66(1984): 677-683.
79. Lionberger, Herbert F. and Paul H. Gwin. Communication Strategies: A Guide for Agricultural Change Agents. Danville, Illinois: The Interstate Printer & Publishers, Inc.,1983.
80. Lockheed, Marlaine E.; Dean T. Jamison; and Lawrence J. Lau."Farmer Education and Farm Efficiency: A Survey," Economic Development and Cultural Change, 29(1980): 37-76.
81. Londofio, Diego and Refugio I . R ochin. "D esa rro llo R ural I n te -grado: Experiencias Derivadas del Caso Colombiano,” Desarrollo Rural en las Americas, 7(1975): 256-275.
230
82. Long, Millard. "Conditions for Success of Small Farmer Credit,”in Credit for Small Farmers in Developing Countries. Donald, Gordon (ed.). Boulder, Colorado: WestivewPress, 1976.
83. Lowdermilk, Max and W. Robert Laitos. "Towards a ParticipatoryStrategy for Integrated Rural Development," Rural Sociology, 46(1981): 188-202.
84. Lutz, Gene M. Understanding Social Statistics. New York:Mcmillan Publishing Co. Inc., 1983.
85. Maos, Jacob 0. The Spatial Organization of New Land SettlementIn Latin America. Boulder, Colorado: Westview Press,1984.
86. McDivitt, James F. and Benjamin A. Ntim. "Linkages for Promoting Application of Technology in Developing Countries," in Technologies for Rural Development. Unesco (ed.). Brussels: The Unesco Press, 1981.
87. Miles, D. W. J. "The ITDG Experience," in Technologies forRural Development. Unesco (ed.). Brussels: The UnescoPress, 1981.
88. Miller, F. "Supervised Credit and Agricultural Development:A Peruvian Example," Interamerican Economic Affairs (23)1970: 13-22.
89. Mittendorf, H. J. Improvements of Wholesale Markets in Developing Countries: An Essential Instrument for Development, Rome: FAO, 1982.
90. Mogab, John. "The Mexican Experience in Peasant AgriculturalCredit," Development and Change, 15(1984): 203-221.
91. Molina C. Dario. "Adopcidn de Nueva Tecnologla en Malz y Papaen el Proyecto de Desarrollo Rural del Oriente de Cundi- namarca," Unpublished M. S. Thesis, ICA-National University, Bogota, Colombia, 1976.
92. Mollett, J. A. Planning for Agricultural Development. NewYork: St. Martin's Press, 1984.
93. Morgan, W. B. Agriculture in the Third World, A Spatial Analysis. Boulder, Colorado: Westview Press, 1978.
94. Moris, Jon. Managing Induced Rural Development. Bloomington, Indiana: International Development Institute, 1981.
231
95. Moscardi, Gdgardo R. "Methodology to Study Attitudes towardRisk: The Puebla Project," in Economics and the Design of Small-Farmer Technology. Alberto Valdds, Grant M.Scobie, and John L. Dillon (eds.). Ames, Iowa: IowaState University Press, 1979.
96. Mosher, Arthur. Getting Agriculture Moving. How Farming CanProvide a Better Life. New York: Piramid Books, 1970.
97. Mosher, Arthur. "Agricultural Development," in BehavioralChange in Agriculture, Concepts and Strategies for Influencing Transition. J. P. Leagans and Charles P. Loomis (eds.). Ithaca, N. Y.: Cornell University Press,1971.
98. Nisbet, Charles T. "Supervised Credit Programs for SmallFarmers in Chile," Interamerican Economic Affairs, 21 (1967): 37-54.
99. Nisbet, Charles T. "Moneylending in Rural Areas of LatinAmerica," American Journal of Economics and Sociology, 30(1971): 72-84.
100. Norman, D. W. "Farming Systems Research to Improve the Livelihood of Small Farmers," American Journal of Agricultural Economics, 60(1978): 813-818.
101. Nweke, Felix and Jonathan A. Akorhe. "Determinants of Adoptionof New Technologies Among Smallholders and Implications for Administration of Transfer Programmes: A Case Study of Rice Production in the Plateau State of Nigeria," Agricultural Administration, 12(1983); 77-90.
102. Obibuaku, L. 0. "Technical Assistance and Agricultural Changein Some Anambra State Villages, Nigeria," Journal of Developing Areas, 14(1979): 43-53.
103. Opio-Odongo, J. M. A. "The Determinants of OrganizationalKnowledge Among Members of Rural Co-operatives," Agricultural Administration, 7(1980): 181-190.
104. Patel, A. U. and J. A. Ekpere. "Strategy for AgriculturalDevelopment at Grass roots Level. A Nigerian Case," in Extension Education and Rural Development. Bruce R. Crouch and Shankariah Chamala (eds.). New York: John Willey & Sons, 1981.
105. Perez G., Heriberto and Manuel Torregroza C. "Influencia de laExtension Rural y el Credito en la Adopcidn de Tecnologia para Cultivadores de Maiz en una Region Colombiana," Revista ICA, 13(1978): 697-704.
232
106.
107.
108.
109.
110.
111.
112.
113.
114.
115.
116.
Perrin, Richard and Don Winkelman. "Impediments to Technical Progress on Small versus Large Farms," American Journal of Agricultural Economics, 58(1976): 888-894.
Pineiro, Martin; Eduardo Trigo; and Raul Fiorentino. "Technical Change in Latin American Agriculture: A ConceptualFramework for its Interpretation," in Technical Change and Social Conflict in Agriculture. Martin Piheiro and Eduardo Trigo (eds.). Boulder, Colorado: Westview Press,1983.
Pontius, Steven K. "The Communication Process of Adoption: Agriculture in Thailand," Journal of Developing Areas, 18(1983): 93-118.
Potts, Michael J.; Amado B. de los Santos; and Julia A. Solimen. "Transfer of Technology to Small Farmers: On-Farm Research in the Philippines," Agricultural Administration, 12(1983): 27-42.
Reichart, Norberto. "An&lisis Crltico de los DIversos Enfoques o Sistemas de Transferencia de Tecnologia Agrlcola en America Latina," in Seminario sobre Transferencia de Tecnologia Agrlcola. Angel Marzocca (ed.). Montevideo, Uruguay: IICA-OEA, 1976.
Rogers, Everett M. "The Communication and Diffusion of Innovations. Key Concepts and Models," in Inducing Technological Changes for Economic Growth and Development. Robert A. Solo and Everett M. Rogers (eds.). East Lansing: Michigan State University Press, 1972.
Rogers, Everett M. Diffusion of Innovations, New York: TheFree Press, 1983.
Rohrer, Wayne C. "Developing Third World Farming: Conflictbetween Modern Imperatives and Traditional Ways," Economic Development and Cultural Change, 34(1986): 299-314.
Ross, Douglas N. Partners in Agroeconomic Development. Report No. 711. New York: The Conference Board, 1977.
Roumasset, James A. "Unimportance of Risk for Technology Design and Agricultural Development Policy," in Economics and the Design of Small-Farmer Technology. Alberto Valdds, Grant M. Scobie, and John L. Dillon (eds.). Ames, Iowa: Iowa State University Press, 1979.
Roy, Ewell P. Cooperatives: Development, Principles andManagement. Danville, Illinois: The Interstate Printers & Publishers, Inc., 1981.

233
117. Ruttan, Vernon W. "Integrated Rural Development Programs: ASkeptical Perspective," International Development Review, 17(1975): 9-16.
118. Ruttan, Vernon W. "Integrated Rural Development Programs: AHistorical Perspective," World Development, 12(1984): 393-401.
119. Sanders, John H. and John K. Lynam. "Definition of the Relevant Constraints for Research Resource Allocation in Crop Breeding Programmes," Agricultural Administration, 9(1982): 273-284.
120. Sanders, William and Thomas K. Pinhey. The Conduct of SocialResearch. New York: Holt, Rinehart and Winston, 1983.
121. Sanwal, R. D. "Agricultural Extension in a Kumaonese Village,"Journal of Development Studies, 1(1965): 384-398.
122. Schultz, Theodore W. Transforming Traditional Agriculture.New Haven: Yale University Press, 1964.
123. Scobie, Grant and David Franklin. "The Impact of SupervisedCredit Programmes on Technological Change in Developing Agriculture," Australian Journal of Agricultural Economics, 21(1977): 1-12.
124. Siegel, Sidney. Nonparametric Statistics for the BehavioralSciences. New York: McGraw-Hill Book Company, Inc.,1956.
125. Sin Clavijo, Enrique. Lecture in the Forum on "Improved Seedsfor the Small Farmer in Colombia," Bogota: Departamento Nacional de Planeacion, 1984 (Mineographed).
126. Smith T. Lynn. The Sociology of Agricultural Development.Leiden, Netherlands: E. J. Brill, 1972.
127. Staatz, John M. and Carl K. Eicher. "Agricultural DevelopmentIdeas in Historical Perspective," in Agricultural Development in the Third World. Carl K. Eicher & John M. Staatz (eds.). Baltimore, Maryland: The Johns HopkinsUniversity Press, 1984.
128. Tinnermeier, Ronald. "Technology, Profit and AgriculturalCredit," in Credit for Small Farmers in Developing Countries, Donald Gordon (ed.). Boulder, Colorado: West- view Press, 1976.

234
129. Todaro, Michael P. Economic Development in the Third World.New York: Longman Inc., 1985.
130. Todaro, Michael P. and Jerry Stilkind. City Bias and RuralNeglect: The Dilema of Urban Development. New York: ThePopulation Council, 1981
131. Urrego, M. German. "La Distribucion de la Tierra en Colombia:Una Excesiva Concentracidn," El Promotor, 7(1985): 5-13.
132. Villamil 0. Victor. "Costo Real del Credito Agropecuario delos Productores Rurales en el Proyecto de Desarrollo Rural del Oriente de Cundinamarca," Unpublished M. S. Thesis, National University, Bogota, Colombia, 1974.
133. Weitz, Raanan. Integrated Rural Development. The RehovotApproach. Rehovot, Israel: Settlement Study Centre,1982.
134. World Bank. Rural Development Sector Policy Papers. Washington D.C.: The World Bank, 1975.
135. World Bank. World Development Report 1982. New York: OxfordUniversity Press, 1982.
136. Wright, Sonia R. Quantitative Methods and Statistics. A Guideto Social Research. Beverly Hills, CA.: Sage Publications, Inc., 1979.
137. Zaltman, Gerard and Robert Duncan. Strategies for PlannedChange. New York: John Wiley & Sons, Inc., 1977.
138. Zambrano F., Dalton H. "Adopcion Relativa de Tecnologia en elCultivo de Maiz en el Proyecto de Desarrollo Rural Sur Cauca-Norte Naritlo,” Unpublished M. S. Thesis, ICA-Na- tional University, Bogota, Colombia, 1975.
139. Zandstra, H.; Swanberg, K.; Zulberti, C.; and Nestel E.Caqueza: Living Rural Development. Ottawa: International Development Research Center, 1979.
140. Zulberti, Carlos A.; Kenneth G. Swanberg; and Hubert G.Zandstra. "Technology Adaptation in a Colombian Rural Development Project," in Economics and the Design ofSmall-Farmer Technology. Alberto Valdds, Grant M.Scobie, and John L. Dillon (eds.). Ames, Iowa: IowaState University Press, 1979.

APPENDIX A
INTERVIEW SCHEDULE
235
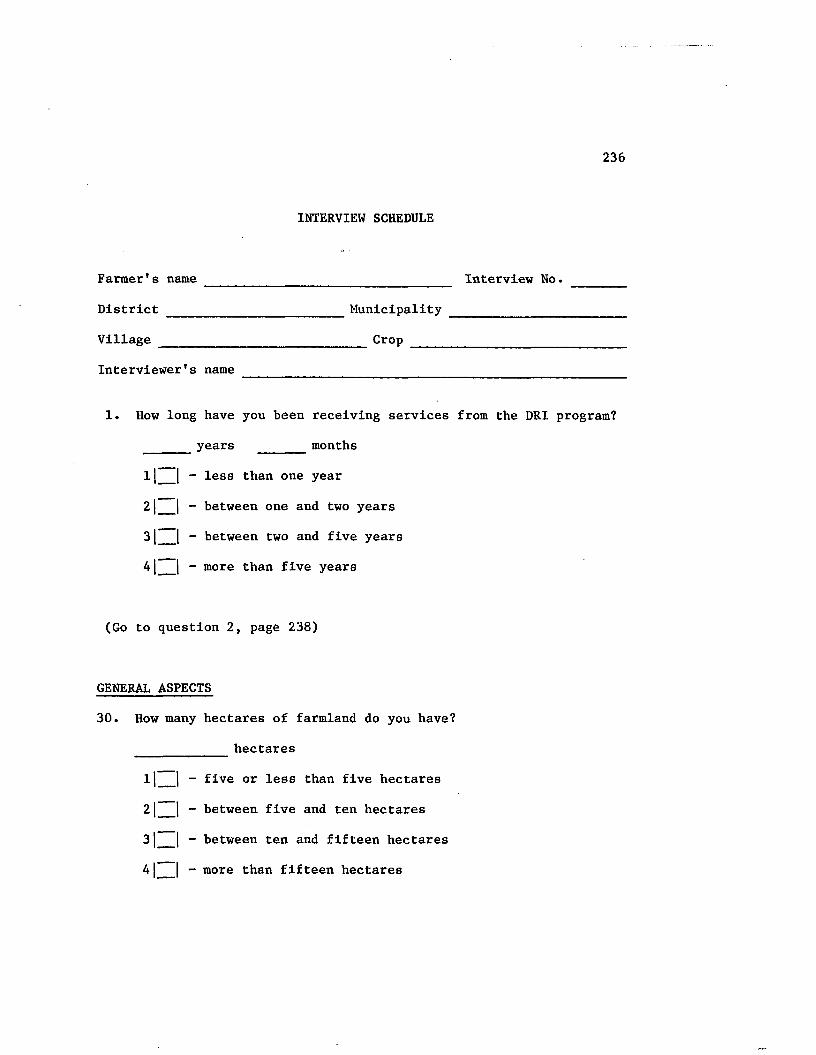
236
INTERVIEW SCHEDULE
Farmer's name
District ____
Village _____
Interviewer's name _______________________________________________
1. How long have you been receiving services from the DRI program?
______years ______ months
11 | - less than one year
21__| - between one and two years
31__| - between two and five years
41__| - more than five years
(Go to question 2, page 238)
GENERAL ASPECTS
30. How many hectares of farmland do you have?
____________ hectares
l|__| - five or less than five hectares
2 |__| - between five and ten hectares
3| | - between ten and fifteen hectares
4 | | - more than fifteen hectares
____________ Interview No.
Municipality ______________
Crop
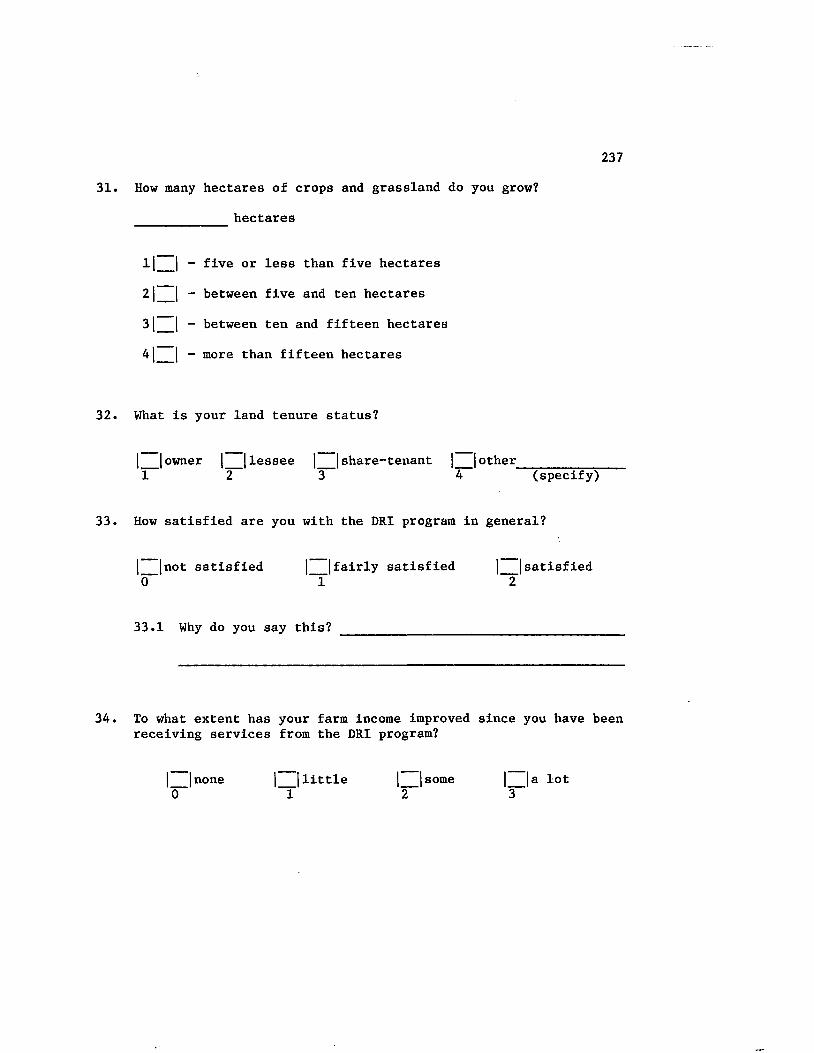
237
31. How many hectares of crops and grassland do you grow?
hectares
- five or less than five hectares
- between five and ten hectares
- between ten and fifteen hectares
- more than fifteen hectares
32. What is your land tenure status?
| | owner | | lessee | |share-tenant | | other__________1 2 3 4 (specify)
33. How satisfied are you with the DRI program in general?
| |not satisfied |__|fairly satisfied | [satisfied0 1 2
33.1 Why do you say this? ________________________________
1IZI
2IZI
3IZI
4IZI
34. To what extent has your farm income improved since you have been receiving services from the DRI program?
|__| none |__| little |__|some______|__|a lot0 1 2 3
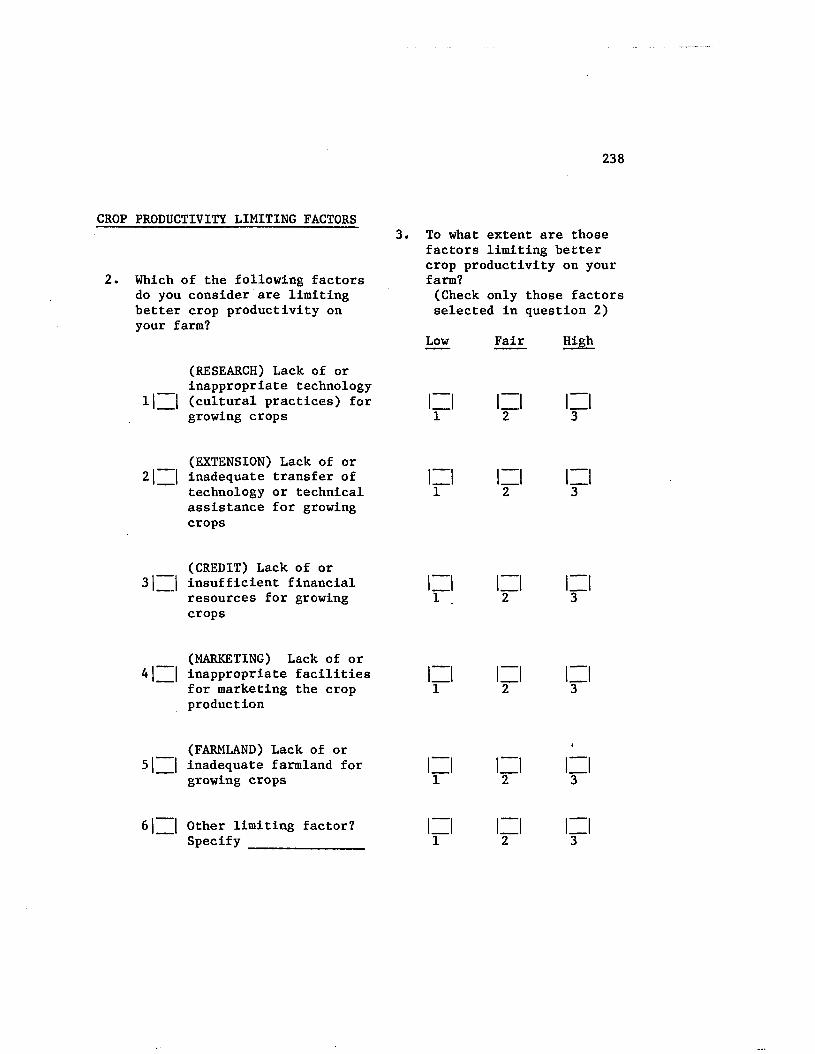
238
CROP PRODUCTIVITY LIMITING FACTORS
2. Which of the following factors do you consider are limiting better crop productivity on your farm?
(RESEARCH) Lack of or inappropriate technology
l| | (cultural practices) forgrowing crops
3. To what extent are those factors limiting better crop productivity on your farm?(Check only those factors selected in question 2)
Low Fair High
1 2 3
(EXTENSION) Lack of or _2 | | inadequate transfer of | | |__| |_
technology or technical 1 2 3assistance for growingcrops
(CREDIT) Lack of or insufficient financial resources for growing crops
(MARKETING) Lack of or __ __4 |__| inappropriate facilities |__|_____|__| |_
for marketing the crop 1 2 3production
(FARMLAND) Lack of or inadequate farmland for growing crops
Other limiting factor? Specify _____________
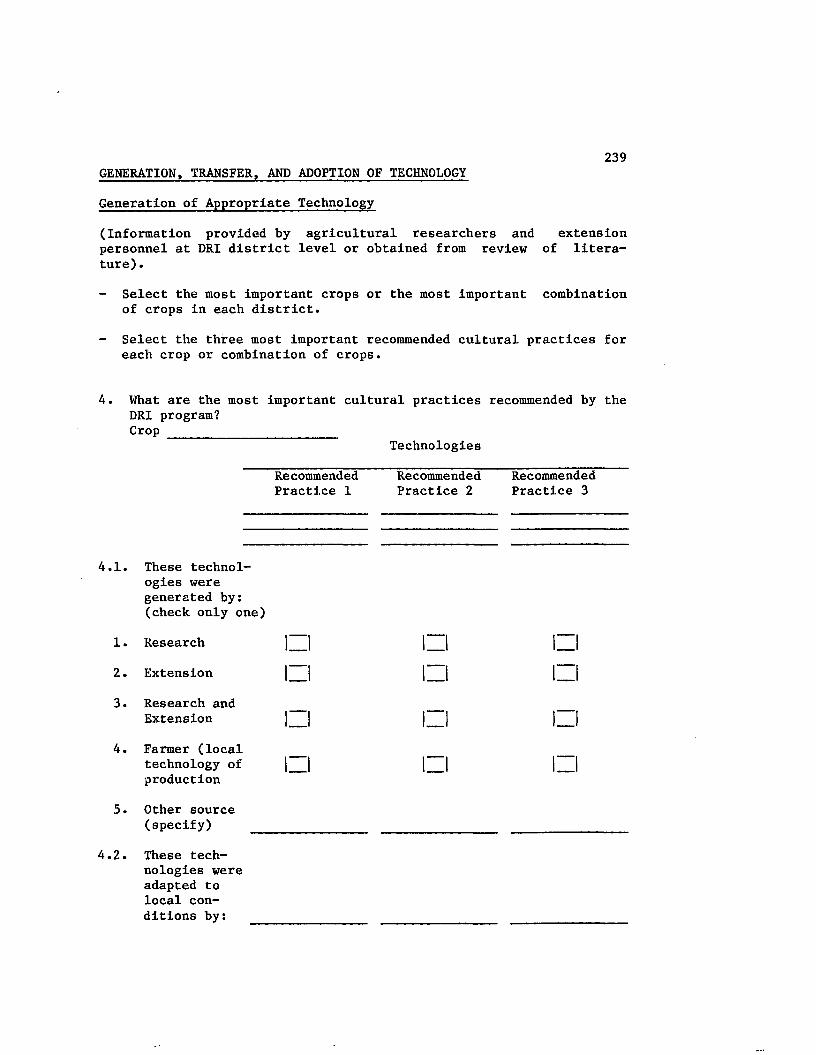
GENERATION, TRANSFER, AND ADOPTION OF TECHNOLOGY239
Generation of Appropriate Technology
(Information provided by agricultural researchers and extension personnel at DRI district level or obtained from review of literature) .
- Select the most important crops or the most important combination of crops in each district.
- Select the three most important recommended cultural practices for each crop or combination of crops.
4. What are the most important cultural practices recommended by the DRI program?Crop _____________________
Technologies
Recommended Practice 1
Recommended Practice 2
Recommended Practice 3
4.1. These technologies were generated by: (check only one)
1. Research
2. Extension
3. Research and Extension
4. Farmer (local technology of production
5. Other source (specify)
4.2. These technologies were adapted to local conditions by:

240
Transfer of Technology
(The same crop and the same recommended cultural practices selected on question 4 must be used)
Crop _______________
5. What are the DRI's recommendations for:
- (Cultural practice 1) ____________
- (Cultural practice 2)
- (Cultural practice 3)
(correct answers)NE | | SE | | FE
6. Through what means of information did you learn about these recommendations? (Indicate all that apply).
1|
2 |3|
4 I5| 61
DRI's extension agent
a friend or neighbor
experimental station
written material (newspaper, magazine, bulletin, leaflet, handout, etc.)
radio
Other(s) means(s) _____________________________(specify)
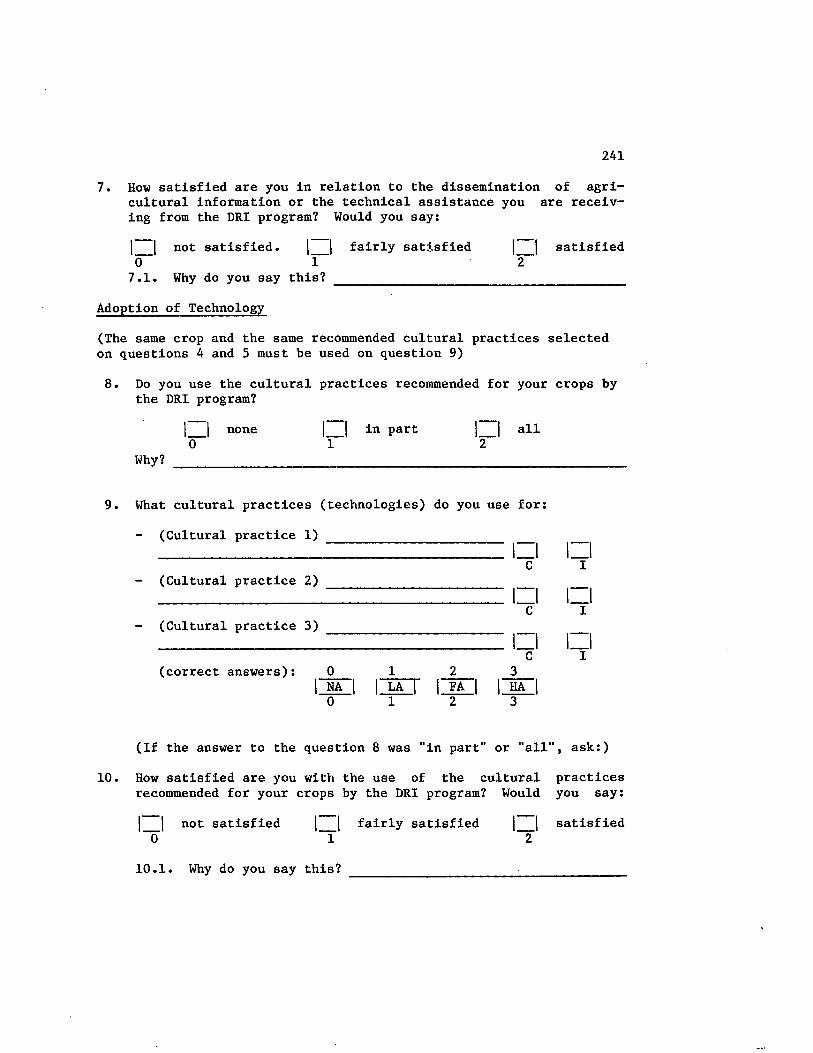
241
7. How satisfied are you in relation to the dissemination of agricultural information or the technical assistance you are receiving from the DRI program? Would you say:
fairly satisfied | satisfied|__| not satisfied. |_0 1 27.1. Why do you say this? ____________________________________
Adoption of Technology
(The same crop and the same recommended cultural practices selected on questions 4 and 5 must be used on question 9)
8. Do you use the cultural practices recommended for your crops by the DRI program?
none in part all
Why?
9. What cultural practices (technologies) do you use for:
(Cultural practice 1) ______________________
- (Cultural practice 2)
- (Cultural practice 3)
(correct answers):NA LA FA HA
(If the answer to the question 8 was "in part" or "all", ask:)
10. How satisfied are you with the use of the cultural practices recommended for your crops by the DRI program? Would you say:
not satisfied fairly satisfied | satisfied0 1
10.1. Why do you say this?
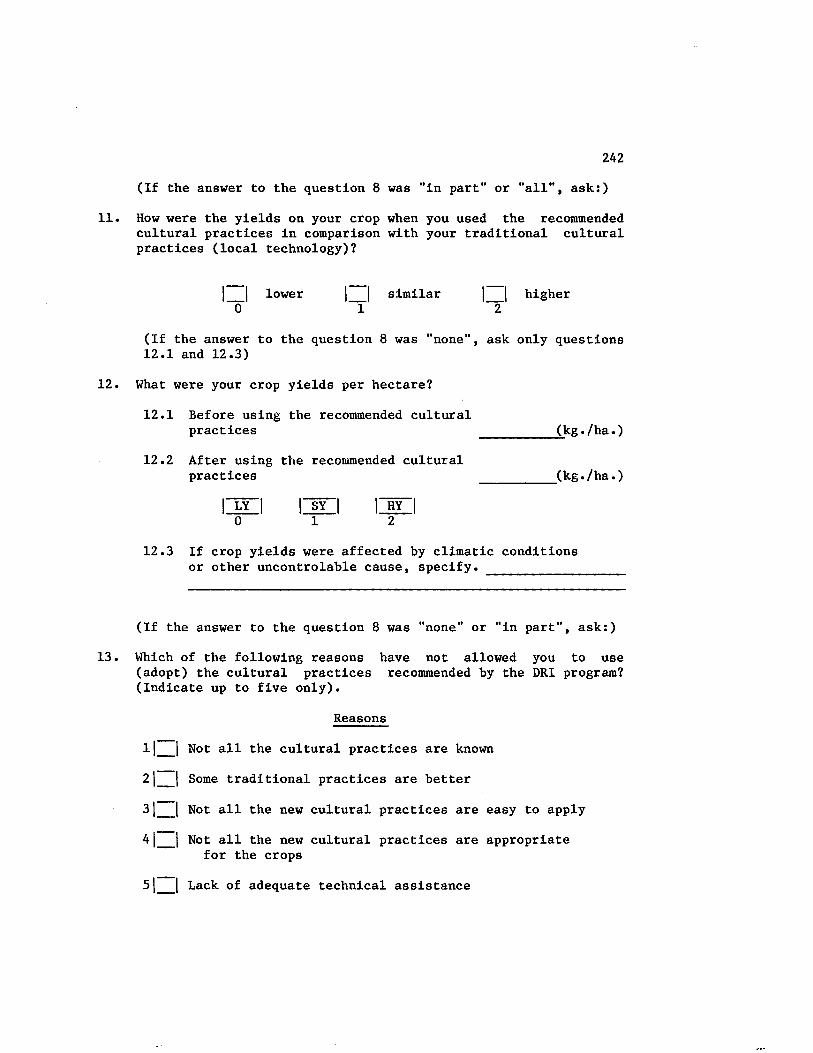
242
(If the answer to the question 8 was "in part" or "all", ask:)
11. How were the yields on your crop when you used the recommended cultural practices in comparison with your traditional cultural practices (local technology)?
|__| lower |__| similar |__| higher0 1 2
(If the answer to the question 8 was "none", ask only questions12.1 and 12.3)
12. What were your crop yields per hectare?
12.1 Before using the recommended culturalpractices___________________________ _________ (kg*/ha.)
12.2 After using the recommended culturalpractices___________________________ _________ (kg./ha.)
IjHI IHlI IHlI 0 1 212.3 If crop yields were affected by climatic conditions
or other uncontrolable cause, specify. _________________
(If the answer to the question 8 was "none" or "in part", ask:)
13. Which of the following reasons have not allowed you to use (adopt) the cultural practices recommended by the DRI program? (Indicate up to five only).
Reasons
11__ | Not all the cultural practices are known
21__ | Some traditional practices are better
31__ | Not all the new cultural practices are easy to apply
41__ | Not all the new cultural practices are appropriatefor the crops
51 | Lack of adequate technical assistance
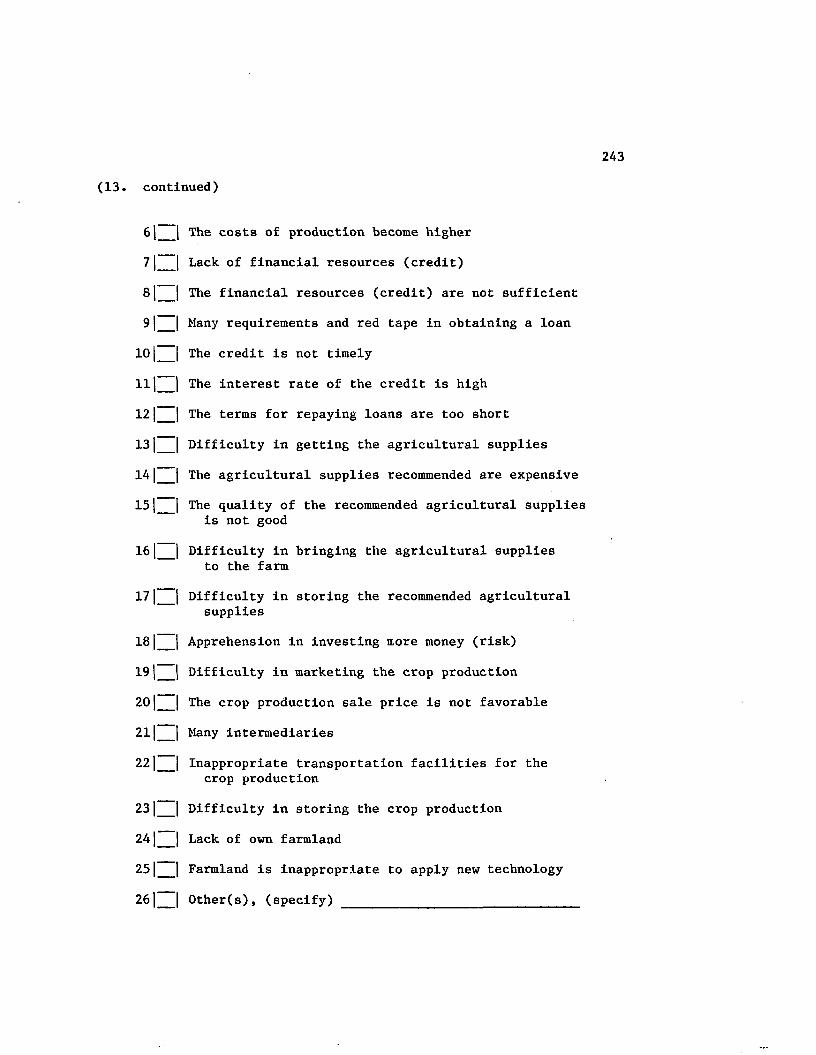
continued)
61 | The costs of production become higher
7| | Lack of financial resources (credit)
81__ | The financial resources (credit) are not sufficient
91__ | Many requirements and red tape in obtaining a loan
101__ | The credit is not timely
111__ ] The interest rate of the credit is high
121__ | The terms for repaying loans are too short
131__ | Difficulty in getting the agricultural supplies
141__ | The agricultural supplies recommended are expensive
15| | The quality of the recommended agricultural suppliesis not good
16| | Difficulty in bringing the agricultural suppliesto the farm
171 | Difficulty in storing the recommended agriculturalsupplies
18|__ | Apprehension in investing more money (risk)
19|__ | Difficulty in marketing the crop production
201__ | The crop production sale price is not favorable
211__ | Many intermediaries
221__ | Inappropriate transportation facilities for thecrop production
231__ | Difficulty in storing the crop production
241__ | Lack of own farmland
251__ | Farmland is inappropriate to apply new technology
261__ | Other(s), (specify) ______________________________
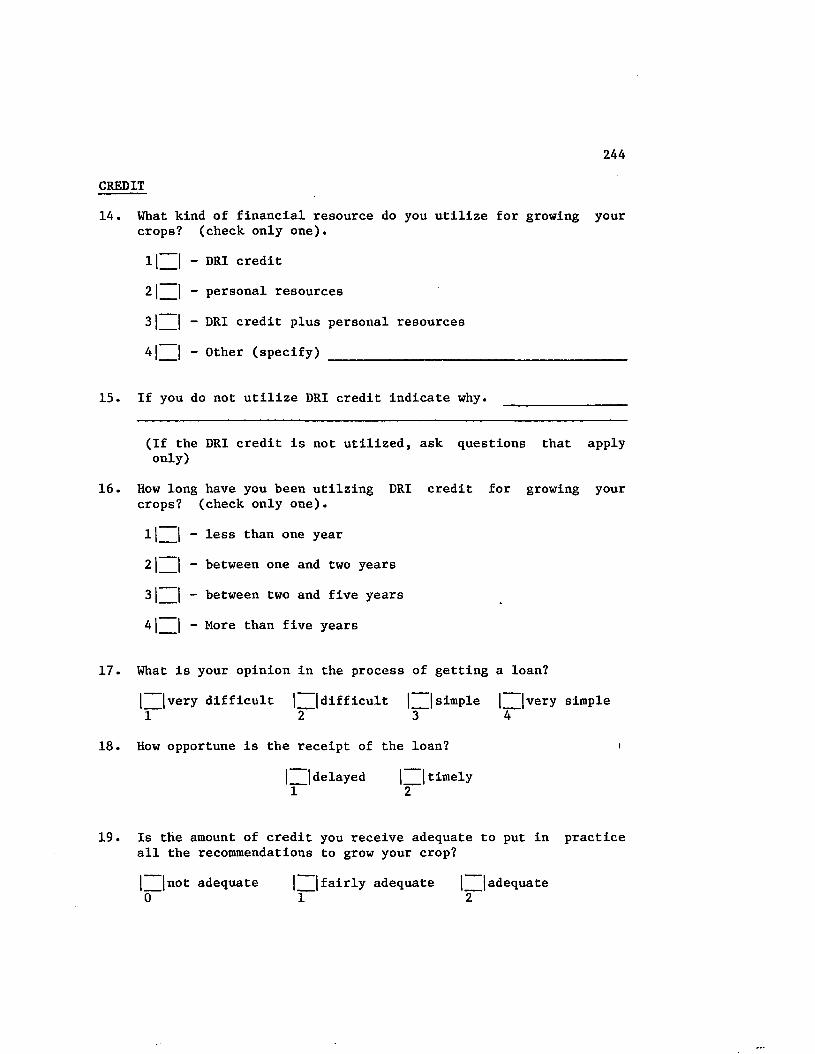
244
CREDIT
14. What kind of financial resource do you utilize for growing your crops? (check only one).
1|~| - DRI credit
2| | - personal resources
31__ | - DRI credit plus personal resources
41 I - Other (specify) _____________________________________
15. If you do not utilize DRI credit indicate why.
(If the DRI credit is not utilized, ask questions that apply only)
16. How long have you been utilzing DRI credit for growing your crops? (check only one).
l|__ | - less than one year
21__ | - between one and two years
31__ | - between two and five years
41__ | - More than five years
17. What is your opinion in the process of getting a loan?
| |very difficult | (difficult | |simple | |very simple1 2 3 4
18. How opportune is the receipt of the loan?
|__| delayed |__| timely1 2
19. Is the amount of credit you receive adequate to put in practice all the recommendations to grow your crop?
| |not adequate | |fairly adequate | |adequate0 1 2
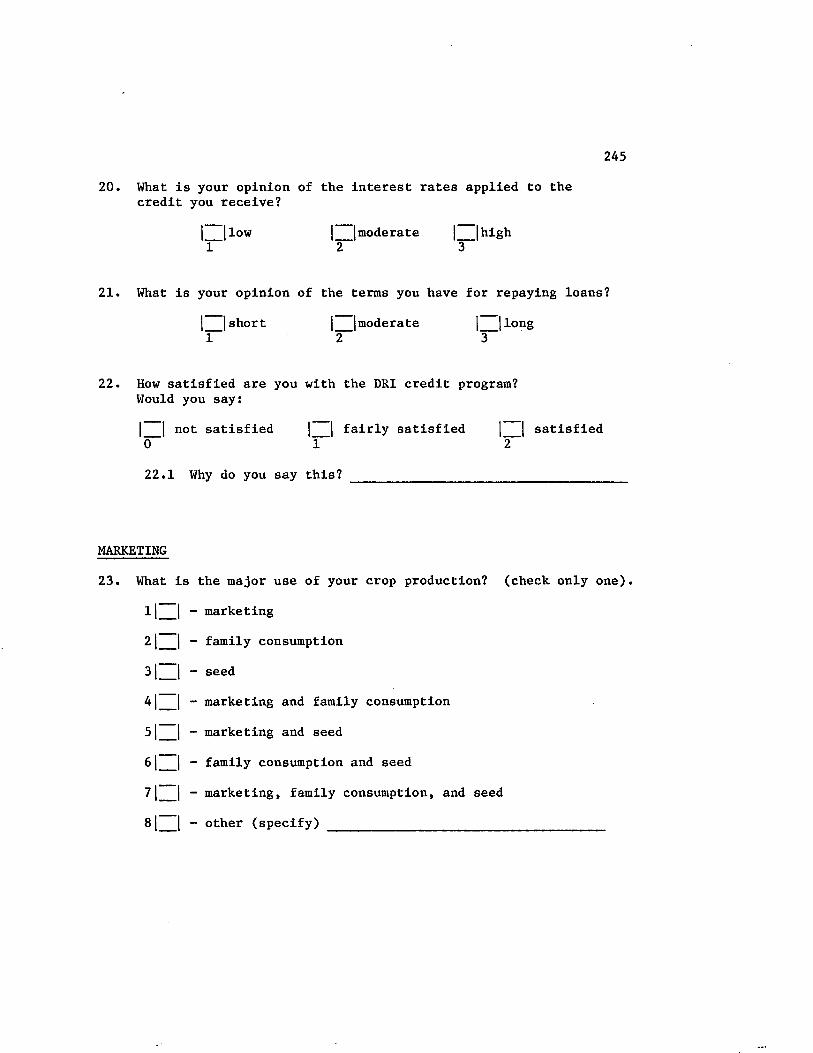
245
20. What is your opinion of the interest rates applied to the credit you receive?
|__| low |__|moderate |__|high1 2 3
21. What is your opinion of the terms you have for repaying loans?
| | short________|____|moderate |__|long1 2 3
22. How satisfied are you with the DRI credit program?Would you say:
| | not satisfied |__| fairly satisfied | | satisfied0 1 222.1 Why do you say this? _______________________________
MARKETING
23. What is the major use of your crop production? (check only one).
l|__ | - marketing
21__ | - family consumption
31__ | - seed
41 I - marketing and family consumption
5 - marketing and seed
61__ | - family consumption and seed
71__ | - marketing, family consumption, and seed
81 | - other (specify) ______________________
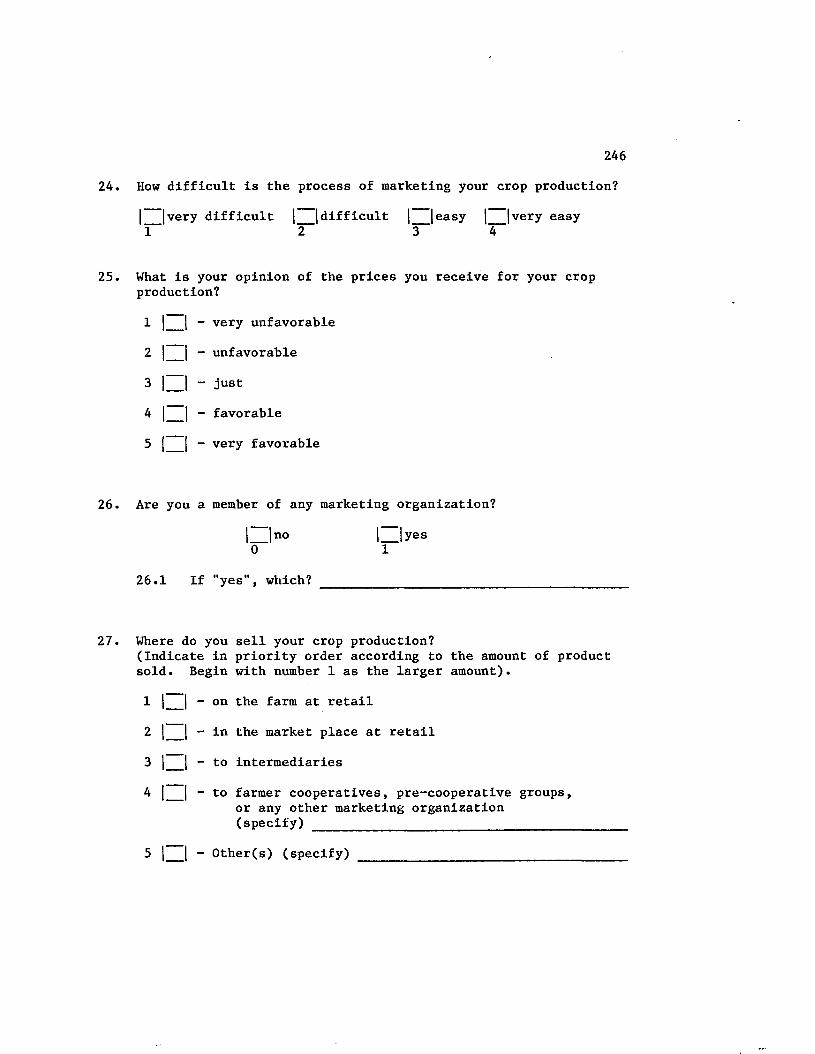
246
24. How difficult is the process of marketing your crop production?
|__|very difficult |__| difficult |__|easy |__|very easy1 2 3 4
25. What is your opinion of the prices you receive for your crop production?
1
23
4
5
- very unfavorable
- unfavorable
- just
- favorable
- very favorable
26. Are you a member of any marketing organization?
|~|n° l ~ | y es0 1
26.1 If "yes", which? ______________________
27. Where do you sell your crop production?(Indicate in priority order according to the amount of product sold. Begin with number 1 as the larger amount).
1__|_| - on the farm at retail
2__|_j - in the market place at retail
3__|_| - to intermediaries
4__|_| - to farmer cooperatives, pre-cooperative groups,or any other marketing organization (specify) ____________________________
5 | | - Other(s) (specify)
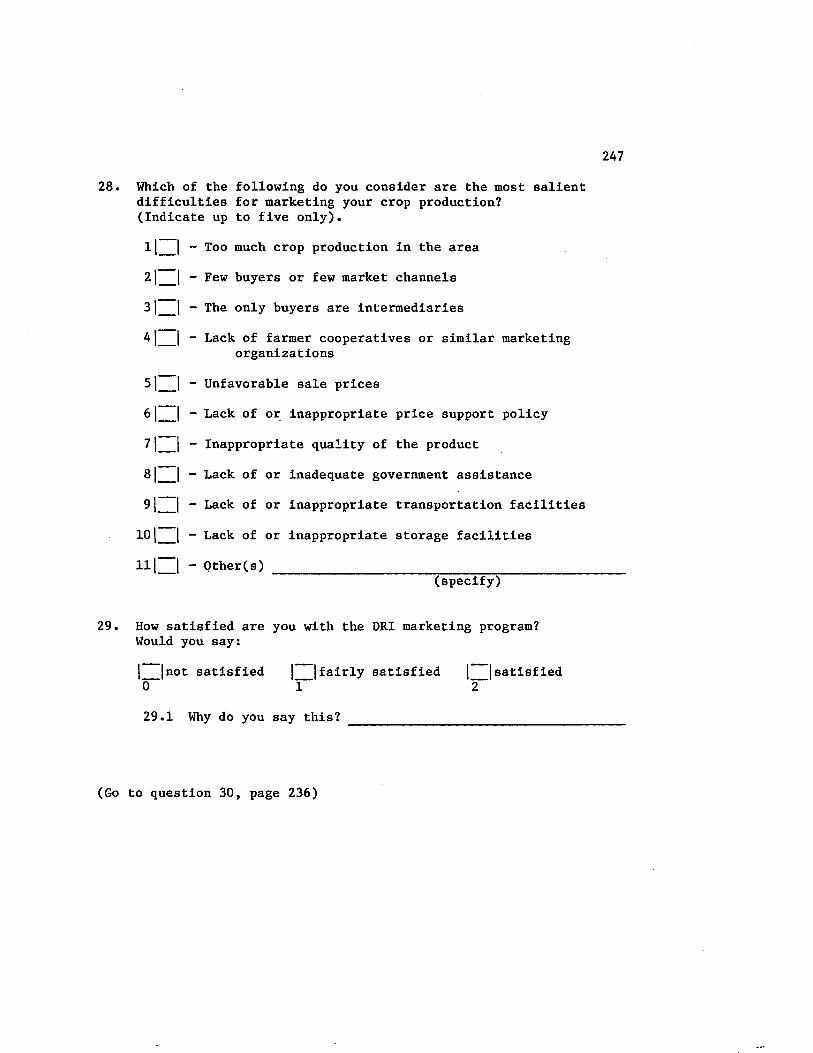
247
28. Which of the following do you consider are the most salient difficulties for marketing your crop production?(Indicate up to five only).
1[ I - Too much crop production in the area
21__ | - Few buyers or few market channels
31__ | - The only buyers are intermediaries
4 1__ | - Lack of farmer cooperatives or similar marketingorganizations
51__ | - Unfavorable sale prices
6 |__ | - Lack of or inappropriate price support policy
71__ | - Inappropriate quality of the product
81__ | - Lack of or inadequate government assistance
91__ | - Lack of or inappropriate transportation facilities
101__ | - Lack of or inappropriate storage facilities
111 | - Other(s) _______________________________________(specify)
29. How satisfied are you with the DRI marketing program? Would you say:
| |not satisfied |__|fairly satisfied |__|satisfied0 1 229.1 Why do you say this? ___________________________
(Go to question 30, page 236)
APPENDIX B
RELATIONSHIPS BETWEEN VARIABLES
248
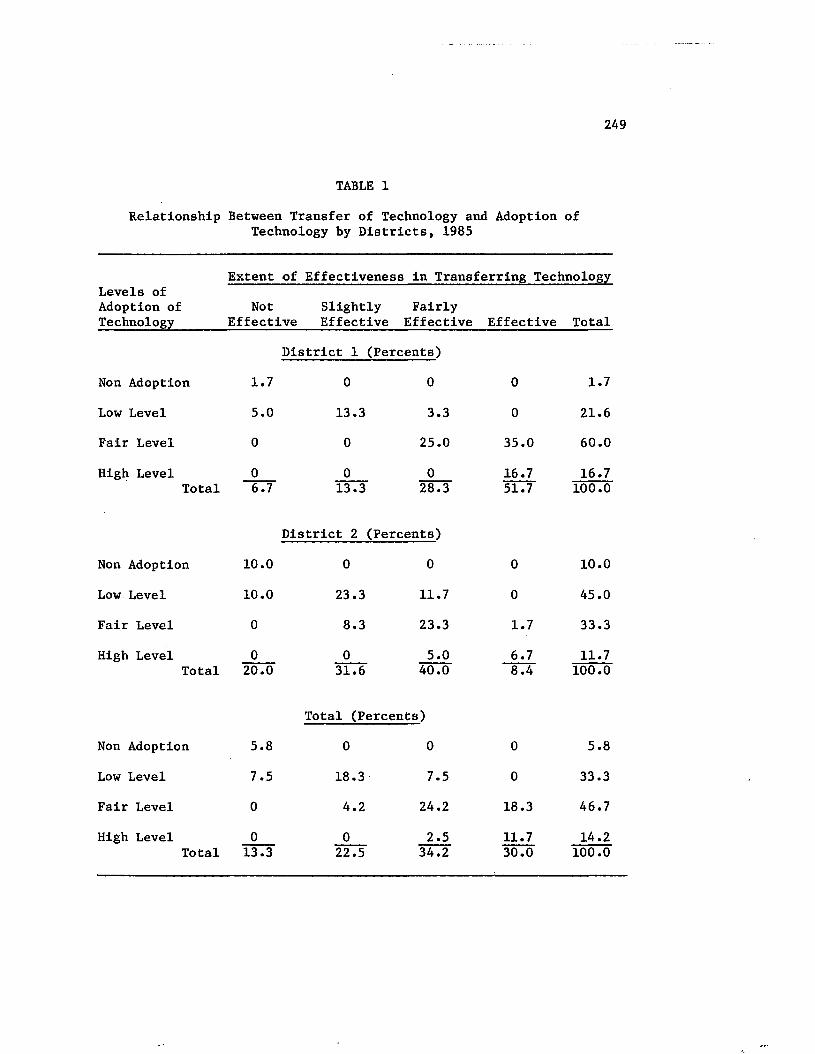
249
TABLE 1
Relationship Between Transfer of Technology and Adoption ofTechnology by Districts, 1985
Extent of Effectiveness in Transferring TechnologyLevels ofAdoption of Not Slightly FairlyTechnology______ Effective Effective Effective Effective Total
District 1 (Percents)
Non Adoption 1.7 0 0 0 1.7
Low Level 5.0 13.3 3.3 0 21.6
Fair Level 0 0 25.0 35.0 60.0
High Level 0 0 0 16.7 16.7Total 6.7 13.3
District 2 i
28.3
(Percents)
51.7 100.0
Non Adoption 10.0 0 0 0 10.0
Low Level 10.0 23.3 11.7 0 45.0
Fair Level 0 8.3 23.3 1.7 33.3
High Level 0 0 5.0 6.7 11.7Total 20.0 31.6 40.0 8.4 100.0
Total (Percents)
Non Adoption 5.8 0 0 0 5.8
Low Level 7.5 18.3 7.5 0 33.3
Fair Level 0 4.2 24.2 18.3 46.7
High Level 0 0 2.5 11.7 14.2Total 13.3 22.5 34.2 30.0 100.0
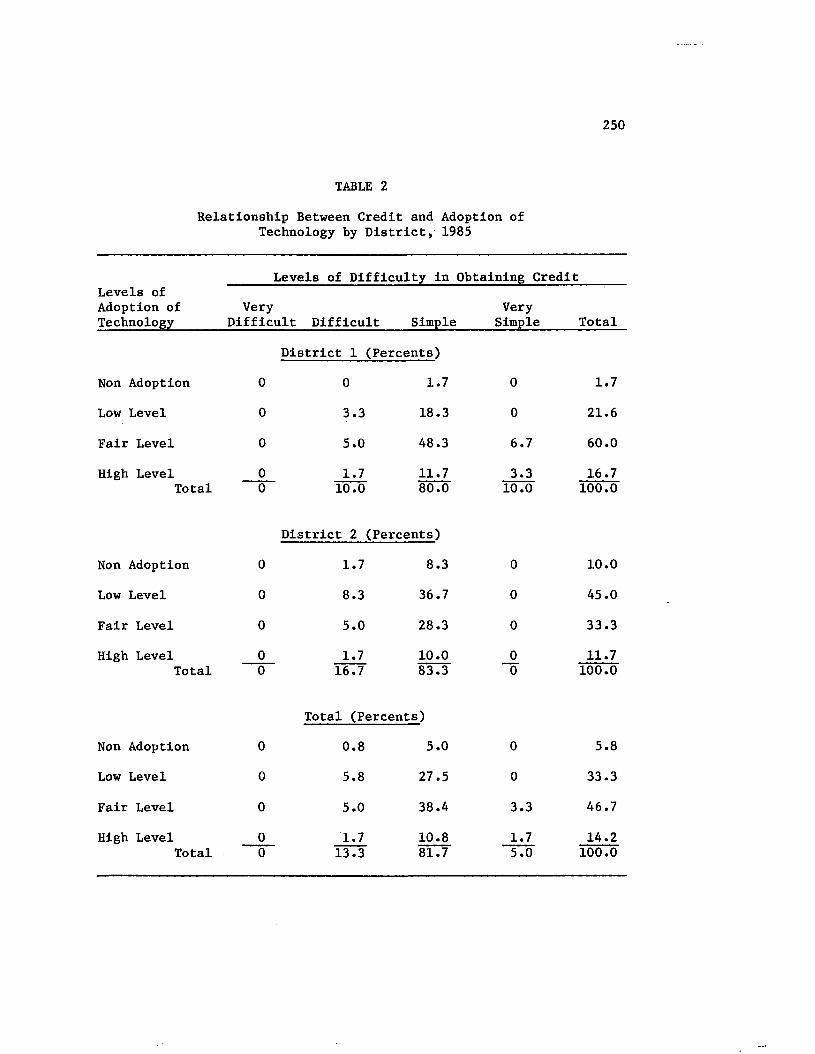
250
TABLE 2
Relationship Between Credit and Adoption ofTechnology by District, 1985
Levels of Difficulty in Obtaining CreditLevels of Adoption of Technology
VeryDifficult Difficult Simple
VerySimple Total
District 1 (Percents)
Non Adoption 0 0 1.7 0 1.7
Low Level 0 3.3 18.3 0 21.6
Fair Level 0 5.0 48.3 6.7 60.0
High Level 0 1.7 11.7 3.3 16.7Total 0 10.0 80.0 10.0 100.0
District 2 (Percents)
Non Adoption 0 1.7 8.3 0 10.0
Low Level 0 8.3 36.7 0 45.0
Fair Level 0 5.0 28.3 0 33.3
High Level 0 1.7 10.0 0 11.7Total 0 16.7 83.3 0 100.0
Total (Percents)
Non Adoption 0 0.8 5.0 0 5.8
Low Level 0 5.8 27.5 0 33.3
Fair Level 0 5.0 38.4 3.3 46.7
High Level 0 1.7 10.8 1.7 14.2Total 0 13.3 81.7 5.0 100.0

251
TABLE 3
Relationship Between Marketing and Adoption ofTechnology by District, 1985
Levels of Adoption of Technology
Levels of Difficulty in Marketing Crop Production
VeryDifficult Difficult Easy
VeryEasy Total
District 1 (Percents)
Non Adoption 0 1.7 0 0 1.7
Low Level 3.3 16.7 1.6 0 21.6
Fair Level 5.0 38.3 16.7 0 60.0
High Level 1.7 8.3 5.0 1.7 16.7Total 10.0 65.0 23.3 1.7 100.0
District 2 (Percents)
Non Adoption 0 10.0 0 0 10.0
Low Level 0 31.7 13.3 0 45.0
Fair Level 0 21.6 11.7 0 33.3
High Level 0 10.0 1.7 0 11.7Total 0 73.3 26.7 0 100.0
Total (Percents)
Non Adoption 0 5.8 0 0 5.8
Low Level 1.7 24.2 7.5 0 33.3
Fair Level 2.5 30.0 14.2 0 46.7
High Level 0.8 9.2 3.3 0.8 14.2Total 5.0 69.2 25.0 0.8 100.0
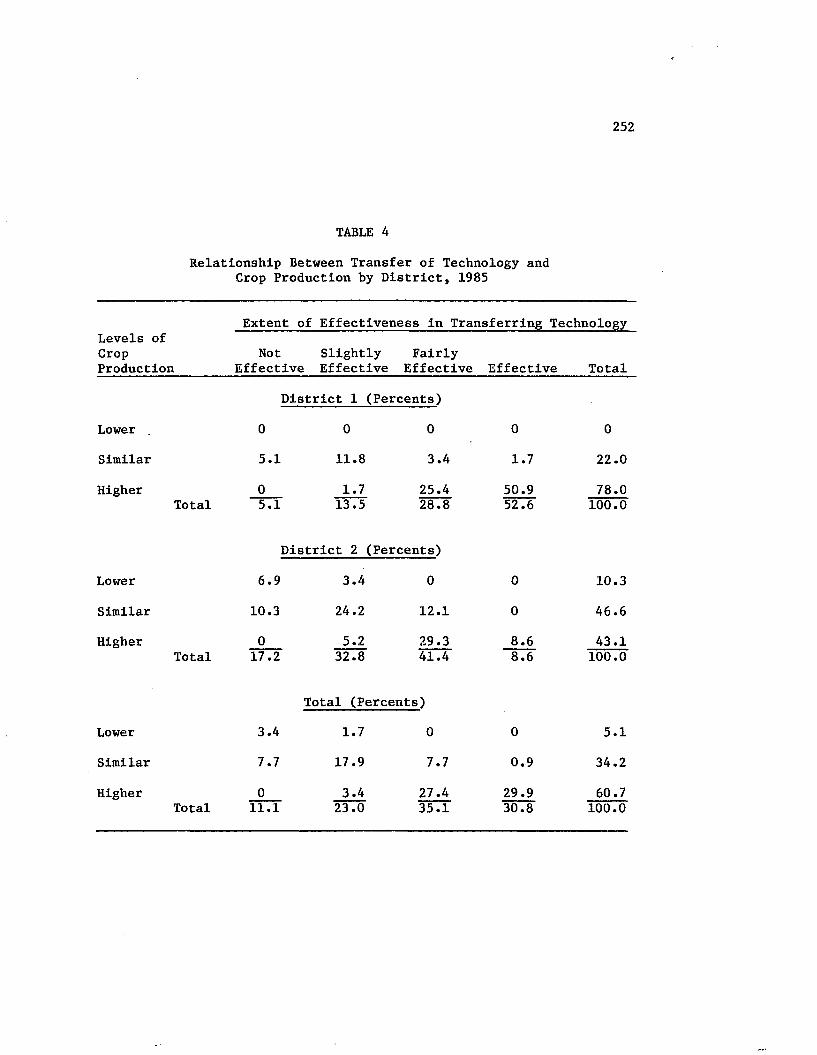
252
TABLE 4
Relationship Between Transfer of Technology andCrop Production by District, 1985
Extent of Effectiveness in Transferring TechnologyLevels of CropProduction
NotEffective
SlightlyEffective
FairlyEffective Effective Total
District 1 (Percents)
Lower . 0 0 0 0 0
Similar 5.1 11.8 3.4 1.7 22.0
Higher 0 1.7 25.4 50.9 78.0Total 5.1 13.5 28.8 52.6 100.0
District 2 (Percents)
Lower 6.9 3.4 0 0 10.3
Similar 10.3 24.2 12.1 0 46.6
Higher 0 5.2 29.3 8.6 43.1Total 17.2 32.8 41.4 8.6 100.0
Total (Percents)
Lower 3.4 1.7 0 0 5.1
Similar 7.7 17.9 7.7 0.9 34.2
Higher 0 3.4 27.4 29.9 60.7Total 11.1 23.0 35.1 30.8 100.0
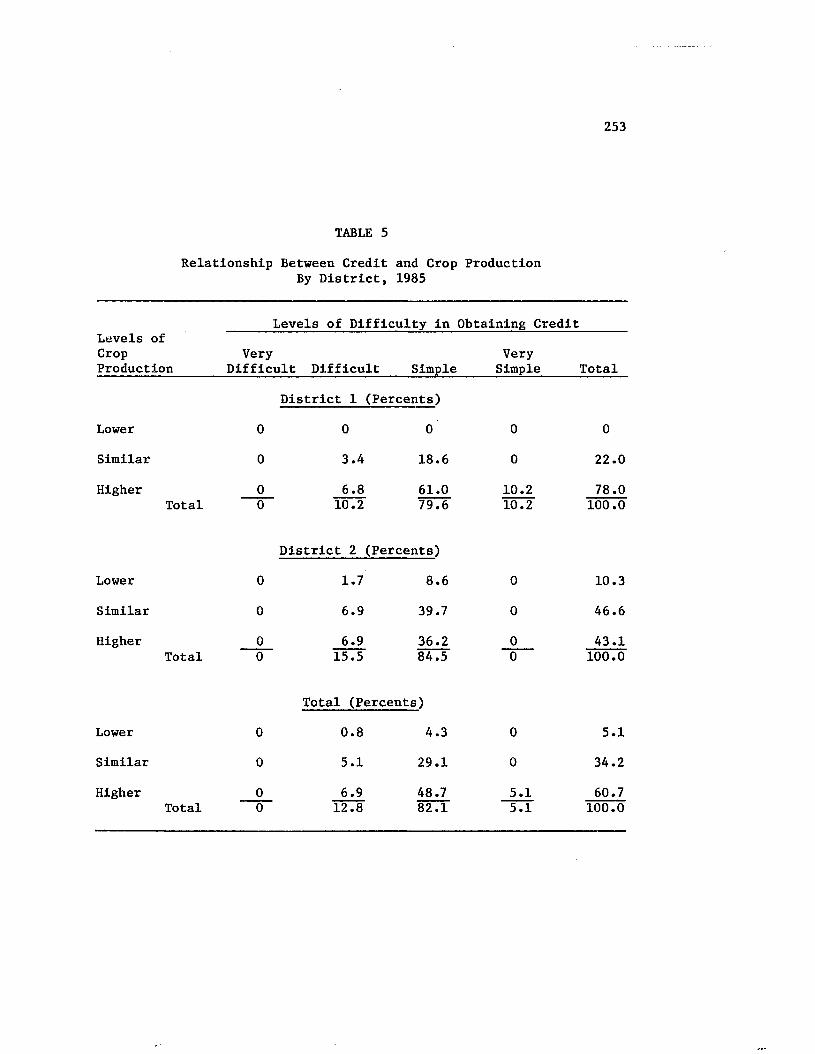
253
TABLE 5
Relationship Between Credit and Crop ProductionBy District, 1985
Levels of Difficulty in Obtaining CreditLevels of CropProduction
VeryDifficult Difficult Simple
VerySimple Total
Lower
District 1 (Percents)
0 0 0 0 0
Similar 0 3.4 18.6 0 22.0
Higher 0 6.8 61.0 10.2 78.0Total 0 10.2 79.6 10.2 100.0
District 2 (Percents)
10.3
46.6
Lower 0 1.7 8.6 0
Similar 0 6.9 39.7 0
Higher 0 6.9 36.2 0 43.1Total 0 15.5 84.5 0 100.0
Total (Percents)
Lower 0 0.8 4.3 0
Similar 0 5.1 29.1 0
Higher 0 6.9 48.7 5.1Total 0 12.8 82.1 5.1 100.0

254
TABLE 6
Relationship Between Marketing and CropProduction by District, 1985
Levels of Difficulty in Marketing Crop ProductionLevels of CropProduction
VeryDifficult Difficult Easy
VeryEasy Total
Districts 1 (Percents)
Lower 0 0 0 0 0
Similar 3.4 15.2 3.4 0 22.0
Higher 6.8 49.2 20.3 1.7 78.0Total 10.2 64.4 23.7 1.7 100.0
District 2 i(Percents)
Lower 0 10.3 0 0 10.3
Similar 0 32.8 13.8 0 46.6
Higher 0 29.3 13.8 0 43.1Total 0 72.4 27.6 0 100.0
Total (Percents)
Lower 0 5.1 0 0 5.1
Similar 1.7 23.9 8.6 0 34.2
Higher 3.4 39.4 17.1 0.8 60.7Total 5.1 68.4 25.7 0.8 100.0
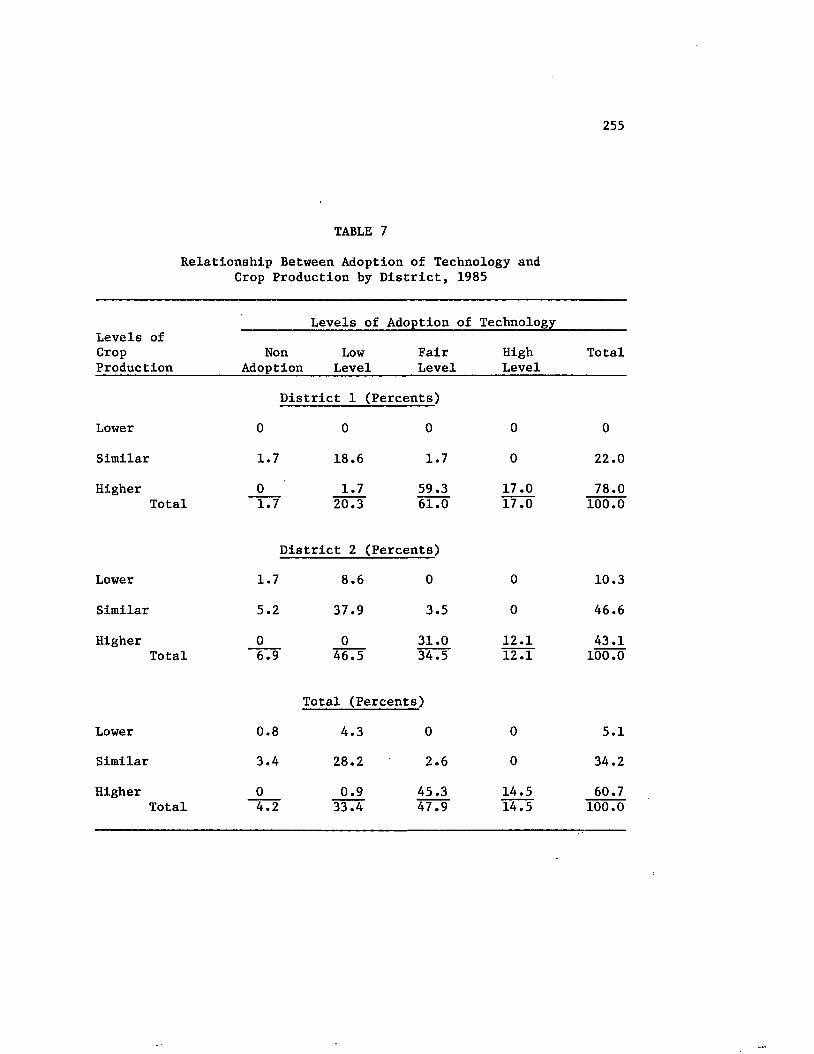
255
TABLE 7
Relationship Between Adoption of Technology andCrop Production by District, 1985
Levels of CropProduction
Levels of Adoption of Technology
Non Low Adoption Level
FairLevel
HighLevel
Total
District 1 (Percents)
Lower 0 0 0 0 0
Similar 1.7 18.6 1.7 0 22.0
Higher 0 1.7 59.3 17.0 78.0Total 1.7 20.3 61.0 17.0 100.0
District 2 (Percents)
Lower 1.7 8.6 0 0 10.3
Similar 5.2 37.9 3.5 0 46.6
Higher 0 0 31.0 12.1 43.1Total 6.9 46.5 34.5 12.1 100.0
Total (Percents)
Lower 0.8 4.3 0 0 5.1
Similar 3.4 28.2 2.6 0 34.2
Higher 0 0.9 45.3 14.5 60.7Total 4.2 33.4 47.9 14.5 100.0
VITA
Luis Eduardo Chaves E. was born in Bogota, Colombia, on November
13, 1942. After his secondary education at Colegio Nacional Camilo
Torres, he entered the College of Agriculture at the National Univer
sity of Colombia, at Bogota, receiving the degree, with honorable
mention, of "Ingeniero Agronomo" in 1966.
Upon completion of his studies he was hired by the Colombian
Agricultural Institute (ICA) to work in the Methodology of Extension
Program, at Tibaitata. In January 1968 he was moved to Palmira,
to work as coordinator between Extension and Research, and part of
his time was dedicated to work as an extension agent.
He attended a three months course on agricultural extension and
agricultural development at Borgo a Mozzano, Lucca, Italy, beginning
in October 1968. After returning he was appointed as extension super
visor in the ICA's Regional Area 5, at Palmira (Cauca Valley).
In August 1969, he was granted a fellowship from the W. K.
Kellogg Foundation to undertake a program of study to obtain the degree
of Master of Sciences at Cornell University, majoring in Extension
Education and minoring in Farm Management.
After returning with the M.S. degree in 1971, he was appointed
as National Coordinator of the Rural Extension Service, at Bogota.
In June 1972, he attended a month course on Rural Extension at
the International Centre at Wageningen, the Netherlands. In October
256
257
1972, he was moved to Ibague, Tolima, to work as Regional Director of
Rural Development.
The author was granted a fellowship from the Organization of
American States (OEA) and the Government of Spain to attend a three
month course on Integrated Rural Development at Escuela Central de
Capacitaci6n Agraria, San Fernando de Henares, Spain.
In November 1979, he was appointed as Director of ICA'si
Regional Area 6, at Ibague. In January 1981, he was moved to Bogota
to work in the Division of Rural Development and, after three months,
he was appointed as Director of that Division.
In January 1983, he was granted a fellowship from the Organiza
tion of American States (OEA) to undertake a program of study in
the Department of Extension and International Education, at Louisiana
State University, to obtain the Degree of Doctor of Education,
majoring in Extension Education and minoring in Socio-economics. In
May 1984, when the OEA's fellowship ended, he was granted a fellow
ship from the W. K. Kellogg Foundation to properly complete his
graduate study program.
The author had been teaching rural development at the Univer-
sidad of Tolima, Ibague and in the Graduate Program, National
University of Colombia-ICA, at Bogota.
During his stay at Louisiana State University he was nomi
nated to membership in the Honor Society Phi Kappa Phi and the Honor
Society of Agriculture Gamma Sigma Delta.
He is married to Gloria and they have a son, Mauricio Alberto.
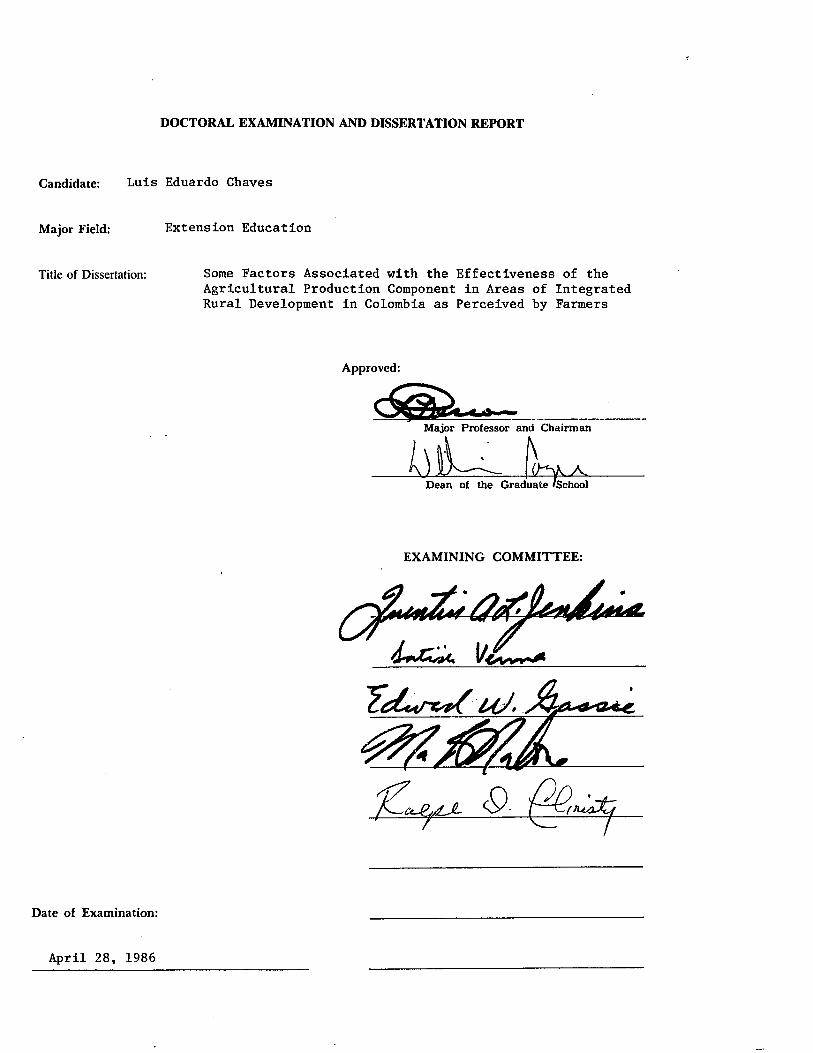
DOCTORAL EXAMINATION AND DISSERTATION REPORT
Candidate: L u is
Major Field:
Title of Dissertation:
Eduardo Chaves
Extension Education
Some Factors Associated with the Effectiveness of the Agricultural Production Component in Areas of Integrated Rural Development in Colombia as Perceived by Farmers
Approved:
Major Professor and Chairman
\
Dean of the Graduate 'School
EXAMINING COMMITTEE:
LjzIc. 14
Date of Examination:
April 28, 1986