Embed Size (px)
Citation preview
Some Considerations for the Design of MicroarrayExperiments
John H. Maindonald, Yvonne E. Pittelkow and Susan R. Wilson
Abstract
Issues relevant for the design of gene expression experiments using spottedcDNA microarrays and gene chip microarrays are overviewed. Emphasis is placedon the uses of replication, and on the importance of identifying major sources ofvariation.
Keywords: microarrays; oligonucleotide; design of experiments; variability; replica-tion; gene expression
1 Introduction
Microarrays are new and evolving technologies that enable large numbers of genes,up to the order of tens of thousands, to be evaluated simultaneously. Our aim is togive a brief overview of principles of experimental design, and to comment on theirapplication to microarray experiments. A major theme is that, for purposes of design,the different sources of variation in gene expression %re not well understood.
The objective of a microarray experiment might be to investigate genes which aredifferentially up or down regulated in cells between, say, a control group and cellswhich have undergone some treatment, or between cells of animals of different geneticbackground {e.g., control mice compared to knockout mice) or between cells in healthytissue and diseased tissues, or between cells at different time points {e.g., developmentalbiology). Many studies search for genes that have similar expression profiles, often inan attempt to determine genes involved in biological pathways, or in development, orgenes involved in regulatory functions. The focus would then be on the analysis ofdependency structure. Time course experiments may investigate how the pattern ofexpression or relative expression changes over the cycle of cell division, or followingadministration of a drug. Finally, interest may be in estimation of gene expressionlevels.
The primary goal of the experiment should be clear, as this gives focus to the in-vestigation, desirable even if a major part of the analysis will be a general search forinteresting patterns of expression. Many experiments have multiple aims; these mustbe prioritized. Both in its scale and in the processes that are under investigation, the
368 1 K Maindonald, Y. E. Pittelkow and S. R. Wilson
biology has a large element of novelty, with implications for statistical design and anal-
ysis. Vingron [52], commenting on the "big science" issues that such large-scale tech-
nologies raise, draws attention to "a major upcoming challenge for the bioinformatics
community to adopt a more statistical way of thinking and to interact more closely with
statisticians." Bioinformaticians need to educate themselves in statistics. "Not so much
with the goal of mastering all of statistics but with the goal of sufficiently educating
ourselves in order to pull in the statisticians."
Our focus here is on design issues for comparative studies for two types of ar-
ray platform - two-channel cDNA spotted microarrays [17, 20, 24], and high density
oligonucleotide microarray chips produced by Afϊymetrix [1] for expression analysis,
which we refer to as gene chip microarrays. For both types of array, DNA sequences
are laid out in a grid on a solid substrate. Occasionally we refer to the spotted microar-
rays as slides, recognising however that glass is just one of several possible substrates,
and we refer to Afϊymetrix oligonucleotide microarrays as chips. Much of our discus-
sion of spotted cDNA microarrays applies also to oligonucleotide spotted microarrays
(distinct from Afϊymetrix oligonucleotide arrays, which are produced by photolithog-
raphy rather than spotting), which we do not explicitly discuss. We note that gene
chip microarrays can in principle, with suitable calibration, yield absolute expression
measures. Each individual spotted microarray slide is by contrast used to yield rela-
tive expression measures, for example between a treatment and a reference, or between
one treatment and another. We note also that, perhaps inevitably for technology that
is rapidly changing and developing, there is no single established nomenclature that
distinguishes clearly between the different types of arrays. A feature that distinguishes
microarray experiments from more conventional experiments described in the biosta-
tistical literature is the very large number of parallel measurements on typically only
a few cases. Summary measurements are typically provided for each of a large num-
ber of genes or of Expressed Sequence Tags (ESTs), which are partial gene sequences.
The small number of cases is, in part, a function of the (initial) high costs of the mi-
croarrays, especially chips, limitation of available sample, and the (apparent) failure
to involve scientists with statistical training in the early stages of the development of
microarrays.
The processing of microarray data raises a variety of statistical, mathematical and
computational issues, see for example [12, 19,45, 47,49]; some of these are alluded to
in passing.
The remainder of the paper is organized as follows: Section 2 gives examples of ex-
periments, Section 3 considers outcome measures, Section 4 notes experimental design
principles and discusses their application to microarray experiments, Section 5 consid-
ers sources of variation, Section 6 discusses the design of microarray slides and chips,
and Section 7 summarizes the discussion.
Design ofMicroarray Experiments 369
2 Examples of Experiments
2.1 Spotted Microarrays
In a typical spotted microarray experiment, samples from a treatment and from a ref-erence are combined in equal proportions and hybridized to cDNA probes that havebeen spotted on a slide. A key question is whether the comparisons that are of interestwill be made directly or indirectly. In an indirect comparison, each treatment that isof interest is compared with a reference sample, and the responses of the treatmentsrelative to this reference sample are then compared. In a direct comparison, treatmentsare directly compared with each other.
For example, Callow et ah [6] used the indirect comparison approach to searchfor genes that were differentially expressed between liver tissue from apolipoproteinapoAI-knockout (test) mice and liver tissue from C57B1/6 (control) mice. Each of 8test mice was compared with the reference sample, and each of 8 control mice was alsocompared with the reference sample. For a reference sample, material from the sameeight control mice was pooled.
For each of the 16 mice, cDNA, labeled to reflect the source of the mRNA, wasprepared by reverse transcription of mRNA. The experiment we describe used Cy5("red") and Cy3 ("green") dyes, with Cy5 for individual mice and Cy3 for the reference.The cDNA from each mouse was combined with the cDNA from the reference sampleand hybridized to a slide. This experiment resulted in 8 comparisons between controlmice and reference, and 8 comparisons between test mice and reference.
Preparation of a spotted microarray slide involves choosing and fixing a large num-ber of spots on a slide, with each spot containing a number of strands of DNA or cDNAthat are intended to uniquely hybridize, or bind, to the corresponding gene in the la-beled cDNA sample. In this experiment around 6000 spots, one or two per gene, werelaid down (spotted) on each of 16 microarray slides (one per "treatment"). After sep-arate labeling, the mixed sample was hybridized to the slide in specially humidifiedchambers. Laser-induced fluorescence imaging was then used to detect dye intensities.This gave two images of the slide, one for the treatment (test or control) and one for thereference. Image analysis software, together with some post-processing, was then usedto derive a background-corrected relative intensity measure for each spot.
Results, for each spot on each of the 16 slides, were expressed as the logarithmof a ratio of the intensity value for each mouse to the intensity value for the pooledreference. Two-sample /-tests, with an adjustment for the large number of comparisonsmade, were then used to compare the log-ratios from the test mice and the control mice.The study identified eight spots, corresponding to four genes, that were under-expressedin test mice relative to controls.

370 1 H. Maindonald, Y. E. Pittelkow and S. R. Wilson
2.2 Gene chip expression microarrays
In a typical gene chip microarray experiment, prepared cRNA sample is hybridized tothe probes on a chip. The chip is then scanned to obtain fluorescence intensity readingsof stains incorporated during the laboratory procedures. Image processing software isthen used to compute intensity values for each probe.
In contrast to typical spotted microarray experiments, only one sample is hybridizedto a chip, allowing, in principle, the estimation of absolute expression values. Becauseof the high cost of these chips, efficient use is important.
The main characteristics of gene chip microarrays are:
1. Thousands of short oligonucleotide probes (commonly 25-mer, i.e., 25 bases inlength) are synthesized in situ on a glass substrate, using photolithographic tech-niques. Multiple paired sets of probes (commonly 11, 16 or 20) are used foreach gene or EST. The probe sequences are chosen according to specific criteriadescribed in Lockhart et al. [35].
2. One probe in a pair has the exact sequence from the gene or EST, while in theother member of the pair the middle base is changed to its complement. The mis-matched probes (MM) provide a probe-specific control or nonspecific hybridi-sation control. The collection of perfect match (PM) probes and mismatchedprobes (MM) corresponding to one gene or EST makes up a probe set.
3. User control over the choice and layout of probes requires the construction ofcustom arrays, whose cost is beyond the resources of many laboratories.
We note that probes are not chosen at random, nor are they independent, althoughsome analyses make this assumption.
In an experiment described by Efron et al [14], the aim was to study transcriptionalresponses to ionising radiation in the context that some cancer patients have severe life-threatening reactions to radiation treatment. It is important to understand the geneticbasis of this sensitivity so that patients with high rates of sensitivity can be identifiedbefore being allocated treatment. The design was a factorial experiment with two levelseach of two factors, namely (i) RNA was taken from two wild-type human lymphoblas-toid cell lines; (ii) the growing state was either irradiated or unirradiated; in additionRNA samples were labeled and divided into two identical aliquots for independent hy-bridizations. Each microarray provided expression estimates for 6810 genes/ESTs.
Another type of gene chip microarray experiment is described by Golub et al. [23].Their aims were essentially class prediction (assigning tumours to known classes) andclass discovery (identifying new cancer classes). They analysed leukemia data of 38bone marrow samples obtained at time of diagnosis: 27 acute lymphoblastic leukemia(ALL) and 11 acute myeloid leukemia (AML).
Design ofMicroarray Experiments 371
3 Issues Concerning Outcome Measures
As noted, spotted microarrays typically yield two intensity measurements for each spot,which are combined into a single ratio or logratio. Gene chip microarrays yield oneintensity measurement for each probe. The information from each probe set is generallycombined into a single expression index for the probe set. The outcome measure is, ineither case, essentially multivariate.
Evidence for the form of the link between expression summary measures and mRNAconcentration (or number of molecules) is sparse; however see [8, 25, 28, 32] for genechip microarrays. When an antibody amplification step is employed, the link is moretenuous, due to nonlinearity in its action. It is important to note that even with replicateslides or chips that use different subsamples from the same sample, and where labora-tory procedures have been carried out as similarly as possible, the scanned images canshow considerable differences. The normalization or scaling techniques that attempt tomake intensity measures comparable between slides or chips are different for the twotechnologies; see [28] for chips, [55] for slides.
Saturation effects, i.e. intensity readings close to or above the upper detection limitof the scanner, are an extreme form of nonlinearity. At high mRNA concentrationor high laser power, all intensity measurements may be inaccurate due to saturation.Where one of two estimates being compared is affected by saturation, the estimateddifference is attenuated. If both are affected by saturation, the difference will be mean-ingless [26]. Due to the large number of genes or probes, each with a potentially dif-ferent saturation level, global avoidance of all such regions may not be feasible, anddetection strategies are required.
For both technologies, negative controls {i.e. spots or probe sets that should nevershow a signal) or positive controls {i.e. should always show a signal), can be usefulchecks.
3.1 Spotted Microarrays
Each slide may be used either for a comparison between treatment and reference, orfor a comparison between two treatments. In either case, there is one intensity ratio orlog-ratio for each spot.
There are typically separate background corrections for the red and the green sig-nals. Both foreground and background signals will differ, depending on the scannersettings and on the image analysis software used [54]. Important considerations arethe identification of the spot boundary, the choice of the region used to estimate back-ground and the form of the background adjustment. Negative intensity estimates thatcan result from background subtraction are a nuisance for later data processing, andshould be avoided.
Ramdas et al. [41] noted that signal quenching associated with excessive dye con-centrations led to nonlinearity in signal intensities. Spot size and morphology can affectintensity measurements. Thus, the routine use of the intensity ratio or logarithm of the
372 J. H. Maindonald, Y. E. Pittelkow and S. R. Wilson
intensity ratio as the comparative expression measure is open to question. If, for ex-ample, the intensity measurements were changing additively, then differences could beused. On the other hand, if the intensity measurements were changing proportionatelythen differences in the log values would be used. Currently this is the scale that iswidely chosen. If there are three (or more) treatments, then an experiment that has allpairwise comparisons allows us in principle to check that the chosen scale is appropri-ate. It is prudent to check, to the extent that this is possible, that measurements are in arange where response is linear.
3.2 Gene chip microarrays
In statistical terms, the data from each chip is a single multivariate response vector,with complex dependencies inherent from the biology and the technology. As men-tioned earlier, generally a summary measure or estimate of expression is computedfrom the multiple probes in each probe set, following suitable background estimationand chip normalization (calibration). A number of different summary measures or ex-pression indices are in use. Some are based on differences between the probe intensity(PM) and its nonspecific hybridization (MM) control; examples include the ASymetrixtrimmed average difference (AvDiff, [1]), the model-based expression indices of Li andWong [33], and the average median filtered differences of Alon et al [2]. Since as manyas a third of the MM control probes can have intensity readings higher than their pairedPM probe, truncation, filtering or transformation are often used to accommodate thenegative values of PM- MM differences. Some measures do not use the nonspecifichybridization control probes except to calculate a background estimate [28, 34, 39].Other possibilities include the log of the ratio of the PM probe to MM probe [1,32, 39],the robust multi-array average (RMA) approach [28], and empirical Bayes estimation[14]. Other summary measures are also found in the biological literature (e.g. [21]).
4 Experimental Design
This section is organized as follows: An introductory subsection discusses aims andprinciples of experimental design, then bias and replication are discussed in more de-tail; 4.1 discusses pooling, which is an issue for both types of array; finally 4.2 discussesspecial issues for spotted microarrays, including the choice between direct and indirectcomparison, and dye bias. There are many excellent texts and papers that discuss gen-eral principles of experimental design, including [5, 9, 10, 15,42, 36]. Here we discussthese in the context of microarrays.
Design questions relevant to the aim of the experiment that should be clear beforeproceeding include:
1. What are the "treatments"?
2. What are the experimental units?
Design ofMicroarray Experiments 373
3. What are the experimental measurements?
4. What is measured, and what do the measurements mean?
5. What comparisons are of interest? (Note that interactions are a form of compari-son.)
For microarray experiments, "treatments" refer not only to defined procedures, forexample treatment by a drug, but also to qualitatively different units, such as tissuesfrom healthy and unhealthy organs, or tissues from wild type model organisms andgenetically modified organisms.
For example, in the Callow et al [6] experiment the comparison was betweentest (knockout) mice and control mice. In the Efron et al. [14] experiment, the maininterest was in the comparison between irradiated and unirradiated cells, allowing for apossible difference in effect between cell lines, i.e., for a possible interaction betweenthe irradiation effect and cell line.
Cox and Reid [10, p. 4] define an experimental unit as the "smallest subdivision ofthe experimental material such that any two different experimental units might receivedifferent treatments". The sample may be from a single organism, or it may be a pooledsample of material from several organisms.
In the Callow et al [6] experiment, it is convenient to regard the separate red andgreen labeled samples that are mixed and hybridized onto a slide as a pair of experi-mental units, yielding separate intensity information that will (usually), for analysis, becombined into a single log intensity ratio. In Efron et al [14], the experimental unitsare, strictly, the four separate mRNA samples, each of which is repeated.
A broad over-riding aim of experimental design is to use resources in the mannerthat will best achieve the intended purpose and produce conclusions that are widelyvalid {i.e., that are not restricted to too specific a set of conditions). However, thisneeds to be balanced against the need for simplicity and robustness of design. We be-gin with a list of broad aims and principles of statistical experimental design, usingexperiments with spotted microarrays for illustrative purposes, followed by further dis-cussion of some of the issues. Later, we consider special issues for the design of spottedmicroarray experiments.
Broadly, the aims are to find designs that:
1. Allow generalization of results to the relevant wider population;
2. Avoid bias, or systematic error;
3. Minimize the effects of random error, for a given cost;
4. Allow an assessment of the accuracy of estimates of effects that are of interest;
5. Are robust, in the sense that they will still give useful results even if there areoccasional failures in the experimental protocol, or if some assumptions that mo-tivated the design prove to be false.

374 1 K Maindonald, Y. E. Pittelkow and S. R. Wilson
Basic devices that are available to achieve these aims are:
1. Controlling for all "fixed" effects for which this is possible. For example, theexpression of genes in some tissues will be different depending on whether thetissue is from a male or female;
2. Blocking, or local control, to allow an accurate assessment of effects under vary-ing experimental conditions. In two-channel spotted microarray experiments,each pair of samples is a block. In general, it is desirable to match the treatmentand control samples as closely as possible;
3. Randomisation of treatment allocations with respect to factors that cannot becontrolled. For example, in a two channel spotted microarray experiment, it isinherently desirable to randomise the allocation of dyes to treatments, in such away that each treatment occurs equally often with each dye;
4. Replication of experimental units, at least to an extent that an estimate of accu-racy is possible. In principle, replication may be further increased to achieve apre-specified accuracy. Additionally, by reducing the opportunity for one unsat-isfactory replicate to damage results, replication makes experiments more robust;
5. The use of repeats, e.g., repeated spots, within experimental units, where thismakes a useful contribution to reducing variability between experimental units.As with replication of experimental units, this has the additional effect that ex-periments are more robust;
6. Giving first priority in use of experimental resources to controlling the effectsthat have the largest implications for results. For example, once appropriateforms of correction have been applied, the dye effect may, for the present spottedmicroarray technology, be inconsequential; i.e., any remaining bias from thissource may be dwarfed by other sources of variability.
Avoiding Bias
The best way to deal with bias is to modify instrumentation or experimental proceduresto avoid it. Where a bias is associated with instrumentation, it may be possible to findan analytical adjustment that verifiably removes or reduces the bias. If neither of theseapproaches is completely successful, and the necessary information is available, one ofdevices 1-3 above can be used.
A major difficulty in discussing methods of avoiding bias in microarray experimentsis that there is insufficient systematic information available about the biases involved.At present, the exception for spotted microarrays is the bias arising from differencesbetween the dyes used to label the different samples [13]. There is some evidence of dayeffects, i.e. changes in response from one day to another, for both types of microarray.Concerning other sources of bias, until appropriate experiments are performed it might
Design ofMicroarray Experiments 375
be prudent to make the laboratory situations as uniform as possible during the course ofan experiment and to randomise treatment allocation over any potential sources of biasthat are not otherwise controlled.
Replication
A discussion of replication and decisions on the optimal level of replication are inti-mately linked with understanding the sources of error, which we address in a later sec-tion. In the context of replication, it is useful to consider a hierarchy of correspondingvariation, as in Yang and Speed [56], with the following levels:
1. Separate slides/chips to (separately) obtain measurements on samples from dis-tinct biological sources - biological replicates;
2. Separate slides/chips to probe each of several replicate preparations of RNA fromthe same biological source (sometimes, and rather misleadingly, also referred toas biological replicates);
3. Technical replicates that use distinct slides/chips to obtain measurements on dif-ferent target samples of RNA from the same preparation;
4. For spotted microarrays, replicate spots on the slide.
Biological replication is essential when the intention is to make claims about abroader population of patients, plants or animals. Since biological organisms can varysubstantially, such replication would be necessary even if the measurement device gaveexactly reproducible results when repeated on an individual. Note in this context thebroad distinction between technical reproducibility and biological reproducibility. Notealso that in the above hierarchy, variation at any lower level contributes to variation atall higher levels.
Since the reasons for replication are not transparent to all, we repeat them here inthe microarray context: (i) to allow generalization to the wider biological population(and replication at the biological level is essential for this); (ii) to provide informationthat will make it possible to do a better experiment next time; (iii) to reduce varia-tion (and increased replication at the biological level will certainly do this, but maybe an unnecessarily expensive method if a similar improvement could be achieved byincreased replication further down the hierarchy); (iv) to allow identification of majorsources of variability, in the hope that something might be done about some of them(and in this context we might want to consider crossed, i.e. nonhierarchical, sources ofvariation); (v) to allow identification of outliers, at levels where that may be important;(vi) to make experiments more robust.
The calculation of the number of replicates required to be able to detect a differenceof a given size (power calculations) is challenging in microarray experiments, not onlybecause the newness of the field means that even rough guides to variance estimates for
376 1 H. Maindonald, Y. E. Pittelkow and S. R. Wilson
given probe sequences are unknown but also because estimates will change betweenprobe sequences.
Above, we distinguish "technical replicates" from biological replicates. Whenreplication is used to reduce variance (because analysis can be based on the mean orother summary measure) it is important that the replicates be as independent as possible.For example, using different sample preparation hybridized to chips/slides is probablypreferable here to using duplicate chips/slide but the same mRNA sample.
At least for spotted microarrays, a further level of replication is possible, namelyreplicate spots on the same slide, as recommended in Tseng et al. [51]. However, theplacement of these duplicate spots needs to be carefully considered to avoid potentialsystematic bias; see Yang and Speed [56]. Removal of one apparently contaminatedspot may enable remaining spots to be used in further analysis [51].
For gene chip microarrays, limited available sample material and the relatively highcost of chips often limit the number of biological or technical replicates. While notingthat there are no firm standards on the number of replicates required in a microarraychip experiment, Novak et al. [40] mention that they commonly design their initial ex-periments to include three replicates for each biological state, including control. Li andWong [33] recommend 10 replicates for estimating standard errors used for detectingoutliers in gene chip microarray studies. Glynne at at [22] recommend between twoand five replicates.
The value of replication in a spotted microarray experiment was shown by Lee et al.[31] who, limiting their attention to the red signal, carried out an experiment in which32 out of 288 genes were expected to be strongly expressed, while the remaining genesshould not have been expressed. They used a mixture model to identify genes that wereexpressed. Although the assumptions required for their analysis can be questioned,their qualitative conclusion holds, in particular that results from individual replicatesare unreliable, and of unknown accuracy. With two replicates, there is some indicationof the extent of irreproducibility; however, Lee et al recommend doing at least threereplicates.
In general, and depending on the tissue, experiments with human tissue are likelyto require more extensive replication than experiments with tissue from highly inbredstrains of laboratory animals.
Multiple independent estimates of treatment effects
Designs that allow multiple independent estimates of treatment effects may allow re-duced replication, or even no replication. For example, for spotted microarrays considerthe "all possible pairs" experimental design with three treatments A, B and C. Thereare two estimates of the contrast between A and B: one that is obtained directly bycomparing B with A, and the other that is obtained by subtracting the A versus C effectfrom the B versus C effect. Thus, if each pairwise comparison is made only once, thereis one degree of freedom that can be used for the estimation of "noise"; we prefer this
Design of Microarray Experiments 377
term to the commonly used term "error". If the design has two replicates of each of thethree two-way comparisons, there are four degrees of freedom for estimation of noise.
With four or more treatments, there are several alternatives to designs in which allcomparisons are with a reference. The design that has each of the six possible com-parisons between four treatments has three degrees of freedom for estimation of noisefor evaluating each treatment comparison. An alternative is the loop design [30] thatcompares A with B, B with C, C with D, and D with A. This design has one degreeof freedom for estimation of noise. The comparisons that must be made indirectly, be-tween A and C and between B and D, are on average less precise than the comparisonsthat can be made directly. Where there are many treatments, some comparisons in aloop design will involve many links, with a consequent loss of precision. Modifica-tion of loop designs to add comparisons that avoid many connecting links is thereforedesirable.
Considerations that will affect the choice between the different designs include:the number of slides that are required; the precision of the comparisons that are ofchief interest; the amount of available mRNA, for treatments and where relevant for thereference; the robustness of the design; and the ease of carrying out the analysis.
Factorial designs
Following the structuring of comparisons in terms of main effects and interactions offactors, it may be possible to incorporate into the noise term high order interactionsthat are not statistically significant, thus increasing the available degrees of freedom forestimating the relevant noise variance. This should be considered at the design stage,although often it is left to the analysis stage.
For example, Efron et al [14] used an initial exploratory analysis to satisfy them-selves that the effect of radiation was similar for both levels of cell line, for bothaliquots. Hence, they felt able to assume that the three interactions involving irradiationwere zero, giving three degrees of freedom for estimating the relevant noise variance.This does, however, ignore the implications for variance structure of the nesting thatarises from the way that aliquots were formed in this experiment, namely by splittingsamples in two.
For a general discussion of factorial design issues, see Cox [9, pp.94-96] and CoxandReid[10,pp.99-101].
4.1 Pooling - an issue for both technologies
If there is insufficient RNA from the tissues under investigation from one individual,then it is common practice to prepare RNA from, say, several individuals from a pure(inbred) line, kept as far as possible in a common environment. Other reasons forpooling include provision of adequate quantities of a standard that can be maintainedconsistently over time, and to "reduce" variation. An alternative to pooling is am-plification. Depending on how it is done, however, amplification can bias abundance
378 J. H. Maindonald, Y. E. Pittelkow and S. R. Wilson
relationships [4, 29]. At the same time amplification can, for spotted microarrays, leadto results that are more consistent between slides.
A concern is that pooling might increase or modify potential masking effects thatmay arise from the hybridization of RNA to itself or to other strands of RNA. Self-hybridization is an aspect of secondary structure as described in Zuker [57]. Con-sistently with comments in Yang and Speed [56], we have been unable to find directexperimental evidence on this point. If masking is not a serious problem and poolingis indeed a form of averaging, then it should be used wherever possible, for treatmentsas well as for any control. Replication will then require the use of replicate pooledsamples, with different individuals used for the different pooled samples. Or is poolingperhaps more problematic for treatment samples than for reference samples, e.g., forknockout or transgenic organisms? There is a clear demand for better knowledge ofeffects at this level.
For gene chip microarray experiments, Novak et al. [40] suggested that poolingto reduce biological variation is of limited value. On the other hand, Bakay et al. [3]concluded that pooling is of value. Such conflicting claims are due, in part, to thedifferent methods used to examine variability, but the issue is clearly unresolved.
4.2 Some special issues for spotted microarrays
The issues that we discuss here are special to spotted microarrays because each slidegives comparative information - either between two treatments, or between a treatmentand a reference.
The design used by Callow et al. [6], described above, is analogous to the conven-tional completely randomised design. Note that the use of a common reference samplecreates a correlation between the two sets of comparisons with the reference. Addition-ally, for this experiment one of the comparisons is between the reference and individualmouse samples that are correlated with the reference. An alternative is a design inwhich each slide gives a direct comparison between a test mouse and a control mouse.Such a direct comparison will, with 8 slides, be more precise than the indirect compar-ison that used 16 slides, while requiring less mRNA from each control mouse and thesame amount of mRNA from each test mouse. Often, though not in the Callow et al..experiment, the comparison with reference will have intrinsic interest. The choice isthen between the design that has all pairwise comparisons, and the design that has onlythe comparisons between treatments and reference.
We have noted that a direct paired comparison of the two treatments should be moreprecise than the indirect comparison (see also Dudoit et al [13]; Yang and Speed [56];Kerr and Churchill [30]). Applying such a design to the Callow et al. experiment,each slide compares a test mouse with a control mouse. A consequence of the corre-lations alluded to above is that, as demonstrated in [50], the improvement in precisionis not as great as a naive analysis might suggest. Paired comparison designs are a sim-ple type of block design, with each pair of samples (mice) that are compared forminga block. Readers who are familiar with classical experimental design will recognise
Design ofMicroarray Experiments 379
this as a "paired comparison" experiment, though now with many such comparisonsmade using a single slide. Fisher [15] discusses such experiments. They are the sub-ject of David's [11] book; see also Cox [9]. These designs have been widely used infood tasting and other sensory evaluation experiments [18]. They are a special case ofmore general balanced incomplete block designs. For technical details, see Yang andSpeed [56] who also discuss and compare many different experimental designs.
The precision of the comparisons that are of interest is not the only consideration.Depending on the experimental context and aim, the experiment in which all compar-isons are with a baseline has the following merits: assuming that dye bias affects allcomparisons with the reference equally, though perhaps differently for different probesequences, the swapping of dyes is unnecessary; the comparison between treatmentsand reference may have an intrinsic interest of its own; limitations in the amount ofavailable mRNA, for one or all of the treatments, may require the use of a design thatcompares treatments with a reference [56]; use of a reference that is common overdifferent experiments allows treatment effect comparisons across those experiments.
Dye bias
It is now well known that the dye bias varies nonlinearly with the average intensity ofthe signals [13]. The loess correction, which is one of several corrections that Dudoit etal. [13] discuss, seems to work well, but like other such corrections can at best ensurethat the bias over all spots is on average reduced to zero. It is in principle possiblethat the strength of the binding may vary with the sequence of bases to which the dyebinds, thus leading to variation between different differentially expressed genes. Acautious approach therefore requires the routine use of dye flips, i.e., each dye occursequally often with each treatment. This allows an analysis that averages out any biasthat remains after the correction.
5 Sources of Variation
The following scheme, adapted from Cox and Reid [10, p. 10], gives a frameworkfor discussion of sources of variation in microarray experiments. Inevitably, it cannotcapture the complex ways in which sources of variation may interact:
1. Intrinsic or baseline noise (or "error"), i.e., variation that is inherent in the sub-jects of the experiment
(a) Errors associated with the biological, genetic/environmental sources (e.g.SNP or different animals or cultures)
(b) Errors associated with hybridization process (which may be probe depen-dent);
380 J. H. Maindonald, Y. E. Pittelkow and S. R. Wilson
2. Intermediate noise, i.e., variation associated with the process that leads fromtreatment to response
(a) Laboratory (RNA extraction, amplification and labeling)
(b) Biological sample sources (tissue, homogeneity, contamination);
3. Measurement error, i.e., error associated with the instrumentation
(a) Chip/slide manufacture (including for spotted microarrays the size and shapeof spots)
(b) Scanning
(c) Algorithms, including the image processing and scaling procedure used
(d) Defects arising in the manufacturing process, or in the subsequent handling
of slides or chips.
References addressing these sources of variation include [25,28, 32, 37,38, 39,40,46,56].
A hierarchy of levels of variation can be envisaged, as detailed in Yang and Speed [56],and might be formalized in a multi-level model, with components of variance attachedto each level of the hierarchy. Such models provide a useful framework for thinkingabout sources of noise, and in addition have a role in the examination of the effects ofindividual genes. They allow us, e.g., to compare the improvement in precision thatarises from the use of multiple spots for the one probe sequence with the improvementfrom increased technical or biological replication, a point that is demonstrated in thenext section. We note that from its beginning, the analysis of variance has been multi-level; see Speed [48]. Many of the models that Fisher [15] analysed had multiple levelsof variation.
From a design perspective, we require an estimate of technical variability becausewe wish to know the contribution that it makes to the variability of biological mea-surements. Where technical variability is a substantial component, it will be necessaryto break it down further, so that we can identify the major sources of noise and takewhatever steps are possible to reduce their effect. For a variety of biological and tech-nical measurement reasons, the relative contributions of different noise sources mayvary between probe sequences.
Note that:
1. There are several different components of the experimental procedure. If one ofthese components is, relative to the others, a major component of the variation,attempts should be made to identify it;
2. Comparisons made within individuals, e.g., a cell line from an individual versusa knockout cell line created from the same individual, can be more precise thanwhen the sample and the knockout sample are from different individuals. Experi-mental procedure becomes more than ever important for controlling the variationthat remains;
Design ofMicroarray Experiments 381
3. If interest is in getting an accurate estimate of variation, for purposes of general-izing (e.g., to mice generally of a particular strain), then the demand is for repeatresults from several individuals, i.e., for genuine biological replication. Then al-though the standard errors of treatment comparisons can be estimated, it will notbe possible to distinguish between variation that arises from experimental pro-cedure and the effects of variation between individuals. The distinction betweenthese two sources of variation may be useful in deciding whether effort on theimprovement of laboratory procedure is justified.
6 The Design ofMicroarray Chips and Slides
There are two aspects of microarray experiment design - the design of the array/chip,and the allocation of the mRNA samples to the array/chip. Because the fabrication ofa custom gene chip is expensive, most users accept one of a set of standard gene chipmicroarray designs. By contrast, users of spotted microarrays do often design their ownslides. They then face important issues that include the choice of genes (or ESTs), thenumber of repeats of each probe sequence, and the relative positioning of repeats. Inaddition, each gene may be represented by more than one probe sequence. A majoradvantage of fabricated oligonucleotide sequences, for spotted arrays as well as forchips, is in the opportunities that they offer for selecting and testing probe sequences.This is an important ongoing research area, which is however beyond the scope of thispaper; we refer the reader to Rouillard et al [44].
The remaining discussion will comment on the number and possible prioritizationof genes represented on the slide or chip, and the use of repeats. Our comments have di-rect relevance to cDNA microarray slides, where there is ordinarily one probe sequence,perhaps repeated, for each gene or EST, but the principles are general.
Many probes, or few probes
It is tempting to include as many probes for genes as possible on a slide. However, asthe number of different genes represented on the slide increases, so also does the po-tential for false positives when, say, analysing a comparative experiment. To avoid thissituation, the criteria for establishing differential expression becomes more stringentfor statistical tests as the number of tests are increased. For example a / critical valuethat equals 2.1 for a single /-test (for a single gene) may, depending on the adjustmentused and on the choice of reference distribution, increase to 4.5 when there are 5000such tests.
An attractive design option can be to divide probes into two groups - a smaller"likely" group, and a much larger "possible" group. Statistical comparisons can then bedone separately for the two groups, with a much less stringent criterion for establishingdifferential expression used for probes in the smaller group. The highest priority forthe use of repeated spots will be given to the smaller group of genes chosen for careful
382 1 K Maindonald, Y. E. Pittelkow and S. R. Wilson
scrutiny. Such a classification of genes into two groups builds in prior knowledge, with
implications for the subsequent statistical inference.
Repeated spots
What is the effect on precision from repeating probes multiple times on a single slide,
by comparison with repeating slides?
Writing mt, for the between array mean square, and mw for the within array mean
square, and with k spots per probe sequence, and assuming a simple form of multi-level
model where the between spots (within array) component of variance is σ 2 , while the
between array component of variance is σ 2, it follows that:
E[mb] =
E[mw] = σ 2 .
Thus E[mb]/E[mw] equals 1 if o\ = 0, and is otherwise greater than one.
The variance of the mean x over all k spots on each of n slides is
n kn
If al = 0, then var[x] = g^, and the repeating of spots is just as effective, for increasing
precision, as the repeating of slides.
The Callow et al. [6] data are interesting in this connection. Out of 5544 non-blank
spots, 175 were duplicates of the same probe sequence, while 6 were triplicates. For
each of these probe sequences, we can thus use an analysis of variance calculation to
determine both a within array (between spot) mean square, and a between array mean
square.
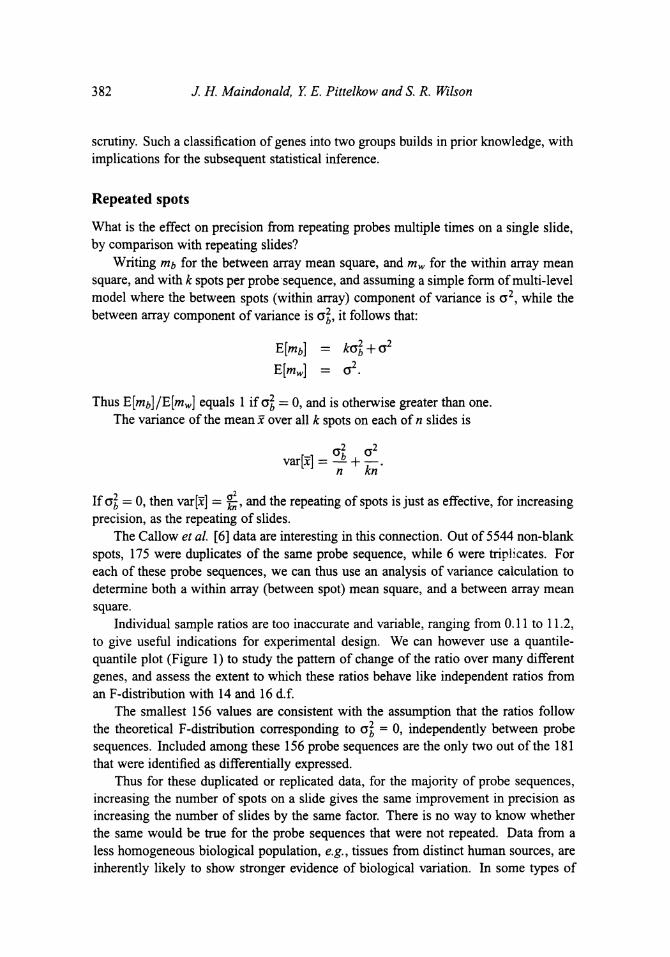
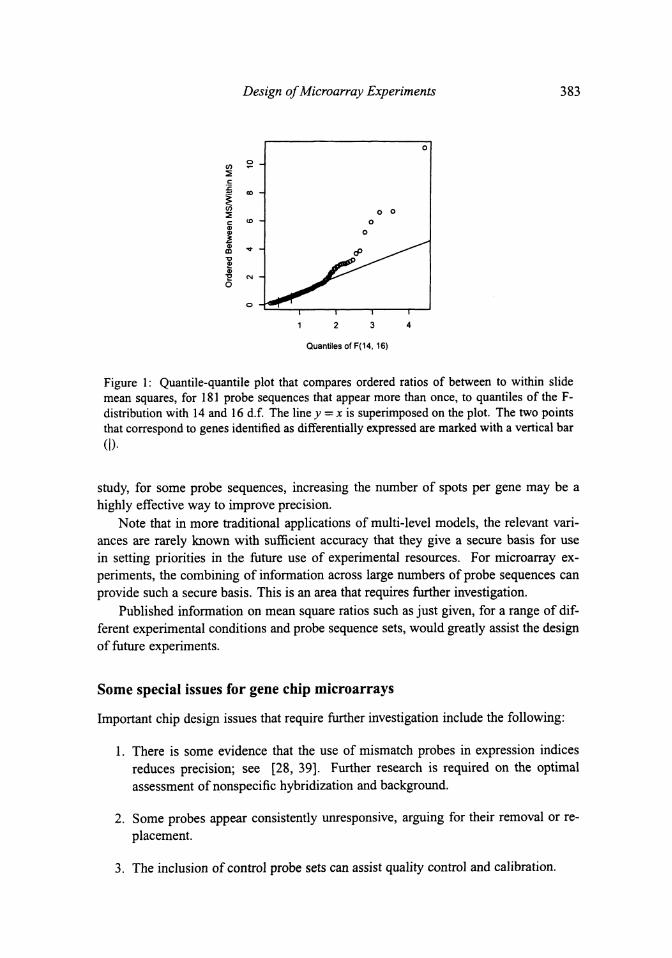
Individual sample ratios are too inaccurate and variable, ranging from 0.11 to 11.2,
to give useful indications for experimental design. We can however use a quantile-
quantile plot (Figure 1) to study the pattern of change of the ratio over many different
genes, and assess the extent to which these ratios behave like independent ratios from
an F-distribution with 14 and 16 d.f.
The smallest 156 values are consistent with the assumption that the ratios follow
the theoretical F-distribution corresponding to o\ = 0, independently between probe
sequences. Included among these 156 probe sequences are the only two out of the 181
that were identified as differentially expressed.
Thus for these duplicated or replicated data, for the majority of probe sequences,
increasing the number of spots on a slide gives the same improvement in precision as
increasing the number of slides by the same factor. There is no way to know whether
the same would be true for the probe sequences that were not repeated. Data from a
less homogeneous biological population, e.g., tissues from distinct human sources, are
inherently likely to show stronger evidence of biological variation. In some types of
Design ofMicroarray Experiments 383
(f) *-
§
1 2 3 4
QuantilesofF(14,16)
Figure 1: Quantile-quantile plot that compares ordered ratios of between to within slidemean squares, for 181 probe sequences that appear more than once, to quantiles of the F-distribution with 14 and 16 d.f. The line y = x is superimposed on the plot. The two pointsthat correspond to genes identified as differentially expressed are marked with a vertical bar
study, for some probe sequences, increasing the number of spots per gene may be ahighly effective way to improve precision.
Note that in more traditional applications of multi-level models, the relevant vari-ances are rarely known with sufficient accuracy that they give a secure basis for usein setting priorities in the future use of experimental resources. For microarray ex-periments, the combining of information across large numbers of probe sequences canprovide such a secure basis. This is an area that requires further investigation.
Published information on mean square ratios such as just given, for a range of dif-ferent experimental conditions and probe sequence sets, would greatly assist the designof future experiments.
Some special issues for gene chip microarrays
Important chip design issues that require further investigation include the following:
1. There is some evidence that the use of mismatch probes in expression indicesreduces precision; see [28, 39]. Further research is required on the optimalassessment of nonspecific hybridization and background.
2. Some probes appear consistently unresponsive, arguing for their removal or re-placement.
3. The inclusion of control probe sets can assist quality control and calibration.
384 J. K Maϊndonald, Y. E. Pittelkow and S. R. Wilson
In designing experiments, consideration should be given to the inclusion of "spikes"
of known concentration in the sample, to allow for more accurate normalization be-
tween chips.
7 Discussion
While statistical methodology is now seen as an important part of microarray exper-
iments, its penetration into this area remains, in many respects, superficial. This is
especially true for experimental design. Effort at the design phase of a microarray ex-
periment will often save considerable effort and frustration at the analysis stage; see
Yang and Speed [56] for further discussion. Good experimentation can be seen as a
sequential learning process in that what has been learned from one experiment can con-
tribute to the design of the next experiment.
This paper outlines many of the issues that require consideration when designing
a microarray experiment. There has been emphasis on replication and sources of error
because of their pivotal role in analysis and subsequently inference. For example, in
a comparative experiment researchers should consider that an observed difference is
'real' only if it is greater than what could be expected by chance. The estimate of the
size of that difference is a function of all the noise that has contributed to the difference,
and is obtained from replicates. Too often, the need for replication has been overlooked
in microarray experiments. Yet recall Fisher's [16] comment over seventy years ago
concerning plant experimentation:
No one would now dream of testing the response to a treatment by com-
paring two plots, one treated and the other untreated.
It is unusual when measuring with, say, a tape measure, to make replicate measure-
ments on the same object. The accuracy of the instrument is commonly high relative to
the variability of the object that is measured. Hopefully, technological improvements
will lead to arrays with correspondingly high levels of technical reproducibility. In the
meantime, there are large potential gains that may come from a better understanding
both of the technology and of quantitative aspects of gene expression. Experiments that
will assist in an understanding of the technical characteristics of this methodology and
the sources of variation and bias should be a priority.
Combining information from the different platforms and laboratories also is im-
portant (see, for example, Glynne et al. [22]). As yet, we are not aware of studies
that directly investigate the extent to which results from a microarray experiment can
be reproduced by other workers in other laboratories. If, however, results from some
microarray studies point in one direction and some in another, it may be necessary to
undertake a statistical overview analysis, or meta-analysis, such as is done in clinical
medicine (see for example, Chalmers and Altman [7]). In a related context, Ionnidis
et al [27] examined the extent to which genetic association studies stand up when re-
peated by other researchers, and found that results from the first study often suggest
Design ofMicroarray Experiments 385
a stronger effect than is found in later studies, and show poor correlation with subse-
quent research on the same association. This observation may be in part a manifestation
of the so-called "file drawer problem" [43], that positive results are more likely to be
published than negative results. Epistatic effects such as are discussed in Wilson [53]
provide another likely explanation.
The challenges that arise from the massively parallel measurement of gene expres-
sion are new. At the analysis stage, what choice of designs will ease the task of in-
terpreting and summarizing the potentially huge number of individual results? This is
clearly an area for further research. Meanwhile, we recommend the use of designs that
are both reasonably robust against unexpected behavior, and that are also capable of
revealing effects that have not been anticipated.
Acknowledgements
We thank Dr. Aude Fahrer, Dr. Matthew Wakefield and the anonymous referee for
helpful comments, which led to several improvements.
John H. Maindonald, Centre for Bioinformation Science, Mathematical Sciences In-
stitute and John Curtin School of Medical Research, Australian National University,
Canberra ACT 0200, Australia, j ohn. maindonald@anu. edu. au
Yvonne Pittelkow, Centre for Bioinformation Science, Mathematical Sciences Institute
and John Curtin School of Medical Research, Australian National University, Canberra
ACT0200, Australia, [email protected]
Susan Wilson, Centre for Mathematics and its Applications, Mathematical Sciences
Institute and Centre for Bioinformation Science, Mathematical Sciences Institute and
John Curtin School of Medical Research, Australian National University, Canberra
ACT 0200, Australia, sue. wilson@anu. edu. au
References
[1] Afϊymetrix. Asymetrix Microarray Suite User Guide, Version 4 edition.
Afϊymetrix, Santa Clara, CA.
[2] U. Alon, N. Barkai, D. A. Notterman, K. Gish, D. Mack S. Ybarra, and A. J.
Levine. Broad patterns of gene expression revealed by clustering analysis of tumor
and normal colon tissues probed by microarray chips. Proceedings of the National
Academy of Sciences, USA, 96:6745-6750, 1999.

386 J. H. Maindonald, Y. E. Pittelkow and S. R. Wilson
[3] M. Bakay, Y.-W. Chen, R. Borup, P. Zhao, K. Nagaraju, and E. P. Hoffman.Sources of variability and effect of experimental approach on expression profilingdata interpretation. BMC Bioinformatics, 3:4, 2002.
[4] L. R. Baugh, A. A. Hill, E. L. Brown, and C. P. Hunter. Quantitative analysis ofmRNA amplification by in vitro transcription. Nucleic Acids Research, 29(5):e29,2001.
[5] G. Box, W. Hunter, and S. Hunter. Statistics for Experimenters. Wiley, New York,1978.
[6] M. J. Callow, S. Dudoit, E. L. Gong, and E. M. Rubin. Microarray expressionprofiling identifies genes with altered expression in HDL-deficient mice. GenomeResearch, 10:2022-2029, 2000.
[7] I. Chalmers and D. G. Altman. Systematic Reviews. BMJ Publishing Group,London, 1995.
[8] E. Chudin, R. Walker, A. Kosaka, S. X. Wu, D. Rabert, T. K. Chang, and D. E.Kreder. Assessment of the relationship between signal intensities and transcriptconcentration for Affymetrix GeneChip® arrays. Genome Biology, 3(l):re-search0005, 2001.
[9] D. R. Cox. Planning of Experiments. Wiley, New York, 1958.
[10] D. R. Cox and N. Reid. Theory of the Design of Experiments. Chapman and Hall,London, 2000.
[11] H. A. David. The Method of Paired Comparisons. Oxford University Press, NewYork, 1988.
[12] S. Dudoit, Y H. Yang, and B. Bolstad. Using R for the analysis of DNA microar-ray data. RNews, 2:24-32, 2002. h t tp : / / c ran .R-pro jec t .o rg /doc /Rnews .
[13] S. Dudoit, Y H. Yang, M. J. Callow, and T. P. Speed. Statistical methods for iden-tifying differentially expressed genes in replicated cDNA microarray experiments.Statistica Sinica, 12:111-140, 2002.
[14] B. Efron, R. Tibshirani, J. D. Storey, and V. Tusher. Empirical Bayes analysis of amicroarray experiment. Journal of the American Statistical Association, 96:1151—1160, 2001.
[15] R. A. Fisher. The Design of Experiments. Oliver and Boyd, Edinburgh, 1935; 7thedition 1960.
[16] R. A. Fisher and J. Wishart. The arrangement of field experiments and the statisti-cal reduction of the results. Imperial Bureau of Soil Science (London). TechnicalCommunication, 10:1-23, 1930.
Design ofMicroarray Experiments 387
[17] S. H. Friend and R. B. Stoughton. The magic of microarrays. Scientific American,286:34-39, 2002.
[18] M. D. Gacula and J. Singh. Statistical Methods in Food and Consumer Research.Academic Press, Orlando, FL, 1984.
[19] R. Gentleman and V. Carey. Bioconductor. Open source bioinformatics using R.RNews, 2:11-17, 2002. h t tp : / / c ran .R-pro jec t .o rg /doc /Rnews .
[20] G. Gibson and S. V. Muse. A Primer of Genome Science. Sinauer Associates,Madison, WI, 2001.
[21] R. J. Glynne, S. Akkaraju, J. I. Healy, J. Rayner, C. C. Goodnow, and D. H.Mack. How self-tolerance and the immuno-suppressive drug FK506 prevent B-cell mitogenesis. Nature, 403:672-676, 2000.
[22] R. J. Glynne, G. Ghandour, and C. C. Goodnow. Genomic-scale expression anal-ysis of lymphocyte growth, tolerance and malignancy. Current Opinion in Im-munology, 12:210-214, 2000.
[23] T. R. Golub, D. K. Slonim, P. Tamayo, C. Huard, M. Gaasenbeek, J. P. Mesirov,H. Coller, M. L. Loh, J. R. Downing, M. A. Caligiuri, C. D. Bloomfield, and E. S.Lander. Molecular classification of cancer: Class discovery and class predictionby gene expression monitoring. Science, 286:531-537, 1999.
[24] P. Hegde, R. Qi, K. Abernathy, C. Gay, S. Dharap, R. Gaspard, J. Earle-Hughes,E. Snesrud, N. Lee, and J. Quackenbush. A concise guide to cDNA microarrayanalysis. Biotechniques, 29:548-562, 2000.
[25] A. A. Hill, E. L. Brown, M. Z. Whitley, G. Tucker-Kellogg, C. P. Hunter, and D. K.Slonim. Evaluation of normalization procedures for oligonucleotide microarraydata based on spiked cRNA controls. Genome Biology, 2(12):research0055, 2001.
[26] L.-L. Hsaio, R. V. Jensen, T. Yoshida, K. E. Clark, J. E. Blumenstock, and S. R.Gullans. Short technical report: Correcting for signal saturation errors in theanalysis of microarray data. Biotechniques, 32:330-336, 2002.
[27] J. P. A. Ioannidis, E. E. Ntzani, T. A. Trikalinos, and D. G. Contopoulos-Ioannidis.Replication validity of genetic association studies. Nature Genetics, 29:306-309,2001.
[28] R. A. Irizzary, B. Hobbs, F. Collin, Y. D. Beazer-Barclay, K. J. Antonellis,U. Scherf, and T. P. Speed. Exploration, normalization, and summaries of highdensity oligonucleotide array probe level data. Biostatistics, 2002. In press.
[29] N. N. Iscove, M. Barbara, M. Gu, M. Gibson, C. Modi, and N. Winegarden. Rep-resentation is faithfully preserved in global cDNA amplified exponentially fromsub-picogram quantities of mRNA. Nature Biotechnology, 20:940-943, 2002.
388 J. H. Maindonald, Y. E. Pittelkow and S R. Wilson
[30] M. K. Kerr and G. A. Churchill. Experimental design for gene expression mi-croarrays. Biostatistics, 2:183-201, 2001.
[31] M.-L. T. Lee, F. C. Kuo, G. A. Whitmore, and J. Sklar. Importance of repli-cation in microarray gene expression studies: statistical methods and evidencefrom repetitive cDNA hybridizations. Proceedings of the National Academy ofSciences, USA, 97:9834-9839, 2000.
[32] W. T. Lemon, J. T. Palatini, R. Krahe, and F. A. Wright. Theoretical and ex-perimental comparisons of gene expression estimators for oligonucleotide arrays.Bioinformatics, 18:1470-1476, 2002.
[33] C. Li and W. Wong. Model-based analysis of oligonucleotide arrays: Expressionindex computation and outlier detection. Proceedings of the National Academy ofSciences, USA, 98:31-36, 2001.
[34] C. Li and W. Wong. Model-based analysis of oligonucleotide arrays: Model val-idation, design issues and standard error application. Genome Biology, 2:1-11,2001.
[35] D. J. Lockhart, H. Dong, M. C. Byrne, M. T. Follettie, M. V. Gallo, M. S. Chee,M. Mittmann, C. Wang, M. Kobayashi, H. Horton, and E. L. Brown. Expres-sion monitoring by hybridization to high-density oligonucleotide arrays. NatureBiotechnology, 14:1675-1680, 1996.
[36] J. H. Maindonald. Statistical design, analysis and presentation issues. NewZealand Journal of Agricultural Research, 35:121-141, 1992.
[37] J. Mar and S. Grimmond. A review of image analysis software for spotted mi-croarray s. Technical Report, 2002.
[38] J. C. Mills and J. I. Gordon. A new approach for filtering noise from high-density oligonucleotide microarray datasets. Nucleic Acids Research, 29(15):e72-2,2001.
[39] F. Naef, D. A. Lim, N. Patil, and M. O. Magnasco. From features to expres-sion: High density oligonucleotide microarray analysis revisited. LANL e-printphysics/0102010. To appear in the Proceedings of the DIMACS Workshop onAnalysis of Gene Expression Data, 2001.
[40] J. P. Novak, R. Sladek, and T. J. Hudson. Characterization of variability in large-scale gene expression data: Implications for study design. Genomics, 79:104—113,2002.
[41] L. Ramdas, K. R. Coombes, K. Baggerly, L. Abruzzo, W. E. Highsmith, T. Krog-mann, S. R. Hamilton, and W. Zhang. Sources of nonlinearity in cDNA microar-ray expression measurements. Genome Biology, 2(ll):research0047, 2001.
Design of Microarray Experiments 389
[42] G. K. Robinson. Practical Strategies for Experimenting. Wiley, New York, 2000.
[43] R. Rosenthal. The "file drawer problem" and tolerance for null results. Psycho-logical Bulletin, 86:638-641, 1979.
[44] J.-M. Rouillard, C. J. Herbert, and M. Zuker. Oligarray: genome-scale oligonu-cleotide design for microarrays. Bioinformatics, 18:486-^487, 2001.
[45] G. Sawitzki. Quality control and early diagnostics for cDNA microarrays. RNews, 2:6-9, 2002. h t tp : / / c ran .R-pro jec t .o rg /doc /Rnews .
[46] E. Schadt, C. Li, C. Su, and W. H. Wong. Analyzing high-density oligonucleotidegene expression array data. Journal of Cellular Biochemistry, 80:192-202, 2000.
[47] G. K. Smyth, Y. H. Yang, and T. P. Speed. Statistical issues in cDNA microarraydata analysis. In Functional Genomics: Methods and Protocols. Humana Press,2002.
[48] T. P. Speed. What is an analysis of variance? Annals of Statistics, 15:885-910,1987.
[49] T. P. Speed. Statistical Analysis of Gene Expression Microarray Data. CRC Press,2002. In press.
[50] T. P. Speed and Y. H. Yang. Direct versus indirect designs for cDNA microarrayexperiments. Technical Report #616, 2002.
[51] G. C. Tseng, M.-K. Oh, L. Rohlin, J.-C. Liao, and W.-H. Wong. Issues in cDNAmicroarray analysis: quality filtering, channel normalization, models of variationsand assessment of gene effects. Nucleic Acids Research, 29:2549-2557, 2001.
[52] M. Vingron. Editorial. Bioinformatics needs to adopt statistical thinking. Bioin-formatics, 17:389-390, 2001.
[53] S. R. Wilson. Epistasis. In Encyclopedia of the Human Genome. Macmillan,2003. In press.
[54] Y. H. Yang, M. J. Buckley, S. Dudoit, and T. P. Speed. Comparison of methodsfor image analysis on cDNA microarray data. Journal of Computational andStatistical Graphics, 11:108-136, 2002.
[55] Y. H. Yang, S. Dudoit, P. Luu, D. M. Lin, V. Peng, J. Ngai, and T. P. Speed.Normalization for cDNA microarray data: a robust composite method addressingsingle and multiple slide systematic variation. Nucleic Acids Research, 30(4):el5,2002.
[56] Y. H. Yang and T. P. Speed. Design issues for cDNA microarray expression ex-periments. Nature Reviews, 3:579-588, 2002.

390 1 K Maindonald, Y E. Pittelkow and S. R. Wilson
[57] M. Zuker. Calculating nucleic acid secondary structure. Current opinion in struc-tural biology, 10:303-310, 2000.