Embed Size (px)
Citation preview
SOLVING TWO VARIABLE LINEAR INEQUALITIES
INCLUDING ABSOLUTE VALUE INEQUALITIES
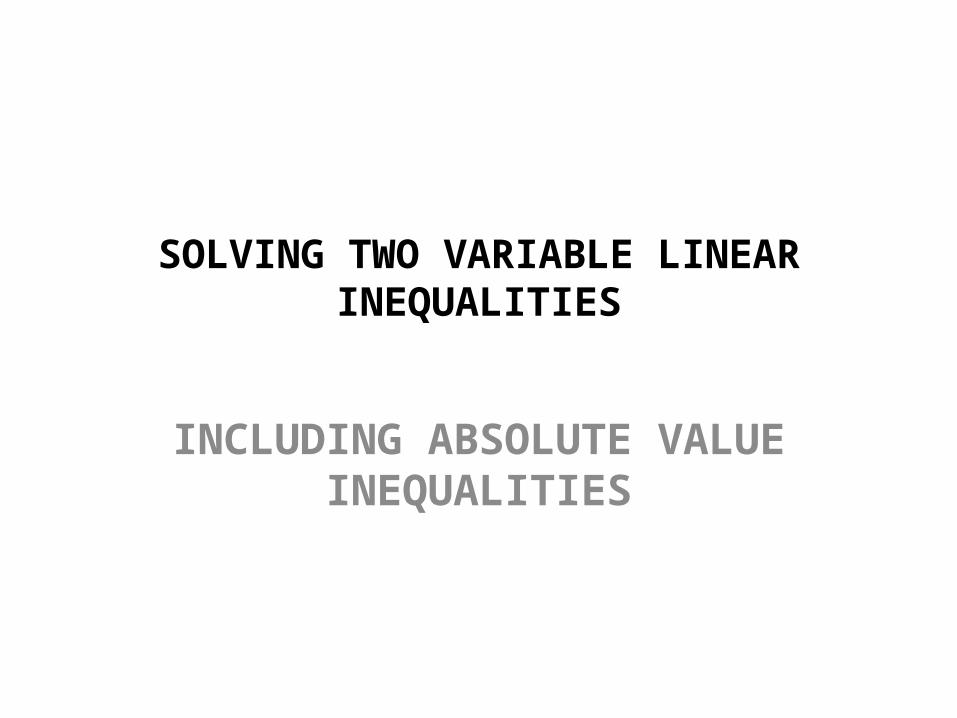
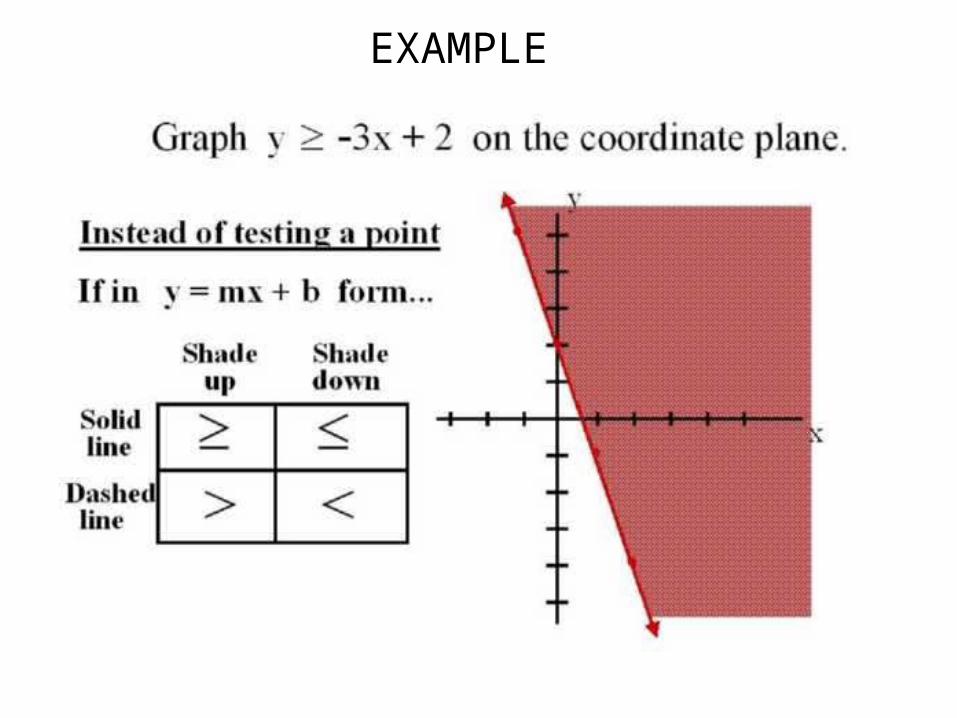
Summary of Inequality Signs
><
><
Continuous line Dashed line
Shade above
the line
Shade below
the line
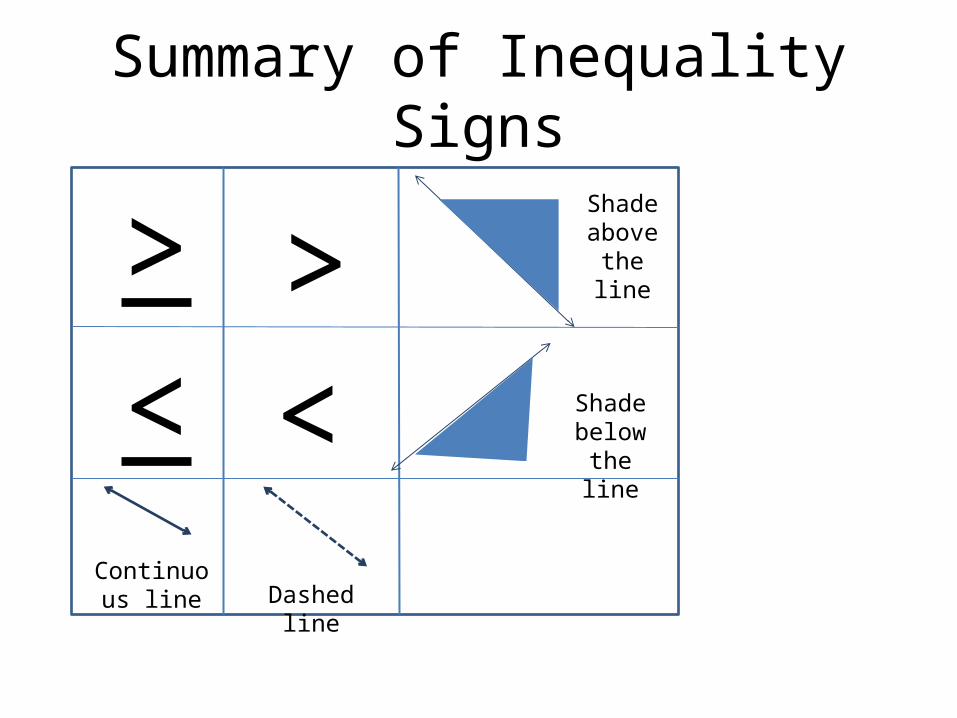
Graphing Linear InequalitiesThe graph of a linear inequality is a region of the
coordinate plane that is bounded by a line. This region represents the SOLUTION to the inequality.
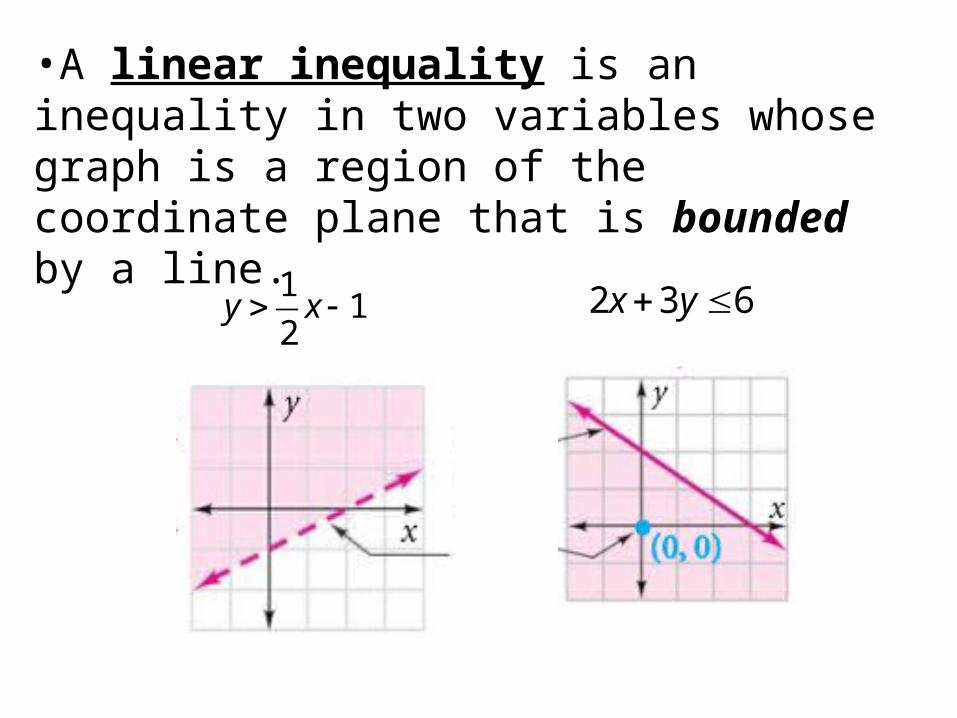
•A linear inequality is an inequality in two variables whose graph is a region of the coordinate plane that is bounded by a line.
11
2y x 2 3 6x y
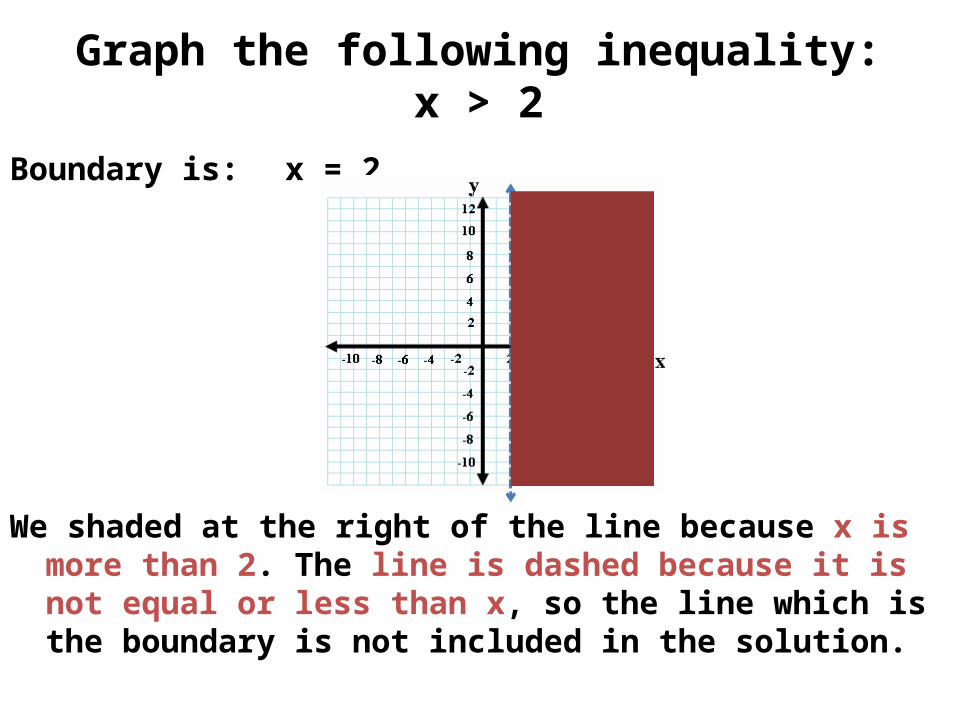
Graph the following inequality:x > 2
Boundary is: x = 2
We shaded at the right of the line because x is more than 2. The line is dashed because it is not equal or less than x, so the line which is the boundary is not included in the solution.
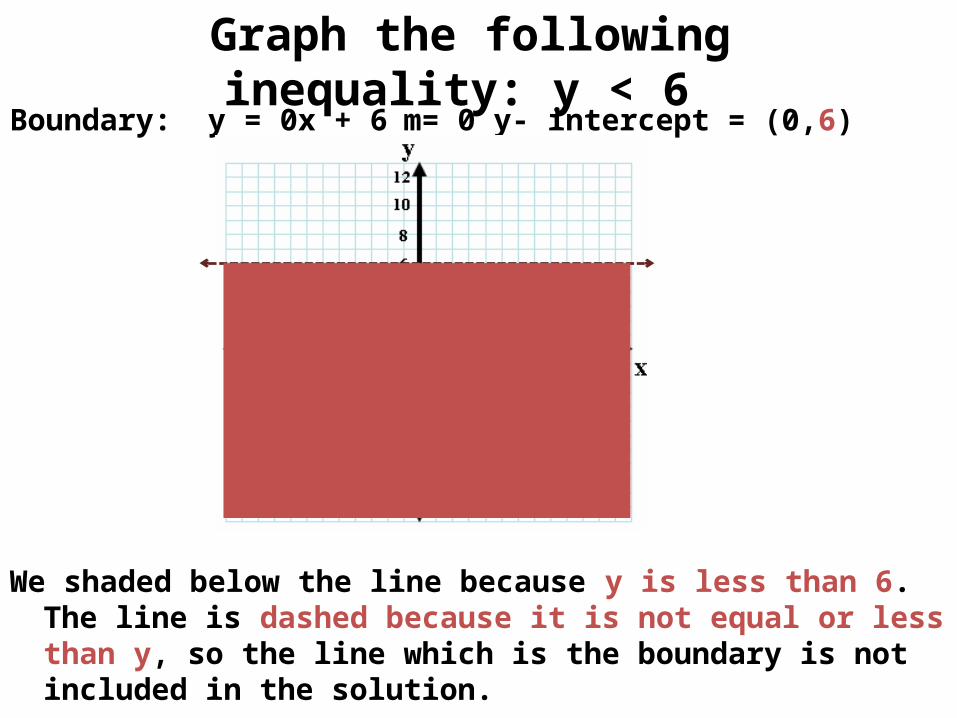
Graph the following inequality: y < 6 Boundary: y = 0x + 6 m= 0 y- intercept = (0,6)
We shaded below the line because y is less than 6. The line is dashed because it is not equal or less than y, so the line which is the boundary is not included in the solution.
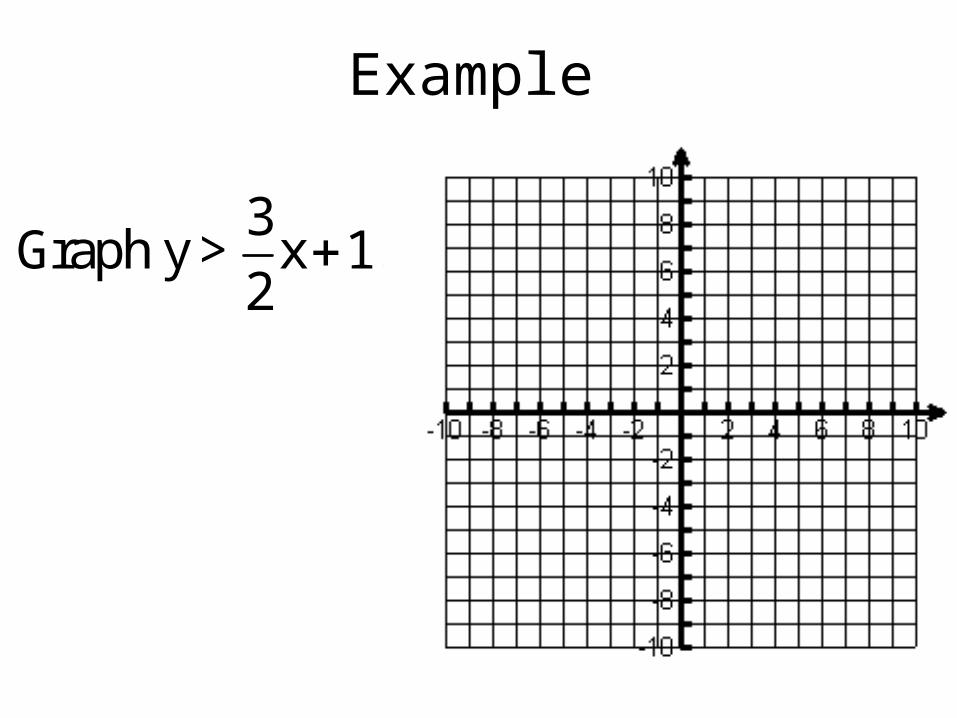
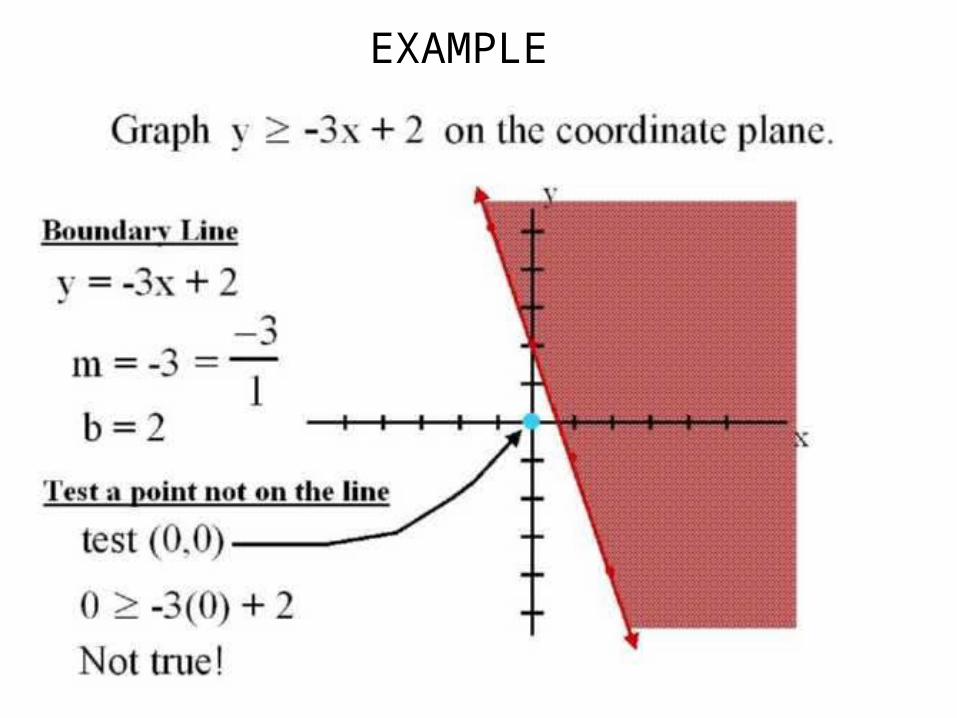
3Graph y > x 1.
2
Example
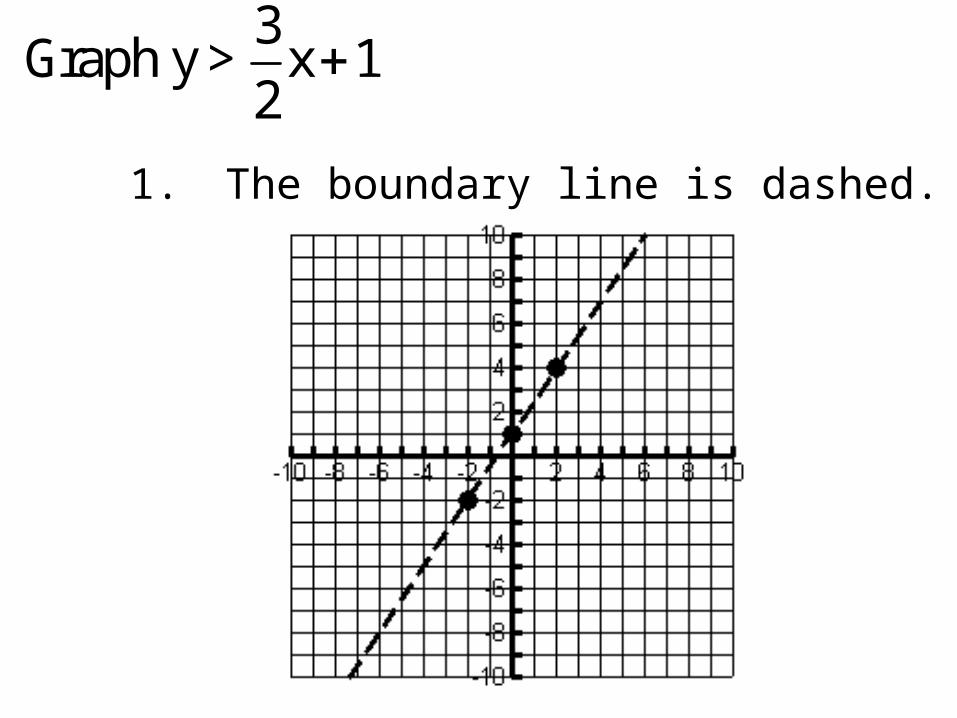
3Graph y > x 1.
2
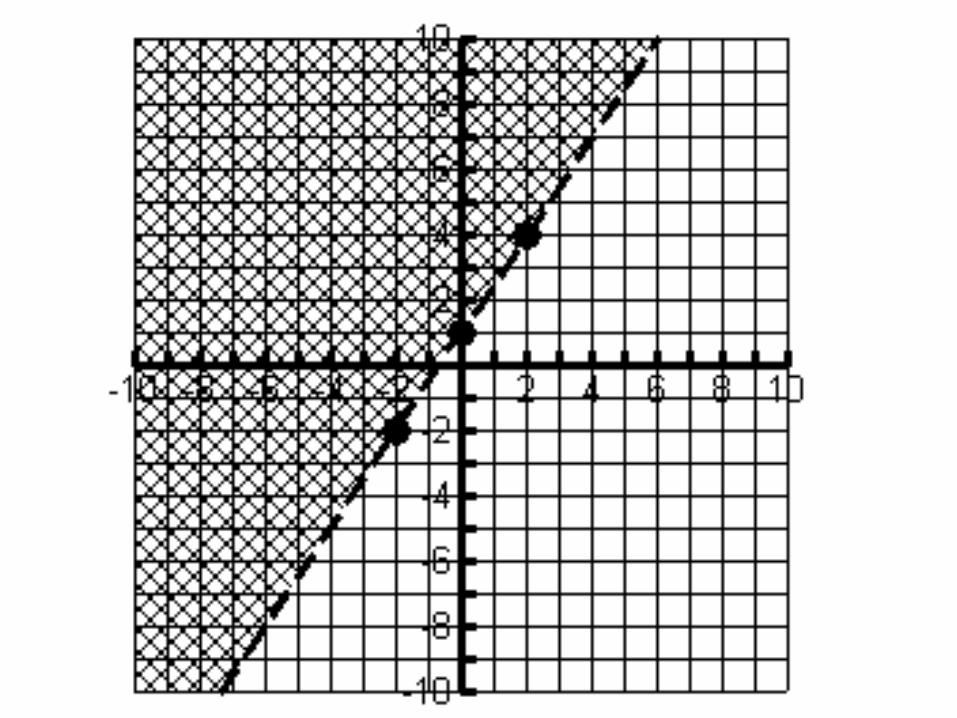
1. The boundary line is dashed.
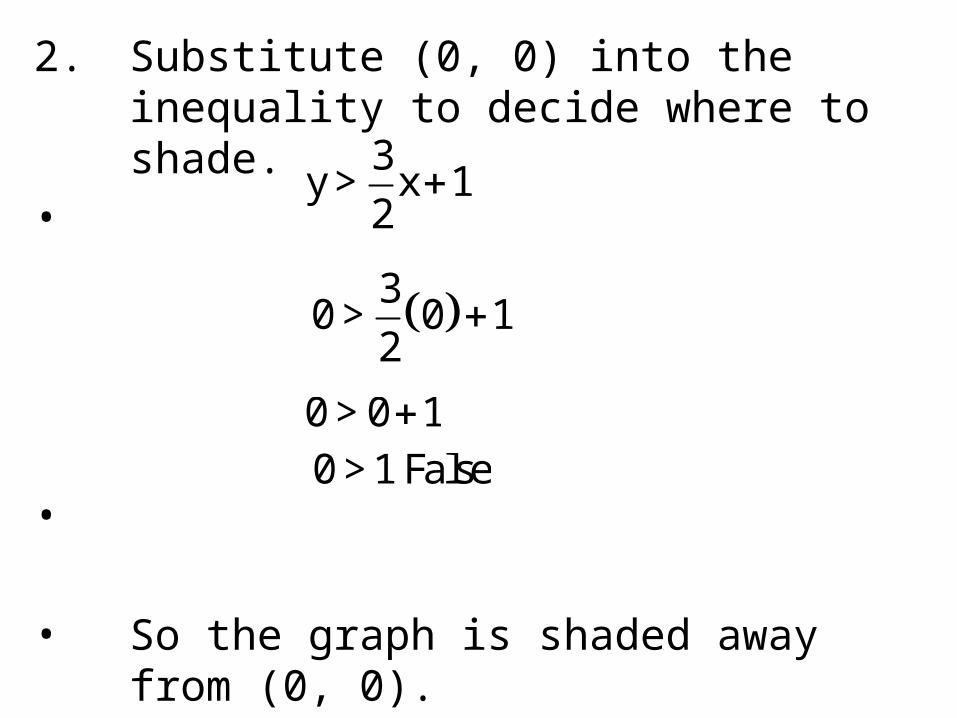
2. Substitute (0, 0) into the inequality to decide where to shade.
•
•
• So the graph is shaded away from (0, 0).
3y > x 1
2
30 > 0 1
2
0 > 0 10 > 1 False
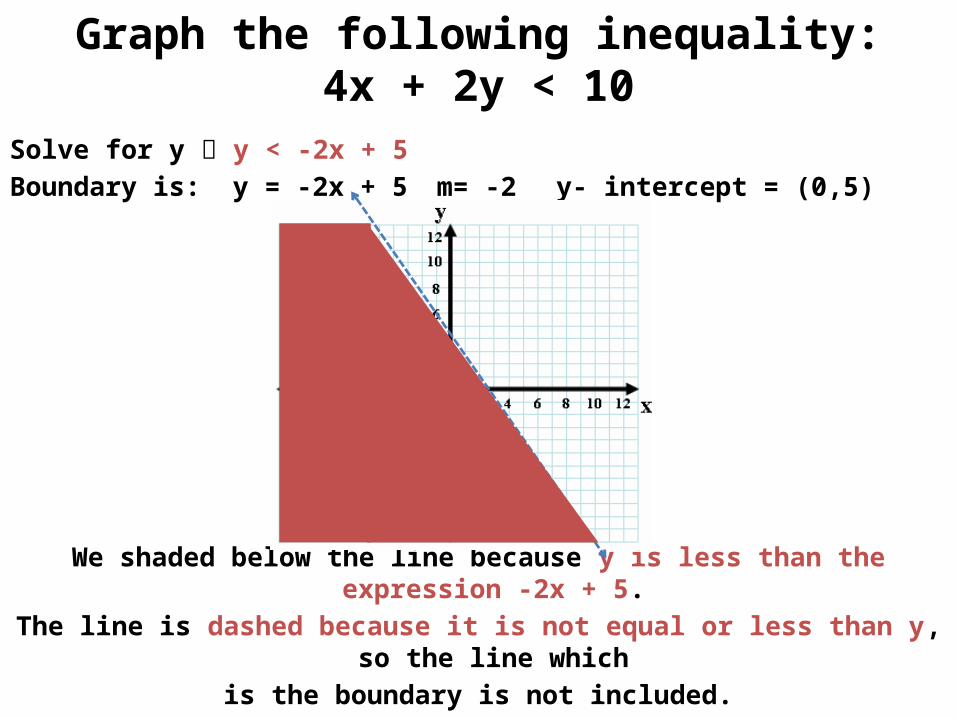
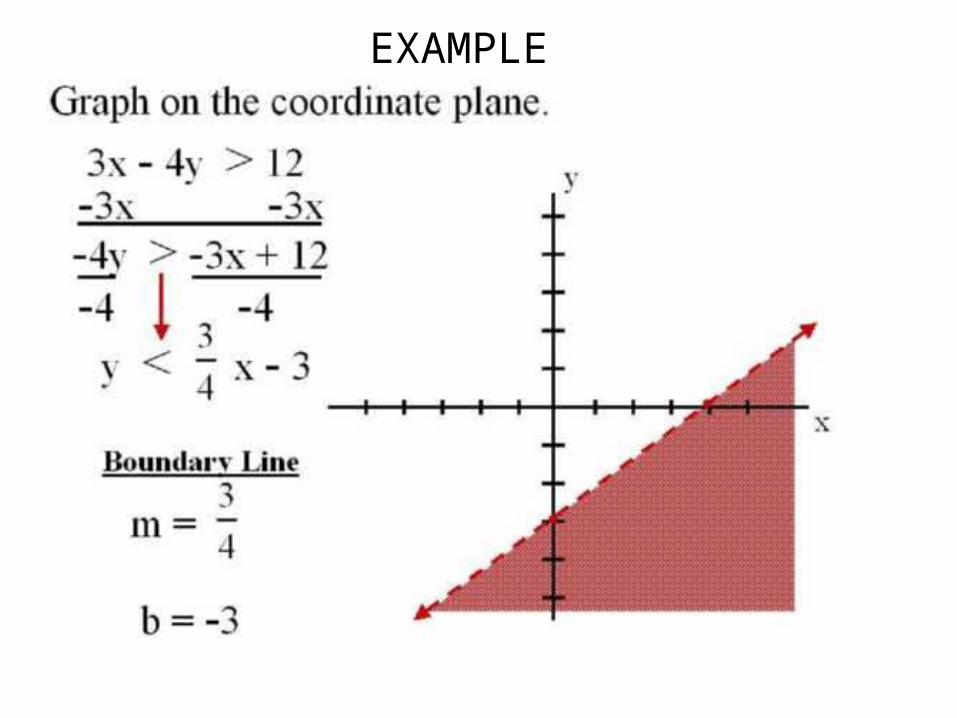
Graph the following inequality:4x + 2y < 10
Solve for y y < -2x + 5Boundary is: y = -2x + 5 m= -2 y- intercept = (0,5)
We shaded below the line because y is less than the expression -2x + 5.The line is dashed because it is not equal or less than y, so the line
whichis the boundary is not included.
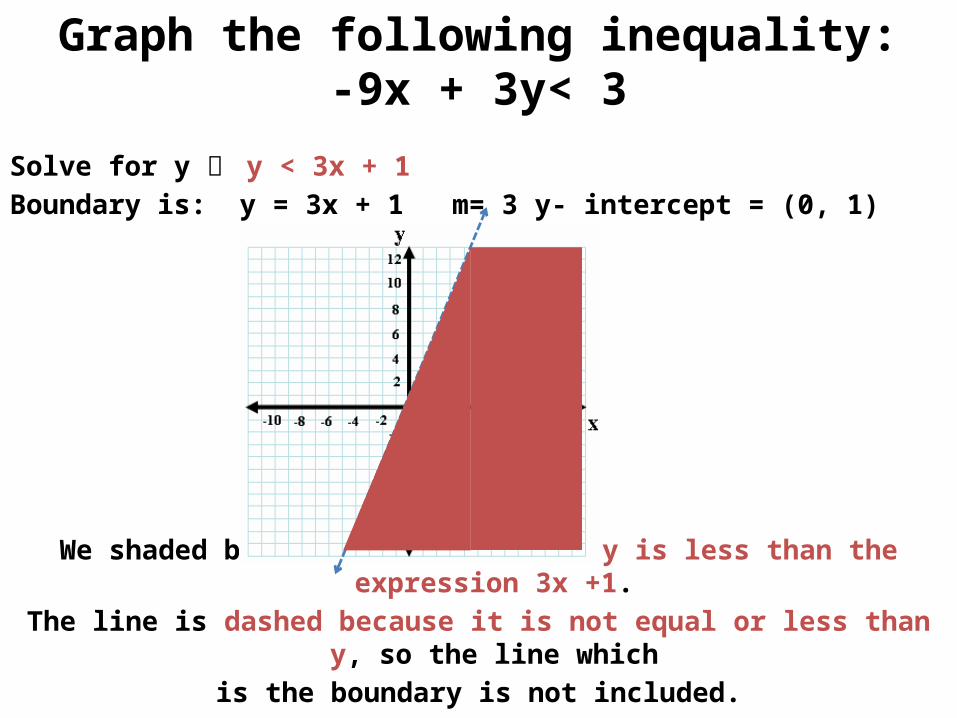
Graph the following inequality:-9x + 3y< 3
Solve for y y < 3x + 1Boundary is: y = 3x + 1 m= 3 y- intercept = (0, 1)
We shaded below the line because y is less than the expression 3x +1.The line is dashed because it is not equal or less than y, so the line which
is the boundary is not included.
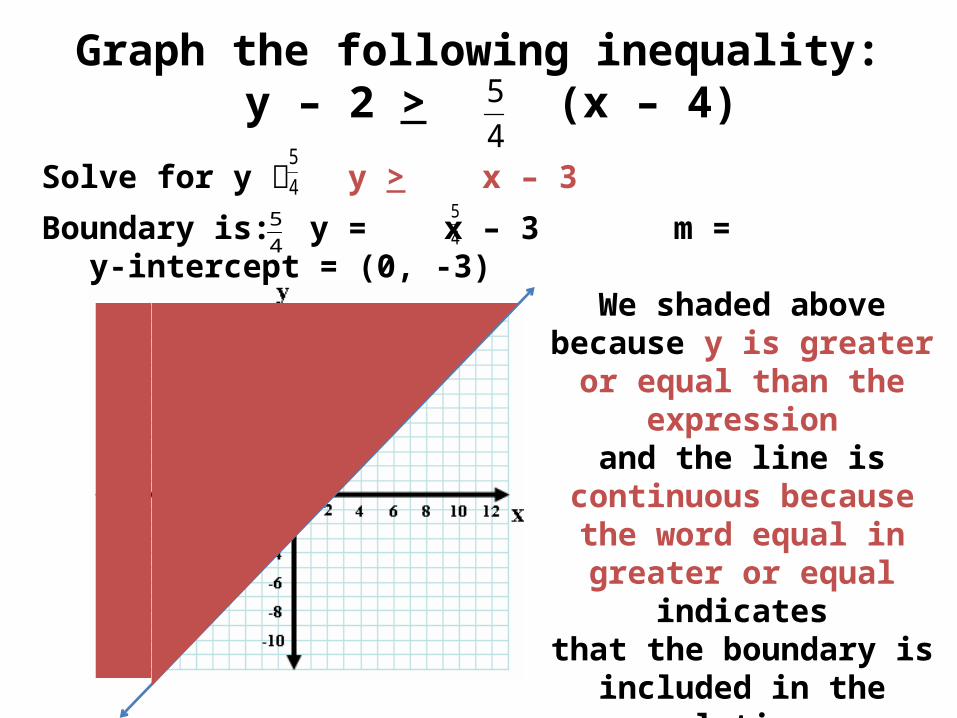
Graph the following inequality: y – 2 > (x – 4)
Solve for y y > x – 3
Boundary is: y = x – 3 m = y-intercept = (0, -3) 4
5
4
5
4
54
5
We shaded above because y is greater or equal than the
expressionand the line is continuous because the word equal in greater or equal indicates
that the boundary is included in the solution.
EXAMPLE
EXAMPLE
EXAMPLE
EXAMPLE
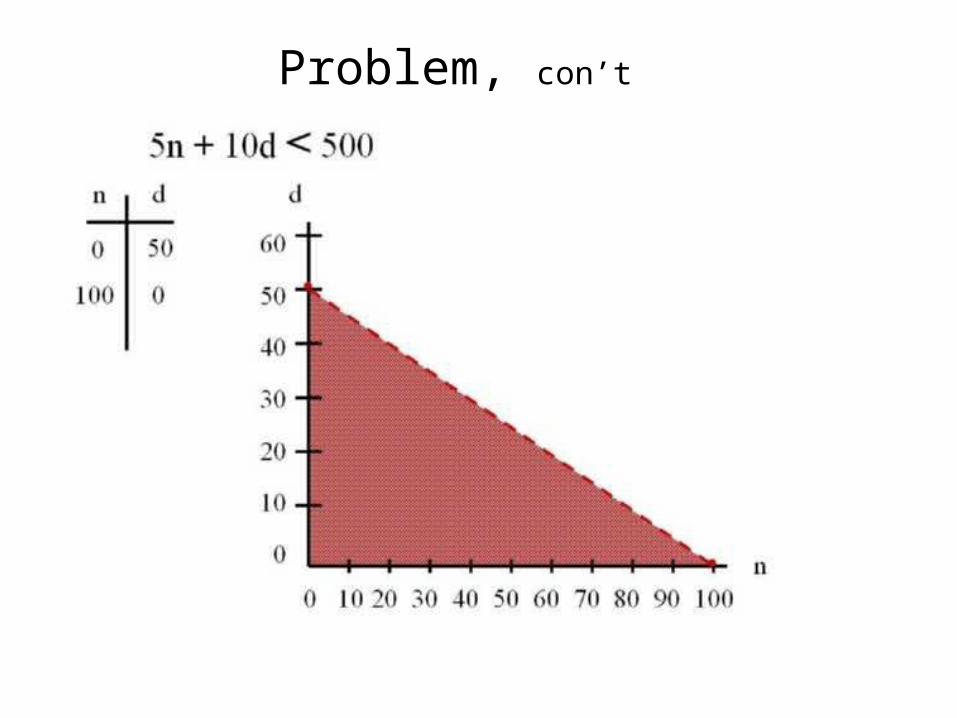
Problem, con’t
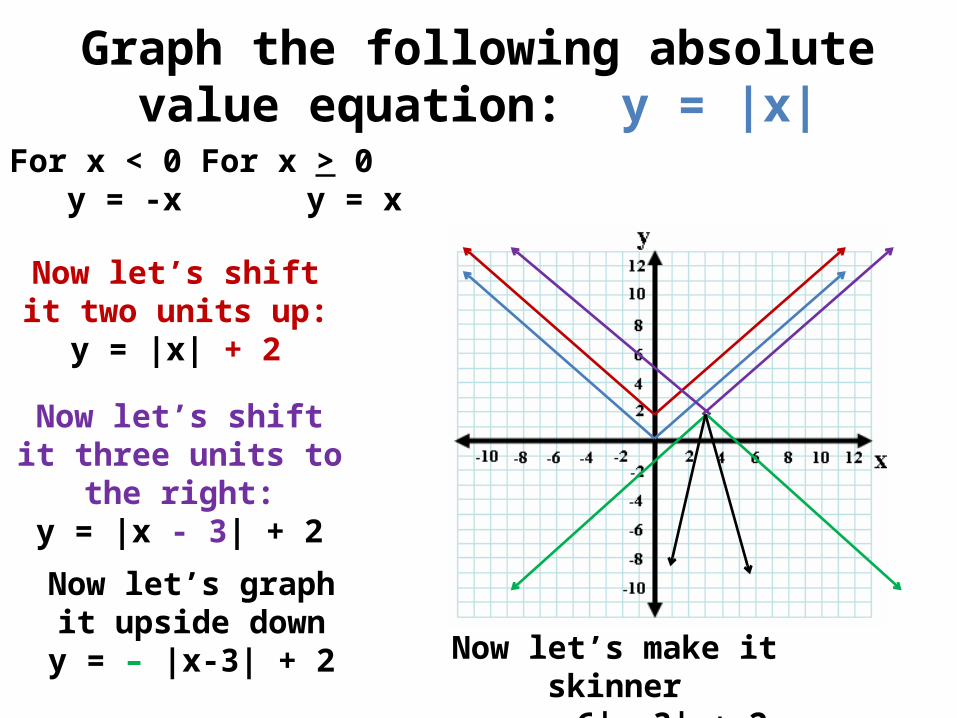
Graph the following absolute value equation: y = |x|
For x < 0 For x > 0 y = -x y = x
Now let’s shift it two units up:
y = |x| + 2
Now let’s shift it three units to the right:
y = |x - 3| + 2
Now let’s graph it upside down
y = – |x-3| + 2 Now let’s make it skinnery = – 6|x-3| + 2
So, that’s how the different parameters in an absolute value equation affect our graph.
Now let’s graph absolute value inequalities.
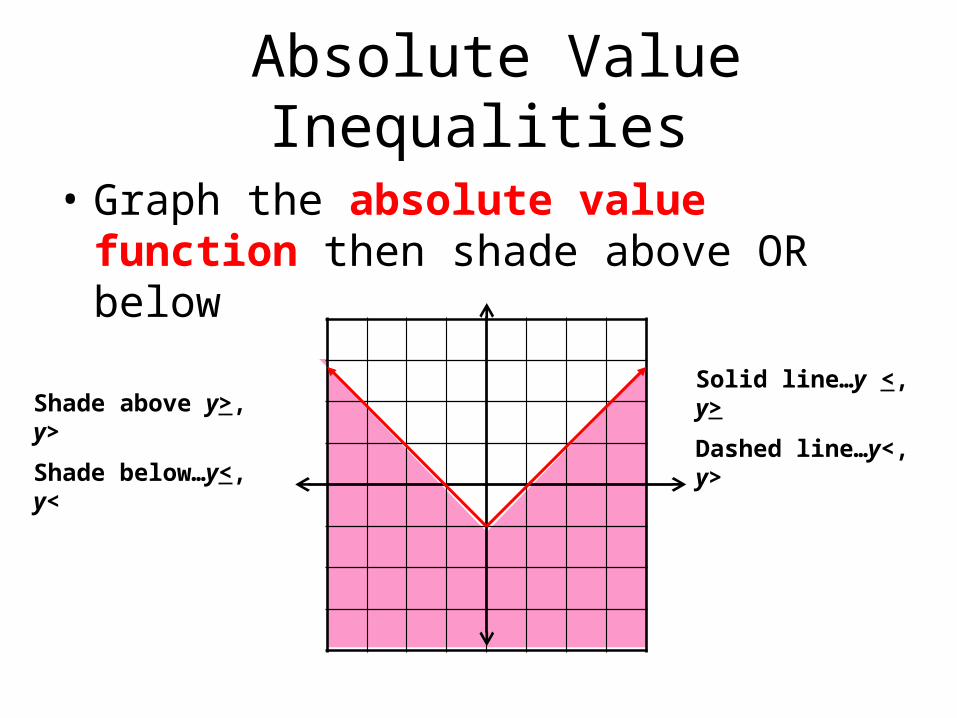
Absolute Value Inequalities
• Graph the absolute value function then shade above OR below
Solid line…y <, y>
Dashed line…y<, y>Shade above y>, y>
Shade below…y<, y<
Absolute Value Inequalities
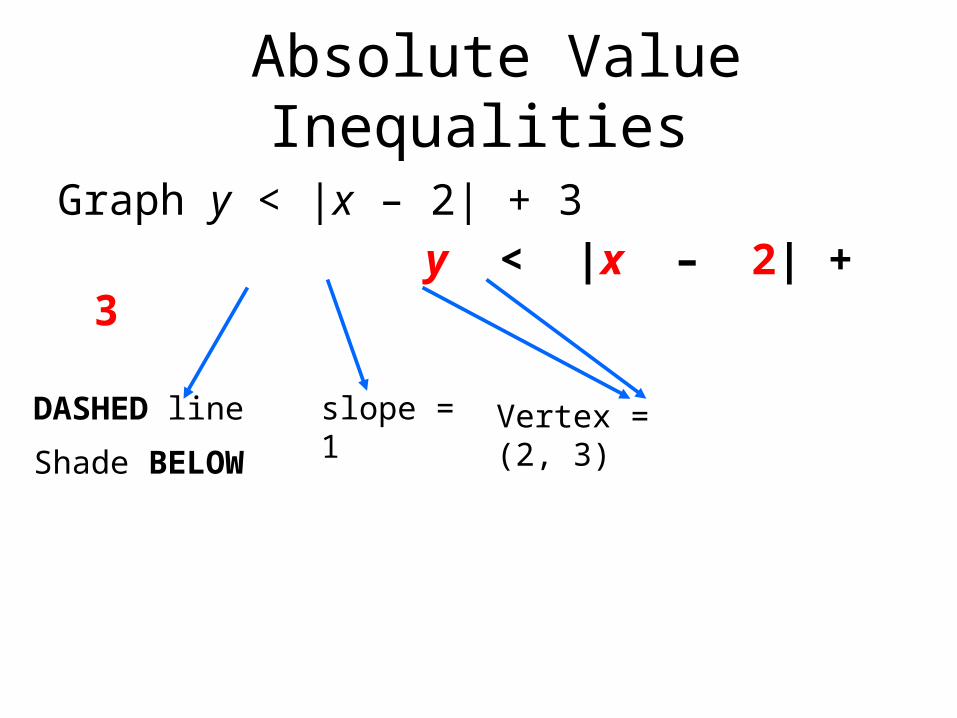
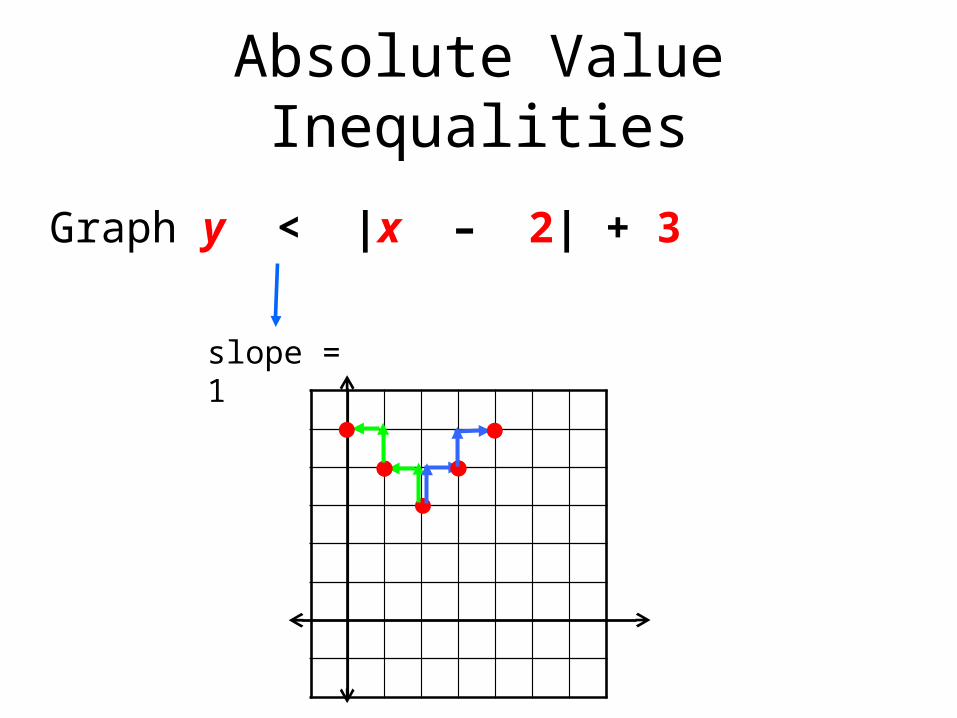
Graph y < |x – 2| + 3 y < |x – 2| + 3
DASHED line
Shade BELOW
slope = 1 Vertex = (2, 3)
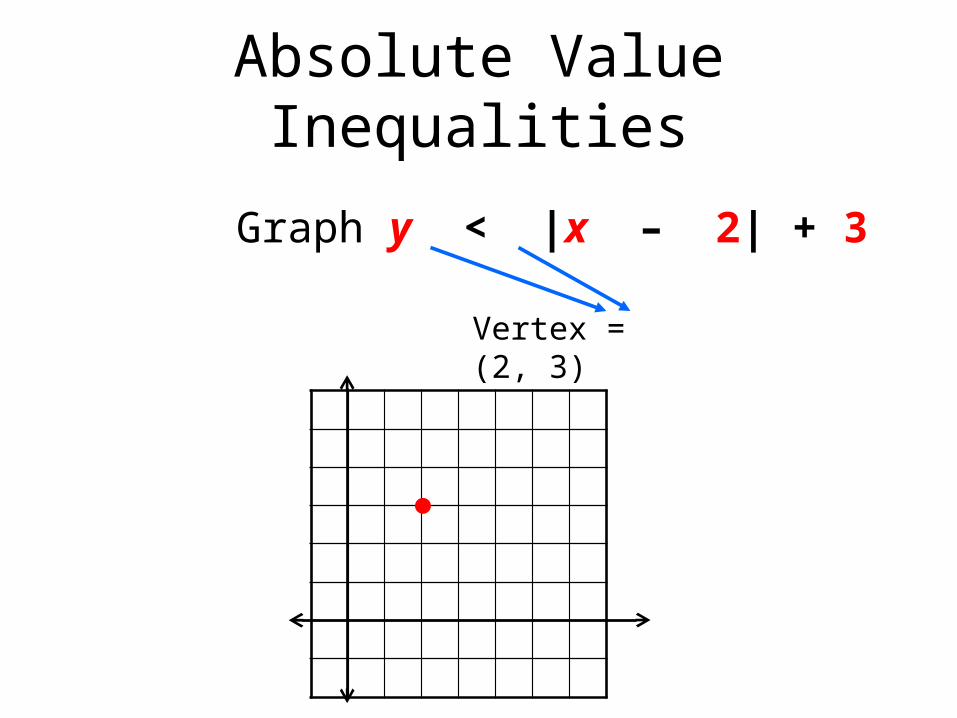
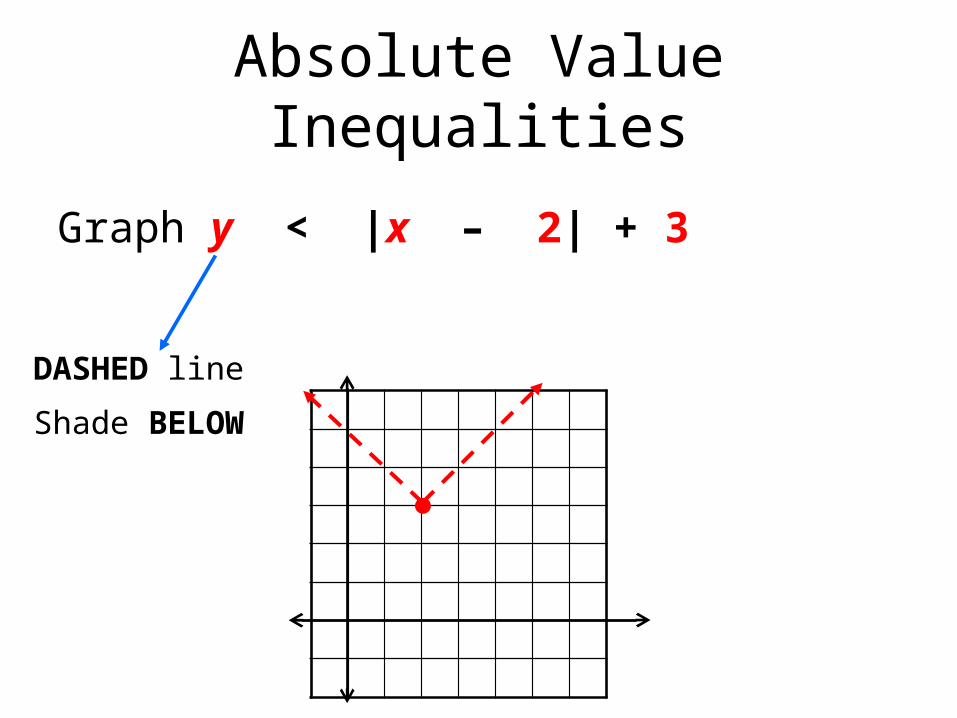
Absolute Value Inequalities
Graph y < |x – 2| + 3
Vertex = (2, 3)
Absolute Value Inequalities
Graph y < |x – 2| + 3
slope = 1
Absolute Value Inequalities
Graph y < |x – 2| + 3
DASHED line
Shade BELOW
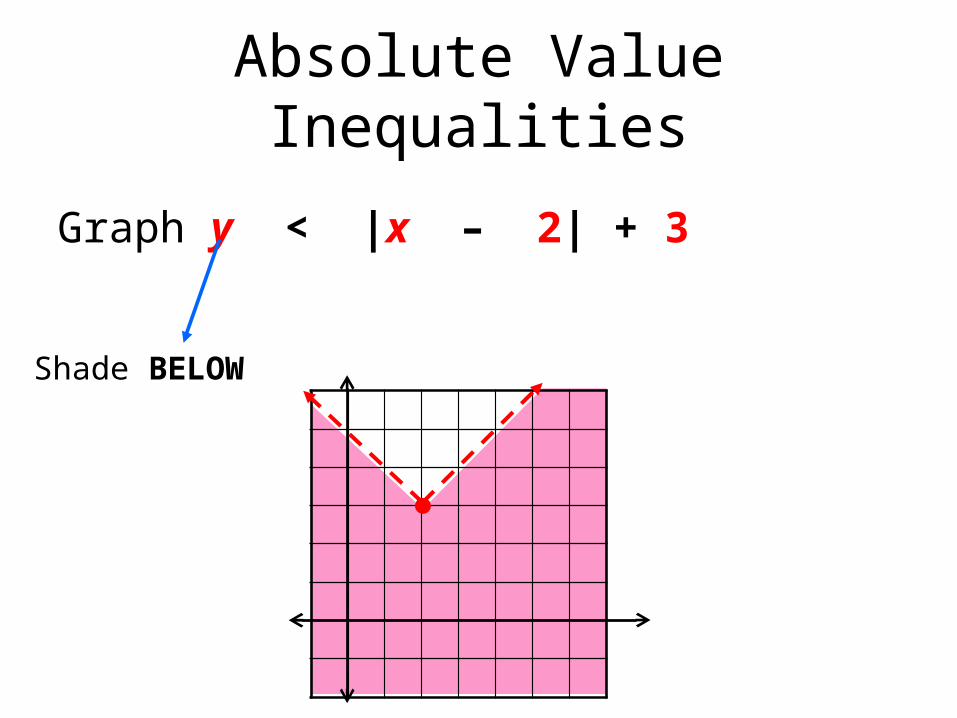
Absolute Value Inequalities
Graph y < |x – 2| + 3
Shade BELOW
Absolute Value Inequalities
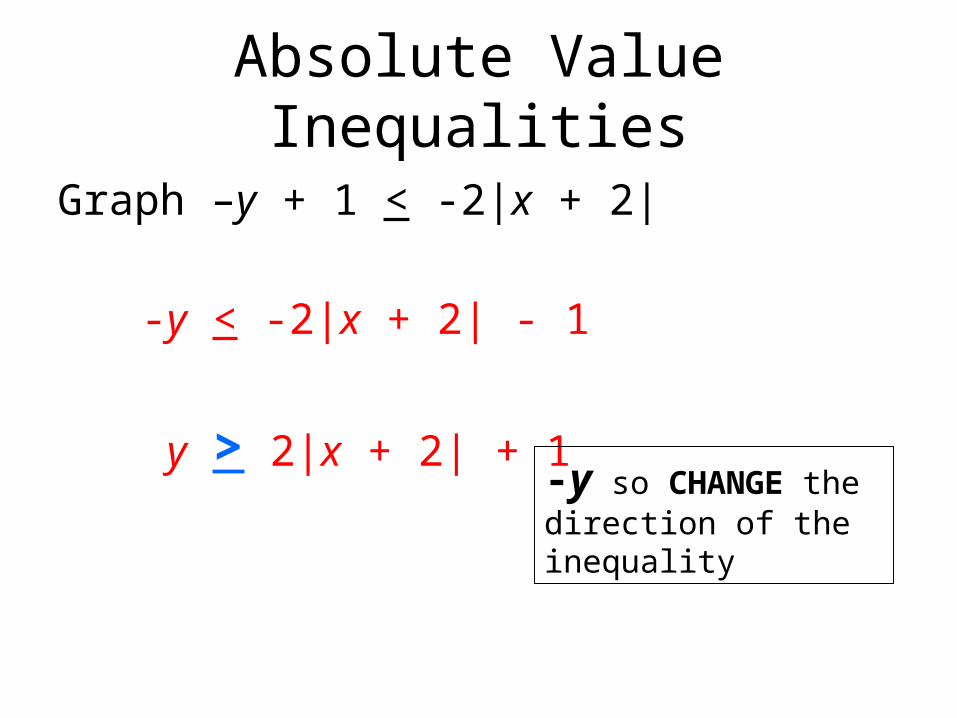
Graph –y + 1 < -2|x + 2|
-y < -2|x + 2| - 1
y > 2|x + 2| + 1-y so CHANGE the direction of the inequality
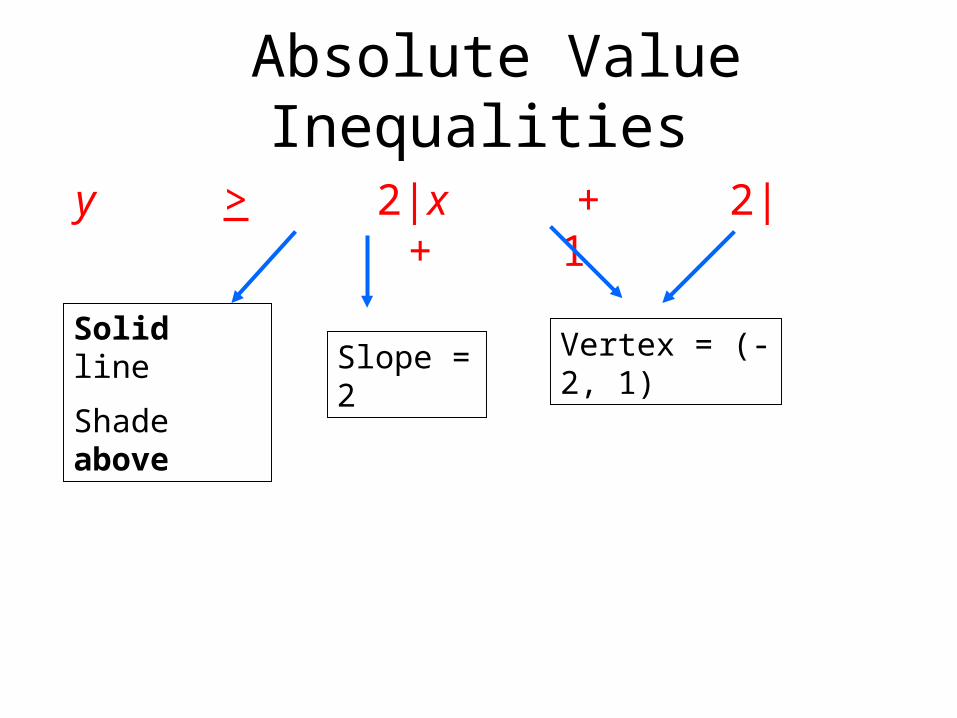
Absolute Value Inequalities
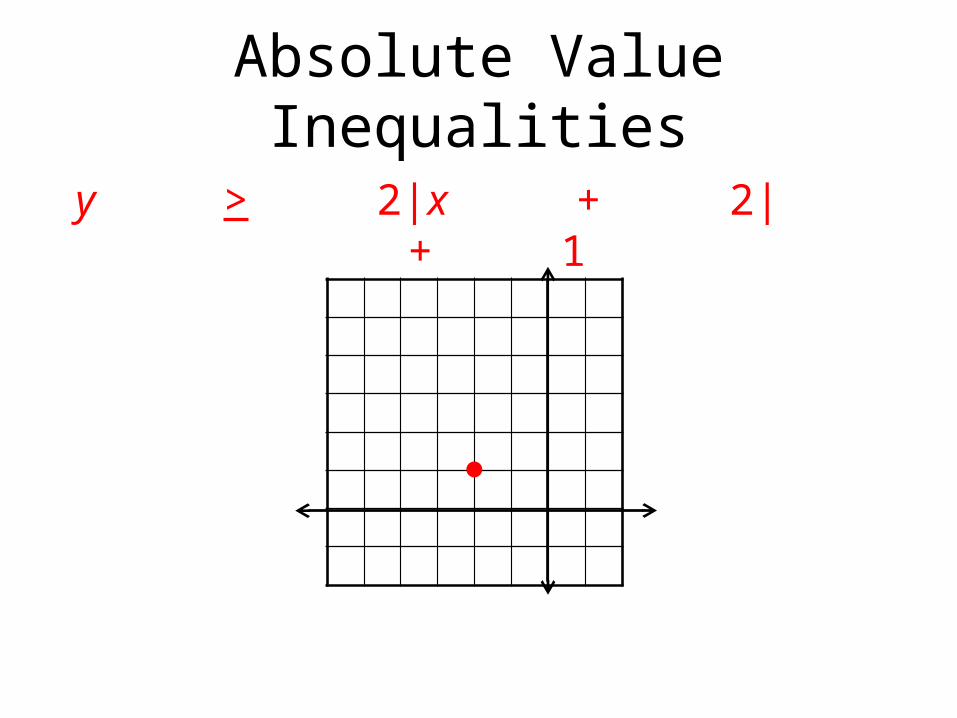
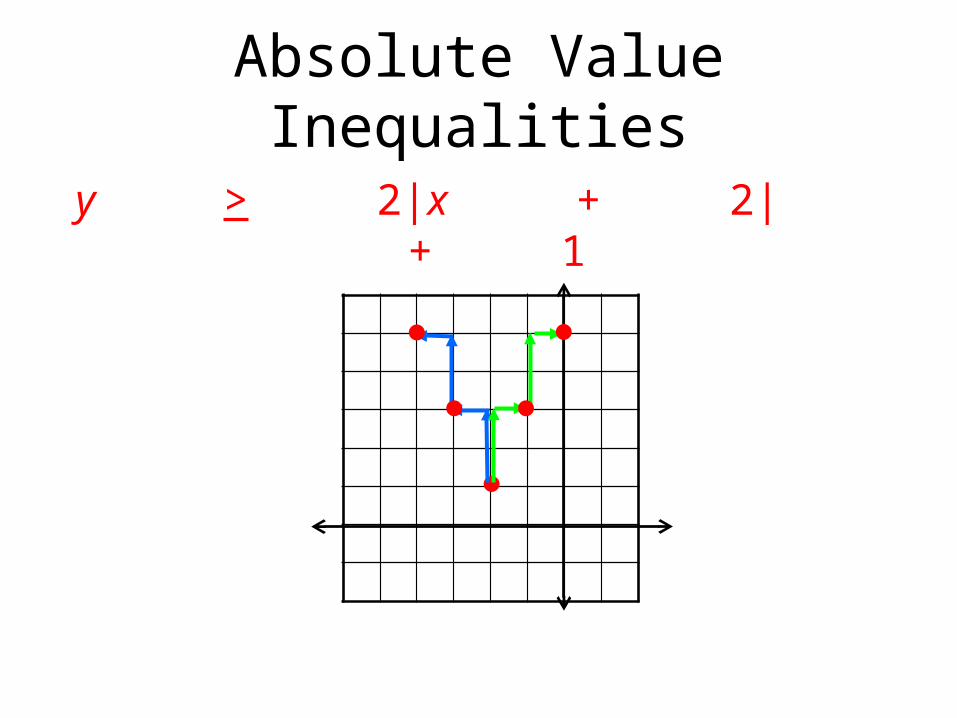
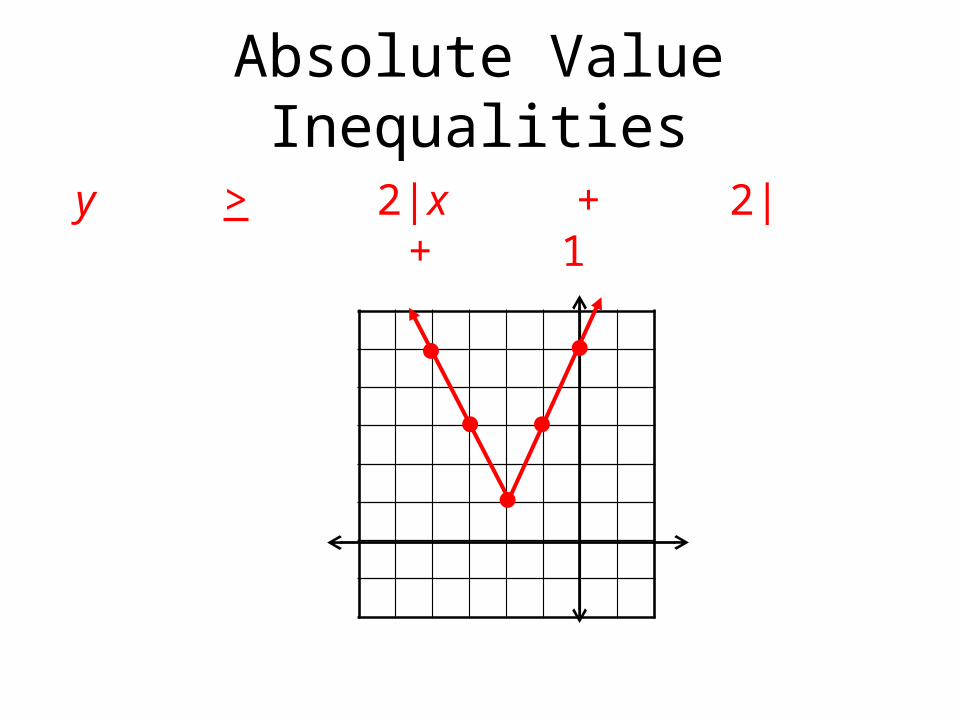
y > 2|x + 2| + 1
Vertex = (-2, 1)Slope = 2Solid line
Shade above
Absolute Value Inequalities
y > 2|x + 2| + 1
Absolute Value Inequalities
y > 2|x + 2| + 1
Absolute Value Inequalities
y > 2|x + 2| + 1
Absolute Value Inequalities
y > 2|x + 2| + 1
Absolute Value Inequalities
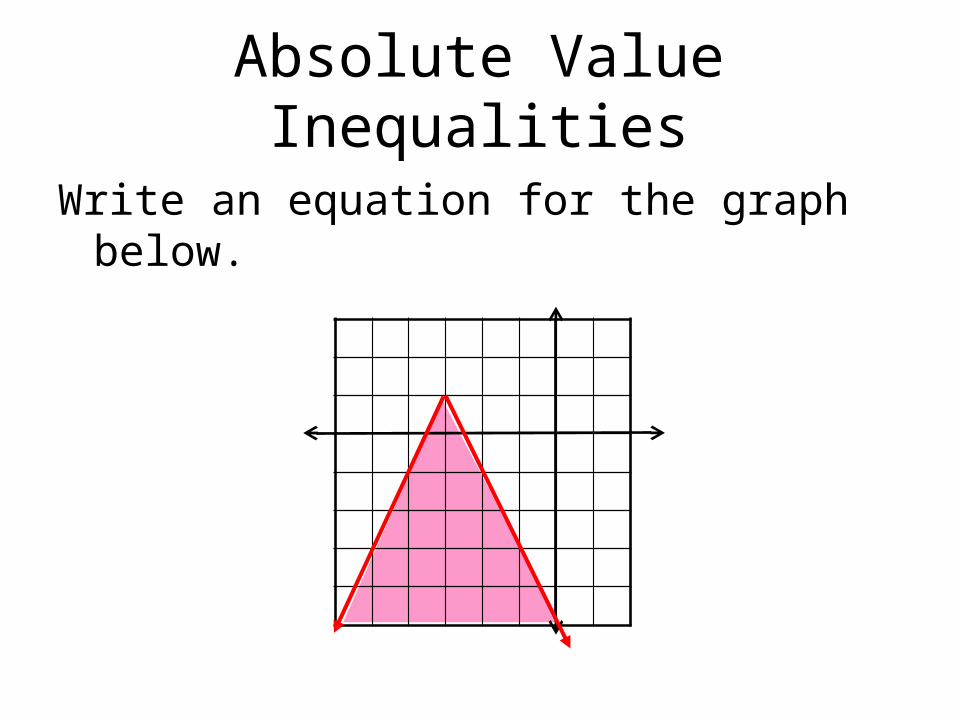
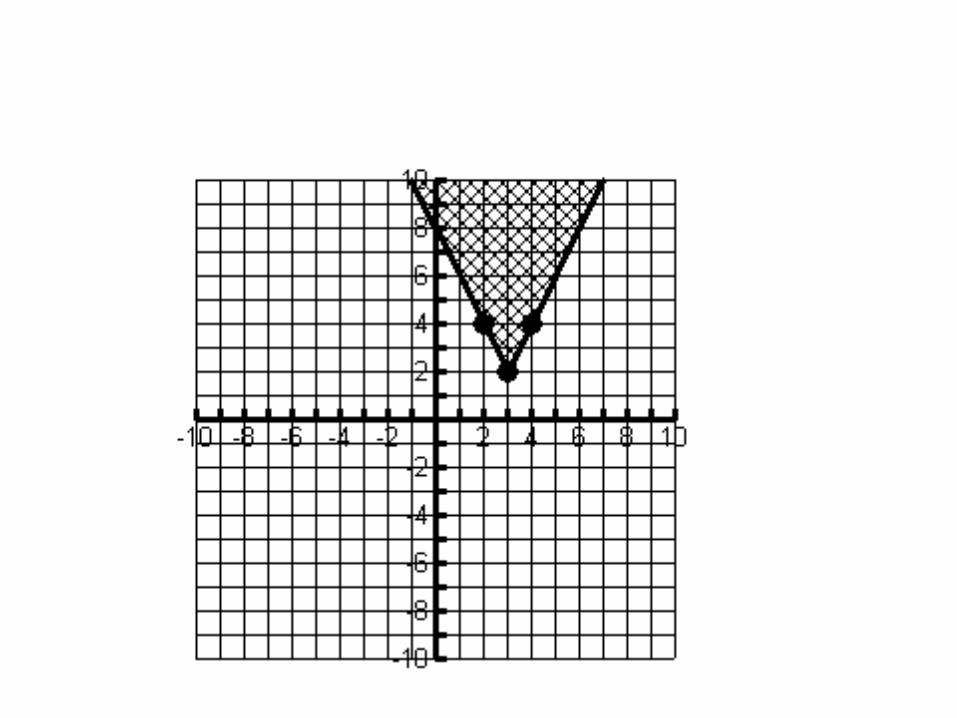
Write an equation for the graph below.
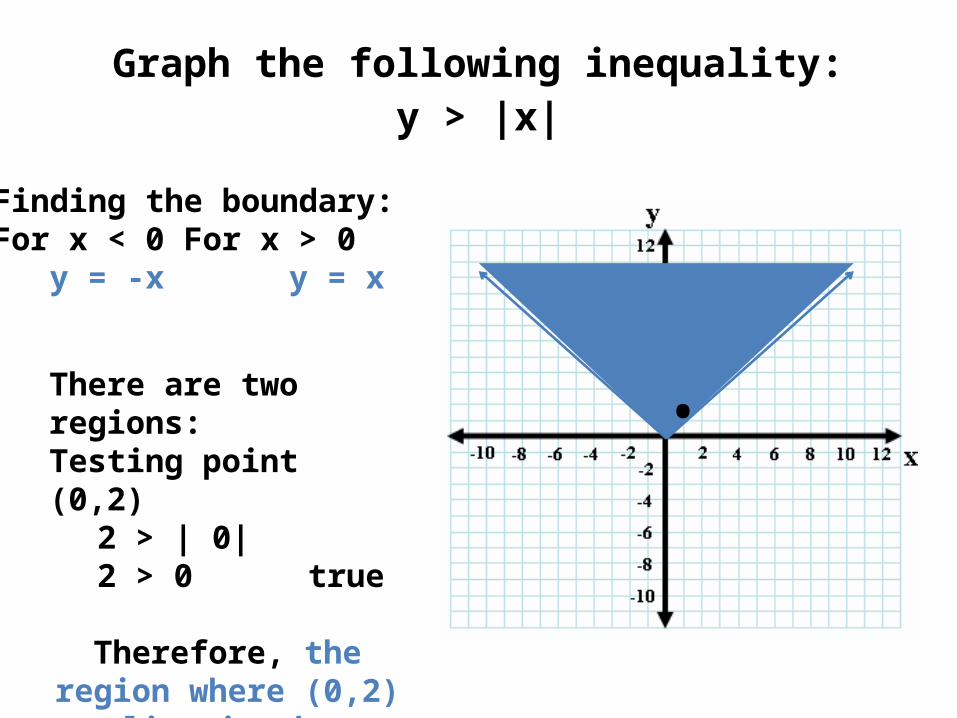
Graph the following inequality:y > |x|
Finding the boundary: For x < 0 For x > 0 y = -x y = x
There are two regions:Testing point (0,2)
2 > | 0|2 > 0 true
Therefore, the region where (0,2) lies is the
solution region and we shade it.
.
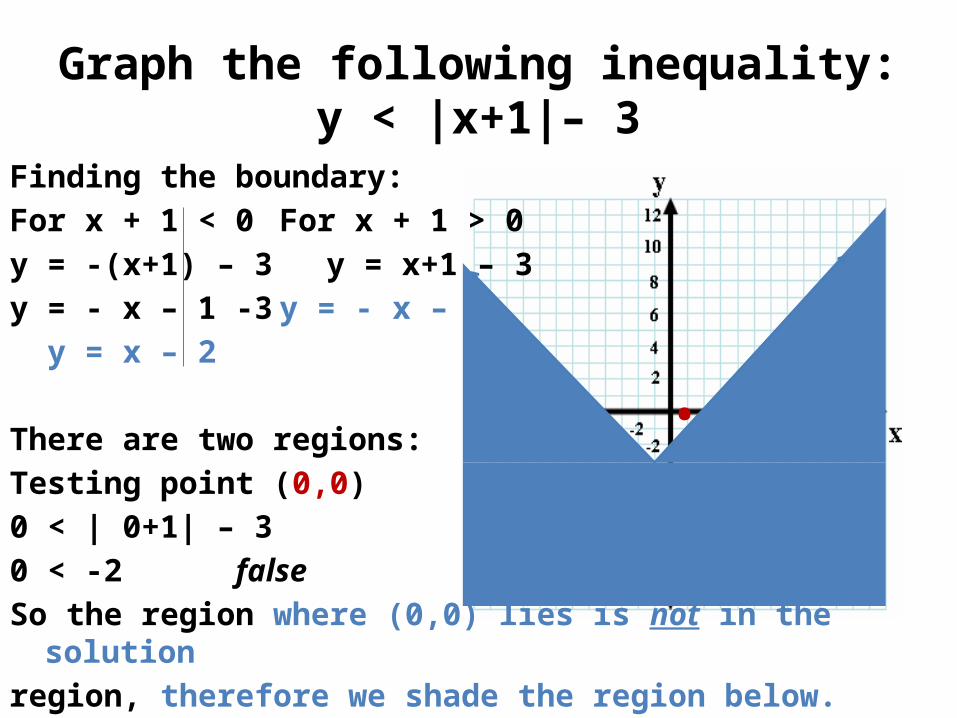
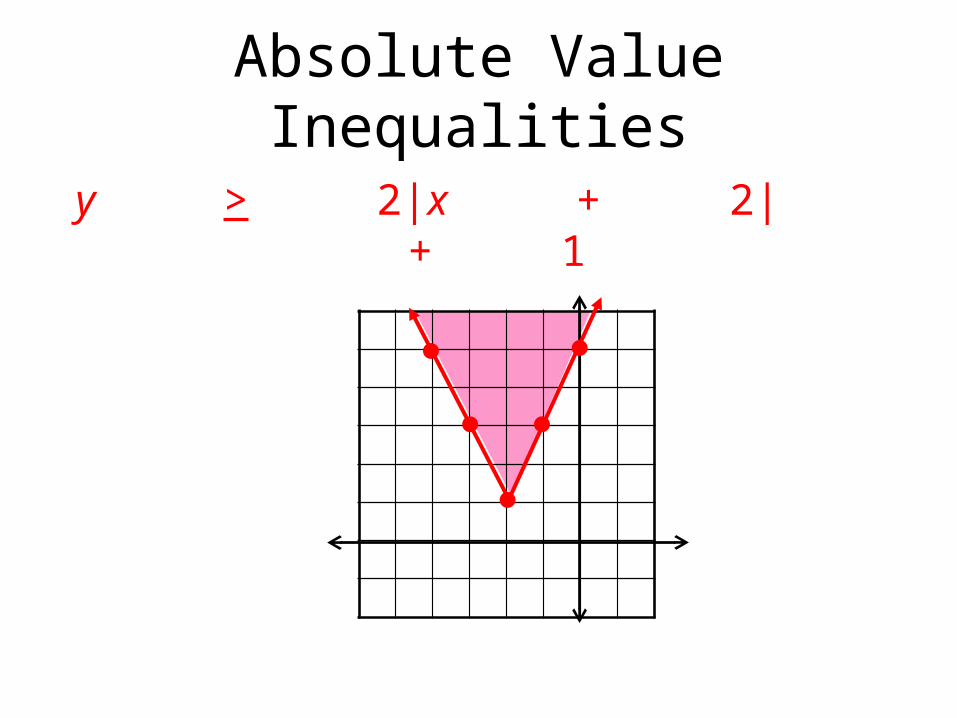
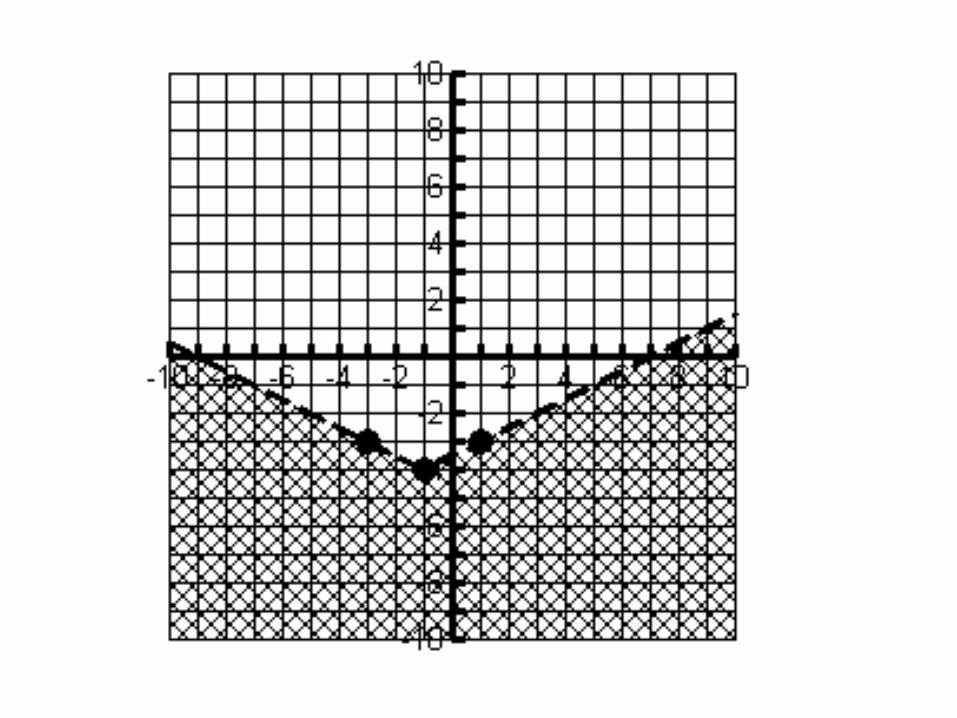
Finding the boundary:For x + 1 < 0 For x + 1 > 0y = -(x+1) – 3 y = x+1 – 3y = - x – 1 -3 y = - x – 4 y = x – 2
There are two regions:Testing point (0,0)0 < | 0+1| – 30 < -2 falseSo the region where (0,0) lies is not in the solutionregion, therefore we shade the region below.
Graph the following inequality:y < |x+1|– 3
.
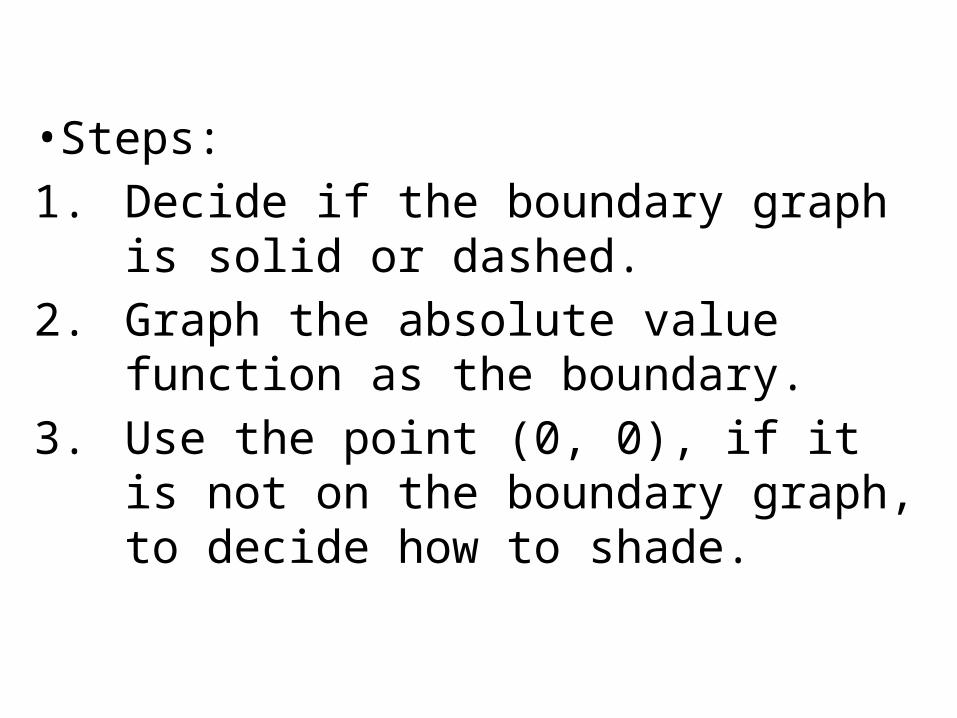
•Steps:1. Decide if the boundary graph is solid or
dashed.2. Graph the absolute value function as
the boundary.3. Use the point (0, 0), if it is not on the
boundary graph, to decide how to shade.
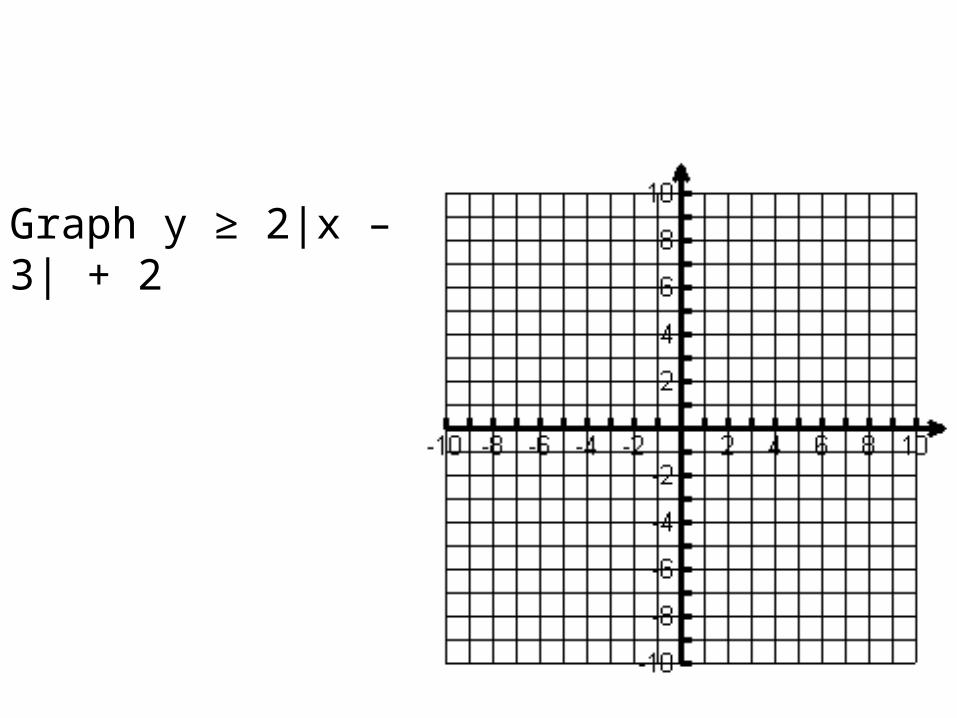
Graph y ≥ 2|x – 3| + 2
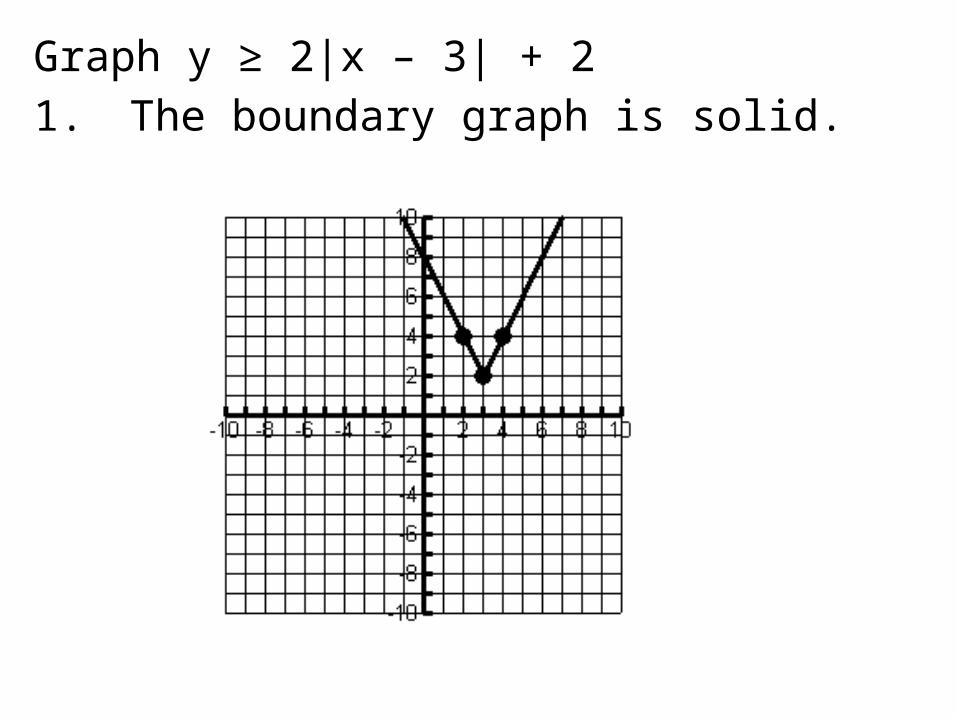
Graph y ≥ 2|x – 3| + 21. The boundary graph is solid.
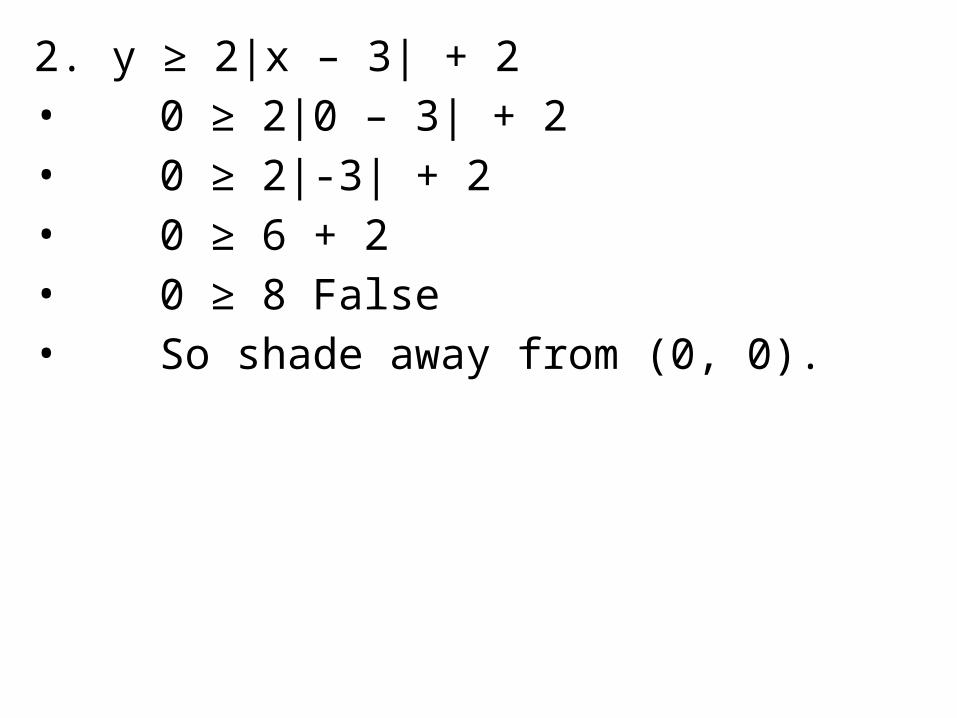
2. y ≥ 2|x – 3| + 2• 0 ≥ 2|0 – 3| + 2• 0 ≥ 2|-3| + 2• 0 ≥ 6 + 2• 0 ≥ 8 False• So shade away from (0, 0).
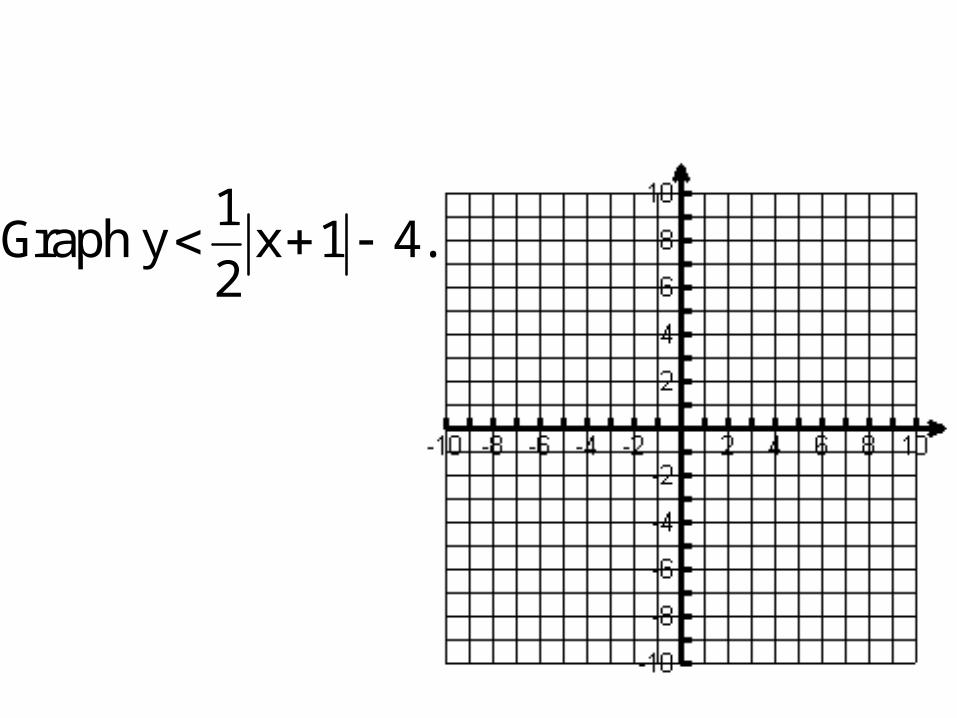
1Graph y x 1 4.
2
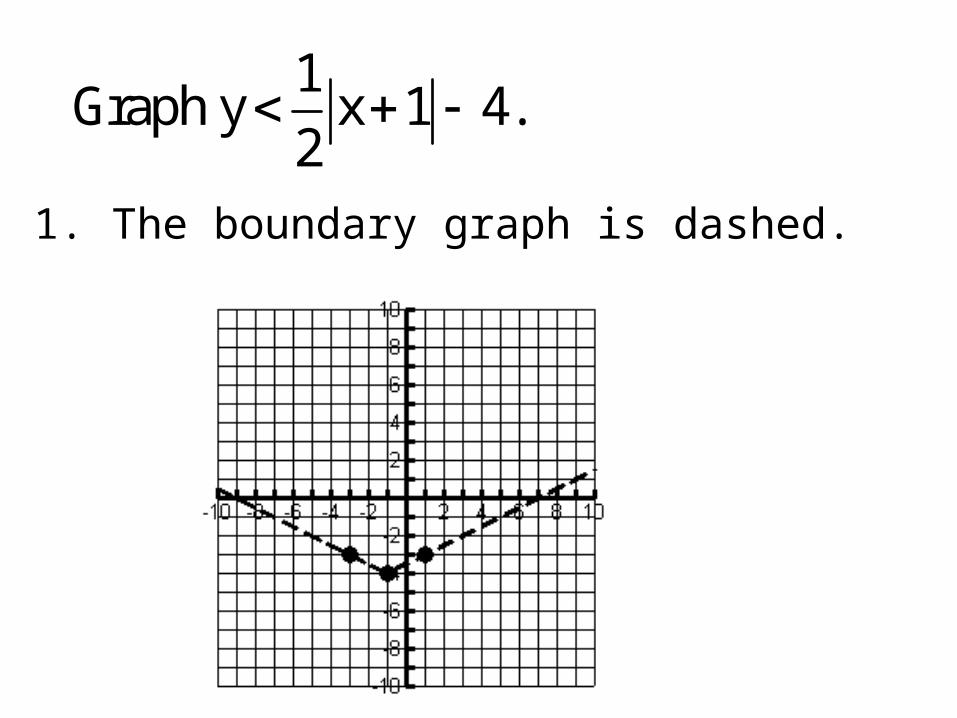
1Graph y x 1 4.
2
1. The boundary graph is dashed.
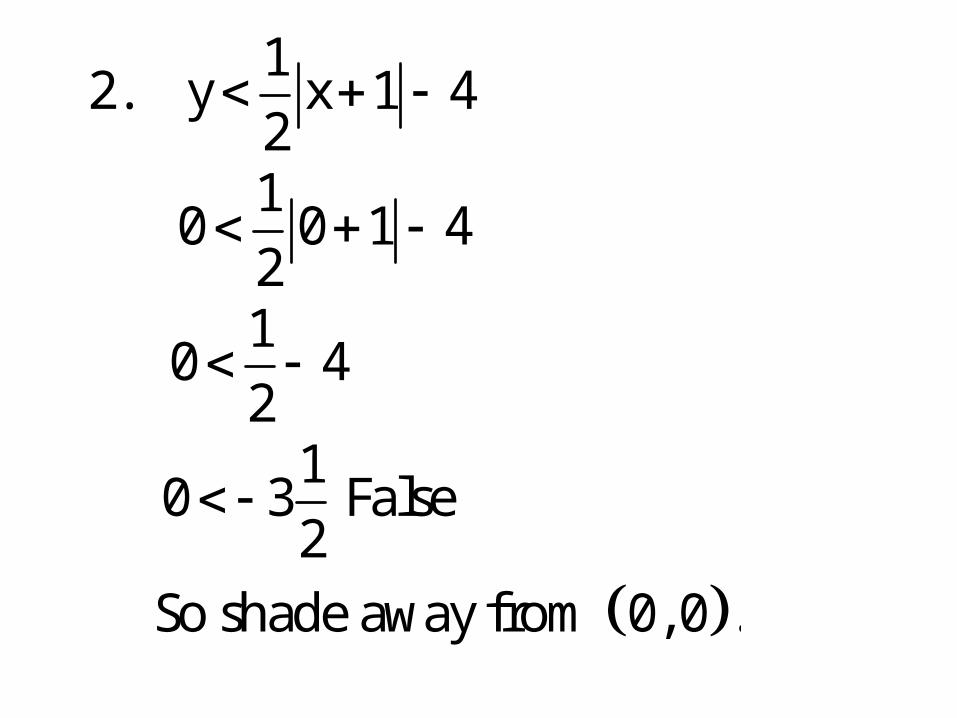
12. y x 1 4
2
10 0 1 4
2
10 4
2
10 3 False
2
So shade away from 0, 0 .
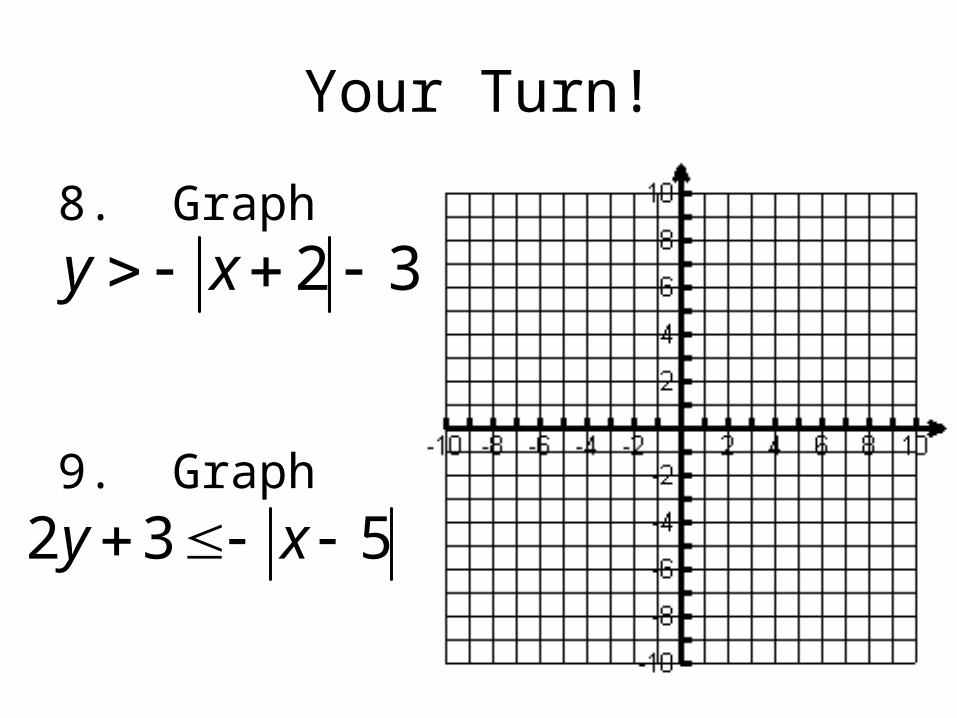
Your Turn!
8. Graph
9. Graph
2 3y x
2 3 5y x
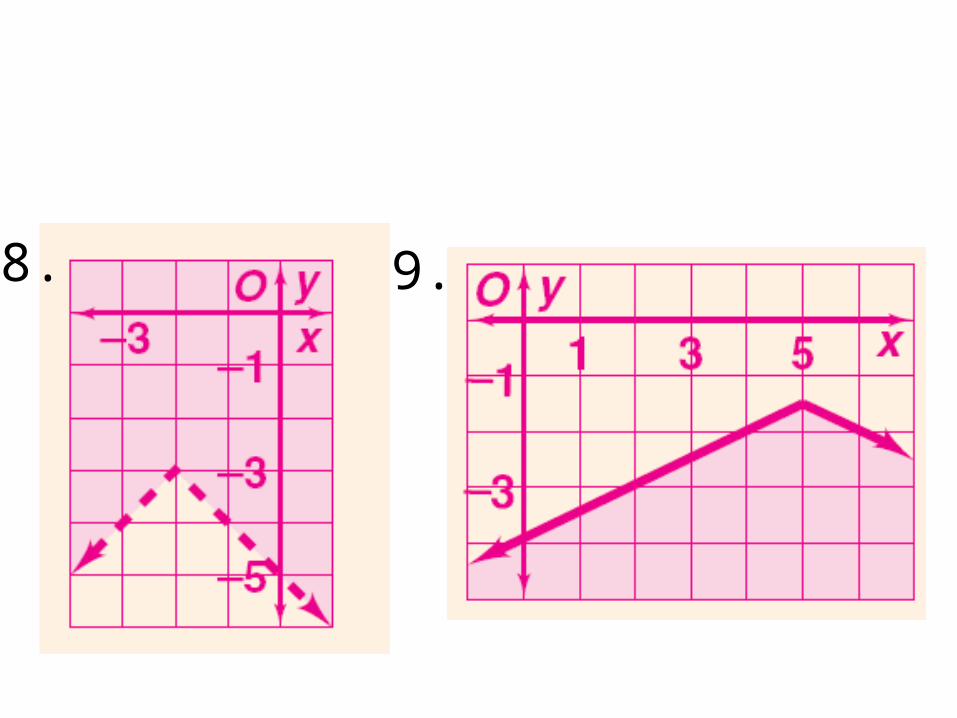
8. 9.
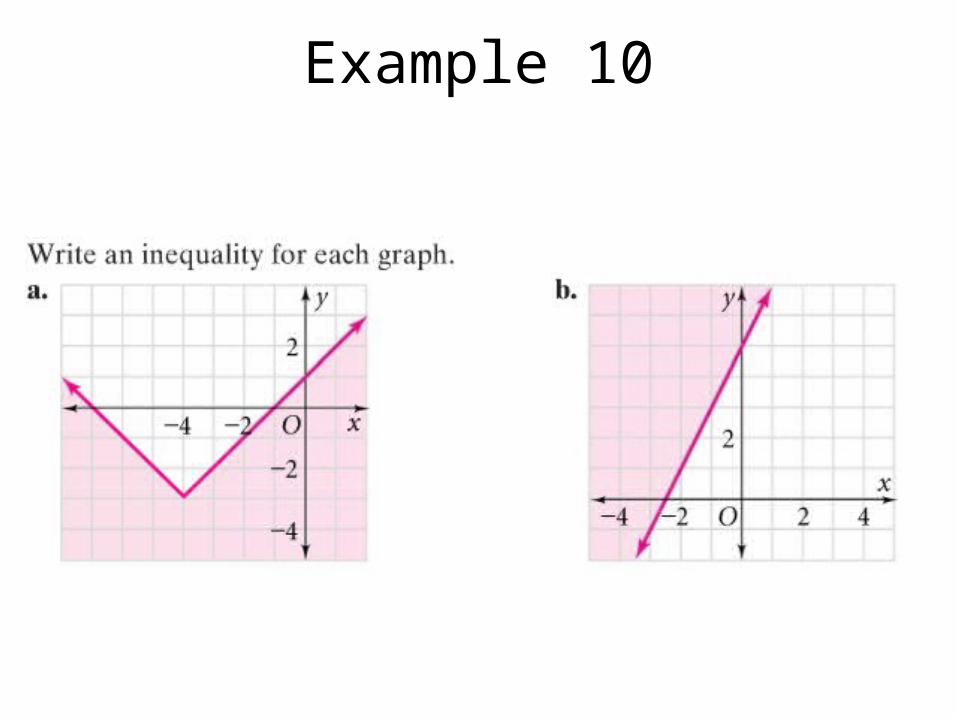
Example 10
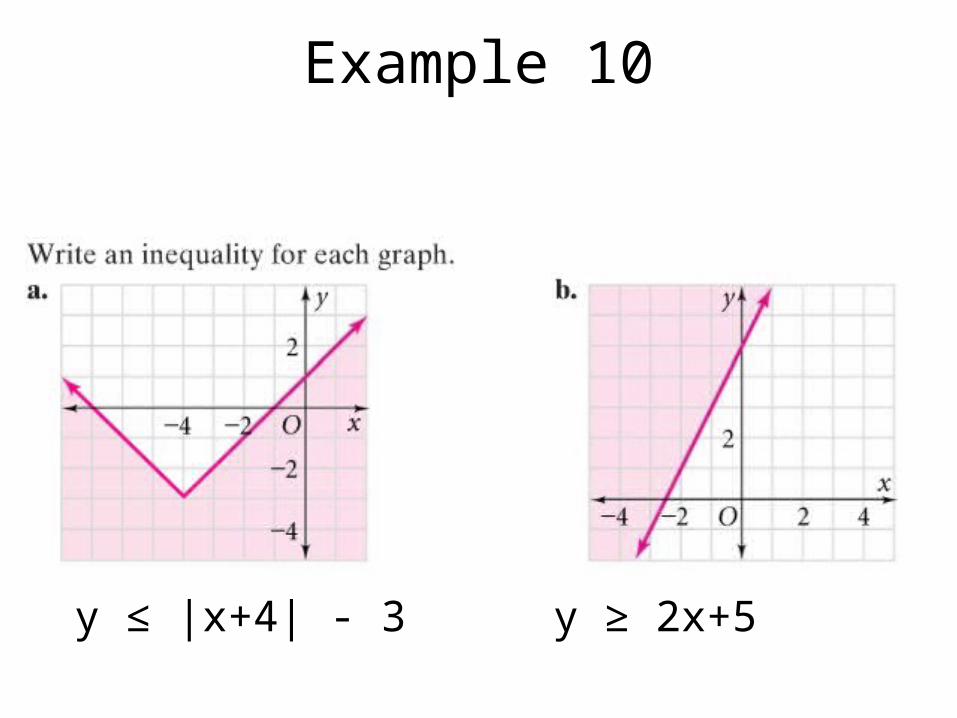
Example 10
y ≤ |x+4| - 3 y ≥ 2x+5