Embed Size (px)
Citation preview
SOLVING THE POVERTY CRISIS IN NIGERIA: AN
APPLIED GENERAL EQUILIBRIUM APPROACH
DR GODWIN CHUKWUDUM NWAOBI
http://myprofile. cos.com/gcnwaobi
gcnwaobi @ xuppa.com
234-08035925021
234-09-8820054
DEPARTMENT OF ECONOMICS
UNIVERSITY OF ABUJA
ABUJA, NIGERIA
AND
QUANTITATIVE ECONOMIC RESEARCH BUREAU
P.O. BOX 240
GWAGWALADA ABUJA
NIGERIA, WEST AFRICA
2
ABSTRACT POVERTY AMID PLENTY IS THE WORLD�S GREATEST CHALLENGE. THIS
STUDY PROPOSES AN APPLIED (COMPUTABLE) GENERAL EQUILIBRIUM
APPROACH THAT IS A RE-NEW ATTENTION TO THE PROBLEM OF
POVERTY, EMPLOYMENT AND INEQUALITY THAT EARLIER STRATEGIES
FOCUSING ON RAPID GROWTH WERE UNABLE TO RESOLVE. USING
NIGERIA AS A CASE STUDY, WE PERFORM THE SPECIFICATION,
ESTIMATION AND CALIBRATION OF A POVERTY-BASED MODEL WITHIN A
DATA FRAMEWORK OF SOCIAL ACCOUNTING MATRIX (SAM). THE
RESEARCH OUTPUT IS EXPECTED TO BE THE POLICY RESPONSE TO THE
ENVISAGED COMPLEX HUMANITARIAN EMERGENCIES (CHES) FACING
POOR COUNTRIES SUCH AS NIGERIA.
3
1.0 PROBLEM STATEMENT
�Human Poverty is more than income poverty � it is the denial of choices and opportunities
for living a tolerable life� (United Nations, 1997).
Poverty amid plenty is the world�s greatest challenge. Poor people live without fundamental
freedoms of action and choice that the better off take for granted (Sen., 1999). They often
lack adequate ford and shelter, education and health, deprivations that keep then from leading
the kind of life that every one values. They also face extreme vulnerability to ill health,
economic dislocation, and natural disasters. And they are often exposed to ill treatment by
institutions of the state and society and are powerless to influence key decisions affecting
their lives. These are all dimensions of poverty (World bank, 2001). Indeed, of the world�s 6
billion people, 2.8 billion live on less than $2 a day, and 1.2 billion live on less than $1 a day.
In rich countries less than 1 child in 100 does not reach its fifth birthday, while in the poorest
countries as many as a fifth of children do not. And while in rich countries fewer than 5
percent of all children under fire are malnourished, in poor countries as many as 50 percent
are.
One route for investigating the causes of poverty is to examine the dimensions highlighted by
poor people. These include the lack of income and assets to attain basic necessities (food,
shelter, clothing and acceptable levels of health and education); sense of voiceless ness and
powerlessness in the institutions of state and society; and vulnerability to adverse shocks
linked to on inability to cope with them. To understand the determinants of poverty in all its
dimensions, it helps to think in terms of people�s assets, the returns to (or productivity of)
these assets, and the volatility of returns. These assets are of several kinds: human assets
(such as the capacity for basic labor, skills, and good health); Natural assets (such as land);
physical assets (such as access to infrastructure); Financial assets (such as savings and access
to credit) and social assets (such as networks of contacts and reciprocal obligations that can
be called on in time of need, and political influence over resources. The returns to these
assets depend on access to markets and all the global, national and local influences on returns
in these markets. But returns depend not just on behavior of markets, but also on the
performance of institutions of state and society. Underlying asset ownership and returns to
assets are not only economic but also fundamental political and social forces. Access to
4
assets depends on a legal structure that defines and enforces private property rights or on
customary norms that define common property resources.
Access may also be affected by implicit or explicit dissemination on the basis of gender,
ethnicity, race, or social status. And both access to assets and returns to assets are affected
by public policy and state interventions, which are shaped by the political influence of
different groups. Also important is the volatility of returns volatility results from market
fluctuations, weather conditions, and, in some societies, turbulent political conditions.
Volatility affects not only returns, but also the value of assets, as shocks undermine health,
destroy natural and physical assets, or deplete savings (World Bank 2001). Faced with this
picture of global poverty, the international community has set itself several goals for the
opening years of the century, based on discussions at various United Nations Conference in
the last decade. These international development goals (most for 2015) include the reduction
by half the proportion of people living in extreme income poverty; ensure universal primary
education; eliminate gender disparity in primary and secondary education; reduce infant and
child mortality by two thirds, reduce maternal mortality by three quarters, ensure universal
access to reproductive health services; and implement national strategies for sustainable
development in every country by 2005, so as to reverse the loss of environmental resources
by 2015.
However African economic performance has been markedly worse than that of other regions.
The great majority of Africa lives on barely $0.65 a day and this number is growing
relentlessly. Moreover, a severe lack of capabilities (education, health, nutrition) among
Africa�s poor threatens to make poverty �dynastic,� with the descendants of the poor also
remaining poor. The rural poor account for 80 percent of African poverty, but urban poverty
is substantial and appears to be growing (World Bank, 2000, Nwaobi, 2000 and Collier and
Gunning, 1999). Africa is not only poor, it also suffers from vast inequality in incomes, in
assets, in control over public resources, and in access to essential to essential services, as well
as pervasive insecurity. These dimensions of poverty and deprivation are worsening in many
parts of the region while in some areas there are indications of deterioration in the general
health of the population, particularly among the poor and children. Not surprisingly, the
elimination of deep poverty has emerged as the overriding objective of development in
Africa.
5
Indeed, Nigeria presents a paradox. The country is rich but the people are poor. Per capital
income today is around the same level as in 1970. Poverty in Nigeria encompasses a very
complex society: regional climatic and ethnic differences are reinforced by different
historical and socio-economic legacies. Also, The country has had a complex political
history. Frequent changes in governments have led to sharp changes in economic and social
policies, which have impacted adversely on the population and have worsened income
distribution. The challenge for Nigeria is not one of improving one sector or region at the
expense of another or of introducing policy distortions and inefficiencies in resource
allocation to benefit one group which in the past has led to increased poverty for others, but
to adopt growth and social service oriented policies that will enable all its inhabitants to
improve their welfare.
The thrust of out project therefore is to give a new impetus to the integral approach to
poverty. It combines attention to income distribution and satisfaction of basic human needs it
the micro level with analysis of macro constraints, intersectoral relationships and the
dynamics of productivity and population. The essential advantage of general equilibrium
analysis is that it includes prices and their effects on resource allocation, income formation
and demand, thereby providing a full picture of interrelationships in the economy, not
necessarily limited to those characterized by perfect competition and smoothness. Specific
parameter choice and specification of relationships will allow the model to capture a number
of particular rigidities or occurrences of non-perfect markets such as imperfect commodity
markets, credit rationing, segmentation of the labour market, product differentiation in
international trade and the particular role of the domestic trade sector.
Basic needs satisfaction will be described by the model as the �output� of income formation
and distribution processes, and is dynamically linked to longer-term processes, that is, basic
needs indicators affect labour productivity, population growth and labour supply. In other
words, our models will emphasis the process of income distribution and basic needs
satisfaction (both conceived in dynamic terms) incorporating many details of the socio-
economic structure of developing countries into a general equilibrium type model constitutes
the uniqueness of the proposed study (using the social accounting matrix framework of the
Nigerian Economy).
6
2.0 OBJECTIVES OF STUDY
The fundamental aim of this project is to construct an applied general equilibrium model that
will enable us to identify and analyze the implications of basic needs policies on various
socio economic groups in Nigeria.
This objective requires us to carry out the following steps,
(1) To describe the relatively short-term processes of income formation and expenditure,
as well as the longer-term processes of household and socio-economic group
formation, labour force and wealth formation in Nigeria.
(2) To provide a comprehensive accounting framework characterized by a complete
picture of the main socio-economic processes; a high level of disaggregation and an
emphasis on income distribution and the role of the various socio-economic groups in
Nigeria.
(3) To perform the specification estimation and calibration of a big Nigeria model that
may be rewarding in the sense of quantifying, and hence improving our understanding
of complex and unexpected interrelationships between variables.
(4) And to provide operational models (for economists and planners) as a tool of policy
making and a conceptual device for comprehending socio-economic processes in a
market economy such as Nigeria.
7
3.0 THE NIGERIAN ECONOMY AND POVERTY CRISIS
3.1 ECONOMIC STRUCTURES
The Nigerian name was derived by the British colonial administration from �Niger area�
which initially was a term used to describe the territories around the river Niger.
In 1886, the British acquired the territories through the Royal Niger Company, which were
administering then. In 1906, the Lagos Colony and southern province was amalgamated to
form the Lagos and southern protectorate while the protectorate of Northern Nigeria was
joined in 1914 to form the colony and protectorate of Nigeria. In 1939, Nigeria was
structured into three regional governments, namely, the Western, Eastern and Northern
regions. However, the 1951 McPherson constitution that favored regional governments
within a federal system at the apex faced the problem of regional representation at the federal
level. Under the federal constitution of 1959, Nigeria gained independence from the British
colonial administration on October 1, 1960.
Nigeria is the single largest geographical unit in West Africa. It occupies a land area of 923,
768 square kilometers situated between longitude 30 and 150 East, and latitude 40 and 140
North (CBN, 2000). She lies entirely within the tropics with two main vegetation zones the
rain forest and savanna zones; reflecting the amount of rainfall and its spatial distribution.
The wet and dry seasons are climatically the two major seasons in the country. Nigeria is
conglomeration of several ethnic groups, with three major dominant tribes. Hausa, Ibo and
Yoruba domiciled mainly in the North, Southeast and Southwest of the country respectively.
About 250 ethnic groups could be recognized within the country (with considerable
differences in the norms and values of each major tribe).
At the start of the 1960s, the basis of the Nigerian economy was a well-diversified
agricultural sector that supported 75 percent of the population, provided 68 percent of GDP
and 78 percent of exports and supplied the people with 94 percent of their food. Again, per
capita income was estimated at US $90 per capita and GDP growth was rapid at an annual
rate nearly 5 percent (see World Bank, 1996). However, a new development pattern
gradually emerged (over the years) as agriculture began to stagnate due to the growing
8
burden of taxation. Later rapidly growing industries began to exert considerable influence on
the economy, including demands for special protection from imports. This led to a shift in
the pattern of industrialization, from the processing of agricultural products for export,
towards simple import substitution; as well as the emergence of petroleum extraction as a
leading growth sector. However, in the mid-1960s growing regional tensions and the
identification of the political parties with rent seeking, ethnic interests and patronage created
a climate of arrest and political uncertainty that was compounded by the stagnating GDP
growth. The ensuing civil war caused major losses of production. Again, there was a sharp
decline in foreign exchange earnings and government revenues attributable to the loss of all
on-shore production of oil while foreign exchange was rationed during the war years with a
series of increasingly stringent direct and indirect controls.
In the early 1970s, the budget buoyed by the growing oil revenues, quickly returned to a
surplus position. The speed of the recovery was entirely due to the oil expansion and rapid
growth of government spending. Again, extensive state controls and interventions in
economic activities were intensified (rather than relaxed) with the introduction of programs
for price controls (Price Control Decree of 1970/71) and for indigenization Nigerian
Enterprise Promotion Decree (NEPD) decree of 1972, which limited the sectors open to, and
equity stakes of, foreign investors. Stringent import and credit controls were put into place
with the hope of boosting manufacturing. And yet, the most significant event affecting the
economy during these periods was the management of the oil boom and bust. Essentially, the
positive oil shocks of 1973 and 1979 increased the terms of trade more than four times
between 1972 � 80.
Latter, the collapse of world oil prices and the sharp decline in petroleum output brought to
the forefront the precarious nature of the country�s economic and financial position. The
overall fiscal deficit rose from ½ percent of GDP in 1980 to 9½ percent in 1981, and the
external current account balance shifted from a surplus of 4½ percent to a deficit of 7½
percent in the same period. The severe weakening of the external position was reflected in a
reduction of international reserves. Stepped up foreign borrowing by federal and state
governments and public enterprises increased external debt, while the growing scarcity of
foreign exchange affected output in the import intensive manufacturing sector with capacity
utilization falling. The steady appreciation of the real effective exchange rate also depressed
agricultural output, which remained at levels below those achieved in the 1970s. As a result,
9
annual GDP growth decelerated sharply and turned negative in 1981. Thus, the sharp
worsening of economic conditions prompted the Shagari government to introduce significant
budget cuts and measures to improve the external position (that is the 1982 Austerity
measures). These measures resulted in some easing of inflationary pressures, but real GDP
contracted in 1982-83, owing to the sharp decline in oil production, the scarcity of imported
inputs, and a worsening drought. Although the external current account position improved in
1983 reflecting the severe compression of imports, the government�s financial position
deteriorated as fiscal oil revenue dropped further and transfers to state and local governments
and loans to parastatals expanded. The monetization of the government�s fiscal deficit
resulted in a strong growth of broad money and accelerated inflation.
The observed worsening economic and financial conditions and alleged widespread
corruption led to a military coup at the end of 1983. The new regime (under General Buhari)
reinforced the austerity measures while additional exchange and trade restrictions were
announced in 1984. The fiscal and monetary measures announced were aimed drastically
reducing domestic demand pressures. The government also implemented expenditure cuts
and substantial tax increases. The expenditure cuts were particularly successful in the short
run and they reduce the overall federal government fiscal deficit to a significant percentage in
1985. As a consequence, the government�s recourse to bank credit was virtually eliminated
and inflationary pressures were significantly reduced.
However, the government�s austerity measures did meat with some setback. The emphasis
on short run stabilization measures reflected the government�s belief that Nigeria�s economic
and financial problems were transient and would eventually disappear with a recovery in oil
export prices. In the event, oil prices did not recover, and it became clear that the
stabilization policies had failed to address the underlying economic problems. Thus,
crippling import shortages and growing social and political discontent set the stage for
another military coup (under General Babangida) who assumed power in October, 198. After
considerable popular debate, the Babangida Government adopted in June 1986 a
comprehensive structural adjustment program (SAP) that signaled a radical departure from
previous adjustment efforts. It emphasized reliance on market forces and deregulation. The
objectives of the SAP were to restructure and diversify the productive base of the economy
so as to reduce dependency on the oil sector and imports; achieve fiscal and balance of
payments viability over the medium term; and promote non-inflationary economic growth.

10
The key policies designed to achieve these objectives were the tightening of financial
policies; the adoption of a market determined exchange rate; the Liberalization of the
external trade and payments system; the elimination of price controls and commodity boards;
the decontrol of interest rates; the rationalization and restructuring of public expenditure; the
rationalization of the tariff structure and the overall lowering of tariffs; and the privatization;
or commercialization of most federal public enterprises.
During this period, some of Nigeria�s earlier anti-export bias in manufacturing disappeared
with policy reforms, and producers switched from imported to local inputs. Particularly in
agro-processing and textile manufacturing, there was greater use of locally produced
materials. The assembly-based manufacturing, which had depended on imported inputs and
been shielded from competition and market signals, contracted. But the industry as a whole
grew by 3.5 percent per year (1986-1990); similarly, production of traditional food crops and
cash crops increased and agricultural output grew at 4.7 percent per year on average.
However, the gradual loss of macroeconomic control after 1990 eroded many of the positive
changes that took place in the preceding years and have begun impacting negatively real
economic indicators. Although significant progress was made in the liberalization of the
economy, specifically through reform of the exchange and the trade system and the freeing of
prices, macroeconomic policy implementation remained erratic and failed to bring inflation
under control.
The spark was set off once again by the short-lived oil price increase of 1990-91, but the
deterioration in macroeconomic management can be mostly attributed to the rapid expansion
of extra budgetary spending. This problem was compounded by inappropriate priorities.
These large outlays were financed primarily by diversion of oil receipts into off-budget
accounts and by borrowing from the CBN external debt service obligation were not fully met.
Substantial new external arrears accumulated despite the successful debt reduction operation
negotiated with the London club in 1992. In 1993/94 the pressure on the external balance
was exacerbated by the downturn in world oil prices. Instead of tackling the cause of the
mounting economic crisis by sharply reducing spending, the government attempted to
suppress its symptoms in 1994 by centralizing all foreign exchange transactions, outlawing
the autonomous foreign exchange market, fixing the official exchange rate at an increasingly
overvalued level, setting up committees to ratio foreign exchange to the private sector, and
capping interest rates significantly below prevailing inflation levels. As a result, non-oil
11
export volumes fell sharply. However, a 12 percent drop in imports that reflected foreign
exchange shortages largely offset the impact of the decline in export revenue on the current
account deficit. The 1994 financing gap net of the preceding stock of arrears was covered
entirely by a large accumulation of external payment arrears.
The rapidly worsening economic conditions in 1994 led to significant policy corrections in
the 1995 budget of �guided deregulation�. Included among these were a tight fiscal and
monetary stance; a free market for foreign exchange for all except some government
transactions and new legislation to liberalize the environment for foreign direct and portfolio
investors. As a result of these corrections, inflation slowed down but the strongest evidence
was the stability experienced by the market exchange rate throughout 1995 and the first half
of 1996. Notably, aggregate domestic output grew by 3.3 percent and inflation rate declined
to 29.3% in 1996. For the third consecutive year, macroeconomic stability was sustained in
Nigeria in 1997; resulting in further improvement in overall economic performance
specifically, aggregate domestic output growth recorded a modest improvement over the
previous year, while the inflation rate decelerated persistently throughout the year, reacting a
single digit level in December. Although the current account surplus was lower, the overall
balance of payments position showed a modest surplus compared with a deficit in the
previous year significant success was achieved in stemming the growth of domestic liquidity
that impacted favorably on the exchange rate and price stability while satisfactory progress
was made towards distress resolution in the financial sector (CBN, 1997).
The economic policy measures adopted in 1998 were designed primarily to consolidate and
build on the gains of maintaining macroeconomic stability in the previous years. The
dominant strategy for achieving these objectives remained the use of market-based
instruments of monetary policy and addressing the problems of unemployment and poverty
from the supply side. Macroeconomic stability was threatened, as the collapse of crude oil
prices in the international market weakened commitment to fiscal prudence, resulting in
substantial increase in the budget deficit. Moreover output growth showed further and the
pressures on the external sector intensified. Specifically, the balance of payment position
resulted in an overall deficit of N220,667.6 million (US $2,873.0 million). This development
was due to the decline in oil export earnings and increased demand for imports.
Consequently, the current account position swung to a deficit of N330,109.0 million
(US$4,297.8million). The intense pressures on the external sector also resulted in depletion
12
of external reserves to the level of US$7,100.0 million or 9.2 months of imports (CBN,
1998).
The performance of the Nigerian Economy in 1999 was mixed. Inflationary pressures cased,
especially during the second half of the year, while growth in real output was sluggish. Here,
the government fiscal operations resulted in a substantial deficit amounting to N285,104.7
million or 8.4 percent of GDP and the pressure on the external sector intensified with
deterioration in the overall balance of payments position. However, the exchange rate of the
Naira depreciated in all segments of the foreign exchange market. Prior to the introduction
of Inter-Bank Foreign Exchange Market (IFEM), the average exchange rate at the AFEM
(Autonomous Foreign Exchange Market) was N91.8 = US$1.00 for the period of January to
October 1999. However, at the IFEM which commenced operations on October, the
exchange rate depreciated to N97.42 = US $1.00 in December 1999, averaging N96.12 =
US$1.00 during the period. The performance of the economy improved generally in 2000.
At 3.8 percent, real GDP growth was higher than target and inflation was kept at a single
digit of 6.9 percent while the pressure on the balance of payments abated. Here, the fiscal
operations of the Federal Government resulted in as overall fiscal deficit of N103,777.3
million, representing 2.9 percent of GDP. This lower deficit was attributed to the increased
revenue particularly from the oil sector and the restraint on expenditure. The fiscal deficit
was financed entirely from domestic sources (such as the banking system).
The performance of the real sector improved in 2001, with the real gross domestic product
growing by 3.9 percent. The major sources of growth were agriculture, manufacturing
merchandise, transportation, finance and insurance and government services. However,
inflationary pressures accelerated as a result of the liquidity surfeit fuelled by expansionary
fiscal operations and the lingering structural bottlenecks that increased costs of doing
business in the economy while the unemployment level remained high. During this period,
Nigeria�s external sector experienced renewed pressure resulting in a lower overall balance
of payments surplus of N29.2 billion. The deficit in the capital and financial account
narrowed during the year. The lingering problems included the excessive dependence on
imports, a huge external debt profile, the debt service burden as well as the low level of
foreign direct investment. As from 2002, the feud between the national Assembly and the
presidency over budget issues left deep scars on the economy. Government accounts for well
over 65 percent of total spending in the economy and therefore sets the pace of business

13
activities as well. With the poor implementation of budget in the last four years, planning
and business projections by the various economic units in country were better left to the
vagaries of guesswork. And at the macro-economic level, government projections did not
fare better either.
After months of brainstorming, an economic document entitled �Framework for Nigeria�s
Economic Growth and Development (2003-2007) was rolled out. It was aimed basically at
enhancing the frontiers of economic growth as well as poverty reduction in the medium term.
The agricultural sector was targeted to grow at an annual growth rate of eight percent while
total economic activity was expected to grow at seven percent. To realize these objectives,
some factors were identified as possible causes of the nation�s poor economic goals. They
include lack of due process for the award of government jobs, corruption, lack of proper
monitoring of budget implementation, conflict within civil society and lack of accountability.
And agencies are created to handle and address these factors. Indeed, Nigeria is going
through a difficult political and economic transition after several years of military rule. The
newly elected Federal government faces an away of complicated issues that must be
overcome for Nigeria to be successful in its transition to a democratic political system and a
vibrant market economy. These include pervasive poverty and widespread unemployment;
deterioration of government institutions and inadequate capacity at all levels of government
to deliver critical services effectively; sporadic violence between ethnic groups; a legacy of
widespread corruption; little growth in the non-oil private economy and limited self-
empowerment among local communities. Yet, Nigeria remains a society rich in cultural
linguistic, religious, ethnic and political diversity. These constituent parts of Nigerian society
each feel aggrieved, in one way or another. The average Nigerian today struggles hard to
make ends meet, sees himself/herself as being poorer than he/she was a decade ago, and finds
it hard to be hopeful that things will get better soon.
3.2 POVERTY CRISIS
In Nigeria, the problem of poverty has for a fairly longtime been a cause for concern to the
government. Initial attention was focused on rural development and town and country
planning as practical means of dealing with the problem. Thus, the 2nd to the 4th National
14
development plan documents contain both direct and indirect allusions to, as well as
objectives of policies and programmes aimed at minimizing the causes of poverty. In order
to stave off the causes of urban poverty and other ills, the development plans called for the
provision of master plans for future expansion and better physical layouts with facilities
utilities including adequate water supply, housing, sewage, electricity and efficient transport
and communications network including the establishment of the necessary institutions to
ensure their maintenance. Failure to adequately implement these programmes can be seen as
the precursor to most of the present causes of poverty in Nigeria.
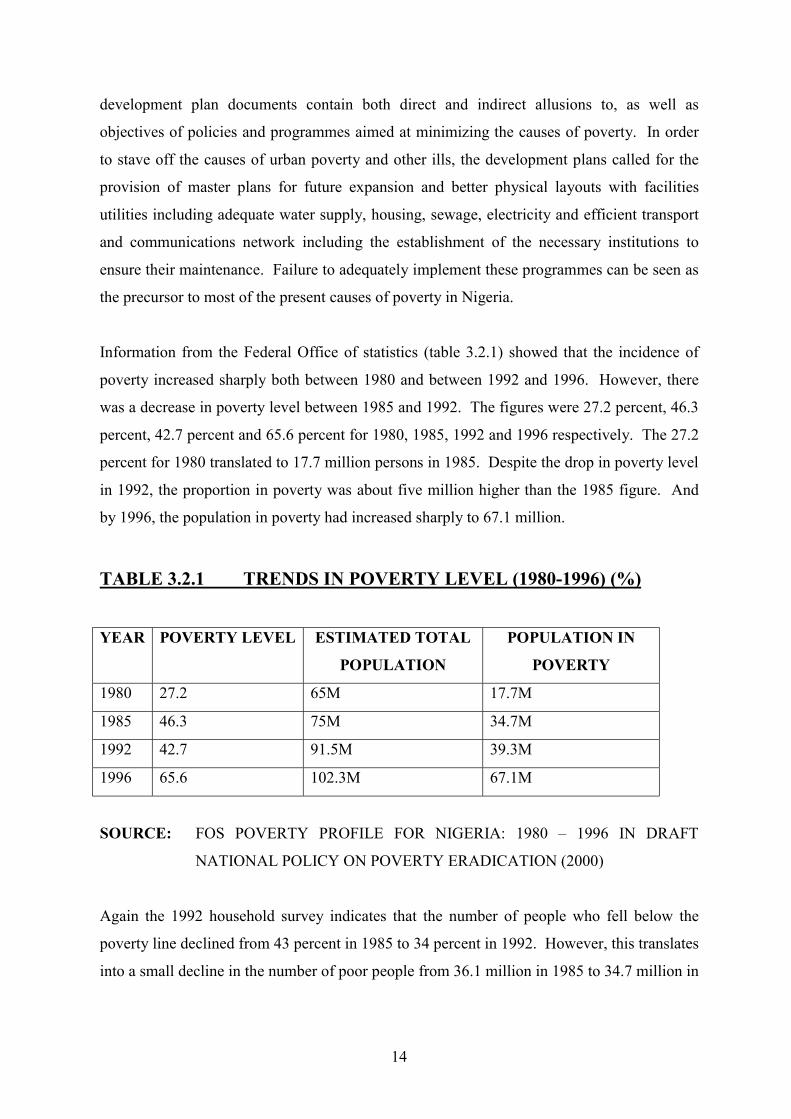
Information from the Federal Office of statistics (table 3.2.1) showed that the incidence of
poverty increased sharply both between 1980 and between 1992 and 1996. However, there
was a decrease in poverty level between 1985 and 1992. The figures were 27.2 percent, 46.3
percent, 42.7 percent and 65.6 percent for 1980, 1985, 1992 and 1996 respectively. The 27.2
percent for 1980 translated to 17.7 million persons in 1985. Despite the drop in poverty level
in 1992, the proportion in poverty was about five million higher than the 1985 figure. And
by 1996, the population in poverty had increased sharply to 67.1 million.
TABLE 3.2.1 TRENDS IN POVERTY LEVEL (1980-1996) (%)
YEAR POVERTY LEVEL ESTIMATED TOTAL
POPULATION
POPULATION IN
POVERTY
1980 27.2 65M 17.7M
1985 46.3 75M 34.7M
1992 42.7 91.5M 39.3M
1996 65.6 102.3M 67.1M
SOURCE: FOS POVERTY PROFILE FOR NIGERIA: 1980 � 1996 IN DRAFT
NATIONAL POLICY ON POVERTY ERADICATION (2000)
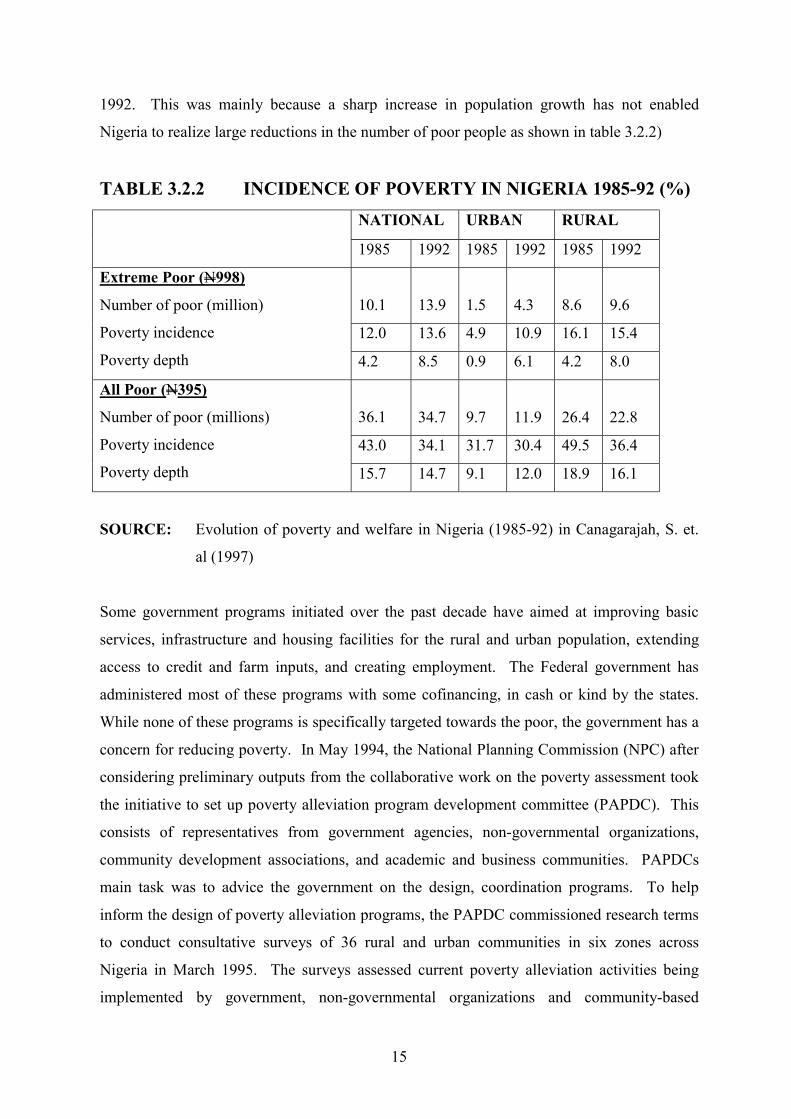
Again the 1992 household survey indicates that the number of people who fell below the
poverty line declined from 43 percent in 1985 to 34 percent in 1992. However, this translates
into a small decline in the number of poor people from 36.1 million in 1985 to 34.7 million in
15
1992. This was mainly because a sharp increase in population growth has not enabled
Nigeria to realize large reductions in the number of poor people as shown in table 3.2.2)
TABLE 3.2.2 INCIDENCE OF POVERTY IN NIGERIA 1985-92 (%) NATIONAL URBAN RURAL
1985 1992 1985 1992 1985 1992
10.1 13.9 1.5 4.3 8.6 9.6
12.0 13.6 4.9 10.9 16.1 15.4
Extreme Poor (N998)
Number of poor (million)
Poverty incidence
Poverty depth 4.2 8.5 0.9 6.1 4.2 8.0
36.1 34.7 9.7 11.9 26.4 22.8
43.0 34.1 31.7 30.4 49.5 36.4
All Poor (N395)
Number of poor (millions)
Poverty incidence
Poverty depth 15.7 14.7 9.1 12.0 18.9 16.1
SOURCE: Evolution of poverty and welfare in Nigeria (1985-92) in Canagarajah, S. et.
al (1997)
Some government programs initiated over the past decade have aimed at improving basic
services, infrastructure and housing facilities for the rural and urban population, extending
access to credit and farm inputs, and creating employment. The Federal government has
administered most of these programs with some cofinancing, in cash or kind by the states.
While none of these programs is specifically targeted towards the poor, the government has a
concern for reducing poverty. In May 1994, the National Planning Commission (NPC) after
considering preliminary outputs from the collaborative work on the poverty assessment took
the initiative to set up poverty alleviation program development committee (PAPDC). This
consists of representatives from government agencies, non-governmental organizations,
community development associations, and academic and business communities. PAPDCs
main task was to advice the government on the design, coordination programs. To help
inform the design of poverty alleviation programs, the PAPDC commissioned research terms
to conduct consultative surveys of 36 rural and urban communities in six zones across
Nigeria in March 1995. The surveys assessed current poverty alleviation activities being
implemented by government, non-governmental organizations and community-based
16
organizations; evaluated the capacity and performance of local implementing institutions and
the level of popular participation in their programs; and sought the views of communities as
to the most appropriate institutional arrangements of community development and poverty
alleviation. PAPDC�s report recommends that to be effective, any national poverty
alleviation program would need to be flexible enough to address the diversity of the needs of
poor individuals and communities /World Bank, 1996).
As an interim measure, government also started a Poverty Alleviation Programme (PAP) in
1999. Here, it was supposed to pay N10,000 each to an agreed number of unemployed
persons for up to a year to enable then begin business. The programme was stopped because
of criticisms that the ruling party hijacked it and the money rarely got to those who actually
needed it. Also, instead of the N10,000 which government allocated, the recipients got only
N7,000 each. However, there were beneficiaries of the scheme. When PAP failed
government revisited the matter of poverty alleviation and came up with the National Poverty
Eradication Programme (NAPEP). With this perggo tricycles were given to beneficiaries to
enable then become players in the informal transportation sector. Also, a poverty-reduction
strategy process was started by government in order to enable it deal with the matter of
poverty and unemployment once and for all. Indeed, the Human Development Report (2000)
ranked Nigeria number 151 out of 1974 countries and amongst the poorest twenty (20)
countries in the world. All these point to the fact that poverty is a serious problem in Nigeria
(see Nwaobi 2000). In fact, Nigeria faces mass poverty and this has serious social, political,
economic, and security consequences that cannot be ignored. The Nigerian situation has
however been made worse by the rapid population growth rate of about 2.83 percent since
the 1990s giving rise to a high dependency ratio and pressure on resources in several areas.
The qualitative aspects of poverty derived from the voice of the poor, a consultative World
Development Report (2000/2001) carried out by the Department for international
Development (DFID) and World Bank in collaboration with the National Planning
Commission also manifested poverty in terms of lack of access to resources by individuals
which leads a state of powerlessness, helplessness and despair, in ability to subsist and
protect oneself against economic shocks, social economic, cultural and political
discrimination and marginalisation among others.
17
4.0 MODEL CONSTRUCTION
General equilibrium models go back to Walras (1875) who formulated the economic system
as set of excess demand equations in as many unknown prices, to be solved via successive
price revisions. Walras did not prove the existence of an equilibrium price vector (until
1950) when mathematical economists such as Arrow, Debreu, Gale and others derived
rigorous conditions for the existence, uniqueness and stability of general equilibrium.
Applied general equilibrium modeling had to wait further development of computational
techniques (such as fixed point algorithms of scarf and kuhn) and cheap computers before
equilibrium prices could be computed in practice.
Here, the basic objective of our model is to simulate policies oriented toward basic needs
satisfaction. For this, it is necessary to capture as many intentions as possible between the
various �zones� of the society that are relevant to the issue and can be quantified in some
way. They main focus is on the medium and long-term. The various agents of the economic
and social processes (productive units, households and institutions) are interdependent, as is
particularly clear with the role of prices in the decision making processes Relative prices
affect the outcome of the economic and social processes in terms of basic needs satisfaction.
A general equilibrium type of model captures these interdependencies among agents and
does justice to the allocative role of prices. The most important basic needs characteristic is
the classification of the various agents in the socio-economic processes, accomplished
through the division of relatively homogenous as to income and consumption behavior and
can be identified as target groups for government policies. Similarly, commodities,
consumption categories and sectors are distinguished so as to identify those units relevant for
basic needs satisfaction [see Nwaobi 1997; Kouwenuur, 1988]
The model structure has two major parts: the main iteration that determines on equilibrium
for the current year and the updating part, in which the exogenous variables of the main-
iteration part are updated [for iteration of the following year] as functions of the equilibrium
solution of the previous period. In this sense, the model can be called recursive, i.e. it
computes a sequence of temporary equilibria. The main iteration part basically centers on
deriving a set of excess demand equations for commodities in as many price variables.
18
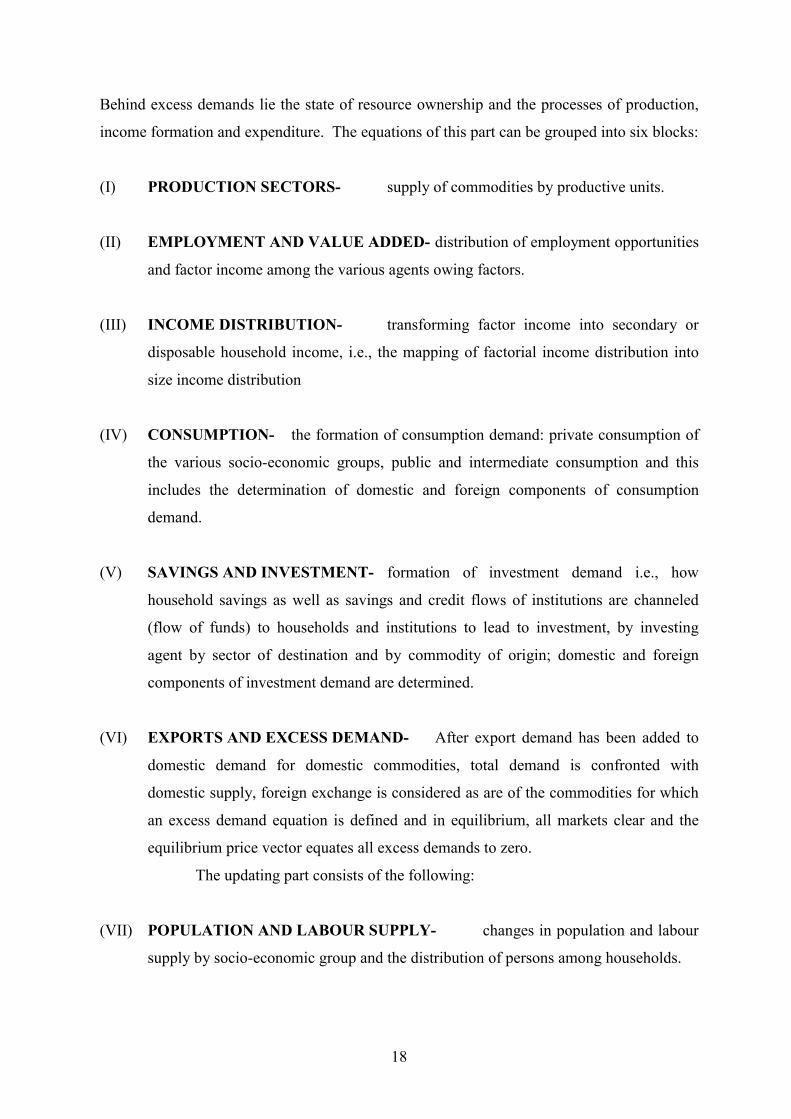
Behind excess demands lie the state of resource ownership and the processes of production,
income formation and expenditure. The equations of this part can be grouped into six blocks:
(I) PRODUCTION SECTORS- supply of commodities by productive units.
(II) EMPLOYMENT AND VALUE ADDED- distribution of employment opportunities
and factor income among the various agents owing factors.
(III) INCOME DISTRIBUTION- transforming factor income into secondary or
disposable household income, i.e., the mapping of factorial income distribution into
size income distribution
(IV) CONSUMPTION- the formation of consumption demand: private consumption of
the various socio-economic groups, public and intermediate consumption and this
includes the determination of domestic and foreign components of consumption
demand.
(V) SAVINGS AND INVESTMENT- formation of investment demand i.e., how
household savings as well as savings and credit flows of institutions are channeled
(flow of funds) to households and institutions to lead to investment, by investing
agent by sector of destination and by commodity of origin; domestic and foreign
components of investment demand are determined.
(VI) EXPORTS AND EXCESS DEMAND- After export demand has been added to
domestic demand for domestic commodities, total demand is confronted with
domestic supply, foreign exchange is considered as are of the commodities for which
an excess demand equation is defined and in equilibrium, all markets clear and the
equilibrium price vector equates all excess demands to zero.
The updating part consists of the following:
(VII) POPULATION AND LABOUR SUPPLY- changes in population and labour
supply by socio-economic group and the distribution of persons among households.
19
(VIII) DISTRIBUTION OF WEALTH- changes in capital stocks by sector and owning
agent and in distribution parameters for capital ownership (share capital, debt-claims,
self-employed shares in operating surplus) and this also includes the derivation of
desired capital-output ratios.
(IX) BASIC NEEDS INDICATORS- basic needs satisfaction indicators by socio-
economic group nutrition, education, life expectancy, infant mortality, housing,
drinking water and sewerage as well as indices describing income inequality and its
sources.
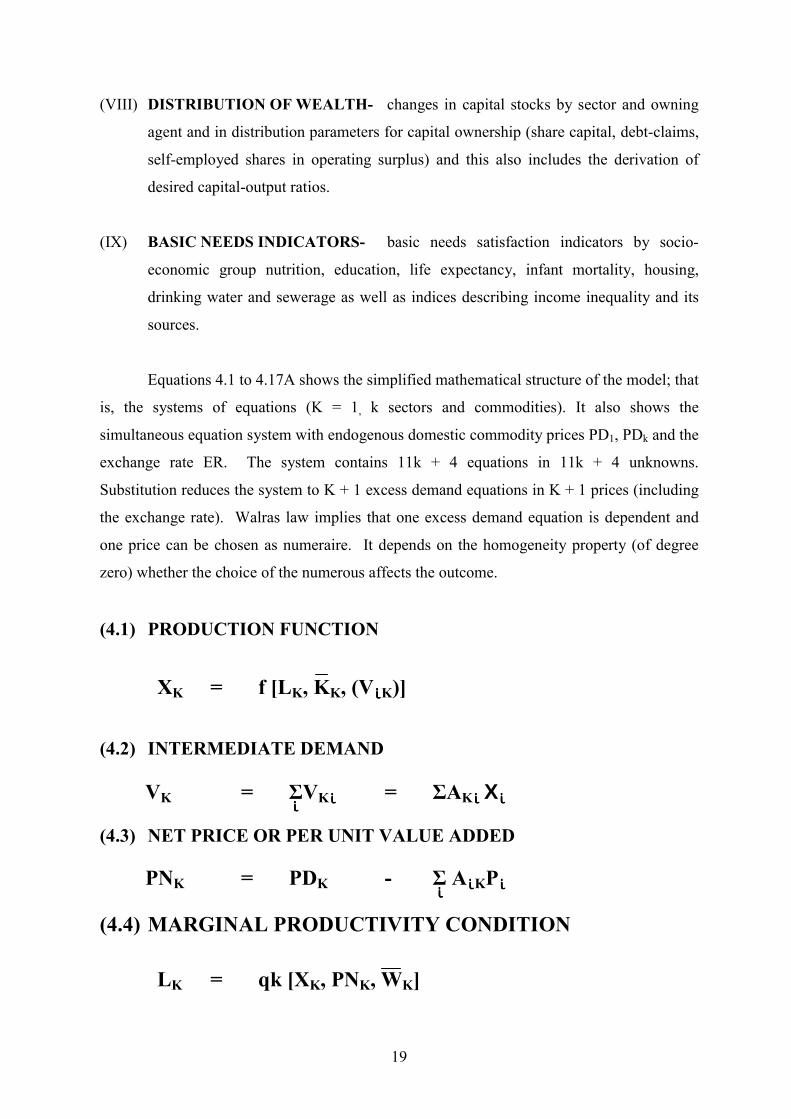
Equations 4.1 to 4.17A shows the simplified mathematical structure of the model; that
is, the systems of equations (K = 1, k sectors and commodities). It also shows the
simultaneous equation system with endogenous domestic commodity prices PD1, PDk and the
exchange rate ER. The system contains 11k + 4 equations in 11k + 4 unknowns.
Substitution reduces the system to K + 1 excess demand equations in K + 1 prices (including
the exchange rate). Walras law implies that one excess demand equation is dependent and
one price can be chosen as numeraire. It depends on the homogeneity property (of degree
zero) whether the choice of the numerous affects the outcome.
(4.1) PRODUCTION FUNCTION
(4.2) INTERMEDIATE DEMAND
(4.3) NET PRICE OR PER UNIT VALUE ADDED
(4.4) MARGINAL PRODUCTIVITY CONDITION
XK = f [LK, KK, (VίίίίK)]
VK = ΣVKίίίί = ΣAKίίίί Xίίίί ίίίί
PNK = PDK - Σ AίίίίKPίίίί ίίίί
LK = qk [XK, PNK, WK]
20
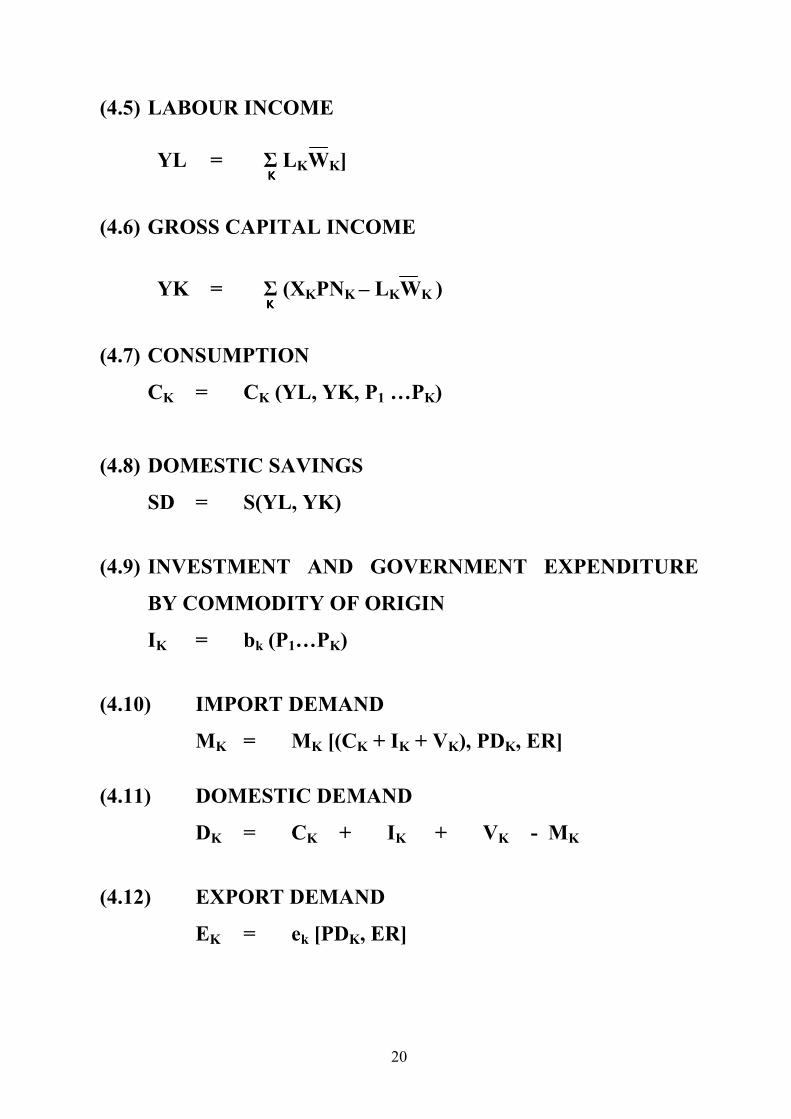
(4.5) LABOUR INCOME
(4.6) GROSS CAPITAL INCOME
(4.7) CONSUMPTION
CK = CK (YL, YK, P1 �PK)
(4.8) DOMESTIC SAVINGS
SD = S(YL, YK)
(4.9) INVESTMENT AND GOVERNMENT EXPENDITURE
BY COMMODITY OF ORIGIN
IK = bk (P1�PK)
(4.10) IMPORT DEMAND
MK = MK [(CK + IK + VK), PDK, ER]
(4.11) DOMESTIC DEMAND
DK = CK + IK + VK - MK
(4.12) EXPORT DEMAND
EK = ek [PDK, ER]
YL = Σ LKWK]
KKKK
YK = Σ (XKPNK � LKWK )
KKKK
21
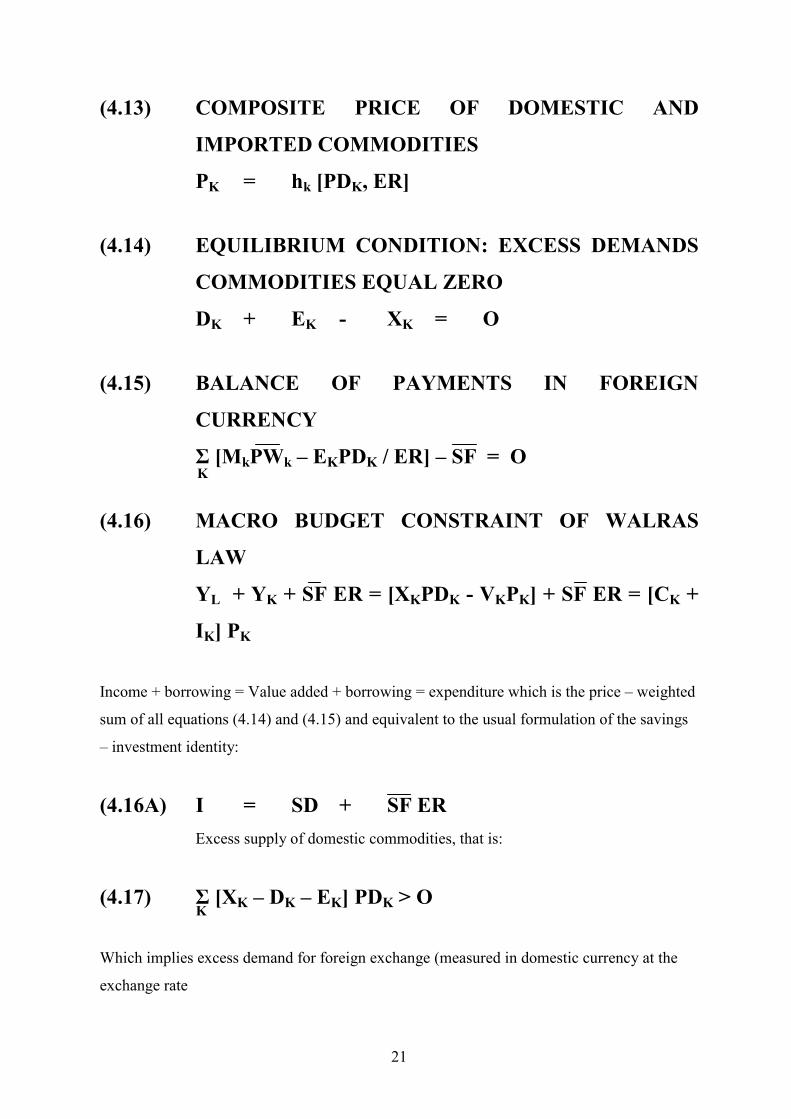
(4.13) COMPOSITE PRICE OF DOMESTIC AND
IMPORTED COMMODITIES
PK = hk [PDK, ER]
(4.14) EQUILIBRIUM CONDITION: EXCESS DEMANDS
COMMODITIES EQUAL ZERO
DK + EK - XK = O
(4.15) BALANCE OF PAYMENTS IN FOREIGN
CURRENCY
Σ [MkPWk � EKPDK / ER] � SF = O
(4.16) MACRO BUDGET CONSTRAINT OF WALRAS
LAW
YL + YK + SF ER = [XKPDK - VKPK] + SF ER = [CK +
IK] PK
Income + borrowing = Value added + borrowing = expenditure which is the price � weighted
sum of all equations (4.14) and (4.15) and equivalent to the usual formulation of the savings
� investment identity:
(4.16A) I = SD + SF ER Excess supply of domestic commodities, that is:
(4.17) Σ [XK � DK � EK] PDK > O
Which implies excess demand for foreign exchange (measured in domestic currency at the
exchange rate
K
K

22
(4.17A) Σ [MkPWk ER � Σ EKPDK � SF ER > O
Walras Law means that the sum of all excess demands equal zero, that is, only K equilibrium
conditions out of K + 1 [eq. (4.14) and (4.15)] are independent. Equilibrium on K markets
implies equilibrium on the [K + 1) markets.
The Glossary of variables of the above model are as follows:
Aίίίίk = Input � output coefficient
CK = Consumption
DK = Domestic Demand
EK = Export demand
ER = Exchange rate
IK = Investment and government expenditure by commodity
KK = Capital stock
LK = Employment
MK = Composite Price of domestic and imported commodities
PK = Import Demand
PDK = Domestic Price
PNK = Per unit value-added
PWK = World Price
SD = Domestic Savings
SF = Foreign savings in foreign currency
VK = Intermediate demand
WK = Sectoral wage rate
XK = Production
YK = Gross Capital income
YL = Gross Labour income
K K
23
The above model is designed as a tool for policy making. Its interest lies in the ability to
describe socio-economic mechanisms and the effects of exogenously introduced policies
possible simulation (policy questions) include changes in government policy instruments (tax
rates, current and capital expenditure, access of various socio-economic groups to
government services) � how will basic needs satisfaction, income distribution employment
and the production structure change when certain policy packages are introduced; changes in
medium-run structural characteristics of the country � population growth, foreign savings,
urban-rural composition and import function parameters; changes in various exogenous
prices such as wage and interest rates; changes in �closure rules� � the expenditures of a
variety of institutions or households can be specified as the residual item which brings about
income expenditure equilibrium (government investment may be residual or household
consumption or foreign savings); changes in the parameters describing the structural impact
of basic needs satisfaction � which medium run effects can be expected when basic needs
satisfaction has a larger (smaller) impact on certain structural variables?
5.0 THE SAM FRAMEWORK
The Social Accounting Matrix (SAM) is a comprehensive, disaggregated, consistent and
complete data system that captures the interdependence that exists within a socioeconomic
system. Thus, depending on the classification scheme used to record transactions and the
extent of disaggregation, the SAM can provide useful information about such key issues as
intersectoral linkages, socioeconomic groups given the structure and technology of
production and the resource endowments of these groups; and the relationship between a
given regional economy and other regional economies within a nation, and with the rest of
the world Alternatively, the SAM can be used as a conceptual framework to explore the
impact of exogenous changes in such variables as exports, certain categories of government
expenditures, and investment on the whole interdependent socioeconomic system, that is, the
resulting structure of production factorial and household income distributions. As such the
SAM becomes the basis for simple multiplier analysis and the building and calibration of a
variety of applied general equilibrium models (Thorbecke, 1985, Decaluwe et.al. 1999).
Basically, a SAM can be seen as a numerical representation of the economic cycle
with emphasis on distributive aspects. As in the complete system of National Accounts
(United National, 1968) and in the Input � Output framework, transactions in a particular
24
year appear in a matrix format showing receipts on the rows and outlays in the columns. In
other words, this framework shows how sectoral value added accrues to production factors
and their institutional owners; how these incomes, corrected for net current transfers are
spent; and how expenditures on commodities lead to sectoral production and value added.
The Leakages from this cycle (in the form of payments abroad or savings) are also shown. In
turn, capital finance may then be linked to savings, thereby presenting a glimpse of the
dynamics in an economy (Keuning, et.al, 1988). Indeed, the essence of a SAM lies in its
comprehensive recording of the inter-relationships at the meso-level. This means a
disaggregation of the household sector (plus the various categories of value added) and
primary inputs into production and final (household) demand are linked.
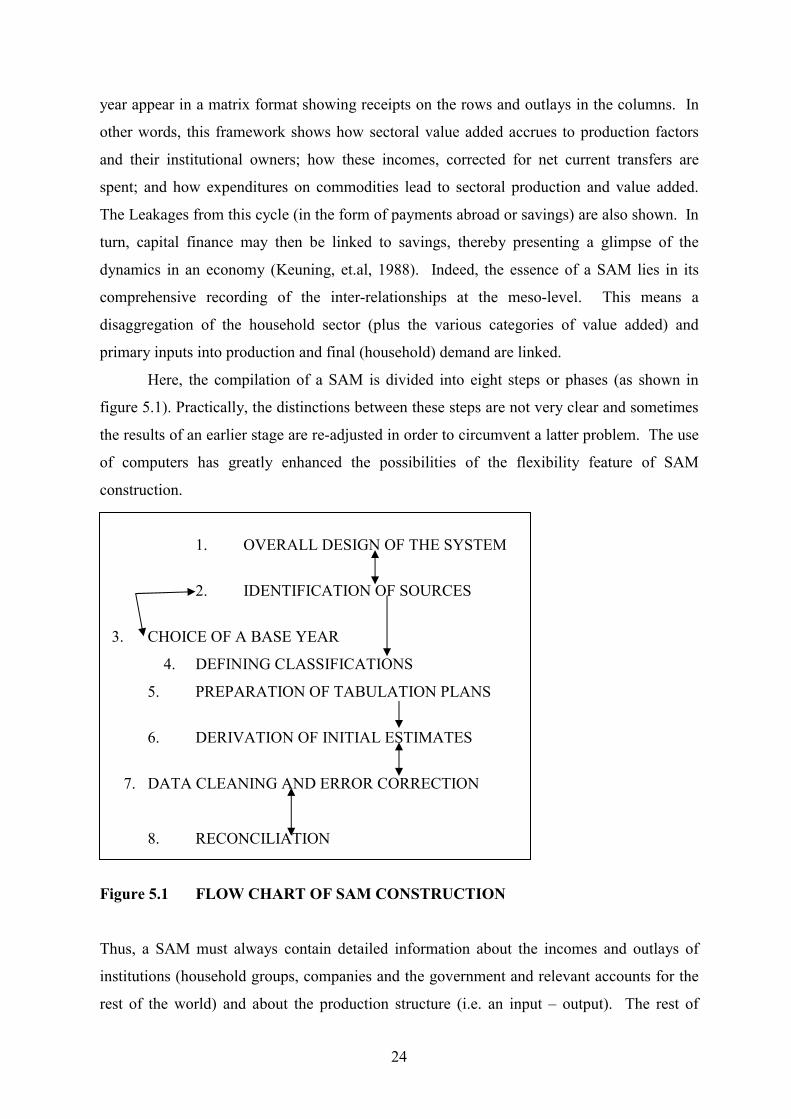
Here, the compilation of a SAM is divided into eight steps or phases (as shown in
figure 5.1). Practically, the distinctions between these steps are not very clear and sometimes
the results of an earlier stage are re-adjusted in order to circumvent a latter problem. The use
of computers has greatly enhanced the possibilities of the flexibility feature of SAM
construction.
1. OVERALL DESIGN OF THE SYSTEM
2. IDENTIFICATION OF SOURCES
3. CHOICE OF A BASE YEAR
4. DEFINING CLASSIFICATIONS
5. PREPARATION OF TABULATION PLANS
6. DERIVATION OF INITIAL ESTIMATES
7. DATA CLEANING AND ERROR CORRECTION
8. RECONCILIATION
Figure 5.1 FLOW CHART OF SAM CONSTRUCTION
Thus, a SAM must always contain detailed information about the incomes and outlays of
institutions (household groups, companies and the government and relevant accounts for the
rest of the world) and about the production structure (i.e. an input � output). The rest of
25
design depends on national socio-economic structure, policy needs and availability of data
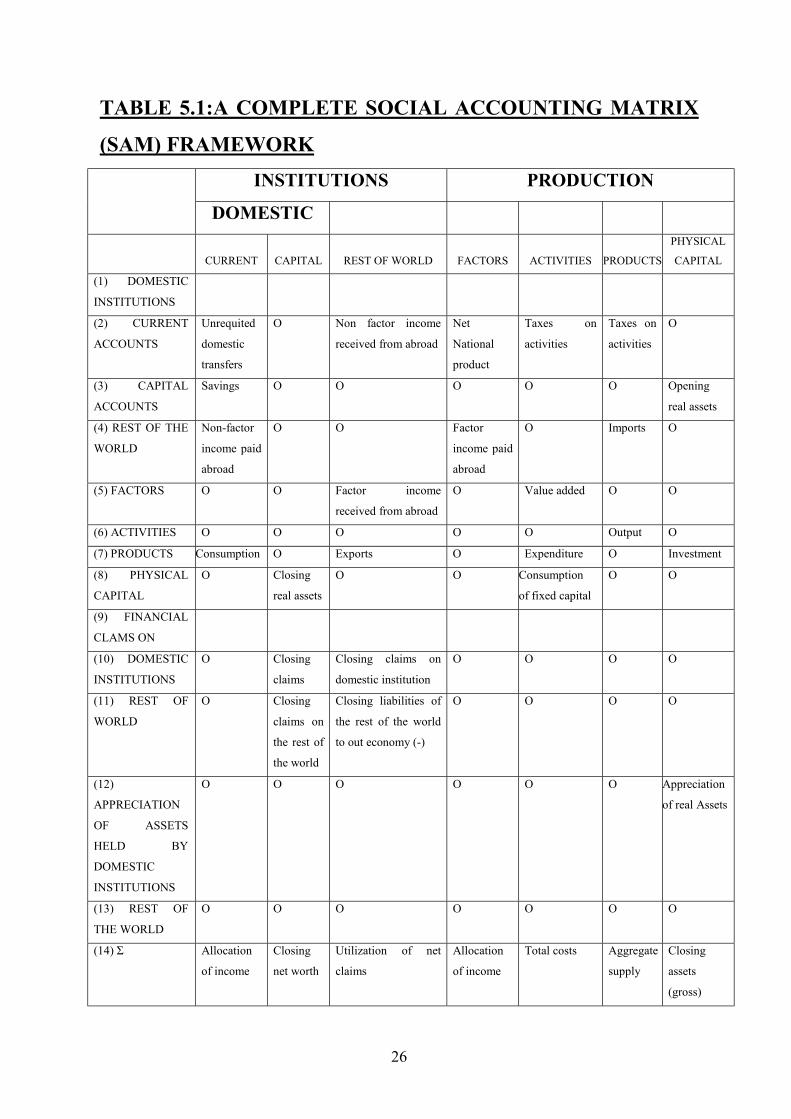
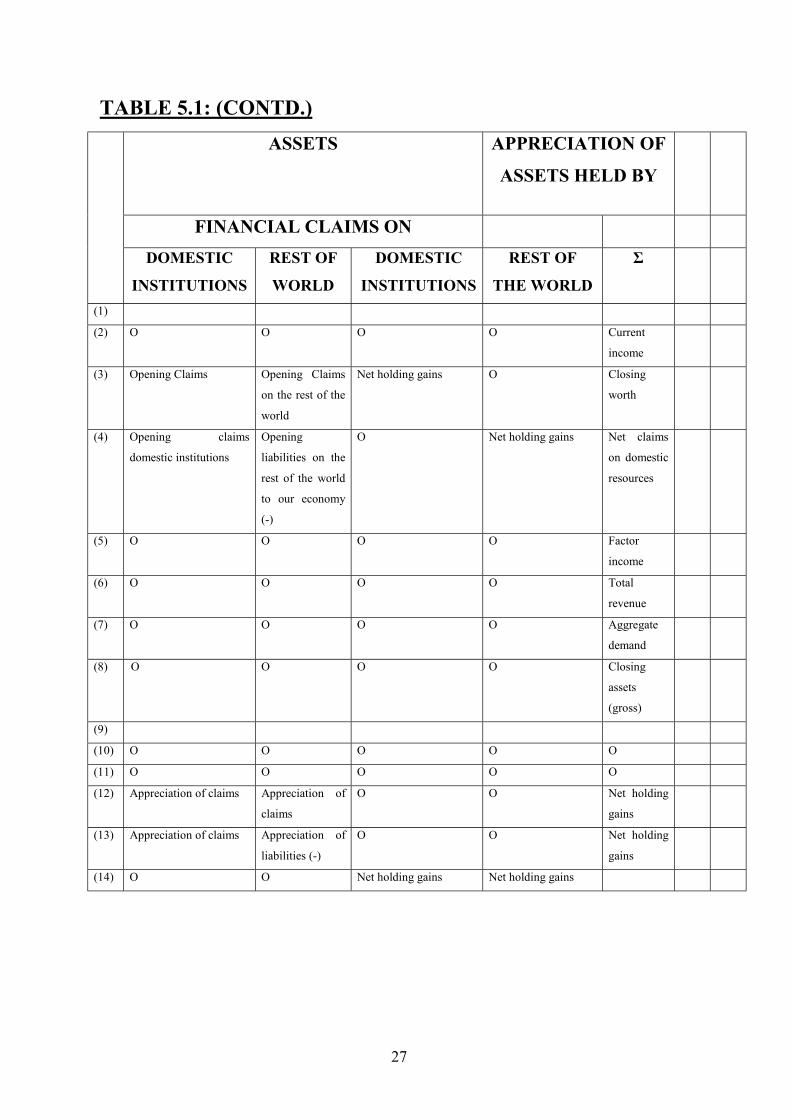
and resources. Table 5.1 presents an example of a complete SOCIAL ACCOUNTING
MATRIX (SAM) Framework. Instructions, asset and transactions are the three fundamental
elements of social accounting. The institutions of a society are to be understood for our
purposes as legal entities have two key attributes, specifically, that they can own assets and
incur liabilities; and engage in transactions. It therefore follows that people, government
departments and private companies are all examples of institutions. The assets, which can be
owned by an institution, are of two main types that are referred to as real and financial assets.
The real assets include physical or real capital (Plants buildings, equipment, stocks of
finished products, raw materials and work in progress); Natural resources (law, minerals,
water, air, vegetation) and Human resources (skills of different types). The Financial claims
include claims on households (mortgages, loans and credits); on companies (equity, loans)
and on government (securities, money). Transactions are fundamental elements in
economics. There are three varieties: gifts (or unrequited transfers); the sale/purchase of a
good or service; and the sale / purchase of a financial asset.
26
TABLE 5.1:A COMPLETE SOCIAL ACCOUNTING MATRIX
(SAM) FRAMEWORK INSTITUTIONS PRODUCTION
DOMESTIC
CURRENT CAPITAL REST OF WORLD FACTORS ACTIVITIES PRODUCTS
PHYSICAL
CAPITAL
(1) DOMESTIC
INSTITUTIONS
(2) CURRENT
ACCOUNTS
Unrequited
domestic
transfers
O Non factor income
received from abroad
Net
National
product
Taxes on
activities
Taxes on
activities
O
(3) CAPITAL
ACCOUNTS
Savings O O O O O Opening
real assets
(4) REST OF THE
WORLD
Non-factor
income paid
abroad
O O Factor
income paid
abroad
O Imports O
(5) FACTORS O O Factor income
received from abroad
O Value added O O
(6) ACTIVITIES O O O O O Output O
(7) PRODUCTS Consumption O Exports O Expenditure O Investment
(8) PHYSICAL
CAPITAL
O Closing
real assets
O O Consumption
of fixed capital
O O
(9) FINANCIAL
CLAMS ON
(10) DOMESTIC
INSTITUTIONS
O Closing
claims
Closing claims on
domestic institution
O O O O
(11) REST OF
WORLD
O Closing
claims on
the rest of
the world
Closing liabilities of
the rest of the world
to out economy (-)
O O O O
(12)
APPRECIATION
OF ASSETS
HELD BY
DOMESTIC
INSTITUTIONS
O O O O O O Appreciation
of real Assets
(13) REST OF
THE WORLD
O O O O O O O
(14) Σ Allocation
of income
Closing
net worth
Utilization of net
claims
Allocation
of income
Total costs Aggregate
supply
Closing
assets
(gross)
27
TABLE 5.1: (CONTD.) ASSETS APPRECIATION OF
ASSETS HELD BY
FINANCIAL CLAIMS ON
DOMESTIC
INSTITUTIONS
REST OF
WORLD
DOMESTIC
INSTITUTIONS
REST OF
THE WORLD
Σ
(1)
(2) O O O O Current
income
(3) Opening Claims Opening Claims
on the rest of the
world
Net holding gains O Closing
worth
(4) Opening claims
domestic institutions
Opening
liabilities on the
rest of the world
to our economy
(-)
O Net holding gains Net claims
on domestic
resources
(5) O O O O Factor
income
(6) O O O O Total
revenue
(7) O O O O Aggregate
demand
(8) O O O O Closing
assets
(gross)
(9)
(10) O O O O O
(11) O O O O O
(12) Appreciation of claims Appreciation of
claims
O O Net holding
gains
(13) Appreciation of claims Appreciation of
liabilities (-)
O O Net holding
gains
(14) O O Net holding gains Net holding gains

28
A basic tenant of social accounting is to treat all transactions as cash transactions either
because they implications in terms of the ownership of assets can be expressed as a sequence
of cash transactions (Pyatt, 1991).
Because a SAM can also be seen as extension of as input � output (I-O) matrix, such
as table usually serves as a fruitful starting point. If an I-O matrix is available, the main tasks
which remain are: linking primary incomes and final demand (mapping factor incomes to
household incomes after correction for transfers, to consumption expenditures):
Disaggregating primary incomes (by factor type) and part of final demand, namely household
consumption expenditures (by household group) and fixed capital formation (by sector in
which the investment takes place and possibly by investing institution); collecting
supplementary information on savings, interinstitutional transfers (taxes, dividends
government subsidies and grants to private institutions, transfers between household groups
and the like), current transactions with the rest of the world not shown by the balance of trade
(factor services interest payments, emigrant remittances) and ideally, the flow of funds.
Commonly, the supplementary data can be obtained from a variety of sources and minimally
needed are: National Accounts, demographic data, survey data on wages and entrepreneurial
incomes, household budget survey, government statistics, itemized balance � of � payments
data, and for a flow of funds block, financial data, usually collected by the Central Bank are
indispensable. If no nation-wide source for certain information is available, even individual
company accounts and micro-studies can be useful combined with some common-sense
notions about the representatives of the results, they indicate at least the order of magnitude
of the variable concerned. After identifying data sources, and with bearing in mind recent
fluctuations in economic conditions, a reference year for the SAM should be chosen. For the
Nigerian case, we plan to choose 1990 as our base year (given the existence of 1990 input �
output table as compiled by the Federal office of statistics of Nigeria) unless otherwise.
6.0 MODEL SOLUTION TECHNIQUE
The solution of a large-scale computable general equilibrium model is a difficult
computational problem that in the past has limited the application of such models. Modelers
often had to tailor the model�s structure to particular solution method, and frequently devoted
as much time or more to grappling with solution algorithms on mainframe computers as was
spent in pursuit of economic insights. Moreover, these models could not be moved to other
29
environments because of the specialized programming knowledge needed and also because
of data formats.
Indeed, model building in a strategic planning environment is a dynamic process,
where models are used as a way to unravel the complex real-world situation of interest. This
implies not only that a model builder must be able to develop and modify models
continuously in a convenient manner but also that a model builder must be able to express all
the relevant structural and partitioning information contained in the model in a convenient
short-hand notation. Only by providing a capability to express partitioning, mappings,
nesting and conditional information can we expect to be able to communicate the
complexities interest in large-scale real-world phenomena (Bisschop and Meeraus, 1982).
GAMS (General Algebraic Modelling System) is a computer language which was
originally developed to assist economists at the World Bank in the quantitative analysis of
economic policy questions (Meeraus, 1983; Brooke, Kendrick, and Meeraus, 1987). At the
time of its conception and initial development, Linear Programming (LP) was the standard
framework in which market equilibrium modes were constructed. Subsequently solution
algorithms and lodes for general nonlinear programming representations became more
common and alternative economic paradigms were developed (Ruther Ford, 1995).
However, the situation is rapidly changing because of the increasing power and
availability of personal computer that allows every modeler to have desktop access to
computational resources. Thus, the development of packaged software to solve complex
mathematical (statistical) problems has permitted modelers to return their attention to
economics; and such packages include GEMPACK, GEMODEL, GAUSS, etc. Here, we
intend to Calibrate the constructed Nigerian AGE � SAM based model using the modern
software.
7.0 ANTICIPATED RESULTS AND DISSEMINATION
The National governments, international organizations, private sectors and civil
societies are today making substantial effort to incorporate poverty reduction measures in
their regular operations. In particular, the Federal Government of Nigeria retains the vestiges
of good systems for planning, budgeting, managing and controlling of public resources. But
their performance has deteriorated to such as extent that they provide negligible assurance
that resources are used entirely for their intended purpose. The same is true at the state and

30
local level. To return to an acceptable level of financial accountability and poverty reduction
will require sustained action over several years. Our research result is therefore expected to
provide a quantitative policy framework for the various poverty reduction measures of the
stakeholders. It is also expected to be an essential component in our efforts to establish the
basis for Long-term and sustainable development in Nigeria. This is in addition to
contributing to existing knowledge and future research in macro-modelling.
Indeed, our research output will be published accordingly and disseminated to the
various professional economists and policy makers in the nation and the rest of the world.
Such policy-making institutions include the National Planning Commission, the presidency,
Central Bank of Nigeria, United Nations, World Bank, International monetary Fund, the
African Development Bank, the Africa union, Economic Community of West African States,
African Economic Research consortium and poverty reduction networks.
31
8.0 REFERENCES
Abel, A.B. and O. J. Blanchard (1983) �An intertemporal model of savings and investment�,
Econometrica 51: 675 � 92
Adenikinju, A.A. (1994) �Analysis of Energy Policies in Nigeria: An Application of
computable General Equilibrium Model�, AN unpublished PHD thesis,
Department of Economics, University of Ibadan.
Ajakaiye, D.O. (1999) �Macroeconomic effects of VAT IN NIGERIA: A computable general
Equilibrium Analysis�, AREC Research Report, Nairobi Kenya.
Ajakaiye, D.O. (19994) �Short run macroeconomic effects of bank lending rates in Nigeria
(1981 � 91): A computable general equilibrium Analysis�, AERC Final
Research Report, Nairobi, Kenya
Bandara, J.S. (1991) �Computable General Equilibrium models for development Policy
analysis in LDCS, Journal of Economic Surveys 5, 3 � 69
Bisschop, J. and A. Meeraus (1982) �On the Development of a general algebraic modeling
system in a strategic planning environment�, Mathematical Programming
Study 20, 1 – 29
Brooke, T.D. et.al. (1987) GAMS: A Users guide, San Francisco: Scientific press
Canagarajah, S., J. et.al. (1997) �Evolution of Poverty and Welfare in Nigeria: 1985 � 92�,
World Bank Policy Research Working Paper 1715
CBN (1960-) Central Bank of Nigeria Annual Report and Statement of Accounts (various
issues).
CBN (1997) Central Bank of Nigeria Annual Report and statement of Accounts
CBN (1998) Central Bank of Nigeria Annual Report and statement of Accounts.

32
CBN (2000) The Changing structure of the Nigerian Economy and Implications for
Development, Lagos: Realm Communication / Central Bank of Nigeria
Collier, P. and J. Gunning (1999) �Explaining African Economic Performance�, Journal of
Economic Literature, March, XXXVI 64 � 111
De Melo, J. (1988) �Computable General Equilibrium models for trade policy analysis in
developing countries: A survey�, Journal of Policy Modelling, 12, 625 � 657
Decaluwé, B. et.al. (1999) �Poverty Analysis within a general equilibrium framework�,
Paper presented to the African Economic Research Consortium biannual
conference, (May/June) Accra, Ghana.
Dervis, K. et.al. (1982) General Equilibrium Models for Development Policy, Cambridge:
Cambridge University Press.
FGN (2000) Draft National Policy on Poverty Eradication, ABUJA: federal Government of
Nigeria.
FGN (2001) National Poverty Eradication Programme (NAPEP) ABUJA: Federal
Government of Nigeria (FGN).
Keuning. S.T. et.al. (1988) �Guidelines for the construction of a social Accounting Matrix�,
Review of Income and Wealth, series 34, N01.
Kouwenour, A. (1988) A Basic Needs Policy Model, Hague: Netherlands
Meeraus, A., (1983) �An Algebraic approach to Modelling� Journal of Economic dynamic
and control 5.
Nwaobi, G.C. (1997) �Environmental Policy Simulation within a Framework of dynamic
Applied General Equilibrium Model of the Nigerian Economy�, A Thesis
submitted to the Department of Economics University of Ibadan, Nigeria.
33
Nwaobi, G.C. (2000) The Knowledge Economics Trends and Perspectives, Lagos:
QUANTERB / GOAN COMMUNICATIONS.
Nwaobi, G.C. (2002) �Emission Policies and the Nigerian Economy: Simulations from a
dynamic applied General Equilibrium model, NEP � CMP � 2002 � 06 � 13
NEP report on Computational Economics
Pyatt, G. (1991) �Fundamentals of Social Accounting�, Economic Systems Research, Vol. 3
N0 3.
Pyatt, G. and J.I Round (1985) Social Accounting Matrices: A Basis for Planning,
Washington World Bank.
Rutherford, T.F. (1995) �Extension of GAMS for complementarity problems arising in
applied economic analysis", Journal of Economic Dynamics and Control,
19: 1299 � 1324
Sen, A. (1999) Hunger and Public Action, Oxford: clarerdon
Shoven, J.B. and J. Whalley (1992) Applying General Equilibrium, Cambridge: Cambridge
University Press.
Stone, R. (1986) �Noble Memorial Lecture, 1984: The Accounts of Society \�, Journal of
Applied Econometrics, Vol. I
Thorbecke, E (1998) �Social Accounting Matrices and Social Accounting Analysis�, in W.
Isard et.al (eds.) Methods of Interregional and Regional Analysis, Brook
field: Ashgate Publishing
Thorbecke, E. (1995) Intersectoral Linkages and their impact on Rural Poverty Alleviation:
A Social Accounting matrix, Vienna: UNIDO
United Nations (1997) Human Development Report, New York: United Nations
34
United Nations Statistical Office (1968) A System of National Accounts Series F. N02,
Rev3, New York: United Nations.
World Bank (1996) �Nigeria: Poverty in the midst of Poverty�, A World Bank Poverty
Assessment Report N0 14733 � UNI
World Bank (2000) Can Africa Claim the 21st Century, Washington: World Bank
World Bank (2001) World Development Report, Oxford: Oxford University Press