Embed Size (px)
Citation preview

Solving Systems of LinearEquations and InequalitiesChapter Overview and Pacing
Solving Systems of LinearEquations and InequalitiesChapter Overview and Pacing
PACING (days)Regular Block
Basic/ Basic/ Average Advanced Average Advanced
Slope (pp. 256–262) 1 1 0.5 0.5• Find the slope of a line.• Use rate of change to solve problems.
Slope and Direct Variation (pp. 264–270) 1 1 0.5 0.5• Write and graph direct variation equations.• Solve problems involving direct variation.
Slope-Intercept Form (pp. 271–279) 2 2 1 1Preview: Use manipulatives to investigate slope-intercept form. (with 5-3 (with 5-3 (with 5-3• Write and graph linear equations in slope-intercept form. Preview) Follow-Up) Follow-Up)• Model real-world data with an equation in slope-intercept form.Follow-Up: Use a graphing calculator to identify families of linear graphs.
Writing Equations in Slope-Intercept Form (pp. 280–285) 2 2 1 1• Write an equation of a line given the slope and one point on a line.• Write an equation of a line given two points on the line.
Writing Equations in Point-Slope Form (pp. 286–291) 1 2 0.5 1• Write the equation of a line in point-slope form. (with 5-4• Write linear equations in different forms. Follow-Up)
Geometry: Parallel and Perpendicular Lines (pp. 292–297) 2 1 1 0.5• Write an equation of the line that passes through a given point, parallel to a given line.• Write an equation of the line that passes through a given point, perpendicular to a
given line.
Statistics: Scatter Plots and Lines of Fit (pp. 298–307) 3 2 1 1• Interpret points on a scatter plot. (with 5-7 (with 5-7• Write equations for lines of fit. Follow-Up) Follow-Up)Follow-Up: Use a graphing calculator to find a median-fit line.
Study Guide and Practice Test (pp. 308–313) 1 1 1 1Standardized Test Practice (pp. 314–315) (with 5-7 (with 5-7
Follow-Up) Follow-Up)
Chapter Assessment 1 1 0.5 0.5
TOTAL 14 13 7 7
LESSON OBJECTIVES
254A Chapter 5 Analyzing Linear Equations
Pacing suggestions for the entire year can be found on pages T20–T21.

*Key to Abbreviations: GCS � Graphing Calculator and Speadsheet Masters,SC � School-to-Career Masters, SM � Science and Mathematics Lab Manual
Study Guide and Intervention, Skills Practice, Practice, and Parent and Student Study Guide Workbooks are also available in Spanish.
ELL
Chapter 5 Analyzing Linear Equations 254B
Materials
281–282 283–284 285 286 39–40, 38 5-1 5-1 uncooked spaghetti,63–64 transparency showing
coordinate plane
287–288 289–290 291 292 337 29–30 SM 41–44 39 5-2 5-2 graphing calculator
293–294 295–296 297 298 SC 9 40 5-3 5-3 (Preview: scissors, plastic sandwich bags, long rubberbands, tape, centimeterruler, metal washers)(Follow-Up: graphing calculator)
299–300 301–302 303 304 337, 339 SC 10 41 5-4 5-4 11
305–306 307–308 309 310 GCS 31 42 5-5 5-5 12
311–312 313–314 315 316 338 43 5-6 5-6 13 grid paper, scissors, graphing calculator
317–318 319–320 321 322 338 GCS 32, 44 5-7 5-7SM 51–56
323–336, 45340–342
Chapter Resource ManagerChapter Resource ManagerSt
udy
Guid
e
and
Inte
rven
tion
Prac
tice
(Ski
lls a
nd A
vera
ge)
Read
ing
to L
earn
Mat
hem
atic
s
Enric
hmen
t
Asse
ssm
ent
Alge
PASS
: Tut
oria
l
Plus
(les
sons
)
5-M
inut
e Ch
eck
Tran
spar
enci
es
Pare
nt a
nd S
tude
nt
Stud
y Gu
ide
Wor
kboo
k
Appl
icat
ions
*
Prer
equi
site
Ski
llsW
orkb
ook
CHAPTER 5 RESOURCE MASTERS
Inte
ract
ive
Chal
kboa
rd
Timesaving Tools
All-In-One Planner and Resource Center
See pages T12–T13.
™

254C Chapter 5 Analyzing Linear Equations
Mathematical Connections and BackgroundMathematical Connections and Background
SlopeThe slope of a straight line is one of the most
important characteristics of the line. The slope, a ratio ofthe vertical change in the line to the horizontal change,can be expressed in many ways. One common definition is �rr
iusne
�, which can frequently be observed from graphed lines. On lines in which two points have beenidentified, you can also use the algebraic definition,
�yx
22
�
�
yx
11
�, for which (x1, y1) and (x2, y2) represent the
coordinates of points on that line. Rate of change describes how rapidly a line rises
or falls. It also is used in the real-world context toexpress the relationship between two quantities, forexample number of words typed in each minute.
Slope and Direct VariationThe concept of direct variation grows from the
meaning of ratio (Lesson 3-6). If the ratio of two vari-ables is a constant, then direct variation is the way ofexpressing the relationship between the two variables.
That is, �yx� � k, where y and x are variables and k is a
constant (number). If you multiply each side of theequation by x, you get y � kx. This represents an equa-tion of a line and the k is the same value as the slope ofthe line. So when you graph a direct variation, you aregraphing lines with slope k. All of these lines passthrough the origin. In real-world applications, mostdirect variation graphs only occupy the first quadrant.
Slope-Intercept FormSlope-intercept form is y � mx � b, where m is
the slope and b is the y-value where the line crosses they-axis. The slope-intercept form offers two ways tograph a line. One can select two values for x and veryeasily calculate the corresponding values of y to createtwo ordered pairs that can be used to graph points onthe line. Then the line is drawn that contains those twopoints. One can also use the slope and intercept tograph the line directly. The intercept gives a startingpoint on the y-axis. Use the slope to determine the dis-tance and direction you go up/down and right/left tofind another point on the line. Then draw the line.
Prior KnowledgePrior KnowledgeIn Chapter 3, students learned to solve equa-tions for a given variable (algebraic manipu-lation). In Chapter 4, students graphed andanalyzed points that composed a relation orfunction. They learned that two pointsdetermine a specific line. They also plottedpoints that represent real-world data.
This Chapter
Future ConnectionsFuture ConnectionsSlope is a key concept that spans mathe-matics through calculus and beyond. Byknowing the characteristics of linear equa-tions, students can determine what type(s)of solutions a system of equations mighthave. The concept of a best-fit line (or curve)is used again in Algebra 2 and Statisticscourses.
Continuity of InstructionContinuity of Instruction
This ChapterStudents closely examine the equations thatrepresent the linear functions they graphedin Chapter 4. They learn to graph equationswithout finding two specific points. They usetheir skills in algebraic manipulation torewrite linear equations in various forms.Students use their equation-writing skills to
describe relationships in real-world data they have graphed.

Chapter 5 Analyzing Linear Equations 254D
Writing Equations in Slope-Intercept FormIt is important to understand what an equation
represents and how to use it as a tool. The generalexpression for slope-intercept form is y � mx � b.This is the starting point for creating an equation fromdifferent types of information given. The goal is to usethe given information to find values for m and b, sothat you can rewrite the general form with x and ybeing the only unknowns.
Writing Equations in Point-Slope FormPoint-slope form is derived from the definition
of slope using the coordinates of two points on a line.Suppose one point is given as (x1, y1) and anotherpoint is unknown (x, y). Using the definition of slope,
you get m � �yx
�
�
yx
11
� . Multiply each side by (x � x1)
and use the symmetric property of equality. You get y � y1 � m(x � x1), which is the point-slope form of alinear equation.
You can also manipulate equations in point-slope form and slope-intercept form to express themin standard form, Ax � By � C.
Geometry: Parallel and Perpendicular LinesThis is a part of mathematics often called
coordinate geometry or analytic geometry. In coordinategeometry, you use graphing and properties of graphsto prove geometric concepts. What properties,besides not intersecting, do parallel lines have? Theylie in the same plane and have the same slope. Nowconsider perpendicular lines. We know they intersect,so they cannot have the same slope. Actually, theyslope in opposite directions. That is, if one is vertical,the other is horizontal; if one slopes upward, theother slopes downward. A comparison of slopes ofthe two lines will lead you to discover that they arenegative reciprocals of each other.
To write the equation of a line that is parallel toor perpendicular to a given line, you must realize thatyou are still using the equation-writing skills present-ed in the previous lessons. You still need the slope andthe coordinates of one of the points on the line to writethe equation. Using the properties of parallel and per-pendicular lines helps you to determine what slopeyou are using and the point is usually given to you.
Statistics: Scatter Plots andLines of FitA scatter plot includes graphs of ordered pairs
that belong to a set in which the first coordinate rep-resents one real-world measurement and the secondcoordinate represents another. Scatter plots can beused to visually identify trends, if they exist, anddetermine how strong that trend is.
At this point in their studies, students do nothave the mathematical background to attempt to writethe equation of a best-fit line by using statistical for-mulas. So, they draw a line that seems characteristic ofthe data, select two points on that line, and then usethose points to write an equation. Using this method,there are many correct best-fit lines that can be drawn.This should be understood so that students realize thatpredictions are totally dependent on the line drawnand have no factual rule for determining them.
Additional mathematical information and teaching notesare available in Glencoe’s Algebra 1 Key Concepts:Mathematical Background and Teaching Notes, which is available at www.algebra1.com/key_concepts. The lessons appropriate for this chapter are as follows.• Slope (Lesson 7) • Writing Linear Equations in Slope-Intercept Form
(Lesson 10) • Writing Linear Equations in Point-Slope and Standard
Forms (Lesson 8)• Graphing Linear Equations (Lesson 12)• Intergration: Geometry/Parallel and Perpendicular
Lines (Lesson 13)• Statistics: Scatter Plots and Best-Fit Lines (Lesson 9)
www.algebra1.com/key_concepts
254E Chapter 5 Analyzing Linear Equations
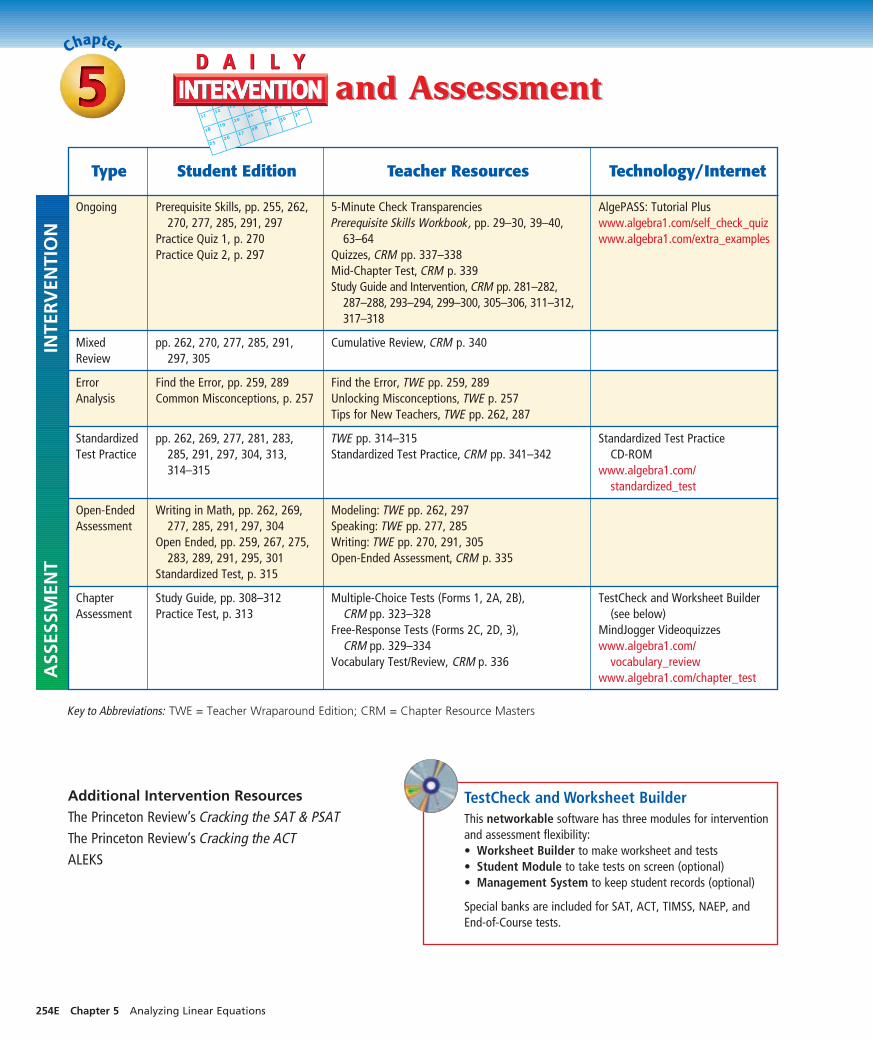
TestCheck and Worksheet BuilderThis networkable software has three modules for interventionand assessment flexibility:• Worksheet Builder to make worksheet and tests• Student Module to take tests on screen (optional)• Management System to keep student records (optional)
Special banks are included for SAT, ACT, TIMSS, NAEP, and End-of-Course tests.
Key to Abbreviations: TWE = Teacher Wraparound Edition; CRM = Chapter Resource Masters
Ongoing Prerequisite Skills, pp. 255, 262,270, 277, 285, 291, 297
Practice Quiz 1, p. 270Practice Quiz 2, p. 297
AlgePASS: Tutorial Pluswww.algebra1.com/self_check_quizwww.algebra1.com/extra_examples
5-Minute Check TransparenciesPrerequisite Skills Workbook, pp. 29–30, 39–40,
63–64Quizzes, CRM pp. 337–338Mid-Chapter Test, CRM p. 339Study Guide and Intervention, CRM pp. 281–282,
287–288, 293–294, 299–300, 305–306, 311–312,317–318
MixedReview
Cumulative Review, CRM p. 340 pp. 262, 270, 277, 285, 291,297, 305
ErrorAnalysis
Find the Error, TWE pp. 259, 289Unlocking Misconceptions, TWE p. 257Tips for New Teachers, TWE pp. 262, 287
Find the Error, pp. 259, 289Common Misconceptions, p. 257
StandardizedTest Practice
TWE pp. 314–315Standardized Test Practice, CRM pp. 341–342
Standardized Test Practice CD-ROM
www.algebra1.com/standardized_test
pp. 262, 269, 277, 281, 283,285, 291, 297, 304, 313,314–315
Open-EndedAssessment
Modeling: TWE pp. 262, 297Speaking: TWE pp. 277, 285Writing: TWE pp. 270, 291, 305Open-Ended Assessment, CRM p. 335
Writing in Math, pp. 262, 269,277, 285, 291, 297, 304
Open Ended, pp. 259, 267, 275,283, 289, 291, 295, 301
Standardized Test, p. 315
ChapterAssessment
Multiple-Choice Tests (Forms 1, 2A, 2B), CRM pp. 323–328
Free-Response Tests (Forms 2C, 2D, 3), CRM pp. 329–334
Vocabulary Test/Review, CRM p. 336
TestCheck and Worksheet Builder(see below)
MindJogger Videoquizzes www.algebra1.com/
vocabulary_reviewwww.algebra1.com/chapter_test
Study Guide, pp. 308–312Practice Test, p. 313
Additional Intervention ResourcesThe Princeton Review’s Cracking the SAT & PSATThe Princeton Review’s Cracking the ACTALEKS
and Assessmentand AssessmentA
SSES
SMEN
TIN
TER
VEN
TIO
N
Type Student Edition Teacher Resources Technology/Internet

Chapter 5 Analyzing Linear Equations 254F
Algebra 1Lesson
AlgePASS Lesson
5-4 11 Finding x- and y-intercepts of LinearEquations
5-5 12 Writing Equations of Lines
5-6 13 Effects of Parameter Changes on LinearFunctions
ALEKS is an online mathematics learning system thatadapts assessment and tutoring to the student’s needs.Subscribe at www.k12aleks.com.
For more information on Reading and Writing inMathematics, see pp. T6–T7.
Intervention at HomeParent and Student Study Guide Parents and students may work together to reinforce theconcepts and skills of this chapter. (Workbook, pp. 38–45 or log on to www.algebra1.com/parent_student)
Intervention TechnologyAlgePASS: Tutorial Plus CD-ROM offers a complete, self-paced algebra curriculum.
Reading and Writingin Mathematics
Reading and Writingin Mathematics
Glencoe Algebra 1 provides numerous opportunities toincorporate reading and writing into the mathematics classroom.
Student Edition
• Foldables Study Organizer, p. 255• Concept Check questions require students to verbalize
and write about what they have learned in the lesson.(pp. 259, 267, 275, 283, 289, 291, 295, 301)
• Reading Mathematics, p. 263 • Writing in Math questions in every lesson, pp. 262, 269,
277, 285, 291, 297, 304• Reading Study Tip, p. 256• WebQuest, p. 304
Teacher Wraparound Edition
• Foldables Study Organizer, pp. 255, 308• Study Notebook suggestions, pp. 259, 263, 267, 271,
275, 283, 289, 295, 301 • Modeling activities, pp. 262, 297• Speaking activities, pp. 277, 285• Writing activities, pp. 270, 291, 305• Differentiated Instruction, (Verbal/Linguistic), p. 288• Resources, pp. 254, 261, 263, 268, 274, 276,
284, 288, 290, 296, 303, 308
Additional Resources
• Vocabulary Builder worksheets require students todefine and give examples for key vocabulary terms asthey progress through the chapter. (Chapter 5 ResourceMasters, pp. vii-viii)
• Reading to Learn Mathematics master for each lesson(Chapter 5 Resource Masters, pp. 285, 291, 297, 303,309, 315, 321)
• Vocabulary PuzzleMaker software creates crossword,jumble, and word search puzzles using vocabulary liststhat you can customize.
• Teaching Mathematics with Foldables provides suggestions for promoting cognition and language.
• Reading and Writing in the Mathematics Classroom• WebQuest and Project Resources• Hot Words/Hot Topics Sections 1.5, 2.1, 2.4, 4.3, 6.3,
6.4, 6.7, 6.8
ELL
For more information on Intervention andAssessment, see pp. T8–T11.
Log on for student study help.• For each lesson in the Student Edition, there are Extra
Examples and Self-Check Quizzes.www.algebra1.com/extra_exampleswww.algebra1.com/self_check_quiz
• For chapter review, there is vocabulary review, test practice, and standardized test practice.www.algebra1.com/vocabulary_reviewwww.algebra1.com/chapter_testwww.algebra1.com/standardized_test

Have students read over the listof objectives and make a list ofany words with which they arenot familiar.
Point out to students that this isonly one of many reasons whyeach objective is important.Others are provided in theintroduction to each lesson.
Analyzing Linear Equations
• slope (p. 256)• rate of change (p. 258)• direct variation (p. 264)• slope-intercept form (p. 272)• point-slope form (p. 286)
Key Vocabulary
254 Chapter 5 Analyzing Linear Equations
• Lesson 5-1 Find the slope of a line.
• Lesson 5-2 Write direct variation equations.
• Lessons 5-3 through 5-5 Write linear equationsin slope-intercept and point-slope forms.
• Lesson 5-6 Write equations for parallel andperpendicular lines.
• Lesson 5-7 Draw a scatter plot and write theequations of a line of fit.
Linear equations are used to model a variety of real-world situations. Theconcept of slope allows you to analyze how a quantity changes over time.
You can use a linear equation to model the cost of the space program.The United States began its exploration of space in January, 1958, when it launched its first satellite into orbit. In the 1970s, NASA developed thespace shuttle to reduce costs by inventing the first reusable spacecraft.You will use a linear equation to model the cost of the space program in Lesson 5-7.
254 Chapter 5 Analyzing Linear Equations
NotesNotes
NCTM LocalLesson Standards Objectives
5-1 2, 3, 4, 6, 7, 8, 9, 10
5-2 2, 4, 8, 9, 10
5-3 2, 3, 4, 8, 9, Preview 10
5-3 2, 3, 4, 6, 8, 9, 10
5-3 2, 6, 7, 8, 10 Follow-Up
5-4 2, 6, 8, 9, 10
5-5 2, 6, 8, 9, 10
5-6 2, 3, 6, 7, 8, 9, 10
5-7 2, 5, 6, 7, 8, 9, 10
5-7 2, 5, 7, 8, 9, Follow-Up 10
Key to NCTM Standards: 1=Number & Operations, 2=Algebra,3=Geometry, 4=Measurement, 5=Data Analysis & Probability, 6=ProblemSolving, 7=Reasoning & Proof,8=Communication, 9=Connections,10=Representation
Vocabulary BuilderThe Key Vocabulary list introduces students to some of the main vocabulary termsincluded in this chapter. For a more thorough vocabulary list with pronunciations ofnew words, give students the Vocabulary Builder worksheets found on pages vii andviii of the Chapter 5 Resource Masters. Encourage them to complete the definition of each term as they progress through the chapter. You may suggest that they addthese sheets to their study notebooks for future reference when studying for theChapter 5 test.
ELL

This section provides a review ofthe basic concepts needed beforebeginning Chapter 5. Pagereferences are included foradditional student help.Additional review is provided inthe Prerequisite Skills Workbook,pp. 29–30, 39–40, 63–64.
Prerequisite Skills in the GettingReady for the Next Lesson sectionat the end of each exercise setreview a skill needed in the nextlesson.
Chapter 5 Analyzing Linear Equations 255
Make this Foldable to help you organize information aboutwriting linear equations. Begin with four sheets of grid paper.
Label each of the tabs with a lesson
number. The last tab is for the
vocabulary.
5-15-25-35-4
5-55-6
5-7Vocabulary
Cut sevenlines from the bottom of the top sheet, six
lines from the second sheet, and so on.
Staplethe eight half-sheets together to form a
booklet.
Fold each sheet of grid paper in half along the width.
Then cut along the crease.
Reading and Writing As you read and study the chapter, use each page to writenotes and to graph examples for each lesson.
Prerequisite Skills To be successful in this chapter, you’ll need to masterthese skills and be able to apply them in problem-solving situations. Reviewthese skills before beginning Chapter 5.
For Lesson 5-1 Simplify Fractions
Simplify. (For review, see pages 798 and 799.)
1. �120� �
15
� 2. �182� �
23
� 3. ��28� ��
14
� 4. ��84� ��
12
�
5. ���
155
� �13
� 6. ���
278
� �14
� 7. �93
� 3 8. �1182� 1�
12
�
For Lesson 5-2 Evaluate Expressions
Evaluate �ac ��
db
� for each set of values. (For review, see Lesson 1-2.)
9. a � 6, b � 5, c � 8, d � 4 �14
� 10. a � 5, b � �1, c � 2, d � �1 211. a � �2, b � 1, c � 4, d � 0 ��
34
� 12. a � 8, b � �2, c � �1, d � 1 �513. a � �3, b � �3, c � 4, d � 7 0 14. a � �
12
�, b � �32
�, c � 7, d � 9 �12
�
For Lessons 5-3 through 5-7 Identify Points on a Coordinate Plane
Write the ordered pair for each point.(For review, see Lesson 4-1.)
15. J (1, 2) 16. K (�3, �2)17. L (2, �3) 18. M (0, �3)19. N (�2, 2) 20. P (3, 0)
y
xO
J
PN
LM
K
Fold and Cut
Cut Tabs
Staple
Label
Chapter 5 Analyzing Linear Equations 255
For PrerequisiteLesson Skill
5-2 Dividing Fractions (p. 262)
5-3 Rewriting Equations (p. 270)
5-4 Finding Slope (p. 277)
5-5 Subtracting Integers (p. 285)
5-6 Writing Multiplicative Inverses(p. 291)
5-7 Slope-Intercept Form (p. 297)
Descriptive Writing and Organizing Data After students maketheir Foldable, have them label a tab for each lesson in this chapter.At the end of each lesson, ask students to write a descriptive para-graph about their experiences with the concepts, computational skills,and the graphs presented. For example, students might write abouthow they felt when they were first asked to find the slope of a line orhow the lesson appeared to them visually before they understoodthe concepts presented and how it appeared after mastery.
TM
For more informationabout Foldables, seeTeaching Mathematicswith Foldables.

5-Minute CheckTransparency 5-1 Use as a
quiz or review of Chapter 4.
Mathematical Background notesare available for this lesson on p. 254C.
Building on PriorKnowledge
In Chapter 4, students learnedthat points on a line havecoordinates that satisfy a givenequation. In this lesson, theyshould recognize that there isanother relationship that existsbetween any two points on a line.
is slope important inarchitecture?
Ask students:• What is the slope of the roof if
the rise is 10 and the run is 6?• Which has a steeper slope, a
roof whose rise is greater thanthe run or one whose run isgreater than the rise? rise � run
• Geography The steepness ofroofs on buildings is often asso-ciated with certain climates.Very steep roofs are used inrainy or snowy climates, whileflatter roofs are often found inarid regions. What type of roofwould be most common in ourcommunity? Answers may vary.
5�3
Vocabulary• slope• rate of change
Slope
Reading MathIn x1, the 1 is called asubscript. It is read x sub 1.
Study Tip
Slope of a Line• Words The slope of a line is the
ratio of the rise to the run.
• Symbols The slope m of a nonvertical line throughany two points, (x1, y1) and (x2, y2), can be found as follows.
m � �yx
2
2
�
�
yx1
1�
• Model
(x1, y1)
y
xO
(x 2, y 2)y 2 � y1
x 2 � x1
← change in y← change in x
FIND SLOPE The of a line is a number determined by any two points onthe line. This number describes how steep the line is. The greater the absolute valueof the slope, the steeper the line. Slope is the ratio of the change in the y-coordinates(rise) to the change in the x-coordinates (run) as you move from one point to theother.
The graph shows a line that passes through (1, 3) and (4, 5).
slope � �rriusne
�
�
� �54
��
31
� or �23
�
So, the slope of the line is �23
�.
change in y-coordinates���change in x-coordinates
y
xO
(1, 3)
(4, 5)
run: 4 � 1 � 3
r ise: 5 � 3 � 2
slope
256 Chapter 5 Analyzing Linear Equations
is slope important in architecture?is slope important in architecture?
• Find the slope of a line.
• Use rate of change to solve problems.
The slope of a roof describes how steep it is. It is the number of units the roof rises for each unit of run. In the photo, the roof rises 8 feet for each 12 feet of run.
slope � �rriusne
�
� �182� or �
23
�
12 ft run
Section ofroof
8 ftrise
LessonNotes
1 Focus1 Focus
Chapter 5 Resource Masters• Study Guide and Intervention, pp. 281–282• Skills Practice, p. 283• Practice, p. 284• Reading to Learn Mathematics, p. 285• Enrichment, p. 286
Parent and Student Study GuideWorkbook, p. 38
Prerequisite Skills Workbook, pp. 39–40, 63–64
5-Minute Check Transparency 5-1Answer Key Transparencies
TechnologyInteractive Chalkboard
Workbook and Reproducible Masters
Resource ManagerResource Manager
Transparencies

11
22
33
44
In-Class ExamplesIn-Class ExamplesFIND SLOPE
Find the slope of the line thatpasses through (�3, 2) and(5, 5).
Find the slope of the line thatpasses through (�3, �4) and(�2, �8). �4
Find the slope of the line thatpasses through (�3, 4) and(4, 4). 0
Teaching Tip Ask students howthey would determine if twopoints lie on a horizontal linewithout graphing the points.
Find the slope of the line thatpasses through (�2, �4) and(�2, 3). undefined
Concept CheckSlope Ask students to give theslope of a very steep line and thenthe slope of one that is almosthorizontal. Make sure studentsacknowledge that negativeslopes are acceptable to meetthese criteria.Sample answers: 6, � ; �5, � 2
�152�5
3�8
Lesson 5-1 Slope 257
Positive Slope Find the slope of the line that passes through (�1, 2) and (3, 4).
Let (�1, 2) � (x1, y1) and (3, 4) � (x2, y2).
m � �yx
2
2
�
�
yx
1
1� �
rriusne
�
� �3
4�
�(�
21)
� Substitute.
� �24
� or �12
� Simplify.
The slope is �12
�.
y
xO
(3, 4)(�1, 2)
Example 1Example 1
Negative SlopeFind the slope of the line that passes through (�1, �2) and (�4, 1).
Let (�1, �2) � (x1, y1) and (�4, 1) � (x2, y2).
m � �yx
2
2
�
�
yx
1
1� �
rriusne
�
� ��
14�
�
(�(�
21))
� Substitute.
� ��33� or �1 Simplify.
The slope is �1.
y
xO
(�4, 1)
(�1, �2)
Example 2Example 2
Zero SlopeFind the slope of the line that passes through (1, 2) and (�1, 2).
Let (1, 2) � (x1, y1) and (�1, 2) � (x2, y2).
m � �yx
2
2
�
�
yx
1
1� �
rriusne
�
� ��21��
21
� Substitute.
� ��02� or 0 Simplify.
The slope is zero.
y
xO
(�1, 2) (1, 2)
Example 3Example 3
Example 4Example 4 Undefined SlopeFind the slope of the line that passes through (1, �2) and (1, 3).
Let (1, �2) � (x1, y1) and (1, 3) � (x2, y2).
m � �yx
2
2
�
�
yx
1
1� �
rriusne
�
� �3 �
1 �
(�12)
� or �50
�
Since division by zero is undefined, the slope is undefined.
y
xO
(1, �2)
(1, 3)
TEACHING TIPTo verify this, have students rework eachexample, letting theother point be (x1, y1).
www.algebra1.com/extra_examples
CommonMisconceptionIt may make yourcalculations easier tochoose the point on theleft as (x1, y1). However,either point may bechosen as (x1, y1).
Study Tip
Lesson 5-1 Slope 257
• Computing Slope Many students automatically assume that the left-most point has to be (x1, y1) and the point farther right is (x2, y2). Thedesignation of (x1, y1) and (x2, y2) is arbitrary. However, one particulardesignation may make the subtraction easier than the other.
• Improper Fractions Students should learn that slope is expressed asa fraction or integer. Make sure they understand that slope can be animproper fraction, but it is never expressed as a mixed number.
Unlocking Misconceptions
2 Teach2 TeachPowerPoint®
InteractiveChalkboard
PowerPoint®
Presentations
This CD-ROM is a customizableMicrosoft® PowerPoint®presentation that includes:• Step-by-step, dynamic solutions of
each In-Class Example from theTeacher Wraparound Edition
• Additional, Your Turn exercises foreach example
• The 5-Minute Check Transparencies• Hot links to Glencoe Online
Study Tools

66
In-Class ExampleIn-Class Example
55
In-Class ExampleIn-Class Example
Teaching Tip Watch forstudents who try to find the crossproduct mentally and forget tomultiply both 10 and �r by �3.
Find the value of r so that theline through (6, 3) and (r, 2) has a slope of . 4
RATE OF CHANGE
TRAVEL The graph belowshows the number of U.S.passports issued in 1991,1995, and 1999.
a. Find the rates of change for1991–1995 and 1995–1999.475,000/yr; 350,000/yr
b. Explain the meaning of theslope in each case. ’91–’95: Thenumber of U.S. passports issuedincreased about 475,000 eachyear. ’95–’99: The number of U.S.passports issued increased about350,000 each year.
c. How are the different rates ofchange shown on the graph?There is a greater rate of changefrom ’91–’95 than from ’95–’99.So the ’91–’95 segment has thesteeper slope.
U.S. Passports Issued
Year
Pass
po
rts
(mill
ion
s)
’91 ’95 ’99
7
6
5
4
3
0
Source: U.S. State Department
3.4
5.3
6.7
1�2
Find a Rate of ChangeDINING OUT The graph shows the amount spent on food and drink at U.S. restaurants in recent years.
a. Find the rates of change for 1980–1990 and 1990–2000.
Use the formula for slope.
�rriusne
� �← billion S|← years
change in quantity���
change in time
By Hilary Wasson and Alejandro Gonzalez, USA TODAY
Source: National Restaurant Association
Dining outFood and drink salesat U.S. restaurantsby year(in billions):
’85 ’90 ’95
$100
$200
$300
USA TODAY Snapshots®
1990:$239
2000:$376
1980:$120
258 Chapter 5 Analyzing Linear Equations
Look BackTo review cross products,see Lesson 3-6.
Study Tip
Positive Slope Negative Slope Slope of 0 Undefined Slope
vertical line
O
y
x
horizontal line
O
y
x
line slopes downfrom left to right
O
y
x
line slopes upfrom left to right
O
y
x
Classifying Lines
• Updated data• More activities
on rate of changewww.algebra1.com/usa_today
Log on for:Log on for:
If you know the slope of a line and the coordinates of one of the points on a line,you can find the coordinates of other points on the line.
RATE OF CHANGE Slope can be used to describe a rate of change. Thetells, on average, how a quantity is changing over time. rate of change
Find Coordinates Given SlopeFind the value of r so that the line through (r, 6) and (10, �3) has a slope of ��
32
�.
Let (r, 6) � (x1, y1) and (10, �3) � (x2, y2).
m � �yx
2
2
�
�
yx
1
1� Slope formula
��32
� � ��10
3��
r6
� Substitute.
��32
� � �10
��9
r� Subtract.
�3(10 � r) � 2(�9) Find the cross products.
�30 � 3r � �18 Simplify.
�30 � 3r � 30 � �18 � 30 Add 30 to each side.
3r � 12 Simplify.
�33r� � �
132� Divide each side by 3.
r � 4 Simplify.
y
xO
(10, �3)
(r, 6)
Example 5Example 5
Example 6Example 6
258 Chapter 5 Analyzing Linear Equations
PowerPoint®
PowerPoint®
Online Lesson Plans
USA TODAY Education’s Online site offers resources andinteractive features connected to each day’s newspaper.Experience TODAY, USA TODAY’s daily lesson plan, isavailable on the site and delivered daily to subscribers.This plan provides instruction for integrating USA TODAYgraphics and key editorial features into your mathematicsclassroom. Log on to www.education.usatoday.com.

Concept Check
Guided Practice
1. Explain how you would find the slope of the line at the right.
2. OPEN ENDED Draw the graph of a line having each slope. See students’ work.a. positive slope b. negative slope
c. slope of 0 d. undefined slope
3. Explain why the formula for determining slopeusing the coordinates of two points does not applyto vertical lines.
4. FIND THE ERROR Carlos and Allison are finding the slope of the line thatpasses through (2, 6) and (5, 3).
Who is correct? Explain your reasoning.
Find the slope of the line that passes through each pair of points.
5. (1, 1), (3, 4) �32
� 6. (0, 0), (5, 4) �45
� 7. (�2, 2), (�1, �2) �48. (7, �4), (9, �1) �
32
� 9. (3, 5), (�2, 5) 0 10. (�1, 3), (�1, 0)undefined
Find the value of r so the line that passes through each pair of points has thegiven slope.
11. (6, �2), (r, �6), m � 4 5 12. (9, r), (6, 3), m � ��13
� 2
Al l ison
�65
––
32
� = �33
� or 1
Carlos
�35
––
62
� = �–33� or –1
y
xO
(3, �5)
(�1, �3)
GUIDED PRACTICE KEYExercises Examples
5–10 1–411, 12 513, 14 6
Lesson 5-1 Slope 259
1980–1990: � �1293990
��
1129080
� Substitute.
� �11109
� or 11.9 Simplify.
Spending on food and drink increased by $119 billion in a 10-year period for a rate of change of $11.9 billion per year.
1990–2000: � �2307060
��
2139990
� Substitute.
� �11307
� or 13.7 Simplify.
Over this 10-year period, spending increased by $137 billion, for a rate of change of $13.7 billion per year.
b. Explain the meaning of the slope in each case.
For 1980–1990, on average, $11.9 billion more was spent each year than the last.For 1990–2000, on average, $13.7 billion more was spent each year than the last.
c. How are the different rates of change shown on the graph?
There is a greater vertical change for 1990–2000 than for 1980–1990. Therefore,the section of the graph for 1990–2000 has a steeper slope.
change in quantity���
change in time
change in quantity���
change in time
1. Sample answer:Use (�1, �3) as (x1, y1) and (3, �5) as (x2, y2) in the slopeformula.
3. The difference inthe x values is always0, and division by 0 isundefined.4. Carlos; Allisonswitched the order ofthe x-coordinates,resulting in an incorrect sign.
Lesson 5-1 Slope 259
Ruth Casey Anderson County H.S., Lawrenceburg, KY
“I like to introduce the Greek letter ∆ (delta) to represent ‘change in’ with my students when studying slope. The definition of slope becomes m = �
∆∆xy�,
the change in the y-coordinate over the change in the x-coordinate.”
Teacher to TeacherTeacher to Teacher
3 Practice/Apply3 Practice/Apply
Study NotebookStudy NotebookHave students—• add the definitions/examples of
the vocabulary terms to theirVocabulary Builder worksheets forChapter 5.
• copy their drawings for Exercise 2and write notes about each type ofgraph.
• include any other item(s) that theyfind helpful in mastering the skillsin this lesson.
FIND THE ERRORIf students are
having difficulty withwriting the coordinates in the
correct order, have them completethe slope formula by filling ineach ordered pair, instead of eachpair of y or x values. Fill in the
first ordered pair, .
Then fill in the second ordered
pair, .6 � 3�2 � 5
6 � �2 �
→→
y�x

13. 1.5 million subscribers per year
CABLE TV For Exercises 13 and 14, use the graph at the right.
13. Find the rate of change for 1990–1992.
14. Without calculating, find a 2-year period that had a greater rate of change than 1990–1992. Explain your reasoning. Sample answer: ’92–’94; steeper segment means greater rate of change.
U.S. Cable TV Subscribers
’94’92’90
40
0
50
60
Nu
mb
er (
mill
ion
s)
70
’96 ’98
5552
5963
66
Year
260 Chapter 5 Analyzing Linear Equations
Application
Practice and ApplyPractice and Apply
indicates increased difficulty�
Homework HelpFor See
Exercises Examples15–34 1–441–48 553–57 6
Extra PracticeSee page 831.
Find the slope of the line that passes through each pair of points.
15. 16.��1
3�
17. (�4, �1), (�3, �3) �2 18. (�3, 3), (1, 3) 019. (�2, 1), (�2, 3) undefined 20. (2, 3), (9, 7) �
47
�
21. (5, 7), (�2, �3) �170� 22. (�3, 6), (2, 4) ��
25
�
23. (�3, �4), (5, �1) �38
� 24. (2, �1), (5, �3) ��23
�
25. (�5, 4), (�5, �1) undefined 26. (2, 6), (�1, 3) 127. (�2, 3), (8, 3) 0 28. (�3, 9), (�7, 6) �
34
�
29. (�8, 3), (�6, 2) ��12
� 30. (�2, 0), (1, �1) ��13
�
31. (4.5, �1), (5.3, 2) �145� 32. (0.75, 1), (0.75, �1) undefined
33. �2�12
�, �1�12
��, ���12
�, �12
�� ��23
� 34. ��34
�, 1�14
��, ���12
�, �1� �95
�
ARCHITECTURE Use a ruler to estimate the slope of each roof.
35. 36.
37. Find the slope of the line that passes through the origin and (r, s). �sr�
38. What is the slope of the line that passes through (a, b) and (a, �b)? undefined
39. PAINTING A ladder reaches a height of 16 feet on a wall. If the bottom of theladder is placed 4 feet away from the wall, what is the slope of the ladder as apositive number? 4
�
�
y
xO
(3, 2)(0, 3)
�34
�y
xO
(�2, �4)
(2, �1)
�
�
35. Sample answer: �181�
36. Sample answer: �13
�
260 Chapter 5 Analyzing Linear Equations
About the Exercises…Organization by Objective• Find Slope: 15–39, 41–48, 57• Rate of Change: 40, 50–56
Odd/Even AssignmentsExercises 15–36 and 41–48 arestructured so that studentspractice the same conceptswhether they are assignedodd or even problems.Alert! Exercise 56 involvesresearch on the Internet orother reference materials.
Assignment GuideBasic: 15–29 odd, 37–43 odd,50–55, 57–60, 63–85Average: 15–49 odd, 50–55,57–60, 63–85 (optional: 61, 62)Advanced: 16–48 even, 49,53–76 (optional: 77–85)
Kinesthetic Use floor tiles as a grid or use masking tape on the floorto create a grid. Have students walk the path from one point to anotheron the floor, allowing only one horizontal and one vertical path. Askthem to describe their trip in terms of positive and negative movementand the number of squares traveled in each direction. Then have themwrite the description of their movement as the slope of the lineconnecting the two points.
Differentiated Instruction
Answer
50. Karen’s Height
Hei
gh
t (i
n.)
58
0
60
62
6466
68
Age (years)12 14 16 18 20
Study Guide and Intervention
Slope
NAME ______________________________________________ DATE ____________ PERIOD _____
5-15-1
Less
on
5-1
Find Slope
Slope of a Linem � or m � , where (x1, y1) and (x2, y2) are the coordinates
of any two points on a nonvertical line
y2 � y1�x2 � x1
rise�run
Find the slope of theline that passes through (�3, 5)and (4, �2).
Let (�3, 5) � (x1, y1) and (4, �2) � (x2, y2).
m � Slope formula
� y2 � �2, y1 � 5, x2 � 4, x1 � �3
� Simplify.
� �1
�7�7
�2 � 5��4 � (�3)
y2 � y1�x2 � x1
Find the value of r so that the line through (10, r) and (3, 4) has a
slope of � .
m � Slope formula
� � m � � , y2 � 4, y1 � r, x2 � 3, x1 � 10
� � Simplify.
�2(�7) � 7(4 � r) Cross multiply.
14 � 28 � 7r Distributive Property
�14 � �7r Subtract 28 from each side.
2 � r Divide each side by �7.
4 � r�
�72�7
2�7
4 � r�3 � 10
2�7
y2 � y1�x2 � x1
2�7
Example 1Example 1 Example 2Example 2
ExercisesExercises
Find the slope of the line that passes through each pair of points.
1. (4, 9), (1, 6) 1 2. (�4, �1), (�2, �5) �2 3. (�4, �1), (�4, �5)undefined
4. (2, 1), (8, 9) 5. (14, �8), (7, �6) � 6. (4, �3), (8, �3) 0
7. (1, �2), (6, 2) 8. (2, 5), (6, 2) � 9. (4, 3.5), (�4, 3.5) 0
Determine the value of r so the line that passes through each pair of points hasthe given slope.
10. (6, 8), (r, �2), m � 1 �4 11. (�1, �3), (7, r), m � 3 12. (2, 8), (r, �4) m � �3 6
13. (7, �5), (6, r), m � 0 �5 14. (r, 4), (7, 1), m � 11 15. (7, 5), (r, 9), m � 6
16. (10, r), (3, 4), m � � 17. (10, 4), (�2, r), m � �0.5 18. (r, 3), (7, r), m � �
2 10 2
1�5
2�7
23�3
3�4
3�4
3�4
4�5
2�7
4�3
Study Guide and Intervention, p. 281 (shown) and p. 282
Find the slope of the line that passes through each pair of points.
1. 2. 3.
�3 0
4. (6, 3), (7, �4) �7 5. (�9, �3), (�7, �5) �1
6. (6, �2), (5, �4) 2 7. (7, �4), (4, 8) �4
8. (�7, 8), (�7, 5) undefined 9. (5, 9), (3, 9) 0
10. (15, 2), (�6, 5) � 11. (3, 9), (�2, 8)
12. (�2, �5), (7, 8) 13. (12, 10), (12, 5) undefined
14. (0.2, �0.9), (0.5, �0.9) 0 15. � , �, �� , �
Find the value of r so the line that passes through each pair of points has thegiven slope.
16. (�2, r), (6, 7), m � 3 17. (�4, 3), (r, 5), m � 4
18. (�3, �4), (�5, r), m � � 5 19. (�5, r), (1, 3), m � �4
20. (1, 4), (r, 5), m undefined 1 21. (�7, 2), (�8, r), m � �5 7
22. (r, 7), (11, 8), m � � 16 23. (r, 2), (5, r), m � 0 2
24. ROOFING The pitch of a roof is the number of feet the roof rises for each 12 feethorizontally. If a roof has a pitch of 8, what is its slope expressed as a positive number?
25. SALES A daily newspaper had 12,125 subscribers when it began publication. Five yearslater it had 10,100 subscribers. What is the average yearly rate of change in the numberof subscribers for the five-year period? �405 subscribers per year
2�3
1�5
7�6
9�2
1�4
1�2
1�4
2�3
1�3
4�3
7�3
13�9
1�5
1�7
4�5
(–2, 3)(3, 3)
x
y
O
(3, 1)
(–2, –3)
x
y
O(–1, 0)
(–2, 3)
x
y
O
Practice (Average)
Slope
NAME ______________________________________________ DATE ____________ PERIOD _____
5-15-1Skills Practice, p. 283 and Practice, p. 284 (shown)
Reading to Learn Mathematics
Slope
NAME ______________________________________________ DATE ____________ PERIOD _____
5-15-1
Less
on
5-1
Pre-Activity Why is slope important in architecture?
Read the introduction to Lesson 5-1 at the top of page 260 in your textbook. Then complete the definition of slope and fill in the boxeson the graph with the words rise and run.
slope �
In this graph, the rise is units, and the run is units.
Thus, the slope of this line is or .
Reading the Lesson1. Describe each type of slope and include a sketch.
Type of Slope Description of Graph Sketch
positive The graph rises as you go from left to right.
negative The graph falls as you go from left to right.
zero The graph is a horizontal line.
undefined The graph is a vertical line.
2. Describe how each expression is related to slope.
a. difference of y-coordinates divided by difference ofcorresponding x-coordinates
b. how far up or down as compared to how far left or right
c. slope used as rate of change
Helping You Remember3. The word rise is usually associated with going up. Sometimes going from one point on
the graph does not involve a rise and a run but a fall and a run. Describe how you couldselect points so that it is always a rise from the first point to the second point.Sample answer: If the slope is negative, choose the second point so that its x-coordinate is less than that of the first point.
$52,000 increase in spending����26 months
rise�run
y2 � y1�x2 � x1
x
y
O
x
y
O
x
y
O
x
y
O
3�5
3 units�5 units
53
rise�run
x
y
O
rise
run
Reading to Learn Mathematics, p. 285
Treasure Hunt with SlopesUsing the definition of slope, draw lines with the slopes listed below. A correct solution will trace the route to the treasure.
Treasure
Enrichment
NAME ______________________________________________ DATE ____________ PERIOD _____
5-15-1Enrichment, p. 286
Lesson 5-1 Slope 261
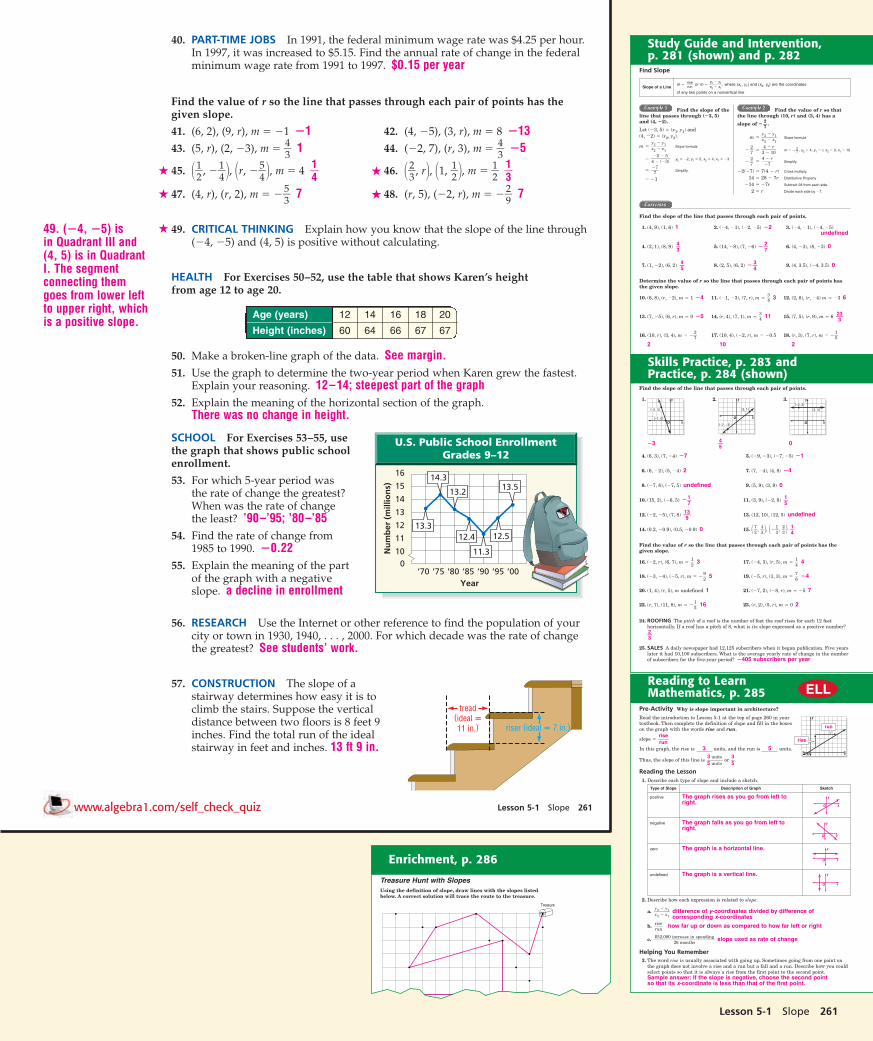
40. PART-TIME JOBS In 1991, the federal minimum wage rate was $4.25 per hour.In 1997, it was increased to $5.15. Find the annual rate of change in the federalminimum wage rate from 1991 to 1997. $0.15 per year
Find the value of r so the line that passes through each pair of points has thegiven slope.
41. (6, 2), (9, r), m � �1 �1 42. (4, �5), (3, r), m � 8 �1343. (5, r), (2, �3), m � �
43
� 1 44. (�2, 7), (r, 3), m � �43
� �5
45. ��12
�, ��14
��, �r, ��54
��, m � 4 �14
� 46. ��23
�, r�, �1, �12
��, m � �12
� �13
�
47. (4, r), (r, 2), m � ��53
� 7 48. (r, 5), (�2, r), m � ��29
� 7
49. CRITICAL THINKING Explain how you know that the slope of the line through(�4, �5) and (4, 5) is positive without calculating.
HEALTH For Exercises 50–52, use the table that shows Karen’s height from age 12 to age 20.
50. Make a broken-line graph of the data. See margin.51. Use the graph to determine the two-year period when Karen grew the fastest.
Explain your reasoning. 12–14; steepest part of the graph52. Explain the meaning of the horizontal section of the graph.
There was no change in height.
SCHOOL For Exercises 53–55, use the graph that shows public schoolenrollment.
53. For which 5-year period wasthe rate of change the greatest?When was the rate of changethe least? ’90–’95; ’80–’85
54. Find the rate of change from1985 to 1990. �0.22
55. Explain the meaning of the partof the graph with a negativeslope. a decline in enrollment
56. RESEARCH Use the Internet or other reference to find the population of yourcity or town in 1930, 1940, . . . , 2000. For which decade was the rate of changethe greatest? See students’ work.
57. CONSTRUCTION The slope of a stairway determines how easy it is toclimb the stairs. Suppose the verticaldistance between two floors is 8 feet 9inches. Find the total run of the idealstairway in feet and inches. 13 ft 9 in.
tread(ideal �11 in.) riser (ideal � 7 in.)
U.S. Public School EnrollmentGrades 9–12
’70 ’75 ’80 ’85 ’90 ’95 ’00
100
11
12
13
Nu
mb
er (
mill
ion
s)
14
15
16
13.312.4
11.3
14.3
13.2
12.5
13.5
Year
�
�
12 14 16 18 20
60 64 66 67 67
Age (years)
Height (inches)
�
�
�
www.algebra1.com/self_check_quiz
49. (�4, �5) is in Quadrant III and(4, 5) is in QuadrantI. The segment connecting themgoes from lower leftto upper right, whichis a positive slope.
Lesson 5-1 Slope 261
ELL

Open-Ended Assessment
Modeling Use a transparency ofa coordinate plane and a piece ofthin spaghetti to create a “line”on the overhead projector. Askstudents to determine whetherthe slope of that line is positive,negative, zero, or undefined andthen calculate the actual slope.Repeat until all types of slopehave been addressed.
Maintain Your SkillsMaintain Your Skills
58. Answer the question that was posed at the beginning ofthe lesson.
Why is slope important in architecture?
Include the following in your answer: See margin.• an explanation of how to find the slope of a roof, and• a comparison of the appearance of roofs with different slopes.
59. The slope of the line passing through (5, �4) and (5, �10) is Dpositive. negative. zero. undefined.
60. The slope of the line passing through (a, b) and (c, d) is B
�db �
�ac
� . �ba
��
dc
�. �da �
�cb
�. �ba
��
dc
�.
61. Choose four different pairs of points from those labeled on the graph. Find the slope of the lineusing the coordinates of each pair of points.Describe your findings.
�13
�; The slope is the same regardless of points chosen.
62. MAKE A CONJECTURE Determine whether Q(2, 3), R(�1, �1), and S(�4, �2)lie on the same line. Explain your reasoning. See margin.
y
xO(4, 0)
(�5, �3)
(�2, �2) (1, �1)
DCBA
DCBA
WRITING IN MATH
262 Chapter 5 Analyzing Linear Equations
StandardizedTest Practice
Extending the Lesson
Mixed Review
Getting Ready forthe Next Lesson
Write an equation for each relation. (Lesson 4-6)
63. 64.
f(x) � 5x f (x) � 11 � xDetermine whether each relation is a function. (Lesson 4-5)
65. y � �15 yes 66. x � 5 no67. {(1, 0), (1, 4), (�1, 1)} no 68. {(6, 3), (5, �2), (2, 3)} yes
69. Graph x � y � 0. (Lesson 4-4) See margin.
70. What number is 40% of 37.5? (Lesson 3-4) 15
Find each product. (Lesson 2-4)
71. 7(�3) �21 72. (�4)(�2) 8 73. (9)(�4) �36
74. (�8)(3.7) �29.6 75. ���78
����13
�� ��274� 76. ��
14
����12
��(�14) �1�34
�
PREREQUISITE SKILL Find each quotient.(To review dividing fractions, see pages 800 and 801.)
77. 6 � �23
� 9 78. 12 � �14
� 48 79. 10 � �38
� 26�23
�
80. �12
� � �13
� 1�12
� 81. �34
� � �16
� 4�12
� 82. �34
� � 6 �18
�
83. 18 � �78
� 20�47
� 84. �38
� � �25
� �11
56� 85. 2�
23
� � �14
� 10�23
�
1 2 3 4 5
5 10 15 20 25
x
f (x )
�2 �1 1 2 4
13 12 10 9 7
x
f (x )
262 Chapter 5 Analyzing Linear Equations
4 Assess4 Assess
InterventionIf there is anydoubt whetheryour studentsthoroughly
understand slope, considerspending an extra day on thislesson. Use the Extra Practiceon p. 831, the Study Guideand Intervention masters, orthe Practice masters in theChapter 5 Resource Masters toreinforce this concept.
New
Getting Ready for Lesson 5-2PREREQUISITE SKILL Lesson 5-2presents direct variation in whichstudents must find quotients ofnumbers to determine the con-stant of variation. Exercises 77–85should be used to determine yourstudents’ familiarity with findingquotients involving fractions.
Answers
58. Sample answer: Analysis of theslope of a roof might help todetermine the materials of whichit should be made and itsfunctionality. Answers shouldinclude the following.• To find the slope of the roof, find
a vertical line that passes throughthe peak of the roof and a hori-zontal line that passes throughthe eave. Find the distances fromthe intersection of those two linesto the peak and to the eave. Usethose measures as the rise andrun to calculate the slope.
• A roof that is steeper thanone with a rise of 6 and arun of 12 would be onewith a rise greater than 6and the same run. A roofwith a steeper slopeappears taller than onewith a less steep slope.
62. No, they do not. Slope of
Q�R� is and slope of R�S�
is . If they lie on the
same line, the slopesshould be the same.
69. y
xO
x �y � 0
1�3
4�3
ReadingMathematics
Getting StartedGetting Started
TeachTeach
AssessAssess
Study NotebookStudy Notebook
Before using this page, ask stu-dents if there are any words theyknow that have more than onemeaning, depending on how theyare used. Some examples might be:bolt: a fastener; a roll of clothmeasured to a specified lengthbow: a decorative knot formedby a ribbon or piece of cloth; aweapon made of curved materialand a cordrow: a line of seats or objects;using a paddle to move a boatthrough water
Word Association Explain tostudents that if they can relate aword they are trying to learn tosomething with which they arealready familiar, it makes it easierto remember what that wordmeans. This is a technique taughtto business people to improvetheir recollection of names andbusiness contacts. By relatingmathematical terms to everydaythings, they can recall theirmeanings more readily.
Ask students to summarize whatthey have learned about mathe-matical words and everyday words.
Investigating Slope-Intercept Form 263Reading Mathematics Mathematical Words and Everyday Words 263
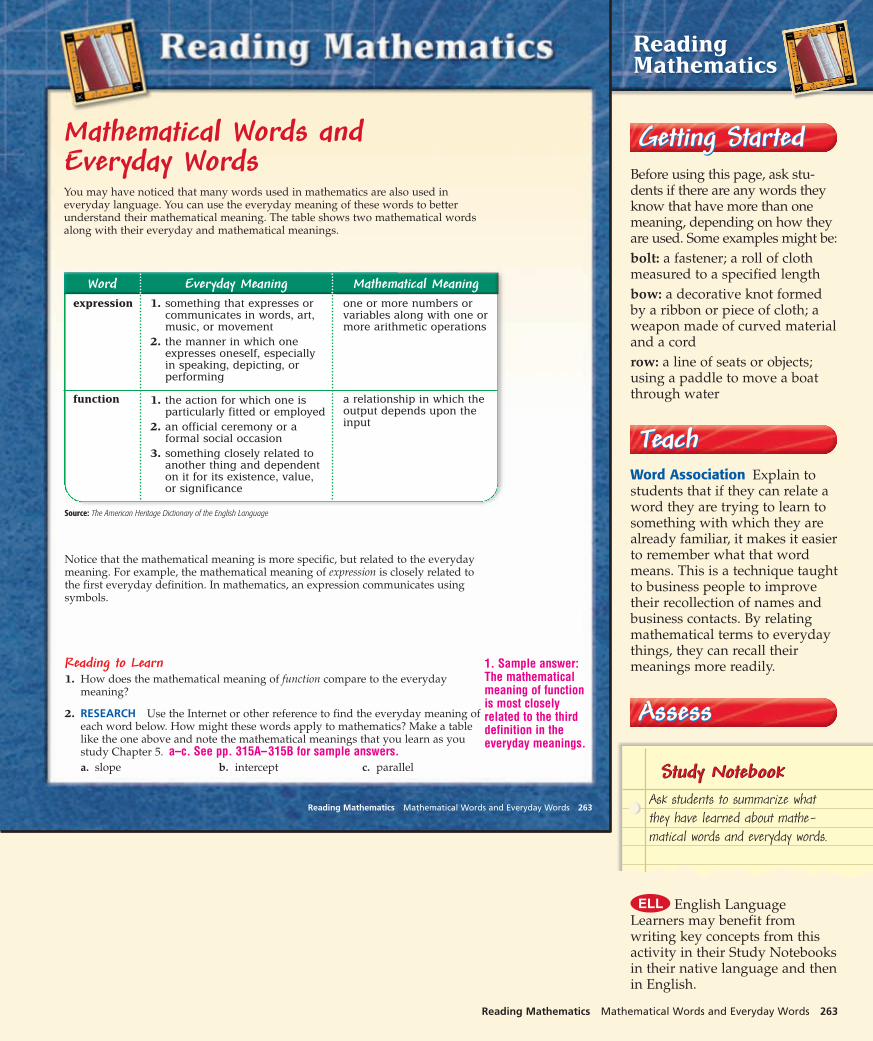
Mathematical Words and Everyday Words
Word Everyday Meaning Mathematical Meaningexpression
function
1. something that expresses orcommunicates in words, art,music, or movement
2. the manner in which oneexpresses oneself, especially in speaking, depicting, orperforming
1. the action for which one isparticularly fitted or employed
2. an official ceremony or aformal social occasion
3. something closely related toanother thing and dependenton it for its existence, value, or significance
one or more numbers orvariables along with one ormore arithmetic operations
a relationship in which theoutput depends upon theinput
Notice that the mathematical meaning is more specific, but related to the everydaymeaning. For example, the mathematical meaning of expression is closely related tothe first everyday definition. In mathematics, an expression communicates usingsymbols.
Reading to Learn1. How does the mathematical meaning of function compare to the everyday
meaning?
2. RESEARCH Use the Internet or other reference to find the everyday meaning ofeach word below. How might these words apply to mathematics? Make a tablelike the one above and note the mathematical meanings that you learn as youstudy Chapter 5. a–c. See pp. 315A–315B for sample answers.a. slope b. intercept c. parallel
You may have noticed that many words used in mathematics are also used ineveryday language. You can use the everyday meaning of these words to betterunderstand their mathematical meaning. The table shows two mathematical wordsalong with their everyday and mathematical meanings.
1. Sample answer:The mathematicalmeaning of function is most closely related to the thirddefinition in the everyday meanings.
Source: The American Heritage Dictionary of the English Language
Reading Mathematics Mathematical Words and Everyday Words 263
English LanguageLearners may benefit fromwriting key concepts from thisactivity in their Study Notebooksin their native language and thenin English.
ELL
5-Minute CheckTransparency 5-2 Use as a
quiz or review of Lesson 5-1.
Mathematical Background notesare available for this lesson on p. 254C.
is slope related to yourshower?
Ask students:• What is the value of y if x � 2.5?
15• What is the value of x if y � 30?
5• Plumbing What could you do
to change the value of the slopein the water use equation? Turnthe faucets to increase or decreasethe water flow.
DIRECT VARIATION
Building on PriorKnowledge
In Chapter 3, students studiedproportions. Direct variation isalso known as direct proportion.
If y � kx, then � and
� . Both of these last two
equations are known as directproportions.
y2�y1
x2�x1
y2�x2
y1�x1
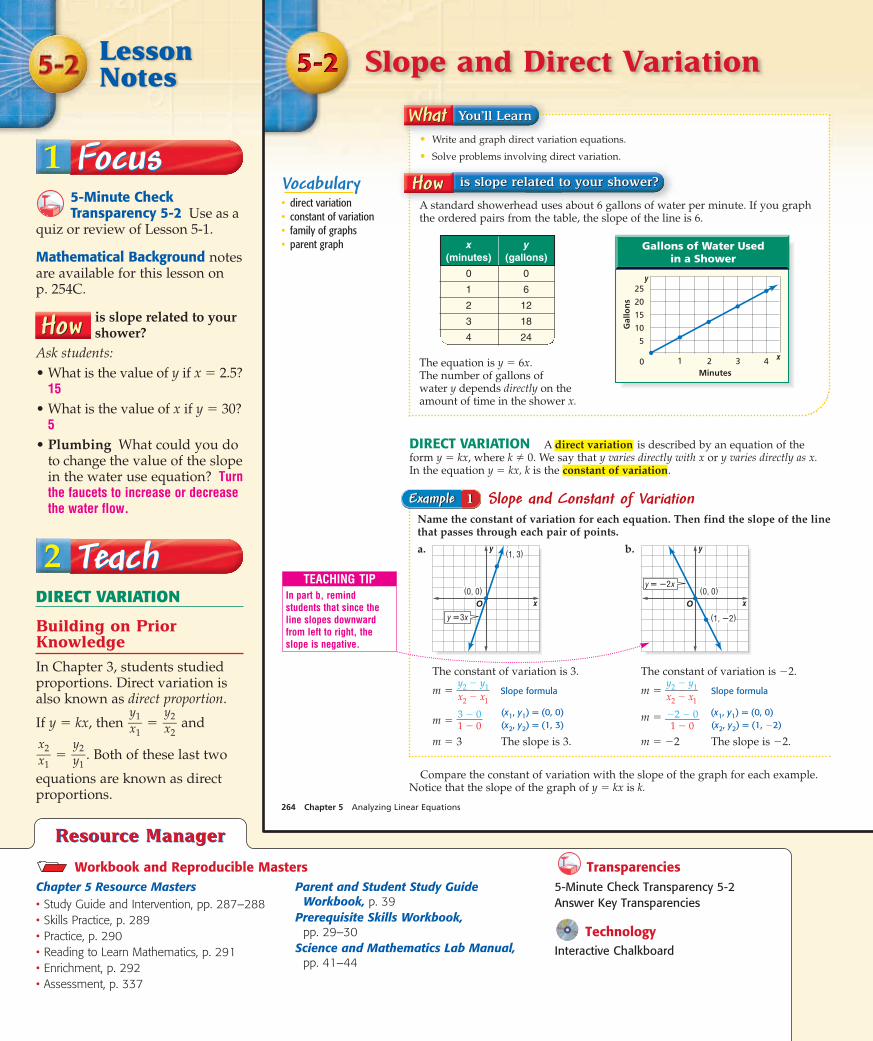
DIRECT VARIATION A is described by an equation of theform y � kx, where k � 0. We say that y varies directly with x or y varies directly as x.In the equation y � kx, k is the .constant of variation
direct variation
Vocabulary• direct variation• constant of variation• family of graphs• parent graph
264 Chapter 5 Analyzing Linear Equations
Slope and Constant of VariationName the constant of variation for each equation. Then find the slope of the linethat passes through each pair of points.
a. b.
The constant of variation is 3. The constant of variation is �2.
m � �yx
2
2
�
�
yx
1
1� Slope formula m � �
yx
2
2
�
�
yx
1
1� Slope formula
m � �31
��
00
�(x1, y1) = (0, 0) m � �
�12��
00
�(x1, y1) = (0, 0)
(x2, y2) = (1, 3) (x2, y2) = (1, �2)
m � 3 The slope is 3. m � �2 The slope is �2.
y
xO
(0, 0)
(1, �2)
y � �2x
y
xO
(0, 0)
(1, 3)
y �3x
Example 1Example 1
TEACHING TIPIn part b, remind students that since theline slopes downwardfrom left to right, theslope is negative.
Compare the constant of variation with the slope of the graph for each example.Notice that the slope of the graph of y � kx is k.
Slope and Direct Variation
• Write and graph direct variation equations.
• Solve problems involving direct variation.
A standard showerhead uses about 6 gallons of water per minute. If you graphthe ordered pairs from the table, the slope of the line is 6.
The equation is y � 6x. The number of gallons of water y depends directly on theamount of time in the shower x.
Gallons of Water Usedin a Shower
5
0
10
15
20
Gal
lon
s
25
Minutes1 2 3 4
y
x
x y(minutes) (gallons)
0 0
1 6
2 12
3 18
4 24
is slope related to your shower?is slope related to your shower?
LessonNotes
1 Focus1 Focus
Chapter 5 Resource Masters• Study Guide and Intervention, pp. 287–288• Skills Practice, p. 289• Practice, p. 290• Reading to Learn Mathematics, p. 291• Enrichment, p. 292• Assessment, p. 337
Parent and Student Study GuideWorkbook, p. 39
Prerequisite Skills Workbook, pp. 29–30
Science and Mathematics Lab Manual, pp. 41–44
5-Minute Check Transparency 5-2Answer Key Transparencies
TechnologyInteractive Chalkboard
Workbook and Reproducible Masters
Resource ManagerResource Manager
Transparencies
2 Teach2 Teach

The ordered pair (0, 0) is a solution of y � kx. Therefore, the graph of y � kx passesthrough the origin. You can use this information to graph direct variation equations.
Family of Graphs
The calculator screen shows the graphs of y � x, y � 2x, and y � 4x.
Think and Discuss1. Describe any similarities among the graphs.2. Describe any differences among the graphs.3. Write an equation whose graph has a
steeper slope than y � 4x. Check youranswer by graphing y � 4x and your equation.
4. Write an equation whose graph lies between the graphs of y � x and y � 2x. Check your answer by graphing the equations.
5. Write a description of this family of graphs. What characteristics do thegraphs have in common? How are they different?
6. The equations whose graphs are in this family are all of the form y � mx.How does the graph change as the absolute value of m increases?As |m | increases, the graph becomes more steep.
Lesson 5-2 Slope and Direct Variation 265
1. All the graphs passthrough the origin.2. None of the graphshave the same slope.3. Sample answer: y � 5x ; See students’graphs.4. Sample answer: y � �
32
�x
5. This family ofgraphs has a y-intercept of 0. Their slopes are alldifferent.
TEACHING TIPIf students have difficultyusing the slope to graph,remind them that theycan also make a table ofvalues.
www.algebra1.com/extra_examples
A includes graphs and equations of graphs that have at least onecharacteristic in common. The is the simplest graph in a family.parent graph
family of graphs
Direct Variation with k � 0Graph y � 4x.
Step 1 Write the slope as a ratio.
4 � �41
� �rriusne
�
Step 2 Graph (0, 0).
Step 3 From the point (0, 0), move up 4 units and right 1 unit. Draw a dot.
Step 4 Draw a line containing the points.
y
xO
y � 4x
Example 2Example 2
Direct Variation with k � 0Graph y � ��
13
�x.
Step 1 Write the slope as a ratio.
��13
� � ��31� �
rriusne
�
Step 2 Graph (0, 0).
Step 3 From the point (0, 0), move down 1 unit and right 3 units. Draw a dot.
Step 4 Draw a line containing the points.
y
xO
y � � x13
Example 3Example 3
[�10, 10] scl: 1 by [�10, 10] scl: 1
y � x y � 2x
y � 4x
Lesson 5-2 Direct Variation 265
11
22
33
In-Class ExamplesIn-Class Examples
Name the constant of vari-ation for each equation. Thenfind the slope of the line thatpasses through each pair ofpoints.
a.
constant of variation: 2; slope: 2
b.
constant of variation: �4;slope: �4
Teaching Tip Point out inExample 2 that an integer suchas 4 can be written as a ratiowith a denominator of 1.
Graph y � x.
Teaching Tip Point out that inExample 3 students can eitheruse rise �1 and run 3, or rise 1and run �3.
Graph y � � x.
x
y
O
y � � 32x
3�2
x
y
O
y � x
(0, 0)
(1, –4)
x
y
O
y � –4x
(0, 0)(1, 2)
x
y
Oy � 2x
Family of Graphs Graphing calculators are ideal for studying families ofgraphs. The Y= screen allows students to enter many functions so they canexperiment while investigating Questions 3 and 4.
PowerPoint®

55
In-Class ExampleIn-Class Example
44
In-Class ExampleIn-Class Example
Teaching Tip Be sure studentsdo not interchange the values ofx and y when substitutingvalues into an equation.
Suppose y varies directly asx, and y � 9 when x � �3.
a. Write a direct variationequation that relates x and y.y � �3x
b. Use the direct variationequation to find x when y � 15. �5
SOLVE PROBLEMS
TRAVEL The Ramirez familyis driving cross-country onvacation. They drive 330 milesin 5.5 hours.
a. Write a direct variationequation to find the distancedriven for any number ofhours. d � 60t
b. Graph the equation.
c. Estimate how many hours itwould take to drive 600 miles.10 h
Travel Time
Time (hours)
Dis
tan
ce (
mile
s)
20 4 61 3 5 t
d
500
400
300
200
100
Write and Solve a Direct Variation EquationSuppose y varies directly as x, and y � 28 when x � 7.
a. Write a direct variation equation that relates x and y.
Find the value of k.
y � kx Direct variation formula
28 � k(7) Replace y with 28 and x with 7.
�278� � �
k(77)� Divide each side by 7.
4 � k Simplify.
Therefore, y � 4x.
b. Use the direct variation equation to find x when y � 52.
y � 4x Direct variation equation
52 � 4x Replace y with 52.
�542� � �
44x� Divide each side by 4.
13 � x Simplify.
Therefore, x � 13 when y � 52.
Example 4Example 4
More About . . .
BiologySnow geese migrate morethan 3000 miles from theirwinter home in thesouthwest United States totheir summer home in theCanadian arctic.Source: Audubon Society
266 Chapter 5 Analyzing Linear Equations
SOLVE PROBLEMS One of the most common uses of direct variation is theformula for distance, d � rt. In the formula, distance d varies directly as time t, andthe rate r is the constant of variation.
Direct Variation EquationBIOLOGY A flock of snow geese migrated 375 miles in 7.5 hours.
a. Write a direct variation equation for the distance flown in any time.
Words The distance traveled is 375 miles, and the time is 7.5 hours.
Variables Let r � rate.
Equation
Distance equals rate times time.
375 mi � r � 7.5 h
Solve for the rate.375 � r(7.5) Original equation
�377.55
� � �r(
77..55)
� Divide each side by 7.5.
50 � r Simplify.
Therefore, the direct variation equation is d � 50t.
�����Example 5Example 5
Direct Variation Graphs• Direct variation equations are of the form y � kx, where k � 0.• The graph of y � kx always passes through the origin.
• The slope can be positive. k 0 • The slope can be negative. k 0
O
y
x
y � kx
O
y
x
y � kx
If you know that y varies directly as x, you can write a direct variation equationthat relates the two quantities.
266 Chapter 5 Analyzing Linear Equations
Interpersonal Have small groups of students use a triple-beam balanceand 4 stacks of identical washers. Each stack should contain a differentnumber of washers tied together so students cannot weigh just onewasher. Record the number of washers n in each stack. Have studentsweigh one stack and then predict the weights W of the other stacks. Howdo they think this relates to the equation W � kn? See students’ work.What does k represent? the weight of each washer
Differentiated Instruction
PowerPoint®
PowerPoint®

Lesson 5-2 Slope and Direct Variation 267
1. OPEN ENDED Write a general equation for y varies directly as x. y � kx2. Choose the equations that represent direct variations. Then find the constant of
variation for each direct variation.
a. 15 � rs b. 4a � b c. z � �13
�x d. s � �9t�
3. Explain how the constant of variation and the slope are related in a directvariation equation. They are equal.
Name the constant of variation for each equation. Then determine the slope of the line that passes through each pair of points.
4. ��13
�; ��13
� 5. 1; 1
Graph each equation. 6–8. See margin.6. y � 2x 7. y � �3x 8. y � �
12
�x
Write a direct variation equation that relates x and y. Assume that y varies directlyas x. Then solve.
9. If y � 27 when x � 6, find x when y � 45. y � �92
�x ; 1010. If y � 10 when x � 9, find x when y � 9.
11. If y � �7 when x � �14, find y when x � 20. y � �12
�x ; 10
JOBS For Exercises 12–14, use the following information.Suppose you work at a job where your pay varies directly as the number of hoursyou work. Your pay for 7.5 hours is $45.
12. Write a direct variation equation relating your pay to the hours worked. y � 6x13. Graph the equation. See margin.14. Find your pay if you work 30 hours. $180
y
xO
(0, 0)
(2, 2)
y � x
y
xO
(0, 0)(�3, 1)
y � � x13
Concept Check
Guided Practice
Application
2. b, constant of variation � 4; c, constantof variation � �
13
�
GUIDED PRACTICE KEYExercises Examples
4–8 1–39–11 4
12–14 5
b. Graph the equation.
The graph of d � 50t passes throughthe origin with slope 50.
m � �510� �
rriusne
�
c. Estimate how many hours of flyingtime it would take the geese tomigrate 3000 miles.
d � 50t Original equation
3000 � 50t Replace d with 3000.
�305000
� � �5500t
� Divide each side by 50.
t � 60 Simplify.
At this rate, it will take 60 hours of flying time to migrate 3000 miles.
Migration of Snow Geese
400
300
200
100
0
Dis
tan
ce(m
iles)
Time (hours)1 2 3 4 5 6 7 8 t
d
d � 50t
(7.5, 375)
10. y � �190�x ; 8.1
Lesson 5-2 Direct Variation 267
3 Practice/Apply3 Practice/Apply
Study NotebookStudy NotebookHave students—• add the definitions/examples of
the vocabulary terms to theirVocabulary Builder worksheets forChapter 5.
• include the explanation fromExercise 3 to show how directvariation and slope are related.
• include any other item(s) that theyfind helpful in mastering the skillsin this lesson.
About the Exercises…Organization by Objective• Direct Variation: 15–42, 47• Solve Problems: 43–46, 48–55
Odd/Even AssignmentsExercises 15–42 are structuredso that students practice thesame concepts whether theyare assigned odd or evenproblems.Alert! Exercises 59–62 requirethe use of a graphingcalculator.
Assignment GuideBasic: 15–51 odd, 52, 53, 56–58,63–78Average: 15–51 odd, 54–58,63–78 (optional: 59–62)Advanced: 16–46 even, 47, 48,50, 54–72 (optional: 73–78)All: Practice Quiz 1 (1–10)
6. 7. 8. y
xO
y � x12
y
xO
y � �3x
y
xO
y � 2x
Answers
13. y
xO
y � 6x

Study Guide and Intervention
Slope and Direct Variation
NAME ______________________________________________ DATE ____________ PERIOD _____
5-25-2
Less
on
5-2
Direct Variation A direct variation is described by an equation of the form y � kx,where k � 0. We say that y varies directly as x. In the equation y � kx, k is the constant of variation.
Name the constant ofvariation for the equation. Then findthe slope of the line that passesthrough the pair of points.
For y � x, the constant of variation is .
m � Slope formula
� (x1, y1) � (0, 0), (x2, y2) � (2, 1)
� Simplify.
The slope is .1�2
1�2
1 � 0�2 � 0
y2 � y1�x2 � x1
1�2
1�2
(2, 1)(0, 0) x
y
Oy � 12x
Suppose y variesdirectly as x, and y � 30 when x � 5.
a. Write a direct variation equationthat relates x and y.Find the value of k.
y � kx Direct variation equation
30 � k(5) Replace y with 30 and x with 5.
6 � k Divide each side by 5.
Therefore, the equation is y � 6x.
b. Use the direct variation equation tofind x when y � 18.
y � 6x Direct variation equation
18 � 6x Replace y with 18.
3 � x Divide each side by 6.
Therefore, x � 3 when y � 18.
Example 1Example 1 Example 2Example 2
ExercisesExercises
Name the constant of variation for each equation. Then determine the slope of theline that passes through each pair of points.
1. 2. 3.
�2; �2 3; 3 ;
Write a direct variation equation that relates x to y. Assume that y varies directlyas x. Then solve.
4. If y � 4 when x � 2, find y when x � 16. y � 2x; 325. If y � 9 when x � �3, find x when y � 6. y � �3x; �26. If y � �4.8 when x � �1.6, find x when y � �24. y � 3x; �87. If y � when x � , find x when y � . y � 2x; 3
�32
3�16
1�8
1�4
3�2
3�2
(–2, –3)
(0, 0)x
y
O
y � 32x
(1, 3)
(0, 0) x
y
O
y � 3x(–1, 2)
(0, 0)x
y
Oy � –2x
Study Guide and Intervention, p. 287 (shown) and p. 288
Name the constant of variation for each equation. Then determine the slope of theline that passes through each pair of points.
1. ; 2. ; 3. � ;�
Graph each equation.
4. y � �2x 5. y � x 6. y � � x
Write a direct variation equation that relates x and y. Assume that y variesdirectly as x. Then solve.
7. If y � 7.5 when x � 0.5, find y when x � �0.3. y � 15x; �4.5
8. If y � 80 when x � 32, find x when y � 100. y � 2.5x; 40
9. If y � when x � 24, find y when x � 12. y � x;
Write a direct variation equation that relates the variables. Then graph theequation.
10. MEASURE The width W of a 11. TICKETS The total cost C of tickets isrectangle is two thirds of the length �. $4.50 times the number of tickets t.
W � � C � 4.50t
12. PRODUCE The cost of bananas varies directly with their weight. Miguel bought
3 pounds of bananas for $1.12. Write an equation that relates the cost of the bananas
to their weight. Then find the cost of 4 pounds of bananas. C � 0.32p; $1.361�4
1�2
Cost of Tickets
Tickets
Co
st (
$)
20 4 61 3 5 t
C
25
20
15
10
5
Rectangle Dimensions
Length
Wid
th
40 8 122 6 10 �
W
10
8
6
4
2
2�3
3�8
1�32
3�4
x
y
O
5�3
x
y
O
6�5
x
y
O
5�2
5�2
(–2, 5)
(0, 0)x
y
O
y � � 52x
4�3
4�3(3, 4)
(0, 0)x
y
O
y � 43x
3�4
3�4
(4, 3)
(0, 0)x
y
O
y � 34x
Practice (Average)
Slope and Direct Variation
NAME ______________________________________________ DATE ____________ PERIOD _____
5-25-2Skills Practice, p. 289 and Practice, p. 290 (shown)
Reading to Learn Mathematics
Slope and Direct Variation
NAME ______________________________________________ DATE ____________ PERIOD _____
5-25-2
Pre-Activity How is slope related to your shower?
Read the introduction to Lesson 5-2 at the top of page 268 in your textbook.
• How do the numbers in the table relate to the graph shown?They are the coordinates of the points on the graph.
• Think about the first sentence. What does it mean to say that a standardshowerhead uses about 6 gallons of water per minute?Sample answer: For each minute the shower runs, 6 gallonsof water come out. So, if the shower ran 10 minutes, thatwould be 60 gallons.
Reading the Lesson
1. What is the form of a direct variation equation? y � kx
2. How is the constant of variation related to slope? The constant of variation hasthe same value as the slope of the graph of the equation.
3. The expression “y varies directly as x” can be written as the equation y � kx. How wouldyou write an equation for “w varies directly as the square of t”? w � kt2
4. For each situation, write an equation with the proper constant of variation.
a. The distance d varies directly as time t, and a cheetah can travel 88 feet in 1 second.d � 88t
b. The perimeter p of a pentagon with all sides of equal length varies directly as thelength s of a side of the pentagon. A pentagon has 5 sides. p � 5s
c. The wages W earned by an employee vary directly with the number of hours h thatare worked. Enrique earned $172.50 for 23 hours of work. W � $7.50h
Helping You Remember
5. Look up the word constant in a dictionary. How does this definition relate to the termconstant of variation? Sample answer: Something unchanging; the constantof variation relates x and y in the same value every time, and thatrelationship never changes.
Reading to Learn Mathematics, p. 291
nth Power VariationAn equation of the form y � kxn, where k � 0, describes an nth powervariation. The variable n can be replaced by 2 to indicate the second powerof x (the square of x) or by 3 to indicate the third power of x (the cube of x).
Assume that the weight of a person of average build varies directly as thecube of that person’s height. The equation of variation has the form w � kh3.
The weight that a person’s legs will support is proportional to the cross-sectional area of the leg bones. This area varies directly as the squareof the person’s height. The equation of variation has the form s � kh2.
Answer each question.
1. For a person 6 feet tall who weighs 200 pounds, find a value for k in the equation w � kh3.
k � 0.93
2. Use your answer from Exercise 1 to predict the weight of a person who is 5 feet tall. about 116 pounds
Enrichment
NAME ______________________________________________ DATE ____________ PERIOD _____
5-25-2Enrichment, p. 292
Practice and ApplyPractice and Apply
268 Chapter 5 Analyzing Linear Equations
43–46. See marginfor graphs.
43. C � 3.14d45. C � 0.99n46. C � 14.49p
Homework HelpFor See
Exercises Examples15–32 1–333–42 443–46,52–55 5
Extra PracticeSee page 831.
Name the constant of variation for each equation. Then determine the slope of theline that passes through each pair of points.
15. 16. 17.
18. 19. 20.
Graph each equation. 21–32. See pp. 315A–315B.21. y � x 22. y � 3x 23. y � �x 24. y � �4x
25. y � �14
�x 26. y � �35
�x 27. y � �52
�x 28. y � �75
�x
29. y � �15
�x 30. y � ��23
�x 31. y � ��43
�x 32. y � ��92
�x
Write a direct variation equation that relates x and y. Assume that y varies directly as x. Then solve.
33. If y � 8 when x � 4, find y when x � 5. y � 2x ; 10
34. If y � 36 when x � 6, find x when y � 42. y � 6x ; 7
35. If y � �16 when x � 4, find x when y � 20. y � �4x ; �5
36. If y � �18 when x � 6, find x when y � 6. y � �3x ; �2
37. If y � 4 when x � 12, find y when x � �24. y � �13
�x ; �8
38. If y � 12 when x � 15, find x when y � 21. y � �45
�x ; 26.25
39. If y � 2.5 when x � 0.5, find y when x � 20. y � 5x ; 100
40. If y � �6.6 when x � 9.9, find y when x � 6.6. y � ��23
�x ; �4.4
41. If y � 2�23
� when x � �14
�, find y when x � 1�18
�. y � �332�x ; 12
42. If y � 6 when x � �23
� , find x when y � 12. y � 9x ; �43
�
Write a direct variation equation that relates the variables. Then graph the equation.
43. GEOMETRY The circumference C of a circle is about 3.14 times the diameter d.
44. GEOMETRY The perimeter P of a square is 4 times the length of a side s. P � 4s
45. SEWING The total cost is C for n yards of ribbon priced at $0.99 per yard.
46. RETAIL Kona coffee beans are $14.49 per pound. The total cost of p pounds is C.
y
xO
(0, 0)
(4, �1)
y � � x14
y
xO
(0, 0)
(2, 3)
y � x32
y
xO
(0, 0)
(2, �2)
y � �x
y
x
(0, 0)
O
y � � x12
(2, �1)
y
xO (0, 0)
y � 4x
(�1, �4)
y
xO
(0, 0)
(2, 4)y � 2x
2; 2
�1; �1
4; 4
�32
�; �32
�
��12
�;
��12
�
��14
�;
��14
�
268 Chapter 5 Analyzing Linear Equations
ELL

Answers
43.
44.
45.
46.
56. The slope of the equation thatrelates time and water use is thenumber of gallons used perminute in the shower. Answersshould include the following.• y � 2.5x• Less steep; the slope is less
than the slope of the graph onpage 268.
59.
C
p
10
2 4 6 8
20
30
40
C
n
C � 0.99n
0
P
s
P � 4s
0
C
d
C � 3.14d
0
Lesson 5-2 Slope and Direct Variation 269www.algebra1.com/self_check_quiz
47. CRITICAL THINKING Suppose y varies directly as x. If the value of x isdoubled, what happens to the value of y? Explain.
BIOLOGY Which line in the graphrepresents the sprinting speeds of eachanimal?
48. elephant, 25 mph 449. reindeer, 32 mph 250. lion, 50 mph 151. grizzly bear, 30 mph 3
SPACE For Exercises 52 and 53, use the following information.The weight of an object on the moon varies directly with its weight on Earth. Withall of his equipment, astronaut Neil Armstrong weighed 360 pounds on Earth, butweighed only 60 pounds on the moon.
52. Write an equation that relates weight on the moon m with weight on Earth e.
53. Suppose you weigh 138 pounds on Earth. What would you weigh on the moon? 23 lb
ANIMALS For Exercises 54 and 55, use the following information.Most animals age more rapidly thanhumans do. The chart shows equivalent ages for horses and humans.
54. Write an equation that relates human age to horse age. y � 3x55. Find the equivalent horse age for a human who is 16 years old. 5 yr 4 mo
56. Answer the question that was posed at the beginning ofthe lesson. See margin.
How is slope related to your shower?
Include the following in your answer:• an equation that relates the number of gallons y to the time spent in the
shower x for a low-flow showerhead that uses only 2.5 gallons of water perminute, and
• a comparison of the steepness of the graph of this equation to the graph at thetop of page 268.
57. Which equation best describes the graph at the right? D
y � 2x y � �2x
y � �12
�x y � ��12
�x
58. Which equation does not model a direct variation? Cy � 4x y � 22x
y � 3x � 1 y � �12
�x
FAMILIES OF GRAPHS For Exercises 59–62, use the graphs of y � �1x, y � �2x,and y � �4x which form a family of graphs.
59. Graph y � �1x, y � �2x, and y � �4x on the same screen. See margin.60. How are these graphs similar to the graphs in the Graphing Calculator
Investigation on page 265? How are they different?
DC
BA
DC
BA
WRITING IN MATH
52. m � �16
�e
20
0
40
60
80
Dis
tan
ce
(mile
s)
1
4
Time (hours)1 2
3
2
Sprinting Speeds
47. It also doubles. If �
yx
� � k, and x is multiplied by 2, ymust also be multiplied by 2 tomaintain the value of k.
0 1 2 3 4 5
0 3 6 9 12 15
Horse age (x)
Human age (y)
y
xO
StandardizedTest Practice
GraphingCalculator
60. They all passthrough (0, 0) and havenegative slope, buteach has a differentslope.
VeterinaryMedicineVeterinarians compare theage of an animal to the ageof a human on the basis ofbone and tooth growth.
Online ResearchFor information about a career as aveterinarian, visit:www.algebra1.com/careers
Lesson 5-2 Direct Variation 269

Open-Ended Assessment
Writing Have students choosevalues for y and x. Have themfind the constant of variation,assuming y varies directly as x.Have them choose another valueof x and then find the correspond-ing value of y. Next, have studentschoose values for y and k, andsolve for x. Finally, have themchoose values for x and k, andsolve for y.
Getting Ready for Lesson 5-3PREREQUISITE SKILL In Lesson 5-3, students identify the slopeand y-intercept from an equationwritten in the form y � mx � b.To rewrite some equations in thisform, students must be able tosolve a linear equation for y.Exercises 73–78 can be used todetermine if students needadditional review in solvingequations for a given variable.
Assessment Options
Practice Quiz 1 The quizprovides students with a briefreview of the concepts and skillsin Lessons 5-1 and 5-2. Lessonnumbers are given to the right ofexercises or instruction lines sostudents can review concepts notyet mastered.Quiz (Lessons 5-1 and 5-2) isavailable on p. 337 of the Chapter 5Resource Masters.
Answers
62. Sample answer: Find the absolutevalue of k in each equation. Theone with the greatest value of |k |has the steeper slope.
270 Chapter 5 Analyzing Linear Equations
Maintain Your SkillsMaintain Your Skills
61. Write an equation whose graph has a steeper slope than y � �4x.
62. MAKE A CONJECTURE Explain how you can tell without graphing which oftwo direct variation equations has the graph with a steeper slope. See margin.
Find the slope of the line that passes through each pair of points. (Lesson 5-1)
63. 64. 65.
66. Find the value of r so that the line that passes through (1, 7) and (r, 3) has a slope of 2. (Lesson 5-1) �1
Each table below represents points on a linear graph. Copy and complete each table.(Lesson 4-8)
67. 68.
Add or subtract. (Lesson 2-3)
69. 15 � (�12) 3 70. 8 � (�5) 13 71. �9 � 6 �15 72. �18 � 12 �30
PREREQUISITE SKILL Solve each equation for y.(To review rewriting equations, see Lesson 3-8.) 73. y � 3x � 8 74. y � �2x � 773. �3x � y � 8 74. 2x � y � 7 75. 4x � y � 3 y � 4x � 376. 2y � 4x � 10 77. 9x � 3y � 12 78. x � 2y � 5 y � �
x �2
5�
y � 2x � 5 y � �3x � 4
y
xO
(�2, 3)
(�3, 1)
y
xO
(2, 2)
(2, �2)
y
xO
(1, 3)
(2, 0)
�3 undefined 2
0 1 2 3 4 5
1 5 9 13 17 21
x
y
2 4 6 8 10 12
8 6 4 2 0 –2
x
y
Mixed Review
Getting Ready forthe Next Lesson
61. Sample answer:y � �5x
Practice Quiz 1Practice Quiz 1
Find the slope of the line that passes through each pair of points. (Lesson 5-1)
1. (�4, �6), (�3, �8) �22. (8, 3), (�11, 3) 0 3. (�4, 8), (5, 9) �19
� 4. (0, 1), (7, 11) �170�
Find the value of r so the line that passes through each pair of points has the given slope. (Lesson 5-1)
5. (5, �3), (r, �5), m � 2 4 6. (6, r), (�4, 9), m � �32
� 24
Graph each equation. (Lesson 5-2) 7–8. See margin.7. y � �7x 8. y � �
34
�x
Write a direct variation equation that relates x and y. Assume that y varies directly as x. Then solve. (Lesson 5-2)
9. If y � 24 when x � 8, find y when x � �3. 10. If y � �10 when x � 15, find x when y � �6.9. y � 3x; �9 10. y � ��
23
�x; 9
Lessons 5-1 and 5-2
270 Chapter 5 Analyzing Linear Equations
4 Assess4 Assess
7. 8. y
xO
y � x34
y
xO
y � �7x

Study NotebookStudy NotebookYou may wish to have studentssummarize this activity and whatthey learned from it.
AlgebraActivity
Getting StartedGetting Started
TeachTeach
AssessAssess
A Preview of Lesson 5-3
Objective To discover the linearrelationship between the lengthof a rubber band and the numberof washers hanging from therubber band.Materialsplastic sandwich baglong rubber band scissorstape grid papercentimeter ruler washers
• You may want to showstudents how to measurecarefully and accurately withthe centimeter ruler.
• Urge students to worklogically, recording their datacarefully. One carelessrecording will prevent studentsfrom seeing a pattern.
• Ask students to find a rule thatgives “directions” for how toget from one point to the nexton the graph (i.e., up howmany units, right how manyunits).
In Exercises 1–5, students should• discover that the graphed
points form a linear pattern• find the rate of change• understand that the rate of
change is the slope of the lineconnecting the points.Investigating Slope-Intercept Form 271
A Preview of Lesson 5-3
Collect the Data• Cut a small hole in a top corner of a plastic sandwich
bag. Loop a long rubber band through the hole.• Tape the free end of the rubber band to the desktop.• Use a centimeter ruler to measure the distance from the
desktop to the end of the bag. Record this distance for 0 washers in the bag using a table like the one below.
• Place one washer in the plastic bag. Then measure and record the new distancefrom the desktop to the end of the bag.
• Repeat the experiment, adding different numbers of washers to the bag. Eachtime, record the number of washers and the distance from the desktop to the endof the bag.
Analyze the Data1. The domain contains values represented by the independent variable, washers.
The range contains values represented by the dependent variable, distance. On grid paper, graph the ordered pairs (washers, distance). See students’ work.
2. Write a sentence that describes the points on the graph.3. Describe the point that represents the trial with no washers in the bag.4. The rate of change can be found by using the formula for slope.
�rriusne
� �
Find the rate of change in the distance from the desktop to the end of the bag asmore washers are added. See students’ work. Sample answer: 1.5
5. Explain how the rate of change is shown on the graph.The slope represents the rate of change.
Make a Conjecture 6–8. See pp. 315A–315B.The graph shows sample data from a rubber bandexperiment. Draw a graph for each situation.6. A bag that hangs 10.5 centimeters from the desktop when
empty and lengthens at the rate of the sample.7. A bag that has the same length when empty as the sample and
lengthens at a faster rate.8. A bag that has the same length when empty as the sample and
lengthens at a slower rate.
change in distance����change in number of washers
Investigating Slope-Intercept Form
Number of Washers20
8
10
12
14
4 6 8
Dist
ance
(cm
)
Algebra Activity Investigating Slope-Intercept Form 271
It is the y-intercept.Sample answer: lt is a linear pattern.
Distancey
Number of Washers
x
Algebra Activity Investigating Slope-Intercept Form 271
Teaching Algebra withManipulatives• p. 1 (master for grid paper)• p. 98 (student recording sheet)
Glencoe Mathematics Classroom Manipulative Kit• rulers• tape measures
Resource ManagerResource Manager

5-Minute CheckTransparency 5-3 Use as a
quiz or review of Lesson 5-2.
Mathematical Background notesare available for this lesson on p. 254C.
is a y-intercept relatedto a flat fee?
Ask students:• Does this line have a positive
slope or a negative slope?positive
• What do x and y represent inthe equation y � 0.1x � 5? x isthe number of minutes, and y is thetotal amount spent for cellularservice.
• Banking One of the checkingplans offered by a local bankincludes a $10 monthly servicefee and $0.20 per check or with-drawal for accounts with anaverage daily balance of lessthan $2000. What equationdescribes this plan? Sampleanswer: P � $0.20c � $10
Vocabulary• slope-intercept form
Slope-Intercept Form
272 Chapter 5 Analyzing Linear Equations
Study TipLook Back To review intercepts,see Lesson 4-5.
Study Tip
Example 1Example 1
• Write and graph linear equations in slope-intercept form.
• Model real-world data with an equation in slope-intercept form.
x y(minutes) (dollars)
0 5.00
1 5.10
2 5.20
3 5.30
4 5.40
5 5.50
6 5.60
7 5.70
Total Cost of Cellular Phone Service
1 2 3 4Minutes
5 6 70 x
y
Do
llars
5.00
5.50
6.00
6.50
7.00← ←
Slope-Intercept Form• Words The linear equation
y � mx � b is written inslope-intercept form,where m is the slope and bis the y-intercept.
• Symbols y � mx � b
slope y-intercept
• Model y
x
y � mx � b(0, b)
O
SLOPE-INTERCEPT FORM An equation of the form y � mx � b is in. When an equation is written in this form, you can identify
the slope and y-intercept of its graph.slope-intercept form
← ←
Write an Equation Given Slope and y-InterceptWrite an equation of the line whose slope is 3 and whose y-intercept is 5.
y � mx � b Slope-intercept form
y � 3x � 5 Replace m with 3 and b with 5.
TEACHING TIPPoint out that the y-intercept is the valueon the y-axis where theline crosses that axis.
A cellular phone service provider charges $0.10 per minute plus a flat fee of$5.00 each month.
The slope of the line is 0.1. It crosses the y-axis at (0, 5).The equation of the line is y � 0.1x � 5.
charge per minute, $0.10 flat fee, $5.00
is a y-intercept related to a flat fee?is a y-intercept related to a flat fee?
LessonNotes
1 Focus1 Focus
Chapter 5 Resource Masters• Study Guide and Intervention, pp. 293–294• Skills Practice, p. 295• Practice, p. 296• Reading to Learn Mathematics, p. 297• Enrichment, p. 298
Parent and Student Study GuideWorkbook, p. 40
School-to-Career Masters, p. 9
5-Minute Check Transparency 5-3Real-World Transparency 5Answer Key Transparencies
TechnologyInteractive Chalkboard
Workbook and Reproducible Masters
Resource ManagerResource Manager
Transparencies

11
22
33
44
In-Class ExamplesIn-Class ExamplesSLOPE-INTERCEPT FORM
Teaching Tip Remind studentsthat b can be negative, so theirequation may not always have apositive constant.
Write an equation of the line
whose slope is and whose
y-intercept is �6.
Write an equation of the lineshown in the graph.
y � 2x � 3
Teaching Tip Ask students whatthe y-intercept is for the linewhose equation is y � 0.5x � 7.Make sure they recognize thatthis is actually y � 0.5x � (�7),so b � �7, not 7.
Graph y � 0.5x � 7.
Graph 5x � 4y � 8.
x
y
O
5x � 4y � 8
xy
O
y � 0.5x � 7
(0, –3)
(2, 1)x
y
O
1�4
Lesson 5-3 Slope-Intercept Form 273
Write an Equation Given Two PointsWrite an equation of the line shown in the graph.
Step 1 You know the coordinates of two points on theline. Find the slope. Let (x1, y1) � (0, 3) and (x2, y2) � (2, �1).
m � �yx
2
2
�
�
yx
1
1� �
rriusne
�
m � ��21��
03
�
m � ��24� or �2 Simplify.
The slope is �2.
Step 2 The line crosses the y-axis at (0, 3). So, the y-intercept is 3.
Step 3 Finally, write the equation.
y � mx � b Slope-intercept form
y � �2x � 3 Replace m with �2 and b with 3.
The equation of the line is y � �2x � 3.
x1 � 0, x2 � 2
y1 � 3, y2 � �1
y
x(2, �1)
(0, 3)
O
Study Tip
Example 2Example 2
Example 3Example 3
Example 4Example 4 Graph an Equation in Standard FormGraph 5x � 3y � 6.
Step 1 Solve for y to find the slope-intercept form.
5x � 3y � 6 Original equation
5x � 3y � 5xx � 6 � 5xx Subtract 5x from each side.
�3y � 6 � 5x Simplify.
�3y � �5x � 6 6 � 5x � 6 � (�5x) or �5x � 6
��
�
33y
� � ��5
�x
3� 6� Divide each side by �3.
��
�
33y
� � ���
53x
� � ��63� Divide each term in the numerator by �3.
y � �53
�x � 2 Simplify.
Graph an Equation in Slope-Intercept FormGraph y � ��
23
�x � 1.
Step 1 The y-intercept is 1. So, graph (0, 1).
Step 2 The slope is ��23
� or ��32�. �
rriusne
�
From (0, 1), move down 2 units and right 3 units. Draw a dot.
Step 3 Draw a line connecting the points.
y
x
(0, 1)
y � � x � 123
O
One advantage of the slope-intercept form is that it allows you to graph an equation quickly.
www.algebra1.com/extra_examples
Vertical LinesThe equation of a verticalline cannot be written inslope-intercept form.Why?
Horizontal LinesThe equation of ahorizontal line can bewritten in slope-interceptform as y � 0x � b or y � b.
(0, b)
y
x
y � b
O
(a, 0)
y
x
x � a
O
(continued on the next page)
Lesson 5-3 Slope-Intercept Form 273
2 Teach2 Teach
y � x � 61�4
PowerPoint®

55
In-Class ExampleIn-Class Example
MODEL REAL-WORLD DATA
HEALTH The ideal maximumheart rate for a 25-year-oldwho is exercising to burn fatis 117 beats per minute. Forevery 5 years older than 25,that ideal rate drops 3 beatsper minute.
a. Write a linear equation to findthe ideal maximum heart ratefor anyone over 25 who isexercising to burn fat.
R � � a � 117, where R is the
ideal heart rate and a is thenumber of years older than 25
b. Graph the equation.
c. Find the ideal maximum heartrate for a person exercising toburn fat who is 55 years old.99 beats per minute
Ideal Heart Rates
Years Above 25
Max
imu
m H
eart
Rat
e
20 4 6 71 3 5 a
R
117
116
115
114
113
112
R � � 35a � 117
3�5
Step 2 The y-intercept of y � �53
�x � 2 is �2. So, graph (0, �2).
Step 3 The slope is �53
�. From (0, �2), move up 5 units
and right 3 units. Draw a dot.
Step 4 Draw a line containing the points.
274 Chapter 5 Analyzing Linear Equations
Example 5Example 5 Write an Equation in Slope-Intercept FormAGRICULTURE The natural sweeteners used in foods include sugar, cornsweeteners, syrup, and honey. Use the information at the left about naturalsweeteners.
a. The amount of natural sweeteners consumed has increased by an average of2.6 pounds per year. Write a linear equation to find the average consumption ofnatural sweeteners in any year after 1989.
Words The consumption increased 2.6 pounds per year, so the rate of changeis 2.6 pounds per year. In the first year, the average consumption was133 pounds.
Variables Let C � average consumption.Let n � number of years after 1989.
EquationAverage rate of number of years amount
consumption equals change times after 1989 plus at start.
C � 2.6 � n � 133
b. Graph the equation.
The graph passes through (0, 133) with slope 2.6.
c. Find the number of pounds of naturalsweeteners consumed by each person in 1999.
The year 1999 is 10 years after 1989. So, n � 10.
C � 2.6n � 133 Consumption equation
C � 2.6(10) � 133 Replace n with 10.
C � 159 Simplify.
So, the average person consumed 159 pounds of natural sweeteners in 1999.
CHECK Notice that (10, 159) lies on the graph.
Consumption ofNatural Sweeteners
1 2 3 4Years Since 1989
5 6 7 8 9 100 n
C
Pou
nd
s
130
140
150
160
C � 2.6n � 133
(10, 159)
�������
MODEL REAL-WORLD DATA If a quantity changes at a constant rate overtime, it can be modeled by a linear equation. The y-intercept represents a startingpoint, and the slope represents the rate of change.
y
x(0, �2) 5x � 3y � 6
O
More About . . .
AgricultureIn 1989, each person in theUnited States consumed anaverage of 133 pounds ofnatural sweeteners.Source: USDA Agricultural
Outlook
274 Chapter 5 Analyzing Linear Equations
Visual/Spatial Word problems may be difficult for visual learnersbecause they cannot picture what the problem is trying to communicate.Sometimes it is easier for a visual learner to graph or draw a picture ofthe given information before they can write the equation. In In-ClassExample 5, you may wish to do part b first by using the starting pointand the rate of change to determine other points on the graph. Thenwrite the equation that describes the line formed.
Differentiated Instruction ELL
PowerPoint®

Lesson 5-3 Slope-Intercept Form 275
Practice and ApplyPractice and Apply
1. OPEN ENDED Write an equation for a line with a slope of 7.
2. Explain why equations of vertical lines cannot be written in slope-interceptform, but equations of horizontal lines can.
3. Tell which part of the slope-intercept form represents the rate of change. slope
Write an equation of the line with the given slope and y-intercept.
4. slope: �3, y-intercept: 1 y � �3x � 1 5. slope: 4, y-intercept: �2 y � 4x � 2
Write an equation of the line shown in each graph.
6. 7.
y � 2x � 1 y � ��32
�x � 2Graph each equation. 8–10. See margin. 8. y � 2x � 3 9. y � �3x � 1 10. 2x � y � 5
MONEY For Exercises 11–13, use the following information.Suppose you have already saved $50 toward the cost of a new television set. Youplan to save $5 more each week for the next several weeks. 11. T � 50 � 5w
11. Write an equation for the total amount T you will have w weeks from now.
12. Graph the equation. See margin.13. Find the total amount saved after 7 weeks. $85
y
x(2, �1)
(0, 2)
O
y
x(0, �1)
(2, 3)
O
Concept Check1. Sample answer:
y � 7x � 2
Guided Practice
Application
20. y � 3x � 1
21. y � �32
�x � 4
22. y � �4x � 2
www.algebra1.com/self_check_quiz
2. Vertical lines have undefined slope. Horizontal lines have a slope of 0.
Write an equation of the line with the given slope and y-intercept.
14. slope: 2, y-intercept: �6 y � 2x � 6 15. slope: 3, y-intercept: �5 y � 3x � 5
16. slope: �12
�, y-intercept: 3 y � �12
�x � 3 17. slope: ��35
�, y-intercept: 0 y � ��35
�x
18. slope: �1, y-intercept: 10 19. slope: 0.5; y-intercept: 7.5y � �x � 10 y � 0.5x � 7.5
Write an equation of the line shown in each graph.
20. 21. 22. y
x(1, �2)
(0, 2)
O
y
x
(0, �4)
(2, �1)O
y
x
(1, 4)
(0, 1)
O
Homework HelpFor See
Exercises Examples 14–19 120–27 228–39 3, 440–43 5
Extra PracticeSee page 831.
GUIDED PRACTICE KEYExercises Examples
4, 5 16, 7 2
8–10 3, 411–13 5
Lesson 5-3 Slope-Intercept Form 275
3 Practice/Apply3 Practice/Apply
Study NotebookStudy NotebookHave students—• add the definitions/examples of
the vocabulary terms to theirVocabulary Builder worksheets forChapter 5.
• include any other item(s) that theyfind helpful in mastering the skillsin this lesson.
About the Exercises…Organization by Objective• Slope-Intercept Form: 14–39• Model Real-World Data:
40–43, 45–49
Odd/Even AssignmentsExercises 14–39 are structuredso that students practice thesame concepts whether theyare assigned odd or evenproblems.
Assignment GuideBasic: 15–43 odd, 44–46, 50–52,56–67Average: 15–43 odd, 44–46,50–52, 56–67 (optional: 53–55)Advanced: 14–42 even, 44–64(optional: 65–67)
Answer
12.80
60
40
20
02 4 6 8 w
T
T � 50 � 5w
8. 9. 10. y
xO
2x � y � 5
y
xO
y � �3x � 1
y
xO
y � 2x � 3

Study Guide and Intervention
Slope-Intercept Form
NAME ______________________________________________ DATE ____________ PERIOD _____
5-35-3
Less
on
5-3
Slope-Intercept Form
Slope-Intercept Form y � mx � b, where m is the given slope and b is the y-intercept
Write an equation of the line whose slope is �4 and whose y-intercept is 3.y � mx � b Slope-intercept form
y � �4x � 3 Replace m with �4 and b with 3.
Graph 3x � 4y � 8.
3x � 4y � 8 Original equation
�4y � �3x � 8 Subtract 3x from each side.
� Divide each side by �4.
y � x � 2 Simplify.
The y-intercept of y � x � 2 is �2 and the slope is . So graph the point (0, �2). From
this point, move up 3 units and right 4 units. Draw a line passing through both points.
Write an equation of the line with the given slope and y-intercept.
1. slope: 8, y-intercept �3 2. slope: �2, y-intercept �1 3. slope: �1, y-intercept �7y � 8x � 3 y � �2x � 1 y � �x � 7
Write an equation of the line shown in each graph.
4. 5. 6.
y � 2x � 2 y � �x � 3 y � x � 5
Graph each equation.
7. y � 2x � 1 8. y � �3x � 2 9. y � �x � 1
x
y
Ox
y
Ox
y
O
3�4
(4, –2)
(0, –5)
xy
O
(3, 0)
(0, 3)
x
y
O(0, –2)
(1, 0) x
y
O
3�4
3�4
3�4
�3x � 8��
�4�4y��4
(0, –2)
(4, 1)
x
y
O
3x � 4y � 8
Example 1Example 1
Example 2Example 2
ExercisesExercises
Study Guide and Intervention, p. 293 (shown) and p. 294
Write an equation of the line with the given slope and y-intercept.
1. slope: , y-intercept: 3 y � x � 3 2. slope: , y-intercept: �4 y � x �4
3. slope: 1.5, y-intercept: �1 4. slope: �2.5, y-intercept: 3.5y � 1.5x � 1 y � �2.5x � 3.5
Write an equation of the line shown in each graph.
5. 6. 7.
y � x � 2 y � x � 3 y � � x � 2
Graph each equation.
8. y � � x � 2 9. 3y � 2x � 6 10. 6x � 3y � 6
Write a linear equation in slope-intercept form to model each situation.
11. A computer technician charges $75 for a consultation plus $35 per hour. C � 35h � 75
12. The population of Pine Bluff is 6791 and is decreasing at the rate of 7 per year.P � �7t � 6791
WRITING For Exercises 13–15, use the following information.Carla has already written 10 pages of a novel. She plansto write 15 additional pages per month until she is finished.
13. Write an equation to find the total number of pages Pwritten after any number of months m. P � 10 � 15m
14. Graph the equation on the grid at the right.
15. Find the total number of pages written after 5 months. 85
Carla’s Novel
Months
Pag
es W
ritt
en
20 4 61 3 5 m
P
100
80
60
40
20
x
y
Ox
y
Ox
y
O
1�2
2�3
3�2
2�5
(–3, 0)
(0, –2)
x
y
O(–2, 0)
(0, 3)
x
y
O(–5, 0)
(0, 2)
x
y
O
3�2
3�2
1�4
1�4
Practice (Average)
Slope-Intercept Form
NAME ______________________________________________ DATE ____________ PERIOD _____
5-35-3Skills Practice, p. 295 and Practice, p. 296 (shown)
Reading to Learn Mathematics
Slope-Intercept Form
NAME ______________________________________________ DATE ____________ PERIOD _____
5-35-3
Pre-Activity How is a y-intercept related to a flat fee?
Read the introduction to Lesson 5-3 at the top of page 276 in your textbook.
• What point on the graph shows that the flat fee is $5.00? (0, 5)• How does the rate of $0.10 per minute relate to the graph?
It is the slope.
Reading the Lesson
1. Fill in the boxes with the correct words to describe what m and b represent.
y � mx � b↑ ↑
2. What are the slope and y-intercept of a vertical line?
The slope is undefined, and there is no y-intercept.
3. What are the slope and y-intercept of a horizontal line?
The slope is 0, and the y-intercept is where it crosses the y-axis.
4. Read the problem. Then answer each part of the exercise.
A ruby-throated hummingbird weighs about 0.6 gram at birth and gains weight at a rateof about 0.2 gram per day until fully grown.
a. Write a verbal equation to show how the words are related to finding the averageweight of a ruby-throated hummingbird at any given week. Use the words weight atbirth, rate of growth, weight, and weeks after birth. Below the equation, fill in anyvalues you know and put a question mark under the items that you do not know.
� � �
b. Define what variables to use for the unknown quantities. Sample answer: Let W be the weight at any time and t be the number of weeks after birth.
c. Use the variables you defined and what you know from the problem to write anequation. W � 0.2t � 0.6
Helping You Remember
5. One way to remember something is to explain it to another person. Write how you wouldexplain to someone the process for using the y-intercept and slope to graph a linearequation. On the y-axis, plot the point for the y-intercept. Then use therise-over-run definition of slope to determine how far up or down andright or left the next point is from the first.
y-interceptslope
weight?
rate of growth0.2
weeks after birth?
weight at birth0.6
Reading to Learn Mathematics, p. 297
Relating Slope-Intercept Form and Standard Forms
You have learned that slope can be defined in terms of or .
Another definition can be found from the standard from of a linear equation. Standard form is Ax � By � C, where A, B, and C are integers, A � 0, and A and B are not both zero.
1. Solve Ax � By � C for y. Your answer should be written in slope-intercept form.
y � � x �
2. Use the slope-intercept equation you wrote in Exercise 1 to write expressions for the slope and the y-intercept in terms of A, B, and C.
m � � , b � C�B
A�B
C�B
A�B
y2 � y1�x2 � x1
rise�run
Enrichment
NAME ______________________________________________ DATE ____________ PERIOD _____
5-35-3Enrichment, p. 298
Write an equation of the line shown in each graph.
23. 24. 25.
y � ��23
�x � 1 y � �32
�x y � 226. Write an equation of a horizontal line that crosses the y-axis at (0, �5). y � �5
27. Write an equation of a line that passes through the origin with slope 3. y � 3x
Graph each equation. 28–39. See pp. 315A–315B.28. y � 3x � 1 29. y � x � 2 30. y � �4x � 1
31. y � �x � 2 32. y � �12
�x � 4 33. y � ��13
�x � 3
34. 3x � y � �2 35. 2x � y � �3 36. 3y � 2x � 3
37. �2y � 6x � 4 38. 2x � 3y � 6 39. 4x � 3y � 3
Write a linear equation in slope-intercept form to model each situation.
40. You rent a bicycle for $20 plus $2 per hour. C � 20 � 2t41. An auto repair shop charges $50 plus $25 per hour. C � 50 � 25h42. A candle is 6 inches tall and burns at a rate of �
12
� inch per hour. H � 6 � �12
�t43. The temperature is 15° and is expected to fall 2° each hour during the night.
T � 15 � 2h
44. CRITICAL THINKING The equations y � 2x � 3, y = 4x � 3, y � �x � 3, andy � �10x � 3 form a family of graphs. What characteristic do their graphs havein common? They all have a y-intercept of 3.
SALES For Exercises 45 and 46, use the following information and the graph at the right.In 1991, book sales in the United Statestotaled $16 billion. Sales increased by about $1 billion each year until 1999.
45. Write an equation to find the total sales S for any year t between 1991 and 1999. S � 16 � t
46. If the trend continues, what will sales be in 2005? $30 billion
TRAFFIC For Exercises 47–49, use the following information.In 1966, the traffic fatality rate in the United States was 5.5 fatalities per 100 million vehicle miles traveled. Between 1966 and 1999, the rate decreased by about 0.12 each year.
47. Write an equation to find the fatality rate R for any year t between 1966 and 1999. R � 5.5 � 0.12t
48. Graph the equation. See margin. 49. Find the fatality rate in 1999. 1.54
Book Sales
1 2 3 4Years Since 1991
5 6 7 80 t
S
Sale
s(b
illio
ns
of
do
llars
)
16
18
20
22
Source: Association of American Publishers
y
x
(0, 2) (2, 2)
O
y
x
(0, 0)
(2, 3)
O
y
x(3, �1)
(0, 1)
O
276 Chapter 5 Analyzing Linear Equations
276 Chapter 5 Analyzing Linear Equations
ELL
Answer
48.
0 t
R
R � 5.5 � 0.12t

Open-Ended Assessment
Speaking Have studentssummarize how they can drawthe graph of an equation withoutfinding points that satisfy theequation.
Getting Ready for Lesson 5-4PREREQUISITE SKILL In Lesson 5-1, students found the slope of aline using two points on that line.This same skill is vital in Lesson5-4, in which students use pointson the line to determine theinformation necessary to writean equation in slope-interceptform. Exercises 65–67 should beused to determine your students’familiarity with finding the slopeof a line from two points on thatline.
Answer
50. The y-intercept is the flat fee in anequation that represents a price.Answers should include thefollowing.• The graph crosses the y-axis at
5.99.• Sample answer: A mechanic
charges $25 plus $40 per hourto work on your car.
Lesson 5-3 Slope-Intercept Form 277
StandardizedTest Practice
Maintain Your SkillsMaintain Your Skills
Mixed Review
61. �0.5, �34
�, �78
�, 2.5
Getting Ready forthe Next Lesson
Write a direct variation equation that relates x and y. Assume that y varies directlyas x. Then solve. (Lesson 5-2)
56. If y � 45 when x � 60, find x when y � 8. y � �34
�x, 10�23
�
57. If y � 15 when x � 4, find y when x � 10. y � �145�x, 37�1
2�
Find the slope of the line that passes through each pair of points. (Lesson 5-1)
58. (�3, 0), (�4, 6) �6 59. (3, �1), (3, �4)undefined60. (5, �5), (9, 2) �74
�
61. Write the numbers 2.5, �34
�, �0.5, �78
� in order from least to greatest. (Lesson 2-4)
Solve each equation. (Lesson 1-3)
62. x � �15
2� 9� 3 63. 3(7) � 2 � b 23 64. q � 62 � 22 32
PREREQUISITE SKILL Find the slope of the line that passes through each pair of points. (To review slope, see Lesson 5-1.)
65. (�1, 2), (1, �2) �2 66. (5, 8), (�2, 8) 0 67. (1, �1), (10, �13) ��43
�
50. Answer the question that was posed at the beginning of the lesson. See margin.
How is a y-intercept related to a flat fee?
Include the following in your answer:• the point at which the graph would cross the y-axis if your cellular phone
service provider charges a rate of $0.07 per minute plus a flat fee of $5.99, • and a description of a situation in which the y-intercept of its graph is $25.
51. Which equation does not have a y-intercept of 5? D2x � y � 5 3x � y � 5y � x � 5 2x � y � 5
52. Which situation below is modeled by the graph? BYou have $100 and plan to spend $5 each week.You have $100 and plan to save $5 each week. You need $100 for a new CD player and plan to save $5 each week.You need $100 for a new CD player and plan to spend $5 each week.
53. The standard form of a linear equation is Ax � By � C, where A, B, and C areintegers, A � 0, and A and B are not both zero. Solve Ax � By � C for y. Youranswer is written in slope-intercept form.
54. Use the slope-intercept equation in Exercise 53 to write expressions for the slopeand y-intercept in terms of A, B, and C.
55. Use the expressions in Exercise 54 to find the slope and y-intercept of eachequation.
a. 2x � y � �4 b. 3x � 4y � 12 c. 2x � 3y � 9
m � �2, b � �4 m � ��34
�, b � 3 m � �23
�, b � �3
D
C
B
A
O 1 2 3 4 5
100105110115
y
x
DC
BA
WRITING IN MATH
Extending the Lesson
53. y � ��AB
�x � �CB
�
54. m � ��AB
�, b � �CB
�
Lesson 5-3 Slope-Intercept Form 277
4 Assess4 Assess
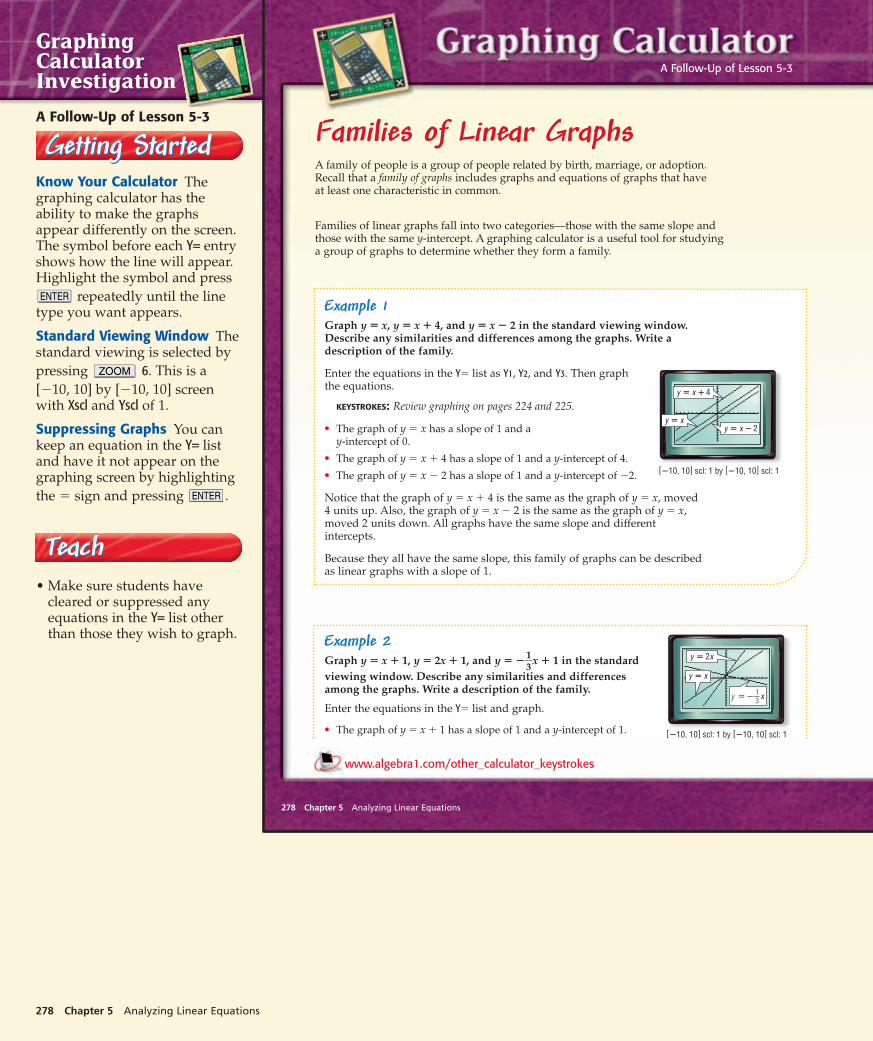
GraphingCalculatorInvestigation
TeachTeach
Getting StartedGetting StartedA Follow-Up of Lesson 5-3
Know Your Calculator Thegraphing calculator has theability to make the graphsappear differently on the screen.The symbol before each Y= entryshows how the line will appear.Highlight the symbol and press
repeatedly until the linetype you want appears.
Standard Viewing Window Thestandard viewing is selected by pressing 6. This is a [�10, 10] by [�10, 10] screenwith Xscl and Yscl of 1.
Suppressing Graphs You cankeep an equation in the Y= listand have it not appear on thegraphing screen by highlighting the � sign and pressing .ENTER
ZOOM
ENTER
278 Chapter 5 Analyzing Linear Equations
Families of Linear Graphs
www.algebra1.com/other_calculator_keystrokes
A family of people is a group of people related by birth, marriage, or adoption. Recall that a family of graphs includes graphs and equations of graphs that have at least one characteristic in common.
Families of linear graphs fall into two categories—those with the same slope and those with the same y-intercept. A graphing calculator is a useful tool for studying a group of graphs to determine whether they form a family.
A Follow-Up of Lesson 5-3
Example 1Graph y � x, y � x � 4, and y � x � 2 in the standard viewing window.Describe any similarities and differences among the graphs. Write adescription of the family.
Enter the equations in the Y� list as Y1, Y2, and Y3. Then graph the equations.
KEYSTROKES: Review graphing on pages 224 and 225.
• The graph of y � x has a slope of 1 and a y-intercept of 0.
• The graph of y � x � 4 has a slope of 1 and a y-intercept of 4.
• The graph of y � x � 2 has a slope of 1 and a y-intercept of �2.
Notice that the graph of y � x � 4 is the same as the graph of y � x, moved4 units up. Also, the graph of y � x � 2 is the same as the graph of y � x,moved 2 units down. All graphs have the same slope and differentintercepts.
Because they all have the same slope, this family of graphs can be describedas linear graphs with a slope of 1.
Example 2Graph y � x � 1, y � 2x � 1, and y � ��
13
�x � 1 in the standardviewing window. Describe any similarities and differences among the graphs. Write a description of the family.
Enter the equations in the Y� list and graph.
• The graph of y � x � 1 has a slope of 1 and a y-intercept of 1.
y � x � 4
y � xy � x � 2
[�10, 10] scl: 1 by [�10, 10] scl: 1
y � 2x
y � x
y � � x13
[�10, 10] scl: 1 by [�10, 10] scl: 1
278 Chapter 5 Analyzing Linear Equations
• Make sure students havecleared or suppressed anyequations in the Y= list otherthan those they wish to graph.

AssessAssess• Ask students to summarize
what belonging to a family ofgraphs means.
• Ask students how they can pre-dict what family a set of graphsmight belong to by analyzingthe equations of the lines.
Answers
7. Sample answer: The value of mdetermines the steepness anddirection of the graph. If the graphhas a positive slope, it slantsupward from left to right. A graphwith a negative slope slantsdownward from left to right. Thegreater the absolute value of theslope, the steeper the line. Lineswith the same slope are parallel.The value of b determines wherethe line crosses the y-axis. Lineswith the same value of b form afamily of lines that intersect atthat intercept. The values of b in afamily of parallel lines determinehow far the lines are apart on they-axis.
9. See students’ graphs. The graphof y � |x | � c is the same as thegraph of y � |x |, translated ver-tically c units. If c is positive, thetranslation is up; if c is negative,the translation is down. The graphof y � |x � c | is the same as thegraph of y � |x |, translated hori-zontally c units. If c is positive,the translation is to the left; if c isnegative, the translation is to theright.
Graphing Calculator Investigation Families of Linear Graphs 279
8. This class offunctions hasgraphs that arelines with slope 1.Their y-interceptsare all different.
• The graph of y � 2x � 1 has a slope of 2 and a y-intercept of 1.
• The graph of y � ��13
�x � 1 has a slope of ��13
� and a y-intercept of 1.
These graphs have the same intercept and different slopes. This family ofgraphs can be described as linear graphs with a y-intercept of 1.
Sometimes a common characteristic is not enough to determinethat a group of equations describes a family of graphs.
Example 3Graph y � �3x, y � �3x � 5, and y � ��
12
�x in the standard viewing window.Describe any similarities and differences among the graphs.
• The graph of y � �3x has slope �3 and y-intercept 0.
• The graph of y � �3x � 5 has slope �3 and y-intercept 5.
• The graph of y � ��12
�x has slope ��12
� and y-intercept 0.
These equations are similar in that they all have negative slope.However since the slopes are different and the y-intercepts aredifferent, these graphs are not all in the same family.
y � �3x � 5y � �3x
y � � x12
[�10, 10] scl: 1 by [�10, 10] scl: 1
ExercisesGraph each set of equations on the same screen. Describe any similarities or differences among the graphs. If the graphs are part of the same family, describe the family. 1–6. See pp. 315A–315B.1. y � �4 2. y � �x � 1 3. y � x � 4
y � 0 y � 2x � 1 y � 2x � 4y � 7 y � �
14
�x � 1 y � 2x � 4
4. y � �12
�x � 2 5. y � �2x � 2 6. y � 3x
y � �13
�x � 3y � 2x � 2 y � 3x � 6
y � �14�x � 4
y � �12
�x � 2 y � 3x � 7
7. MAKE A CONJECTURE Write a paragraph explaining how the values of m and b in the slope-intercept form affect the graph of the equation. See margin.
8. Families of graphs are also called . Describe the similarities and differences in the class of functions f(x) � x � c, where c is any real number.
9. Graph y � x. Make a conjecture about the transformations of the parent graph, y � x � c and, y � x � c. Use a graphing calculator with different values of c to test your conjecture. See margin.
classes of functions
Graphing Calculator Investigation Families of Linear Graphs 279

5-Minute CheckTransparency 5-4 Use as a
quiz or review of Lesson 5-3.
Mathematical Background notesare available for this lesson on p. 254D.
can slope-interceptform be used to make
predictions?Ask students:• How do you know that the
slope is 2000? The y valuesincrease 2000 for each unit on thex-axis.
• What would be the y value forx � 1997? 179,000
• Biology Suppose a populationof bacteria has an averagegrowth of 200 bacteria per hour.Describe the graph that dem-onstrates the growth pattern ofthe bacteria. The line would havea slope of 200 and begin at (0, p)where p is the initial population.
WRITE AN EQUATION GIVEN THE SLOPE AND ONE POINT Youhave learned how to write an equation of a line when you know the slope and aspecific point, the y-intercept. The following example shows how to write anequation when you know the slope and any point on the line.
Vocabulary• linear extrapolation
Writing Equations in Slope-Intercept Form
280 Chapter 5 Analyzing Linear Equations
In 1995, the population of Orlando, Florida, was about 175,000. At that time, the population was growing at a rate of about 2000 per year.
If you could write an equation based on the slope, 2000, and the point (1995, 175,000), you could predict the population for another year.
• Write an equation of a line given the slope and one point on a line.
• Write an equation of a line given two points on the line.
Write an Equation Given Slope and One PointWrite an equation of a line that passes through (1, 5) with slope 2.
Step 1 The line has slope 2. To find the y-intercept, replace m with 2 and (x, y)with (1, 5) in the slope-intercept form. Then, solve for b.
y � mx � b Slope-intercept form
5 � 2(1) � b Replace m with 2, y with 5, and x with 1.
5 � 2 � b Multiply.
5 � 2 � 2 � b � 2 Subtract 2 from each side.
3 � b Simplify.
Step 2 Write the slope-intercept form using m � 2 and b � 3.
y � mx � b Slope-intercept form
y � 2x � 3 Replace m with 2 and b with 3.
Therefore, the equation is y � 2x � 3.
Example 1Example 1
x y(year) (population)
� �
1994 173,000
1995 175,000
1996 177,000
� �
Population of Orlando, Florida
Year
0 x
y
Pop
ula
tio
n(t
ho
usa
nd
s)
172
173
174
175
176
177
(1995, 175,000)
’95’93 ’97 ’99
can slope-intercept form be used to make predictions?can slope-intercept form be used to make predictions?
LessonNotes
1 Focus1 Focus
Chapter 5 Resource Masters• Study Guide and Intervention, pp. 299–300• Skills Practice, p. 301• Practice, p. 302• Reading to Learn Mathematics, p. 303• Enrichment, p. 304• Assessment, pp. 337, 339
Parent and Student Study GuideWorkbook, p. 41
School-to-Career Masters, p. 10
5-Minute Check Transparency 5-4Answer Key Transparencies
TechnologyAlgePASS: Tutorial Plus, Lesson 11Interactive Chalkboard
Workbook and Reproducible Masters
Resource ManagerResource Manager
Transparencies

The table of ordered pairs shows the coordinates of the two points on the graph of a function. Which equation describes the function?
y � ��13
�x � 2 y � 3x � 2
y � ��13
�x � 2 y � �13
�x � 2DC
BA
Lesson 5-4 Writing Equations in Slope-Intercept Form 281
Read the Test Item
The table represents the ordered pairs (�3, �1) and (6, �4).
Solve the Test Item
Step 1 Find the slope of the line containing the points. Let (x1, y1) � (�3,�1) and(x2, y2) � (6, �4).
m � �yx
2
2
�
�
yx
1
1� Slope formula
m � ��64��
(�(�
31))
� x1 � �3, x2 � 6, y1 � �1, y2 � �4
m � ��93� or ��
13
� Simplify.
Step 2 You know the slope and two points. Choose one point and find the y-intercept. In this case, we chose (6, �4).
y � mx � b Slope-intercept form
�4 � ��13
�(6) � b Replace m with ��13
�, x with 6, and y with �4.
�4 � �2 � b Multiply.
�4 � 2 � �2 � b � 2 Add 2 to each side.
�2 � b Simplify.
Step 3 Write the slope-intercept form using m � ��13
� and b � �2.
y � mx � b Slope-intercept form
y � ��13
�x � 2 Replace m with ��13
� and b with �2.
Therefore, the equation is y � ��13
�x � 2. The answer is A.
StandardizedTest Practice
Test-Taking TipYou can check your resultby graphing. The lineshould pass through (�3, �1) and (6, �4).
Write an Equation Given Two PointsMultiple-Choice Test Item
Example 2Example 2
x y
�3 �1
6 �4
CHECK You can check your result by graphing y � 2x � 3 on a graphing calculator. Use the CALC menu to verify that it passes through (1, 5).
[�10, 10] scl: 1 by [�10, 10] scl: 1
WRITE AN EQUATION GIVEN TWO POINTS Sometimes you do notknow the slope of a line, but you know two points on the line. In this case, find the slope of the line. Then follow the steps in Example 1.
www.algebra1.com/extra_examples
Lesson 5-4 Writing Equations in Slope-Intercept Form 281
2 Teach2 Teach
11
In-Class ExampleIn-Class Example
22
In-Class ExampleIn-Class Example
WRITE AN EQUATIONGIVEN THE SLOPE ANDONE POINT
Teaching Tip Remind studentsthat the x and y in an equationrepresent any pairs of x and y values that satisfy the equation.The coordinates of the givenpoint are one pair of thesevalues.
Write an equation of a linethat passes through (2, �3)
with slope . y � x � 4
WRITE AN EQUATIONGIVEN TWO POINTS
Teaching Tip Point out thatstudents can check their solu-tion by substituting the givencoordinates into their equation.
The table of ordered pairsshows the coordinates of twopoints on the graph of afunction. Which equationdescribes the function? D
A 5y � 12x � 16B y � 4x � 16C y � �4x � 16D y � �4x � 16
x y
�3 �4�2 �8
1�2
1�2
Example 2 Point out to students that there are several waysto approach this question. While the example shows how tofind the actual equation, students can save time by examining the choices once they have found the slope, ��
13
�. Onlychoices A and C have equations with the correct slope.
PowerPoint®
PowerPoint®
StandardizedTest Practice
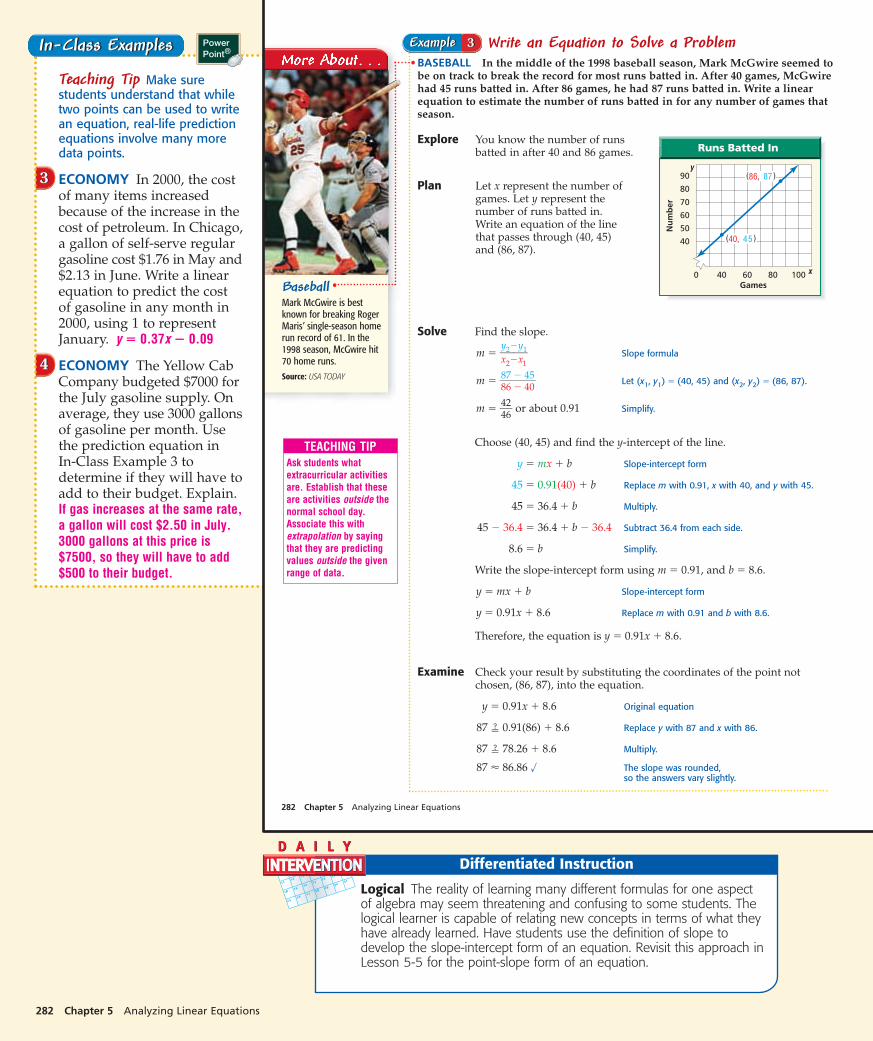
33
44
In-Class ExamplesIn-Class Examples
Teaching Tip Make surestudents understand that whiletwo points can be used to writean equation, real-life predictionequations involve many moredata points.
ECONOMY In 2000, the costof many items increasedbecause of the increase in thecost of petroleum. In Chicago,a gallon of self-serve regulargasoline cost $1.76 in May and$2.13 in June. Write a linearequation to predict the costof gasoline in any month in2000, using 1 to representJanuary. y � 0.37x � 0.09
ECONOMY The Yellow CabCompany budgeted $7000 forthe July gasoline supply. Onaverage, they use 3000 gallonsof gasoline per month. Usethe prediction equation in In-Class Example 3 todetermine if they will have toadd to their budget. Explain.If gas increases at the same rate,a gallon will cost $2.50 in July.3000 gallons at this price is$7500, so they will have to add$500 to their budget.
282 Chapter 5 Analyzing Linear Equations
Write an Equation to Solve a ProblemBASEBALL In the middle of the 1998 baseball season, Mark McGwire seemed tobe on track to break the record for most runs batted in. After 40 games, McGwirehad 45 runs batted in. After 86 games, he had 87 runs batted in. Write a linearequation to estimate the number of runs batted in for any number of games thatseason.
Explore You know the number of runs batted in after 40 and 86 games.
Plan Let x represent the number ofgames. Let y represent thenumber of runs batted in. Write an equation of the linethat passes through (40, 45) and (86, 87).
Solve Find the slope.
m � �yx
2
2
�
�
yx
1
1� Slope formula
m � �8876
��
4450
� Let (x1, y1) � (40, 45) and (x2, y2) � (86, 87).
m � �4426� or about 0.91 Simplify.
Choose (40, 45) and find the y-intercept of the line.
y � mx � b Slope-intercept form
45 � 0.91(40) � b Replace m with 0.91, x with 40, and y with 45.
45 � 36.4 � b Multiply.
45 � 36.4 � 36.4 � b � 36.4 Subtract 36.4 from each side.
8.6 � b Simplify.
Write the slope-intercept form using m � 0.91, and b � 8.6.
y � mx � b Slope-intercept form
y � 0.91x � 8.6 Replace m with 0.91 and b with 8.6.
Therefore, the equation is y � 0.91x � 8.6.
Examine Check your result by substituting the coordinates of the point notchosen, (86, 87), into the equation.
y � 0.91x � 8.6 Original equation
87 � 0.91(86) � 8.6 Replace y with 87 and x with 86.
87 � 78.26 � 8.6 Multiply.
87 � 86.86 � The slope was rounded, so the answers vary slightly.
Runs Batted In
40 60Games
800 x
y
Nu
mb
er
40
50
60
70
80
90
100
(86, 87)
(40, 45)
Example 3Example 3
TEACHING TIPAsk students whatextracurricular activitiesare. Establish that theseare activities outside thenormal school day.Associate this withextrapolation by sayingthat they are predictingvalues outside the givenrange of data.
BaseballMark McGwire is bestknown for breaking RogerMaris’ single-season homerun record of 61. In the1998 season, McGwire hit70 home runs.Source: USA TODAY
282 Chapter 5 Analyzing Linear Equations
Logical The reality of learning many different formulas for one aspectof algebra may seem threatening and confusing to some students. Thelogical learner is capable of relating new concepts in terms of what theyhave already learned. Have students use the definition of slope todevelop the slope-intercept form of an equation. Revisit this approach inLesson 5-5 for the point-slope form of an equation.
Differentiated Instruction
PowerPoint®

Lesson 5-4 Writing Equations in Slope-Intercept Form 283
Given the Slope and One Point
Step 1 Substitute the values of m, x,and y into the slope-interceptform and solve for b.
Step 2 Write the slope-intercept formusing the values of m and b.
Given Two Points
Step 1 Find the slope.
Step 2 Choose one of the two pointsto use.
Step 3 Then, follow the steps forwriting an equation given theslope and one point.
Writing Equations
Concept Check1, 3. See margin.
Guided Practice
When you use a linear equation to predict values that are beyond the range of thedata, you are using .linear extrapolation
StandardizedTest Practice
Example 4Example 4
GUIDED PRACTICE KEYExercises Examples
4–6 17–10 2
Linear ExtrapolationSPORTS The record for most runs batted in during a single season is 190. Use the equation in Example 3 to decide whether a baseball fan following the1998 season would have expected McGwire to break the record in the 162 gamesplayed that year.
y � 0.91x � 8.6 Original equation
y � 0.91(162) � 8.6 Replace x with 162.
y � 156 Simplify.
Since the record is 190 runs batted in, a fan would have predicted that MarkMcGwire would not break the record.
Be cautious when making a prediction using just two given points. The modelmay be approximately correct, but still give inaccurate predictions. For example, in1998, Mark McGwire had 147 runs batted in, which was nine less than the prediction.
1. Compare and contrast the process used to write an equation given the slopeand one point with the process used for two points.
2. OPEN ENDED Write an equation in slope-intercept form of a line that has a y-intercept of 3. Sample answer: y � 2x � 3
3. Tell whether the statement is sometimes, always, or never true. Explain.You can write the equation of a line given its x- and y-intercepts.
Write an equation of the line that passes through each point with the given slope.
4. (4, �2), m � 2 5. (3, 7), m � �3 6. (�3, 5), m � �1y � 2x � 10 y � �3x � 16 y � �x � 2
Write an equation of the line that passes through each pair of points.
7. (5, 1), (8, �2) 8. (6, 0), (0, 4) 9. (5, 2), (�7, �4)y � �x � 6
10. The table of ordered pairs shows the coordinates of the two points on the graph of a function. Which equation describes the function? A
y � x � 7 y � x � 7y � �5x � 2 y � 5x � 2DC
BA
x y
�5 2
0 7
y � �12
�x � �12
�y � ��23
�x � 4
Lesson 5-4 Writing Equations in Slope-Intercept Form 283
3 Practice/Apply3 Practice/Apply
Study NotebookStudy NotebookHave students—• add the definitions/examples of
the vocabulary terms to theirVocabulary Builder worksheets forChapter 5.
• include the answer to Exercise 1as a summary of the concepts inthis lesson.
• include any other item(s) that theyfind helpful in mastering the skillsin this lesson.
About the Exercises…Organization by Objective• Write an Equation Given the
Slope and One Point: 11–18• Write an Equation Given
Two Points: 19–34, 36, 38, 41
Odd/Even AssignmentsExercises 11–33 are structuredso that students practice thesame concepts whether theyare assigned odd or evenproblems.
Assignment GuideBasic: 11–27 odd, 38, 39, 44–62Average: 11–33 odd, 34–39,44–62Advanced: 12–32 even, 38–56(optional: 57–62)
Answers
1. When you have the slope and onepoint, you can substitute thesevalues in for x, y, and m to find b.When you are given two points,you must first find the slope andthen use the first procedure.
3. Sometimes; if the x- and y-intercepts are both zero, youcannot write the equation of thegraph.

Study Guide and Intervention
Writing Equations in Slope-Intercept Form
NAME ______________________________________________ DATE ____________ PERIOD _____
5-45-4
Less
on
5-4
Write an Equation Given the Slope and One Point
Write an equation ofa line that passes through (�4, 2)with slope 3.
The line has slope 3. To find the y-intercept, replace m with 3 and (x, y)with (�4, 2) in the slope-intercept form.Then solve for b.
y � mx � b Slope-intercept form
2 � 3(�4) � b m � 3, y � 2, and x � �4
2 � �12 � b Multiply.
14 � b Add 12 to each side.
Therefore, the equation is y � 3x � 14.
Write an equation of the linethat passes through (�2, �1) with slope .
The line has slope . Replace m with and (x, y)
with (�2, �1) in the slope-intercept form.
y � mx � b Slope-intercept form
�1 � (�2) � b m � , y � �1, and x � �2
�1 � � � b Multiply.
� � b Add to each side.
Therefore, the equation is y � x � .1�2
1�4
1�2
1�2
1�2
1�4
1�4
1�4
1�4
1�4
Example 1Example 1 Example 2Example 2
ExercisesExercises
Write an equation of the line that passes through each point with the given slope.
1. 2. 3.
y � 2x � 1 y � �2x y � x � 3
4. (8, 2), m � � 5. (�1, �3), m � 5 6. (4, �5), m � �
y � � x � 8 y � 5x � 2 y � � x � 3
7. (�5, 4), m � 0 8. (2, 2), m � 9. (1, �4), m � �6
y � 4 y � x � 1 y � �6x � 2
10. Write an equation of a line that passes through the y-intercept �3 with slope 2.y � 2x � 3
11. Write an equation of a line that passes through the x-intercept 4 with slope �3.y � �3x � 12
12. Write an equation of a line that passes through the point (0, 350) with slope .
y � x � 3501�5
1�5
1�2
1�2
1�2
3�4
1�2
3�4
1�2
(2, 4)
x
y
O
m � 12
(0, 0)x
y
O
m � –2
(3, 5)
x
y
O
m � 2
Study Guide and Intervention, p. 299 (shown) and p. 300
Write an equation of the line that passes through each point with the given slope.
1. 2. 3.
y � 3x � 1 y � �2x � 2 y � �x � 4
4. (�5, 4), m � �3 5. (4, 3), m � 6. (1, �5), m � �
y � �3x � 11 y � x � 1 y � � x �
Write an equation of the line that passes through each pair of points.
7. 8. 9.
y � x � 6 y � �x � 5 y � �2x � 5
10. (0, �4), (5, �4) 11. (�4, �2), (4, 0) 12. (�2, �3), (4, 5)
y � �4 y � x � 1 y � x �
13. (0, 1), (5, 3) 14. (�3, 0), (1, �6) 15. (1, 0), (5, �1)
y � x � 1 y � � x � y � � x �
Write an equation of the line that has each pair of intercepts.
16. x-intercept: 2, y-intercept: �5 17. x-intercept: 2, y-intercept: 10
y � x � 5 y � �5x � 10
18. x-intercept: �2, y-intercept: 1 19. x-intercept: �4, y-intercept: �3
y � x � 1 y � � x � 3
20. DANCE LESSONS The cost for 7 dance lessons is $82. The cost for 11 lessons is $122.Write a linear equation to find the total cost C for � lessons. Then use the equation tofind the cost of 4 lessons. C � 10� � 12; $52
21. WEATHER It is 76°F at the 6000-foot level of a mountain, and 49°F at the 12,000-footlevel of the mountain. Write a linear equation to find the temperature T at an elevatione on the mountain, where e is in thousands of feet. T � �4.5e � 103
3�4
1�2
5�2
1�4
1�4
9�2
3�2
2�5
1�3
4�3
1�4
(–3, 1)
(–1, –3)
x
y
O(0, 5)
(4, 1)x
y
O
(4, –2)
(2, –4)
xy
O
7�2
3�2
1�2
3�2
1�2
(–1, –3)
x
y
O
m � –1
(–2, 2)
x
y
O
m � –2
(1, 2)
x
y
Om � 3
Practice (Average)
Writing Equations in Slope-Intercept Form
NAME ______________________________________________ DATE ____________ PERIOD _____
5-45-4Skills Practice, p. 301 and Practice, p. 302 (shown)
Reading to Learn Mathematics
Writing Equations in Slope-Intercept Form
NAME ______________________________________________ DATE ____________ PERIOD _____
5-45-4
Pre-Activity How can slope-intercept form be used to make predictions?
Read the introduction to Lesson 5-4 at the top of page 284 in your textbook.
• What is the rate of change per year? about 2000 per year• Study the pattern on the graph. How would you find the population in
1997? Add 2000 to the 1996 population, which gives 179,000.
Reading the Lesson
1. Suppose you are given that a line goes through (2, 5) and has a slope of �2. Use thisinformation to complete the following equation.
y � mx � b↓ ↓� � �
2. What must you first do if you are not given the slope in the problem?
Use the information given (two points) to find the slope.
3. What is the first step in answering any standardized test practice question?
Read the problem.
4. What are four steps you can use in solving a word problem?
Explore, Plan, Solve, Examine
5. Define the term linear extrapolation.
Linear extrapolation means using a linear equation to predict values thatare outside the two given data points.
Helping You Remember
6. In your own words, explain how you would answer a question that asks you to write the slope-intercept form of an equation. Sample answer: Determine whatinformation you are given. If you have a point and the slope, you cansubstitute the x- and y-values and the slope into y � mx � b to find thevalue of b. Then use the values of m and b to write the equation. If youhave two points, use them to find the slope, and then use the method fora point and the slope.
b2�25
Reading to Learn Mathematics, p. 303
Celsius and Kelvin TemperaturesIf you blow up a balloon and put it in the refrigerator, the balloon will shrink as the temperature of the air in the balloon decreases.
The volume of a certain gas is measured at 30° Celsius. The temperature is decreased and the volume is measured again.
1. Graph this table on the coordinate plane provided below.
V(mL)
200
Temperature (t ) Volume (V )
30°C 202 mL21°C 196 mL0°C 182 mL
212°C 174 mL227°C 164 mL
Enrichment
NAME ______________________________________________ DATE ____________ PERIOD _____
5-45-4Enrichment, p. 304
Write an equation of the line that passes through each point with the given slope.
11. y � 3x � 1 12. y � �x � 3
13. (5, �2), m � 3 14. (5, 4), m � �5 15. (3, 0), m � �2
16. (5, 3), m � �12
� 17. (�3, �1), m � ��23
� 18. (�3, �5), m � ��53
�
Write an equation of the line that passes through each pair of points.
19. y � x � 3 20. y � �x � 2
21. (4, 2), (�2, �4) 22. (3, �2), (6, 4) 23. (�1, 3), (2, �3)
24. (2, �2), (3, 2) 25. (7, �2), (�4, �2) 26. (0, 5), (�3, 5)
27. (1, 1), (7, 4) 28. (5, 7), (0, 6) 29. ���54
�, 1�, ���14
�, �34
��y � �1
2�x � �1
2� y � �1
5�x � 6 y � ��1
4�x � �1
116�
Write an equation of the line that has each pair of intercepts.
30. x-intercept: �3, y-intercept: 5 31. x-intercept: 3, y-intercept: 4
32. x-intercept: 6, y-intercept: 3 33. x-intercept: 2, y-intercept: �2
MARRIAGE AGE For Exercises34–37, use the information in thegraphic.
34. Write a linear equation topredict the median age thatmen marry M for any year t.
35. Use the equation to predict themedian age of men who marryfor the first time in 2005.
36. Write a linear equation topredict the median age thatwomen marry W for any year t.
37. Use the equation to predict themedian age of women whomarry for the first time in 2005.about 26.05 yr
�
�
O
y
x(2, 0)
(0, 2)
y
xO
(4, 1)
(5, 2)
y
xO
m � �1
(4, �1)
(1, 2)
m � 3
y
xO
284 Chapter 5 Analyzing Linear Equations
Practice and ApplyPractice and Apply
indicates increased difficulty�
13. y � 3x � 1714. y � �5x � 29 15. y � �2x � 6
16. y � �12
�x � �12
�
17. y � ��23
�x � 3
18. y � ��53
�x � 10
21. y � x � 222. y � 2x � 823. y � �2x � 124. y � 4x � 1025. y � �226. y � 5
30. y � �53
�x � 5
31. y � ��43
�x � 4
32. y � ��12
�x � 3
33. y � x � 2
34. M � �18
�t � 223.05
35. about 27.6 yr
36. about W � �
230�t � 274.7
Homework HelpFor See
Exercises Examples11–18 119–29 234–39 3, 4
Extra PracticeSee page 832.
�
�
�
Men26.7 Women
25Men23.2 Women
20.8
Waiting on weddingsCouples are marrying later. The median age of menand women who tied the knot for the first time in1970 and 1998:
USA TODAY Snapshots®
By Hilary Wasson and Sam Ward, USA TODAY
Source: Census Bureau, March 2000
19701998
284 Chapter 5 Analyzing Linear Equations
ELL
Answer
45. Answers should include the following.• Linear extrapolation is when you use a
linear equation to predict values that areoutside of the given points on the graph.
• You can use the slope-intercept form ofthe equation to find the y-value for anyrequested x-value.
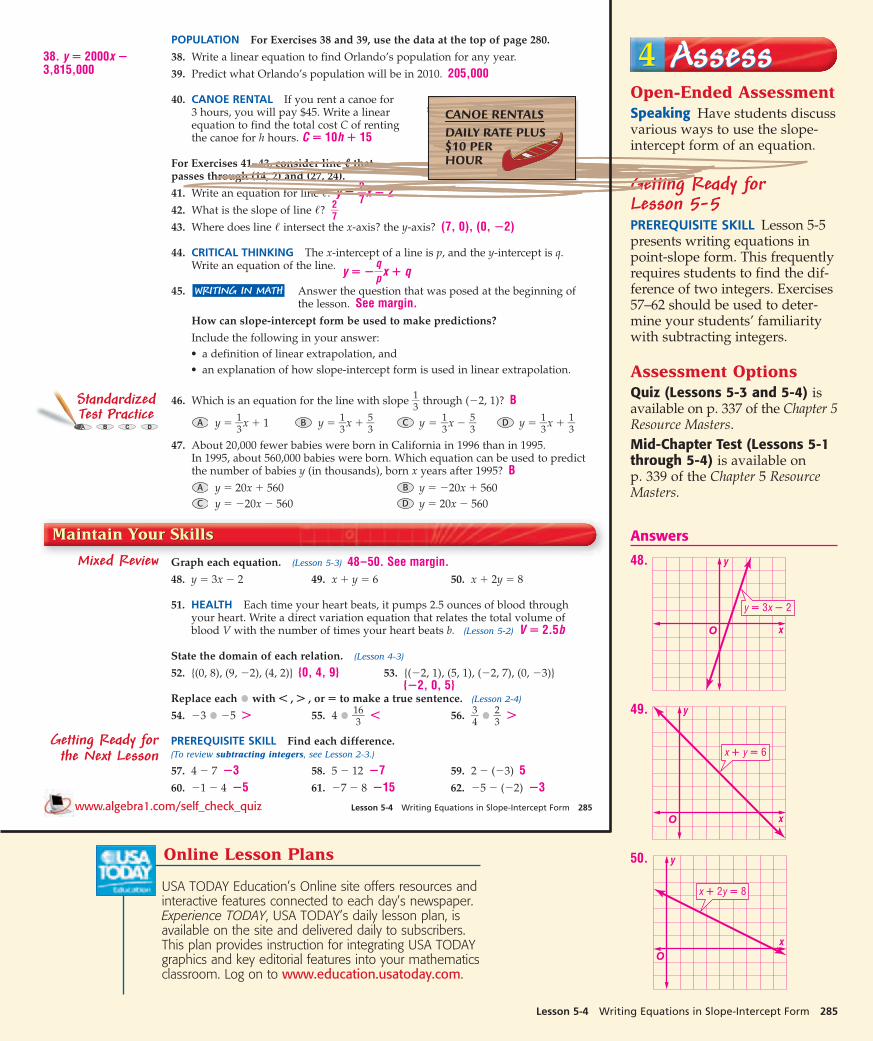
Open-Ended Assessment
Speaking Have students discussvarious ways to use the slope-intercept form of an equation.
Getting Ready for Lesson 5-5PREREQUISITE SKILL Lesson 5-5presents writing equations inpoint-slope form. This frequentlyrequires students to find the dif-ference of two integers. Exercises57–62 should be used to deter-mine your students’ familiaritywith subtracting integers.
Assessment Options
Quiz (Lessons 5-3 and 5-4) isavailable on p. 337 of the Chapter 5Resource Masters.Mid-Chapter Test (Lessons 5-1through 5-4) is available on p. 339 of the Chapter 5 ResourceMasters.
Answers
48.
49.
50. y
xO
x � 2y � 8
y
xO
x � y � 6
y
xO
y � 3x � 2
Lesson 5-4 Writing Equations in Slope-Intercept Form 285www.algebra1.com/self_check_quiz
StandardizedTest Practice
Maintain Your SkillsMaintain Your Skills
POPULATION For Exercises 38 and 39, use the data at the top of page 280.
38. Write a linear equation to find Orlando’s population for any year.
39. Predict what Orlando’s population will be in 2010. 205,000
40. CANOE RENTAL If you rent a canoe for 3 hours, you will pay $45. Write a linearequation to find the total cost C of rentingthe canoe for h hours. C � 10h � 15
For Exercises 41–43, consider line � thatpasses through (14, 2) and (27, 24).
41. Write an equation for line �. y � �27
�x � 242. What is the slope of line �? �
27
�
43. Where does line � intersect the x-axis? the y-axis? (7, 0), (0, �2)
44. CRITICAL THINKING The x-intercept of a line is p, and the y-intercept is q.Write an equation of the line.
45. Answer the question that was posed at the beginning ofthe lesson. See margin.
How can slope-intercept form be used to make predictions?
Include the following in your answer:• a definition of linear extrapolation, and• an explanation of how slope-intercept form is used in linear extrapolation.
46. Which is an equation for the line with slope �13
� through (�2, 1)? B
y � �13
�x � 1 y � �13
�x � �53
� y � �13
�x � �53
� y � �13
�x � �13
�
47. About 20,000 fewer babies were born in California in 1996 than in 1995. In 1995, about 560,000 babies were born. Which equation can be used to predictthe number of babies y (in thousands), born x years after 1995? B
y � 20x � 560 y � �20x � 560y � �20x � 560 y � 20x � 560DC
BA
DCBA
WRITING IN MATH
y � ��qp
�x � q
Mixed Review
Getting Ready forthe Next Lesson
Graph each equation. (Lesson 5-3) 48–50. See margin.48. y � 3x � 2 49. x � y � 6 50. x � 2y � 8
51. HEALTH Each time your heart beats, it pumps 2.5 ounces of blood throughyour heart. Write a direct variation equation that relates the total volume ofblood V with the number of times your heart beats b. (Lesson 5-2) V � 2.5b
State the domain of each relation. (Lesson 4-3)
52. {(0, 8), (9, �2), (4, 2)} {0, 4, 9} 53. {(�2, 1), (5, 1), (�2, 7), (0, �3)}{�2, 0, 5}
Replace each with � , � , or � to make a true sentence. (Lesson 2-4)
54. �3 �5 � 55. 4 �136� � 56. �
34
� �23
� �
PREREQUISITE SKILL Find each difference.(To review subtracting integers, see Lesson 2-3.)
57. 4 � 7 �3 58. 5 � 12 �7 59. 2 � (�3) 560. �1 � 4 �5 61. �7 � 8 �15 62. �5 � (�2) �3
38. y � 2000x �3,815,000
Lesson 5-4 Writing Equations in Slope-Intercept Form 285
4 Assess4 Assess
Online Lesson Plans
USA TODAY Education’s Online site offers resources andinteractive features connected to each day’s newspaper.Experience TODAY, USA TODAY’s daily lesson plan, isavailable on the site and delivered daily to subscribers.This plan provides instruction for integrating USA TODAYgraphics and key editorial features into your mathematicsclassroom. Log on to www.education.usatoday.com.

5-Minute CheckTransparency 5-5 Use as a
quiz or review of Lesson 5-4.
Mathematical Background notesare available for this lesson on p. 254D.
can you use the slopeformula to write an
equation of a line?Ask students:• How does the final form of the
equation relate to the givenslope and point? Sample answer:Each coordinate and the slopeappear as numbers in the equation.
• How would the equationchange if the given point were(4, 6)? y � 6 � 2(x � 4)
• What equation do you get ifyou substitute x1, y1, and m forthe numerical values in thefinal form of the equation?y � y1 � m(x � x1)
Vocabulary• point-slope form
Writing Equations in Point-Slope Form
• Write the equation of a line in point-slope form.
• Write linear equations in different forms.
Point-Slope FormRemember, (x1, y1)represents the given point,and (x, y) represents anyother point on the line.
Study Tip
Point-Slope Form• Words The linear equation
y � y1 � m(x � x1) is writtenin point-slope form, where(x1, y1) is a given point ona nonvertical line and m isthe slope of the line.
• Symbols y � y1 � m(x � x1)
• Model
(x1, y1)
y
xO
(x , y )
Write an Equation Given Slope and a PointWrite the point-slope form of an equation for a line that passes through (�1, 5) with slope �3.
y � y1 � m(x � x1) Point-slope form
y � 5 � �3[x � (�1)] (x1, y1) � (�1, 5)
y � 5 � �3(x � 1) Simplify.
Therefore, the equation is y � 5 � �3(x � 1).
y
xO
(�1, 5)
Example 1Example 1
286 Chapter 5 Analyzing Linear Equations
The graph shows a line with slope 2 that passes through (3, 4). Another point on the line is (x, y).
m � �yx
2
2
�
�
yx
1
1� Slope formula
2 � �yx
�
�
43
�(x2, y2) = (x, y) (x1, y1) = (3, 4)
2(x � 3) � �yx
�
�
43
� (x � 3) Multiply each side by (x – 3).
2(x � 3) � y – 4 Simplify.
y � 4 � 2(x � 3) Symmetric Property of Equality
x-coordinateslope
y-coordinate
y
xO
(x, y)(3, 4)
POINT-SLOPE FORM The equation above was generated using the coordinatesof a known point and the slope of the line. It is written in .point-slope form
←
← ←
←
← ←
given point
can you use the slope formula to write an equation of a line?can you use the slope formula to write an equation of a line?
LessonNotes
1 Focus1 Focus
Chapter 5 Resource Masters• Study Guide and Intervention, pp. 305–306• Skills Practice, p. 307• Practice, p. 308• Reading to Learn Mathematics, p. 309• Enrichment, p. 310
Graphing Calculator and Spreadsheet Masters, p. 31
Parent and Student Study GuideWorkbook, p. 42
5-Minute Check Transparency 5-5Answer Key Transparencies
TechnologyAlgePASS: Tutorial Plus, Lesson 12Interactive Chalkboard
Workbook and Reproducible Masters
Resource ManagerResource Manager
Transparencies

Vertical lines cannot be written in point-slope form because the slope is undefined.However, since the slope of a horizontal line is 0, horizontal lines can be written inpoint-slope form.
Lesson 5-5 Writing Equations in Point-Slope Form 287www.algebra1.com/extra_examples
Form Equation Description
Slope-Intercept y � mx � b m is the slope, and b is the y-intercept.
Point-Slope y � y1 � m(x � x1) m is the slope and (x1, y1) is a given point.
Standard Ax � By � C A and B are not both zero. Usually A isnonnegative and A, B, and C are integerswhose greatest common factor is 1.
Forms of Linear Equations
Look BackTo review standard form,see Lesson 4-5.
Study Tip
Write an Equation of a Horizontal LineWrite the point-slope form of an equation for a horizontal line that passes through (6, �2).
y � y1 � m(x � x1) Point-slope form
y � (�2) � 0(x � 6) (x1, y1) � (6, �2)
y � 2 � 0 Simplify.
Therefore, the equation is y � 2 � 0.
y
xO
(6, �2)
Example 2Example 2
Write an Equation in Standard FormWrite y � 5 � ��
54
�(x � 2) in standard form.
In standard form, the variables are on the left side of the equation. A, B, and C areall integers.
y � 5 � ��54
�(x � 2) Original equation
4(y � 5) � 4���54
��(x � 2) Multiply each side by 4 to eliminate the fraction.
4y � 20 � �5(x � 2) Distributive Property
4y � 20 � �5x � 10 Distributive Property
4y � 20 � 20 � �5x � 10 � 20 Subtract 20 from each side.
4y � �5x � 10 Simplify.
4y � 5x � �5x � 10 � 5x Add 5x to each side.
5x � 4y � �10 Simplify.
The standard form of the equation is 5x � 4y � �10.
Example 3Example 3
FORMS OF LINEAR EQUATIONS You have learned about three of the mostcommon forms of linear equations.
Linear equations in point-slope form can be written in slope-intercept or standard form.
Lesson 5-5 Writing Equations in Point-Slope Form 287
2 Teach2 Teach
11
22
In-Class ExamplesIn-Class Examples
33
In-Class ExampleIn-Class Example
POINT-SLOPE FORM
Write the point-slope form ofan equation for a line thatpasses through (�2, 0) with
slope � . y � � (x � 2)
Teaching Tip Students maylook at the graph and the pointgiven and say the equation is y � �2. Remind them thatwhile this is an equation of theline, it is not an equation inpoint-slope form.
Write the point-slope form ofan equation for a horizontalline that passes through (0, 5).y � 5 � 0
FORMS OF LINEAREQUATIONS
Teaching Tip Emphasize thatin standard form, A, B, and Care all integers. This example isan exercise in algebraicmanipulation.
Write y � x � 5 in standard
form. 3x � 4y � 20
3�4
3�2
3�2
PowerPoint®
PowerPoint®
ClassroomManagementIf point-slopeform is notrequired by
your district or state guide-lines, this lesson may beconsidered optional. Studentshave already learned to writean equation given the slopeand a point. However, thepoint-slope form is goodexperience for writingequations in a form that willbe used in later chapters todescribe transformations onthe coordinate plane.
New

44
55
In-Class ExamplesIn-Class Examples
Teaching Tip Another way forstudents to write this equation inslope-intercept form is to identifythe slope m and a point on theline from the equation. Use thatinformation to find b in theslope-intercept form.
Write y � 5 � (x � 3) in
slope-intercept form.
y � x � 1
GEOMETRY The figure showstrapezoid ABCD, with bases A�B� and C�D�.
a. Write the point-slope form ofthe lines containing the basesof the trapezoid.A�B�: y � 3 � 0, C�D�: y � 2 � 0
b. Write each equation instandard form. y � 3, y � �2
A(–2, 3)B(4, 3)
C(6, –2)D(1, –2)
x
y
O
4�3
4�3
Write an Equation in Slope-Intercept FormWrite y � 2 � �
12
� (x � 5) in slope-intercept form.
In slope-intercept form, y is on the left side of the equation. The constant and x areon the right side.
y � 2 � �12
�(x � 5) Original equation
y � 2 � �12
�x � �52
� Distributive Property
y � 2 � 2 � �12
�x � �52
� � 2 Add 2 to each side.
y � �12
�x � �92
� 2 � �42
� and �42
� � �52
� � �92
�
The slope-intercept form of the equation is y � �12
�x � �92
�.
288 Chapter 5 Analyzing Linear Equations
GeometryThe hypotenuse is the sideof a right triangle oppositethe right angle.
Study Tip
Example 4Example 4
Write an Equation in Point-Slope FormGEOMETRY The figure shows right triangle ABC.
a. Write the point-slope form of the line containing thehypotenuse A�B�.
Step 1 First, find the slope of A�B�.
m � �yx
2
2
�
�
yx
1
1� Slope formula
� �46
��
12
� or �34
� (x1, y1) � (2, 1), (x2, y2) � (6, 4)
Step 2 You can use either point for (x1, y1) in the point-slope form.
Method 1 Use (6, 4). Method 2 Use (2, 1).
y � y1 � m(x � x1) y � y1 � m(x � x1)
y � 4 � �34
�(x � 6) y � 1 � �34
�(x � 2)
b. Write each equation in standard form.
y � 4 � �34
�(x � 6) Original equation y � 1 � �34
�(x � 2)
4(y � 4) � 4��34
��(x � 6) Multiply each side by 4. 4(y � 1) � 4��34
��(x � 2)
4y � 16 � 3(x � 6) Multiply. 4y � 4 � 3(x � 2)
4y � 16 � 3x � 18 Distributive Property 4y � 4 � 3x � 6
4y � 3x � 2 Add to each side. 4y � 3x � 2
�3x � 4y � �2 Subtract 3x from each side. �3x � 4y � �2
3x � 4y � 2 Multiply each side by –1. 3x � 4y � 2
Regardless of which point was used to find the point-slope form, the standardform results in the same equation.
y
xO
(6, 1)
(6, 4)
(2, 1)
B
CA
Example 5Example 5
You can draw geometric figures on a coordinate plane and use the point-slopeform to write equations of the lines.
288 Chapter 5 Analyzing Linear Equations
Verbal/Linguistic Give students several exercises that ask them towrite a particular type of equation. Have them describe or write howthey would solve each type of problem. Then have them summarize thetechnique they think works best for each given situation (point andslope, two points, rewriting equations in various forms).
Differentiated Instruction ELL
PowerPoint®

Lesson 5-5 Writing Equations in Point-Slope Form 289
1. Explain what x1 and y1 in the point-slope form of an equation represent.
2. FIND THE ERROR Tanya and Akira wrote the point-slope form of an equationfor a line that passes through (�2, �6) and (1, 6). Tanya says that Akira’sequation is wrong. Akira says they are both correct.
Who is correct? Explain your reasoning.
3. OPEN ENDED Write an equation in point-slope form. Then write an equationfor the same line in slope-intercept form. Sample answer: y � 2 � 4(x � 1);y � 4x � 6
Write the point-slope form of an equation for a line that passes through eachpoint with the given slope.
4. 5. 6.
Write each equation in standard form.
7. y � 5 � 4(x � 2) 8. y � 3 � ��34
�(x � 1) 9. y � 3 � 2.5(x � 1)4x � y � �13 3x � 4y � �9 2.5x � y � �5.5
Write each equation in slope-intercept form.
10. y � 6 � 2(x � 2) 11. y � 3 � ��23
�(x � 6) 12. y � �72
� � �12
�(x � 4)
y � 2x � 10 y � ��23
�x � 1 y � �12
�x � �32
�
GEOMETRY For Exercises 13 and 14, use parallelogram ABCD.A parallelogram has opposite sides parallel.
13. Write the point-slope form of the linecontaining A�D�. y � 3 � 2(x � 1)
14. Write the standard form of the line containing A�D�. 2x � y � �5
y
xO
(�1, 3)
(4, �1)
(6, 3)
(�3, �1)
BA
CD
x
y
O
(2, �2)
m � 0
x
y
O
m � 3
(�1, �2)
x
y
O
m � �2
(1, 3)
Akira
y – 6 = 4(x – 1)
Tanya
y + 6 = 4(x + 2 )
Concept Check
Guided Practice
Application
Homework HelpFor See
Exercises Examples 15–26 127–28 229–40 341–52 4
Extra PracticeSee page 832.
GUIDED PRACTICE KEYExercises Examples
4 – 6 17–9 2
10–12 313, 14 4
Practice and ApplyPractice and Apply
Write the point-slope form of an equation for a line that passes through eachpoint with the given slope. 15–26. See margin.15. (3, 8), m � 2 16. (�4, �3), m � 1 17. (�2, 4), m � �3
18. (�6, 1), m � �4 19. (�3, 6), m � 0 20. (9, 1), m � �23
�
21. (8, �3), m � �34
� 22. (�6, 3), m � ��23
� 23. (1, �3), m � ��58
�
24. (9, �5), m � 0 25. (�4, 8), m � �72
� 26. (1, �4), m � ��83
�
1. They are the coordinates of anypoint on the graph ofthe equation.2. Akira; (�2, �6) and (1, 6) are both on the line, so eithercould be substitutedinto point-slope formto find a correct equation.
y � 3 � �2(x �1) y � 2 � 3(x � 1) y � 2 � 0
www.algebra1.com/self_check_quiz
Lesson 5-5 Writing Equations in Point-Slope Form 289
Answers
3 Practice/Apply3 Practice/Apply
Study NotebookStudy NotebookHave students—• add the definitions/examples of
the vocabulary terms to theirVocabulary Builder worksheets forChapter 5.
• include any other item(s) that theyfind helpful in mastering the skillsin this lesson.
FIND THE ERRORStudents may
assume that one of thetwo examples has to be
incorrect. This is not necessarilythe case, as in Exercise 2.
About the Exercises…Organization by Objective• Point-Slope Form: 15–28• Forms of Linear Equations:
29–54
Odd/Even AssignmentsExercises 15–54 are structuredso that students practice thesame concepts whether theyare assigned odd or evenproblems.
Assignment GuideBasic: 15–53 odd, 55–57,61–67, 72–87Average: 15–53 odd, 58–67,72–87 (optional: 68–71)Advanced: 16–54 even, 58–79(optional: 80–87)
15. y � 8 � 2(x � 3)16. y � 3 � x � 417. y � 4 � �3(x � 2)18. y � 1 � �4(x � 6)19. y � 6 � 0
20. y � 1 � (x � 9)
21. y � 3 � (x � 8)
22. y � 3 � � (x � 6)
23. y � 3 � � (x � 1)
24. y � 5 � 0
25. y � 8 � (x � 4)
26. y � 4 � � (x � 1)8�3
7�2
5�8
2�3
3�4
2�3

Study Guide and Intervention
Writing Equations in Point-Slope Form
NAME ______________________________________________ DATE ____________ PERIOD _____
5-55-5
Less
on
5-5
Point-Slope Form
Point-Slope Formy � y1 � m(x � x1), where (x1, y1) is a given point on a nonvertical line and m is the slope of the line
Write the point-slope formof an equation for a line that passes through (6, 1) and has a slope of � .
y � y1 � m(x � x1) Point-slope form
y � 1 � � (x � 6) m � � ; (x1, y1) � (6, 1)
Therefore, the equation is y � 1� � (x � 6).5�2
5�2
5�2
5�2
Write the point-slopeform of an equation for a horizontalline that passes through (4, �1).
y � y1 � m(x � x1) Point-slope form
y � (�1) � 0(x � 4) m � 0; (x1, y1) � (4, �1)
y � 1 � 0 Simplify.
Therefore, the equation is y � 1 � 0.
Example 1Example 1 Example 2Example 2
ExercisesExercises
Write the point-slope form of an equation for a line that passes through eachpoint with the given slope.
1. 2. 3.
y � 1� x � 4 y � 2 � 0 y � 3 � �2(x � 2)
4. (2, 1), m � 4 5. (�7, 2), m � 6 6. (8, 3), m � 1
y � 1 � 4(x � 2) y � 2 � 6(x � 7) y � 3� x � 8
7. (�6, 7), m � 0 8. (4, 9), m � 9. (�4, �5), m � �
y � 7 � 0 y � 9 � (x � 4) y � 5� � (x � 4)
10. Write the point-slope form of an equation for the horizontal line that passes through (4, �2). y � 2 � 0
11. Write the point-slope form of an equation for the horizontal line that passes through (�5, 6). y � 6 � 0
12. Write the point-slope form of an equation for the horizontal line that passes through (5, 0). y � 0
1�2
3�4
1�2
3�4
(2, –3)
x
y
O
m � –2
(–3, 2)
x
y
O
m � 0(4, 1)
x
y
O
m � 1
Study Guide and Intervention, p. 305 (shown) and p. 306
Write the point-slope form of an equation for a line that passes through eachpoint with the given slope.
1. (2, 2), m � �3 2. (1, �6), m � �1 3. (�3, �4), m � 0y � 2 � �3(x � 2) y � 6 � �(x � 1) y � 4 � 0
4. (1, 3), m � � 5. (�8, 5), m � � 6. (3, �3), m �
y � 3 � � (x � 1) y � 5 � � (x � 8) y � 3 � (x � 3)
Write each equation in standard form.
7. y � 11 � 3(x � 2) 8. y � 10 � �(x � 2) 9. y � 7 � 2(x � 5)3x � y � �5 x � y � 12 2x � y � �3
10. y � 5 � (x � 4) 11. y � 2 � � (x � 1) 12. y � 6 � (x � 3)
3x � 2y � �22 3x � 4y � �11 4x � 3y � �6
13. y � 4 � 1.5(x � 2) 14. y � 3 � �2.4(x � 5) 15. y � 4 � 2.5(x � 3)3x � 2y � 2 12x � 5y � 75 5x � 2y � �23
Write each equation in slope-intercept form.
16. y � 2 � 4(x � 2) 17. y � 1 � �7(x � 1) 18. y � 3 � �5(x � 12)
y � 4x � 6 y � �7x � 8 y � �5x � 57
19. y � 5 � (x � 4) 20. y � � �3�x � � 21. y � � �2�x � �y � x � 11 y � �3x � y � �2x �
CONSTRUCTION For Exercises 22–24, use the following information.A construction company charges $15 per hour for debris removal, plus a one-time fee for theuse of a trash dumpster. The total fee for 9 hours of service is $195.
22. Write the point-slope form of an equation to find the total fee y for any number of hours x.y � 195 � 15(x � 9)
23. Write the equation in slope-intercept form. y � 15x � 60
24. What is the fee for the use of a trash dumpster? $60
MOVING For Exercises 25–27, use the following information.There is a set daily fee for renting a moving truck, plus a charge of $0.50 per mile driven.It costs $64 to rent the truck on a day when it is driven 48 miles.
25. Write the point-slope form of an equation to find the total charge y for any number ofmiles x for a one-day rental. y � 64 � 0.5(x � 48)
26. Write the equation in slope-intercept form. y � 0.5x � 40
27. What is the daily fee? $40
7�6
1�2
3�2
1�4
2�3
1�4
1�4
3�2
4�3
3�4
3�2
1�3
2�5
3�4
1�3
2�5
3�4
Practice (Average)
Writing Equations in Point-Slope Form
NAME ______________________________________________ DATE ____________ PERIOD _____
5-55-5Skills Practice, p. 307 and Practice, p. 308 (shown)
Reading to Learn Mathematics
Writing Equations in Point-Slope Form
NAME ______________________________________________ DATE ____________ PERIOD _____
5-55-5
Pre-Activity How can you use the slope formula to write an equation of a line?
Read the introduction to Lesson 5-5 at the top of page 290 in your textbook.
Note that in the final equation there is a value subtracted from x and from y. What are these values?The value subtracted from x is the x-coordinate of the givenpoint. The value subtracted from y is the y-coordinate of thegiven point.
Reading the Lesson
1. In the formula y � y1 � m(x � x1), what do x1 and y1 represent?
x1 and y1 represent the coordinates of any given point on the graph of the line.
2. Complete the chart below by listing three forms of equations. Then write the formula foreach form. Finally, write three examples of equations in those forms.Sample examples are given.
Form of Equation Formula Example
slope-intercept y � mx � b y � 3x � 2
point-slope y � y1 � m(x � x1) y � 2 � 4(x � 3)
standard Ax � By � C 3x � 5y � 15
3. Refer to Example 5 on page 292 of your textbook. What do you think the hypotenuse of aright triangle is? Sample answers: The hypotenuse is the longest side ofthe right triangle. The hypotenuse is the side opposite the right angle ina right triangle.
Helping You Remember
4. Suppose you could not remember all three formulas listed in the table above. Which ofthe forms would you concentrate on for writing linear equations? Explain why you chosethat form. Sample answer: Point-slope form; the slope-intercept form can be written from the point-slope form. This is so because the y-intercept lets you write the coordinates of the point where the linecrosses the y-axis. You can use that point as the given point in the point-slope formula.
Reading to Learn Mathematics, p. 309
Collinearity You have learned how to find the slope between two points on a line. Doesit matter which two points you use? How does your choice of points affectthe slope-intercept form of the equation of the line?
1. Choose three different pairs of points from the graph at the right. Write the slope-intercept form of the line using each pair.
y � 1x � 1
2. How are the equations related?
They are the same.
3. What conclusion can you draw from your answers to Exercises 1 and 2?
The eq ation of a line is the same no matter which two points
x
y
O
Enrichment
NAME ______________________________________________ DATE ____________ PERIOD _____
5-55-5Enrichment, p. 310
290 Chapter 5 Analyzing Linear Equations
27. Write the point-slope form of an equation for a horizontal line that passesthrough (5, �9). y � 9 � 0
28. A horizontal line passes through (0, 7). Write the point-slope form of itsequation. y � 7
Write each equation in standard form.
29. y � 13 � 4(x – 2) 30. y � 3 � 3(x � 5) 31. y � 5 � �2(x � 6)
32. y � 3 � �5(x � 1) 33. y � 7 � �12
�(x � 2) 34. y � 1 � �56
�(x � 4)
35. y � 2 � ��25
�(x – 8) 36. y � 4 � ��13
�(x – 12) 37. y � 2 � �53
�(x � 6)
38. y � 6 � �32
�(x – 4) 39. y � 6 � 1.3(x � 7) 40. y � 2 � �2.5(x � 1)3x � 2y � 24 13x � 10y � �151 5x � 2y � 9
Write each equation in slope-intercept form.
41. y � 2 � 3(x � 1) 42. y � 5 � 6(x � 1) 43. y � 2 � �2(x � 5)
44. y � 1 � �7(x � 3) 45. y � 3 � �12
�(x � 4) 46. y � 1 � �23
�(x � 9)
47. y � 3 � ��14
�(x � 2) 48. y � 5 � ��25
�(x � 15) 49. y � �12
� � x � �12
�
50. y � �13
� � �2�x � �13
�� 51. y � �14
� � �3�x � �12
�� 52. y � �35
� � �4�x � �12
��y � �2x � �1
3� y � �3x � �7
4� y � �4x � �7
5�
53. Write the point-slope form, slope-intercept form, and standard form of anequation for a line that passes through (5, �3) with slope 10. See margin.
54. Line � passes through (1, �6) with slope �32
�. Write the point-slope form, slope-intercept form, and standard form of an equation for line �. See margin.
BUSINESS For Exercises 55–57, use the following information.A home security company provides security systems for $5 per week, plus aninstallation fee. The total fee for 12 weeks of service is $210.
55. Write the point-slope form of an equation to find the total fee y for any number of weeks x. y � 210 � 5(x � 12)
56. Write the equation in slope-intercept form. y � 5x � 15057. What is the flat fee for installation? $150
MOVIES For Exercises 58–60, use the following information.Between 1990 and 1999, thenumber of movie screens in theUnited States increased by about1500 each year. In 1996, there were29,690 movie screens.
58. Write the point-slope form ofan equation to find the totalnumber of screens y for anyyear x. 58–60. See margin.
59. Write the equation in slope-intercept form.
60. Predict the number of moviescreens in the United States in 2005.
Online Research Data Update What has happened to the number of movie screens since 1999? Visit www.algebra1.com/data_update to learn more.
U.S. Movie Screens
100
Nu
mb
er (
tho
usa
nd
s)
20
30
40
Year1990 1992 1994 1996 1998
(1996, 29,690)
Source: Motion Picture Association of America
y
x
MoviesIn 1907, movie theaterswere called nickelodeons.There were about 5000movie screens, and theaverage movie ticket cost 5 cents.Source: National Association of
Theatre Owners
29. 4x � y � �530. 3x � y � �1231. 2x � y � �732. 5x � y � �833. x � 2y � 1234. 5x � 6y � 1435. 2x � 5y � 2636. x � 3y � 037. 5x � 3y � �2441. y � 3x � 142. y � 6x � 1143. y � �2x � 844. y � �7x � 2245. y � �
12
�x � 1
46. y � �23
�x � 7
47. y � ��14
�x � �72
�
48. y � ��25
�x � 1
49. y � x � 1
290 Chapter 5 Analyzing Linear Equations
ELL

Open-Ended Assessment
Writing Prepare two paper bagscontaining pieces of paper: onewith a value for the slope on eachpiece, one with an ordered pair.Each student can select either aslope and an ordered pair, or twoordered pairs. Have them writethe three forms of linear equationsdiscussed in this lesson.
Getting Ready for Lesson 5-6PREREQUISITE SKILL Lesson 5-6explores the equations of paralleland perpendicular lines. To findthe slopes of perpendicular lines,you must be familiar with thenegative reciprocal of a number.Exercises 80-87 should be used todetermine your students’familiarity with findingmultiplicative inverses, alsoknown as reciprocals.
Answers
65. Answers should include thefollowing.• Write the definition of the slope
using (x, y) as one point and(x1, y1) as the other. Then solvethe equation so that the y s areon one side and the slope andxs are on the other.
68. (�1, 3) and (0, 1) → y � �2x � 1;(0, 1) and (1, �1) → y � �2x � 1;(1, �1) and (2, �3) →y � �2x � 1
69. All of the equations are the same.70. The equation will be y � �2x � 1;
see students’ work.71. Regardless of which two points on
a line you select, the slope-intercept form of the equation willalways be the same.
Maintain Your SkillsMaintain Your Skills
Lesson 5-5 Writing Equations in Point-Slope Form 291
GEOMETRY For Exercises 61–63, use square PQRS.
61. Write a point-slope equation of the line containingeach side.
62. Write the slope-intercept form of each equation.
63. Write the standard form of each equation.
64. CRITICAL THINKING A line contains the points(9, 1) and (5, 5). Write a convincing argument thatthe same line intersects the x-axis at (10, 0).
65. Answer the question that was posed at the beginning of the lesson. See margin.
How can you use the slope formula to write an equation of a line?
Include the following in your answer:
• an explanation of how you can use the slope formula to write the point-slope form.
66. Which equation represents a line that neither passes through (0, 1) nor has a slope of 3? D
�2x � y � 1 y � 1 � 3(x � 6)y � 3 � 3(x � 6) x � 3y � �15
67. OPEN ENDED Write the slope-intercept form of an equation of a line thatpasses through (2, �5). y � mx � 2m � 5
For Exercises 68–71, use the graph at the right.
68. Choose three different pairs of points from thegraph. Write the slope-intercept form of the lineusing each pair.
69. Describe how the equations are related.
70. Choose a different pair of points from the graph andpredict the equation of the line determined by thesepoints. Check your conjecture by finding the equation.
71. MAKE A CONJECTURE What conclusion can you draw from this activity?
Write the slope-intercept form of an equation of the line that satisfies eachcondition. (Lessons 5-3 and 5-4)
72. slope �2 and y-intercept –5 73. passes through (�2, 4) with slope 3
74. passes through (2, �4) and (0, 6) 75. a horizontal line through (1, �1)y � �5x � 6 y � �1
Solve each equation. (Lesson 3-3)
76. 4a � 5 � 15 5 77. 7 � 3c � �11 �6 78. �29
�v � 6 � 14 90
79. Evaluate (25 � 4) � (22 � 13). (Lesson 1-3) 7
PREREQUISITE SKILL Write the multiplicative inverse of each number.(For review of multiplicative inverses, see pages 800 and 801.)
80. 2 �12
� 81. 10 �110� 82. 1 1 83. �1 �1
84. �23
� �32
� 85. ��19
� �9 86. �52
� �25
� 87. ��23
� ��32
�
x
y
O
(2, �3)
(�1, 3)(0, 1)
(1, �1)
DC
BA
WRITING IN MATH
61–64. See pp. 315A–315B.
Extending the Lesson
68–71. See margin.
Mixed Review
72. y � �2x � 573. y � 3x � 10
Getting Ready forthe Next Lesson
StandardizedTest Practice
x
y
O
P
Q
R
S
Lesson 5-5 Writing Equations in Point-Slope Form 291
4 Assess4 Assess
Answers
53. y � 3 � 10(x � 5); y � 10x � 53; 10x � y � 53
54. y � 6 � (x � 1); y � x � ; 3x � 2y � 15
58. y � 29,690 � 1500(x � 1996)59. y � 1500x � 2,964,31060. 43,190
15�2
3�2
3�2
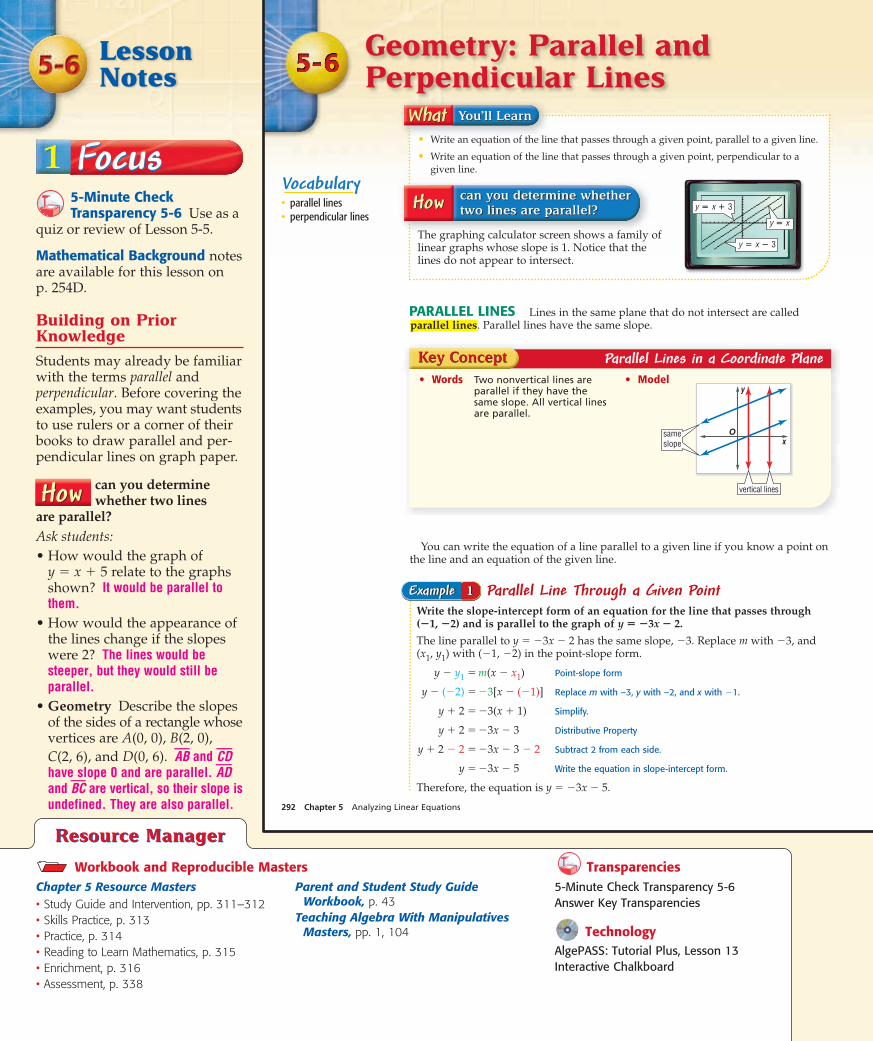
5-Minute CheckTransparency 5-6 Use as a
quiz or review of Lesson 5-5.
Mathematical Background notesare available for this lesson on p. 254D.
Building on PriorKnowledge
Students may already be familiarwith the terms parallel andperpendicular. Before covering theexamples, you may want studentsto use rulers or a corner of theirbooks to draw parallel and per-pendicular lines on graph paper.
can you determinewhether two lines
are parallel?Ask students:• How would the graph of
y � x � 5 relate to the graphsshown? It would be parallel tothem.
• How would the appearance ofthe lines change if the slopeswere 2? The lines would besteeper, but they would still beparallel.
• Geometry Describe the slopesof the sides of a rectangle whosevertices are A(0, 0), B(2, 0), C(2, 6), and D(0, 6). A�B� and C�D�have slope 0 and are parallel. A�D�and B�C� are vertical, so their slope isundefined. They are also parallel.
Vocabulary• parallel lines• perpendicular lines
Geometry: Parallel andPerpendicular Lines
292 Chapter 5 Analyzing Linear Equations
• Write an equation of the line that passes through a given point, parallel to a given line.
• Write an equation of the line that passes through a given point, perpendicular to agiven line.
• Words Two nonvertical lines areparallel if they have thesame slope. All vertical linesare parallel.
• Model
PARALLEL LINES Lines in the same plane that do not intersect are called. Parallel lines have the same slope.parallel lines
You can write the equation of a line parallel to a given line if you know a point onthe line and an equation of the given line.
Example 1Example 1
Parallel Lines in a Coordinate Plane
y
xOsame
slope
vertical lines
Parallel Line Through a Given PointWrite the slope-intercept form of an equation for the line that passes through (�1, �2) and is parallel to the graph of y � �3x � 2.
The line parallel to y � �3x � 2 has the same slope, �3. Replace m with �3, and (x1, y1) with (�1, �2) in the point-slope form.
y � y1 � m(x � x1) Point-slope form
y � (�2) � �3[x � (�1)] Replace m with –3, y with –2, and x with �1.
y � 2 � �3(x � 1) Simplify.
y � 2 � �3x � 3 Distributive Property
y � 2 � 2 � �3x � 3 � 2 Subtract 2 from each side.
y � �3x � 5 Write the equation in slope-intercept form.
Therefore, the equation is y � �3x � 5.
The graphing calculator screen shows a family oflinear graphs whose slope is 1. Notice that thelines do not appear to intersect.
can you determine whether two lines are parallel?can you determine whether two lines are parallel? y � x � 3
y � x
y � x � 3
LessonNotes
1 Focus1 Focus
Chapter 5 Resource Masters• Study Guide and Intervention, pp. 311–312• Skills Practice, p. 313• Practice, p. 314• Reading to Learn Mathematics, p. 315• Enrichment, p. 316• Assessment, p. 338
Parent and Student Study GuideWorkbook, p. 43
Teaching Algebra With ManipulativesMasters, pp. 1, 104
5-Minute Check Transparency 5-6Answer Key Transparencies
TechnologyAlgePASS: Tutorial Plus, Lesson 13Interactive Chalkboard
Workbook and Reproducible Masters
Resource ManagerResource Manager
Transparencies

Perpendicular Lines
Model• A scalene triangle is one in which no two sides are
equal. Cut out a scalene right triangle ABC so that�C is a right angle. Label the vertices and the sides as shown.
• Draw a coordinate plane on grid paper. Place �ABC on the coordinate plane so that A is at theorigin and side b lies along the positive x-axis.
Analyze 1–4. Sample answers are given.1. Name the coordinates of B. (3, 6)2. What is the slope of side c? 23. Rotate the triangle 90° counterclockwise so that A is still at the origin and
side b is along the positive y-axis. Name the coordinates of B. (�6, 3)4. What is the slope of side c? ��
12
�
5. Repeat the activity for two other different scalene triangles.6. For each triangle and its rotation, what is the relationship between the first
position of side c and the second? They are perpendicular.7. For each triangle and its rotation, describe the relationship between the
coordinates of B in the first and second positions.8. Describe the relationship between the slopes of c in each position.
Make a Conjecture9. Describe the relationship between the slopes of any two perpendicular lines.
Bac
Ab
C
y
xO
5. See students’ work.7. The x- and y-coordinates arereversed and the x-coordinate is multiplied by �1.8. They are oppositereciprocals.9. Their product is �1.
• Words Two lines are perpendicularif the product of their slopesis �1. That is, the slopes areopposite reciprocals of eachother. Vertical lines andhorizontal lines are alsoperpendicular.
• Model
PERPENDICULAR LINES Lines that intersect at right angles are called. There is a relationship between the slopes of perpendicular lines.perpendicular lines
Perpendicular Lines in a Coordinate Plane
y
xO
horizontal line vertical line
m � � 12
m � 2
Lesson 5-6 Geometry: Parallel and Perpendicular Lines 293www.algebra1.com/extra_examples
CHECK You can check your result by graphing both equations. The lines appear to beparallel. The graph of y � �3x � 5 passes through (�1, �2).
y
xO
(�1, �2)
y � �3x � 5
y � �3x � 2
Lesson 5-6 Geometry: Parallel and Perpendicular Lines 293
2 Teach2 Teach
11
In-Class ExampleIn-Class ExamplePARALLEL LINES
Teaching Tip Students canalso use their graphingcalculators to check theirequations.
Write the slope-intercept formof an equation for the linethat passes through (4, �2)and is parallel to the graph of
y � x � 7. y � x � 41�2
1�2
Algebra Activity
Materials: grid paper, scissors• To save time, you may want to have students work in groups and provide
them with scalene triangles precut from lightweight cardboard.• The term “negative reciprocal” may not be familiar to your students. Make
sure your students know that the multiplicative inverse is another name forreciprocal.
PowerPoint®

33
44
22
In-Class ExamplesIn-Class Examples
PERPENDICULAR LINES
GEOMETRY The height of atrapezoid is measured on asegment that is perpendicu-lar to a base. In trapezoidARTP, R�T� and A�P� are bases.Can E�Z� be used to measurethe height of the trapezoid?Explain.
No, the slope of R�T� is 1 and theslope of E�Z� is �7. 1 �7 �1.E�Z� is not perpendicular to R�T� soit cannot be used to measureheight.
Teaching Tip Encourage stu-dents to understand the processused, instead of the mechanics.For example, what do they knowfrom the given information? Whatdo they know about perpendic-ular lines? What do they need toknow to write a new equation?
Write the slope-intercept formfor an equation of a line thatpasses through (4, �1) and isperpendicular to the graph of7x � 2y � 3. y � � x �
Write the slope-intercept formfor an equation of a lineperpendicular to the graph of 2y � 5x � 2 that passesthrough (0, 6). y � x � 62
�5
1�7
2�7
x
y
O
R
E
TP
Z
A
KitesIn India, kite festivals markMakar Sankranti, when theSun moves into thenorthern hemisphere.Source: www.cam-india.com
Determine Whether Lines are PerpendicularKITES The outline of a kite is shown on a coordinate plane. Determine whether A�C� isperpendicular to B�D�.
Find the slope of each segment.
Slope of A�C�: m � �55
��
17
� or �2
Slope of B�D�: m � �48
��
00
� or �12
�
The line segments are perpendicular because �12
�(�2) � �1.
y
xO
A (5, 5)B (8, 4)
C (7, 1)D (0, 0)
294 Chapter 5 Analyzing Linear Equations
GraphingCalculatorThe lines will not appearto be perpendicular on agraphing calculator if thescales on the axes are notset correctly. Aftergraphing, press
5 to set
the axes for a correctrepresentation.
ZOOM
Study Tip
Example 2Example 2
You can write the equation of a line perpendicular to a given line if you know apoint on the line and the equation of the given line.
Perpendicular Line Through a Given PointWrite the slope-intercept form for an equation of a line that passes through (�3, �2) and is perpendicular to the graph of x � 4y � 12.
Step 1 Find the slope of the given line.
x � 4y � 12 Original equation
x � 4y � x � 12 � x Subtract 1x from each side.
4y � �1x � 12 Simplify.
�44y� � �
�1x4� 12� Divide each side by 4.
y � ��14
�x � 3 Simplify.
Step 2 The slope of the given line is ��14
�. So, the slope of the line perpendicular
to this line is the opposite reciprocal of ��14
�, or 4.
Step 3 Use the point-slope form to find the equation.
y � y1 � m(x � x1) Point-slope form
y � (�2) � 4[x � (�3)] (x1, y1) � (�3, �2) and m � 4
y � 2 � 4(x � 3) Simplify.
y � 2 � 4x � 12 Distributive Property
y � 2 � 2 � 4x � 12 � 2 Subtract 2 from each side.
y � 4x � 10 Simplify.
Therefore, the equation of the line is y � 4x � 10.
CHECK You can check your result by graphing both equations on a graphing calculator. Use the CALCmenu to verify that y � 4x � 10 passes through (�3, �2).
[�15.16..., 15.16...] scl: 1 by [�10, 10] scl: 1
Example 3Example 3
294 Chapter 5 Analyzing Linear Equations
Naturalist Have students collect items in nature or pictures of thoseitems that display parallel and perpendicular segments. Ask them tosketch or trace the item on grid paper. Then have students calculate theslopes of the segments to determine if they are truly parallel or trulyperpendicular.
Differentiated Instruction
PowerPoint®

Lesson 5-6 Geometry: Parallel and Perpendicular Lines 295
Perpendicular Line Through a Given PointWrite the slope-intercept form for an equation of a line perpendicular to thegraph of y � ��
13
�x � 2 and passes through the x-intercept of that line.
Step 1 Find the slope of the perpendicular line. The slope of the given line is ��13
�,therefore a perpendicular line has slope 3 because ��
13
� � 3 � �1.
Step 2 Find the x-intercept of the given line.
y � ��13
�x � 2 Original equation
0 � ��13
�x � 2 Replace y with 0.
�2 � ��13
�x Subtract 2 from each side.
6 � x Multiply each side by �3.
The x-intercept is at (6, 0).
Step 3 Substitute the slope and the given point into the point-slope form of alinear equation. Then write the equation in slope-intercept form.
y � y1 � m(x � x1) Point-slope form
y � 0 � 3(x � 6) Replace x with 6, y with 0, and m with 3.
y � 3x � 18 Distributive Property
Concept Check1, 3. See margin. 2. Sample answer: 2, ��
12
�
Guided Practice
9. y � �3x � 8
10. y � ��53
�x � 8
11. y � �12
�x � 3
Example 4Example 4
GUIDED PRACTICE KEYExercises Examples
4–7 18 2
9–11 312 4
1. Explain how to find the slope of a line that is perpendicular to the line shown in the graph.
2. OPEN ENDED Give an example of two numbersthat are negative reciprocals.
3. Define parallel lines and perpendicular lines.
Write the slope-intercept form of an equation of the line that passes through thegiven point and is parallel to the graph of each equation.
4. y � �2x � 1 5. y � x � 1
6. (1, �3), y � 2x � 1 y � 2x � 5 7. (�2, 2), �3x � y � 4 y � 3x � 8
8. GEOMETRY Quadrilateral ABCD has vertices A(�2, 1), B(3, 3), C(5, 7), and D(0, 5). Determine whether A�C� is perpendicular to B�D�. See margin.
Write the slope-intercept form of an equation that passes through the given pointand is perpendicular to the graph of each equation.
9. (�3, 1), y � �13
�x � 2 10. (6, �2), y � �35
�x � 4 11. (2, �2), 2x � y � 5
y
xO
(2, 3)
y � x � 5
y
xO
(0, �1)
y � �2x � 4
y
xO
y � x � 132
Lesson 5-6 Geometry: Parallel and Perpendicular Lines 295
3 Practice/Apply3 Practice/Apply
Study NotebookStudy Notebook
About the Exercises…Organization by Objective• Parallel Lines: 13–27• Perpendicular Lines: 28–41
Odd/Even AssignmentsExercises 13–24 and 28–39 arestructured so that studentspractice the same conceptswhether they are assignedodd or even problems.
Assignment GuideBasic: 13–37 odd, 41, 46–60Average: 13–45 odd, 46–60Advanced: 14–44 even, 46–54(optional: 55–60)All: Practice Quiz 2 (1�5)
Have students—• add the definitions/examples of
the vocabulary terms to theirVocabulary Builder worksheets forChapter 5.
• include any other item(s) that theyfind helpful in mastering the skillsin this lesson.
Answers
1. The slope is , so the slope of a
line perpendicular to the given
line is � .
3. Parallel lines lie in the sameplane and never intersect.Perpendicular lines intersect atright angles.
8. Slope of A�C� � or ;
slope of B�D� � or � ;
they are not perpendicular.
2�3
3 � 5�3 � 0
6�7
1 � 7��2 � 5
2�3
3�2

Study Guide and Intervention
Geometry: Parallel and Perpendicular Lines
NAME ______________________________________________ DATE ____________ PERIOD _____
5-65-6
Less
on
5-6
Parallel Lines Two nonvertical lines are parallel if they have the same slope. All vertical lines are parallel.
Write the slope-intercept form for an equation of the line thatpasses through (�1, 6) and is parallel to the graph of y � 2x � 12.
A line parallel to y � 2x � 12 has the same slope, 2. Replace m with 2 and (x1, y1) with (�1, 6) in the point-slope form.y � y1 � m(x � x1) Point-slope form
y � 6 � 2(x � (�1)) m � 2; (x1, y1) � (�1, 6)
y � 6 � 2(x � 1) Simplify.
y � 6 � 2x � 2 Distributive Property
y � 2x � 8 Slope-intercept form
Therefore, the equation is y � 2x � 8.
Write the slope-intercept form for an equation of the line that passes through thegiven point and is parallel to the graph of each equation.
1. 2. 3.
y � x � 4 y � � x � 3 y � x � 7
4. (�2, 2), y � 4x � 2 5. (6, 4), y � x � 1 6. (4, �2), y � �2x � 3
y � 4x � 10 y � x � 2 y � �2x � 6
7. (�2, 4), y � �3x � 10 8. (�1, 6), 3x � y � 12 9. (4, �6), x � 2y � 5
y � �3x � 2 y � �3x � 3 y � � x � 4
10. Find an equation of the line that has a y-intercept of 2 that is parallel to the graph ofthe line 4x � 2y � 8. y � �2x � 2
11. Find an equation of the line that has a y-intercept of �1 that is parallel to the graph ofthe line x � 3y � 6. y � x � 1
12. Find an equation of the line that has a y-intercept of �4 that is parallel to the graph ofthe line y � 6. y � �4
1�3
1�2
1�3
1�3
4�3
1�2
(–3, 3)
x
y
O
4x � 3y � –12
(–8, 7)
x
y
O
y � – 12x � 4
2
2
(5, 1)x
y
O
y � x � 8
ExampleExample
ExercisesExercises
Study Guide and Intervention, p. 311 (shown) and p. 312
Write the slope-intercept form of an equation of the line that passes through thegiven point and is parallel to the graph of each equation.
1. (3, 2), y � x � 5 2. (�2, 5), y � �4x � 2 3. (4, �6), y � � x � 1
y � x � 1 y � �4x � 3 y � � x � 3
4. (5, 4), y � x � 2 5. (12, 3), y � x � 5 6. (3, 1), 2x � y � 5
y � x � 2 y � x � 13 y � �2x � 7
7. (�3, 4), 3y � 2x � 3 8. (�1, �2), 3x � y � 5 9. (�8, 2), 5x � 4y � 1
y � x � 6 y � 3x � 1 y � x � 12
10. (�1, �4), 9x � 3y � 8 11. (�5, 6), 4x � 3y � 1 12. (3, 1), 2x � 5y � 7
y � �3x � 7 y � � x � y � � x �
Write the slope-intercept form of an equation of the line that passes through thegiven point and is perpendicular to the graph of each equation.
13. (�2, �2), y � � x � 9 14. (�6, 5), x � y � 5 15. (�4, �3), 4x � y � 7
y � 3x � 4 y � �x � 1 y � x � 2
16. (0, 1), x � 5y � 15 17. (2, 4), x � 6y � 2 18. (�1, �7), 3x � 12y � �6
y � 5x � 1 y � �6x � 16 y � 4x � 3
19. (�4, 1), 4x � 7y � 6 20. (10, 5), 5x � 4y � 8 21. (4, �5), 2x � 5y � �10
y � x � 8 y � x � 3 y � � x � 5
22. (1, 1), 3x � 2y � �7 23. (�6, �5), 4x � 3y � �6 24. (�3, 5), 5x � 6y � 9
y � x � y � x � y � � x �
25. GEOMETRY Quadrilateral ABCD has diagonals A�C� and B�D�.Determine whether A�C� is perpendicular to B�D�. Explain.
Yes; they are perpendicular because their slopes are 7 and � , which are negative reciprocals.
26. GEOMETRY Triangle ABC has vertices A(0, 4), B(1, 2), and C(4, 6).Determine whether triangle ABC is a right triangle. Explain.
Yes; sides A�B� and A�C� are perpendicular because their slopes are �2 and , which are negative reciprocals.1
�2
1�7
x
y
O
A
D
C
B
7�5
6�5
1�2
3�4
1�3
2�3
5�2
4�5
7�4
1�4
1�3
11�5
2�5
2�3
4�3
5�4
2�3
4�3
2�5
4�3
2�5
3�4
3�4
Practice (Average)
Geometry: Parallel and Perpendicular Lines
NAME ______________________________________________ DATE ____________ PERIOD _____
5-65-6Skills Practice, p. 313 and Practice, p. 314 (shown)
Reading to Learn Mathematics
Geometry: Parallel and Perpendicular Lines
NAME ______________________________________________ DATE ____________ PERIOD _____
5-65-6
Pre-Activity How can you determine whether two lines are parallel?
Read the introduction to Lesson 5-6 at the top of page 296 in your textbook.
• What is a family of graphs? A group of graphs that have at leastone characteristic in common, such as slope or y-intercept.
• Do you think lines that do not appear to intersect are parallel orperpendicular? parallel
Reading the Lesson
1. Refer to the Key Concept box on page 296. Why does the definition use the termnonvertical when talking about lines with the same slope? Vertical lines haveslopes that are undefined so we cannot say they have the same slope.
2. What is a right angle? Sample answers: A right angle is one that measures90°. It is an angle formed by perpendicular lines.
3. Refer to the Key Concept box on page 297. Describe how you find the opposite reciprocalof a number. Sample answer: The reciprocal of a given number is thenumber formed when you switch the numerator and denominator. Thenyou give it the opposite sign of the original number.
4. Write the opposite reciprocal of each number.
a. 2 � b. �3 c. � d. � 5
Helping You Remember
5. One way to remember how slopes of parallel lines are related is to say “same direction,same slope.” Try to think of a phrase to help you remember that perpendicular lineshave slopes that are opposite reciprocals.
Sample answer: Nicely right angles formed, use opposite reciprocals.
1�5
13�12
12�13
1�3
1�2
Reading to Learn Mathematics, p. 315
Pencils of LinesAll of the lines that pass through a single point in the same plane are called a pencil of lines.
All lines with the same slope,but different intercepts, are also called a “pencil,” a pencil of parallel lines.
Graph some of the lines in each pencil.
1. A pencil of lines through the 2. A pencil of lines described by point (1, 3) y � 4 � m(x � 2), where m is any
real numberyy
Enrichment
NAME ______________________________________________ DATE ____________ PERIOD _____
5-65-6Enrichment, p. 316
Application
Homework HelpFor See
Exercises Examples 13–24 1
26 228–39 3, 4
Extra PracticeSee page 832.
296 Chapter 5 Analyzing Linear Equations
12. GEOMETRY The line with equation y � 3x � 4 contains side A�C� of right triangle ABC. If thevertex of the right angle C is at (3, 5), what is anequation of the line that contains side B�C�?
y � ��13
�x � 6
y
xOA
BC
Practice and ApplyPractice and Apply
indicates increased difficulty�
�
�
Write the slope-intercept form of an equation of the line that passes through thegiven point and is parallel to the graph of each equation.
13. (2, �7), y � x � 2 14. (2, �1), y � 2x � 2 15. (�3, 2), y � x � 6
16. (4, �1), y � 2x � 1 17. (�5, �4), y � �12
�x � 1 18. (3, 3), y � �23
�x � 1
19. (�4, �3), y � ��13
�x � 3 20. (�1, 2), y � ��12
�x � 4 21. (�3, 0), 2y � x � 1
22. (2, 2), 3y � �2x � 6 23. (�2, 3), 6x � y � 4 24. (2, 2), 3x � 4y � �4
25. GEOMETRY A parallelogram is a quadrilateralin which opposite sides are parallel. Is ABCD aparallelogram? Explain. See margin.
26. Write an equation of the line parallel to thegraph of y � 5x � 3 and through the origin.
27. Write an equation of the line that has y-intercept �6 and is parallel to the graph ofx � 3y = 8.
Write the slope-intercept form of an equation that passes through the given pointand is perpendicular to the graph of each equation. 28–39. See margin. 28. (�2, 0), y � x � 6 29. (1, 1), y � 4x � 6 30. (�3, 1), y � �3x � 7
31. (0, 5), y � �8x � 4 32. (1, �3), y � �12
�x � 4 33. (4, 7), y � �23
�x � 1
34. (0, 4), 3x � 8y � 4 35. (�2, 7), 2x � 5y � 3 36. (6, �1), 3y � x � 3
37. (0, �1), 5x � y � 3 38. (8, �2), 5x � 7 � 3y 39. (3, �3), 3x � 7 � 2x
40. Find an equation of the line that has a y-intercept of �2 and is perpendicular to the graph of 3x � 6y � 2. y � 2x � 2
41. Write an equation of the line that is perpendicular to the line through (9, 10) and (3, �2) and passes through the x-intercept of that line.
Determine whether the graphs of each pair of equations are parallel,perpendicular, or neither.
42. y � �2x � 11 43. 3y � 2x � 14 44. y � �5xy � 2x � 23 parallel 2x � 3y � 2 parallel y � 5x � 18 neither
45. GEOMETRY The diagonals of a square are segments that connect the opposite vertices.Determine the relationship between thediagonals A�C� and B�D� of square ABCD.
46. CRITICAL THINKING What is a if the lineswith equations y � ax � 5 and 2y � (a � 4)x � 1 are parallel? 4
y
xO
A
B
C
D
��
y � ��12
�x � 2
�
y � �13
�x � 6
y
xO
y � x � 223
y � x � 323x � �1
x � 3
A
B
C
D
13. y � x � 914. y � 2x � 515. y � x � 516. y � 2x � 9
17. y � �12
�x � �32
�
18. y � �23
�x � 1
19. y � ��13
�x � �133�
20. y � ��12
�x � �32
�
21. y � �12
�x � �32
�
22. y � ��23
�x � �130�
23. y � �6x � 924. y � �
34
�x � �12
�
45. They are �,because the slopes
are 3 and ��13
�.
y � 5x
296 Chapter 5 Analyzing Linear Equations
ELL
Answer
25. The lines for x � 3 and x � �1 are parallelbecause all vertical lines are parallel. The
lines for y � x � 2 and y � x � 3 are
parallel because they have the same slope.Thus, both pairs of opposite sides areparallel and the figure is a parallelogram.
2�3
2�3

Open-Ended Assessment
Modeling Ask students to createa drawing or physical model of aline with equation ax � by � c.Then have them draw linesparallel to this line and describethe characteristics of those linesin terms of a, b, and c. Repeat theactivity with lines that areperpendicular to the given line.
Getting Ready for Lesson 5-7PREREQUISITE SKILL Lesson 5-7introduces students to lines of fit.The equations of lines of fit arewritten from two points that lieon that line. Exercises 55–60should be used to determine yourstudents’ familiarity with writingequations in slope-intercept formgiven two points on the line.
Assessment Options
Practice Quiz 2 The quiz pro-vides students with a brief reviewof the concepts and skills inLessons 5-3 through 5-6. Lessonnumbers are given to the right ofthe exercises or instruction linesso students can review conceptsnot yet mastered.Quiz (Lessons 5-5 and 5-6) isavailable on p. 338 of the Chapter 5Resource Masters.
Lesson 5-6 Geometry: Parallel and Perpendicular Lines 297www.algebra1.com/self_check_quiz
Maintain Your SkillsMaintain Your Skills
Practice Quiz 2Practice Quiz 2
Write the slope-intercept form for an equation of the line that satisfieseach condition.
1. slope 4 and y-intercept �3 (Lesson 5-3) y � 4x � 32. passes through (1, �3) with slope 2 (Lesson 5-4) y � 2x � 53. passes through (�1, �2) and (1, 3) (Lesson 5-4) y � �
52
�x � �12
�
4. parallel to the graph of y � 2x � 2 and passes through (�2, 3) (Lesson 5-6) y � 2x � 7
5. Write y � 4 � �12
�(x � 3) in standard form and in slope-intercept form. (Lesson 5-5)
Lessons 5-3 through 5-6
47. Answer the question that was posed at the beginning ofthe lesson. See margin.
How can you determine whether two lines are parallel?
Include the following in your answer:• an equation whose graph is parallel to the graph of y � �5x, with an
explanation of your reasoning, and• an equation whose graph is perpendicular to the graph of y � �5x, with an
explanation of your reasoning.
48. What is the slope of a line perpendicular to the graph of 3x � 4y � 24? D��
43
� ��34
� �34
� �43
�
49. How can the graph of y � 3x � 4 be used to graph y � 3x � 2? CMove the graph of the line right 2 units.Change the slope of the graph from 4 to 2.Change the y-intercept from 4 to 2.Move the graph of the line left 2 units.D
C
B
A
DCBA
WRITING IN MATH
Mixed Review
Getting Ready forthe Next Lesson
StandardizedTest Practice
Write the point-slope form of an equation for a line that passes through eachpoint with the given slope. (Lesson 5-5)
50. (3, 5), m � �2 51. (�4, 7), m � 5 52. (�1, �3), m � ��12
�
y � 5 � �2(x � 3) y � 7 � 5(x � 4) y � 3 � ��12
�(x � 1)
TELEPHONE For Exercises 53 and 54, use the following information.An international calling plan charges a rate per minute plus a flat fee. A 10-minutecall to the Czech Republic costs $3.19. A 15-minute call costs $4.29. (Lesson 5-4)
53. Write a linear equation in slope-intercept form to find the total cost C of an m-minute call. C � 0.22m � 0.99
54. Find the cost of a 12-minute call. $3.6355. y � ��
12
�x � �32
� 56. y � ��14
�x � 2 57. y � �5x � 11PREREQUISITE SKILL Write the slope-intercept form of an equation of the linethat passes through each pair of points. (To review slope-intercept form, see Lesson 5-3.)
55. (5, �1), (�3, 3) 56. (0, 2), (8, 0) 57. (2, 1), (3, �4)
58. (5, 5), (8, �1) 59. (6, 9), (4, 9) 60. (�6, 4), (2, �2)y � �2x � 15 y � 9 y � ��
34
�x � �12
�
5. x � 2y � �11, y � �12
�x � �121�
Lesson 5-6 Geometry: Parallel and Perpendicular Lines 297
4 Assess4 Assess
Answers
47. If two equations have the sameslope, then the lines are parallel.Answers should include thefollowing.• Sample answer: y � �5x � 1;
The graphs have the same slope.
• Sample answer: y � x; The
slopes are negative reciprocalsof each other.
1�5
28. y � �x � 2
29. y � � x �
30. y � x � 2
31. y � x � 5
32. y � �2x � 1
33. y � � x � 13
34. y � x � 4
35. y � � x � 2
36. y � 3x � 19
37. y � � x � 1
38. y � � x �
39. y � �3
14�5
3�5
1�5
5�2
8�3
3�2
1�8
1�3
5�4
1�4

5-Minute CheckTransparency 5-7 Use as a
quiz or review of Lesson 5-6.
Mathematical Background notesare available for this lesson on p. 254D.
Building on PriorKnowledge
In Lesson 5-1, students learnedthat the direction of the linecorresponded to a positive ornegative slope. That same logicapplies to determining a positivecorrelation or a negativecorrelation in data.
do scatter plots helpidentify trends in data?
Ask students:• What type of slope does the
line have? positive• What would you do to find the
equation of that line? Use twopoints on the line to write theequation.
• Travel What type of graphwould show that the longeryou drive the less gas is left inyour gas tank? a line withnegative slope
298 Chapter 5 Analyzing Linear Equations
Statistics: Scatter Plots and Lines of Fit
Scatter PlotsPositive Correlation Negative Correlation No Correlation
y
xO
y
xO
negativeslope
y
xO
positiveslope
INTERPRET POINTS ON A SCATTER PLOT A is a graph inwhich two sets of data are plotted as ordered pairs in a coordinate plane. Scatterplots are used to investigate a relationship between two quantities.• In the first graph below, there is a between x and y.
That is, as x increases, y increases. • In the second graph below, there is a between x and y.
That is, as x increases, y decreases.• In the third graph below, there is no correlation between x and y. That is,
x and y are not related.If the pattern in a scatter plot is linear, you can draw a line to summarize the data.
This can help identify trends in the data.
negative correlation
positive correlation
scatter plot
do scatter plots help identify trends in data?
• Interpret points on a scatter plot.
• Write equations for lines of fit.
Vocabulary• scatter plot• positive correlation• negative correlation• line of fit• best-fit line• linear interpolation
The points of a set of real-world data do not always lie on one line. But, youmay be able to draw a line that seems to be close to all the points.
The line in the graph shows a linearrelationship between the year x and thenumber of bushels of apples y. As theyears increase, the number of bushelsof apples also increases.
Source: U.S. Apple Association
Apples in Storage in U.S.
’97 ’98 ’99
Nu
mb
er(m
illio
ns
of
bu
shel
s)
8
0
10
12
14
’00
11.7
8.1
13.6
12.4
Year
x
y
do scatter plots help identify trends in data?
LessonNotes
1 Focus1 Focus
Chapter 5 Resource Masters• Study Guide and Intervention, pp. 317–318• Skills Practice, p. 319• Practice, p. 320• Reading to Learn Mathematics, p. 321• Enrichment, p. 322• Assessment, p. 338
Graphing Calculator and Spreadsheet Masters, p. 32
Parent and Student Study GuideWorkbook, p. 44
Science and Mathematics Lab Manual, pp. 51–56
Teaching Algebra With ManipulativesMasters, pp. 1, 24, 105
5-Minute Check Transparency 5-7Answer Key Transparencies
TechnologyInteractive Chalkboard
Workbook and Reproducible Masters
Resource ManagerResource Manager
Transparencies

Making Predictions
Collect the Data• Measure your partner’s foot and height in centimeters. Then trade places.• Add the points (foot length, height) to a class scatter plot.
Analyze the Data 1–3. See students’ work.1. Is there a correlation between foot length and height for the members
of your class? If so, describe it.2. Draw a line that summarizes the data and shows how the height changes
as the foot length changes.
Make a Conjecture3. Use the line to predict the height of a person whose foot length is
25 centimeters. Explain your method.
Lesson 5-7 Statistics: Scatter Plots and Lines of Fit 299
Is there a relationship between the length of a person’s foot and his or her height?Make a scatter plot and then look for a pattern.
Analyze Scatter PlotsDetermine whether each graph shows a positive correlation, a negativecorrelation, or no correlation. If there is a positive or negative correlation,describe its meaning in the situation.
a. NUTRITION The graph showsfat grams and Calories for selected choices at a fast-food restaurant.The graph shows a positive correlation. As the number of fat grams increases, the number of Calories increases.
b. CARS The graph shows the weight and the highway gas mileage of selected cars.The graph shows a negative correlation. As the weight of the automobile increases, the gas mileage decreases.
Automobiles
Source: Yahoo!
20000 3000 4000
Gas
Mile
age
(mp
g)
Weight (pounds)
16
20
24
28
32
36
40
5000
Fast-Food Choices
Source: Olen Publishing Co.
100 20 30
Cal
ori
es
Fat Grams
200
400
600
800
40
Example 1Example 1
TEACHING TIPMake sure that studentsunderstand that you can have a negative correlation without having negative numbers in your data.
www.algebra1.com/extra_examples
Lesson 5-7 Statistics: Scatter Plots and Lines of Fit 299
2 Teach2 Teach
11
In-Class ExampleIn-Class Example
INTERPRET POINTS ON A SCATTER PLOT
Determine whether eachgraph shows a positive corre-lation, a negative correlation, orno correlation. If there is apositive or negative correla-tion, describe it.
a. The graph shows averagepersonal income for U.S.citizens.
Positive correlation; with eachyear, the average personalincome rose.
b. The graph shows the averagestudents per computer inU.S. public schools.
Negative correlation; with eachyear, more computers are in theschools, making the students percomputer rate smaller.
Computer Sharingin U.S. Schools
Year
Stu
den
ts p
er C
om
pu
ter
’87 ’91 ’95
40353025201510
50
Source: QED National Education Database
Personal Income for U.S.
Year
Do
llars
(th
ou
san
ds)
’90 ’92 ’94 ’96 ’98
302520151050
Algebra Activity
Materials: centimeter ruler or meterstick, grid paper• You could also give pairs of students identical grids on transparencies to plot
their two data points. Lay all the grids together on the overhead projector toget a quick compilation of the data points.
• Allow students to skip this activity if they are uncomfortable having their feetmeasured.
PowerPoint®

22
In-Class ExampleIn-Class ExampleLINES OF FIT
The table shows the worldpopulation growing at a rapidrate.
Source: The World Almanac
a. Draw a scatter plot anddetermine what relationshipexists, if any, in the data.There is a positive correlationbetween years and population.
b. Draw a line of fit for thescatter plot.
c. Write the slope-intercept formof an equation for the line offit. Using (1850, 1000) and(1998, 5900), y � 33.1x � 60,235.
World Population
Year
Pop
ula
tio
n (
mill
ion
s)
21001500 1700 1900
7000
6000
5000
4000
3000
2000
1000
0
Year Population (millions)
1650 5001850 10001930 20001975 40001998 5900
LINES OF FIT If the data points do not all lie on a line, but are close to a line,you can draw a . This line describes the trend of the data. Once you have a line of fit, you can find an equation of the line.
In this lesson, you will use a graphical method to find a line of fit. In the follow-up to Lesson 5-7, you will use a graphing calculator to find a line of fit. The calculator uses a statistical method to find the line that most closely approximatesthe data. This line is called the .best-fit line
line of fit
300 Chapter 5 Analyzing Linear Equations
Find a Line of FitBIRDS The table shows an estimate for the number of bald eagle pairs in the United States for certain years since 1985.
a. Draw a scatter plot and determine what relationship exists, if any, in the data.
Let the independent variable x be the number of years since 1985, and let thedependent variable y be the number ofbald eagle pairs.
The scatter plot seems to indicate thatas the number of years increases, thenumber of bald eagle pairs increases.There is a positive correlation betweenthe two variables.
b. Draw a line of fit for the scatter plot.
No one line will pass through all of thedata points. Draw a line that passesclose to the points. A line of fit isshown in the scatter plot at the right.
c. Write the slope-intercept form of anequation for the line of fit.
The line of fit shown above passes through the data points (5, 3000) and (9, 4500).
Step 1 Find the slope.
m � �yx
2
2
�
�
yx
1
1� Slope formula
m � �4500
9��
35000
� Let (x1, y1) � (5, 3000) and (x2, y2) � (9, 4500).
m � �15
400� or 375 Simplify.
Step 2 Use m � 375 and either the point-slope form or the slope-intercept formto write the equation. You can use either data point. We chose (5, 3000).
Point-slope form Slope-intercept form
y � y1 � m(x � x1) y � mx � b
y � 3000 � 375(x � 5) 3000 � 375(5) � b
y � 3000 � 375x � 1875 3000 � 1875 � b
y � 375x � 1125 1125 � b
y � 375x � 1125
Using either method, y � 375x � 1125.
Nu
mb
er (
pai
rs)
5500
4500
3500
2500
Years Since 19850
y
2 6 10 144 8 12 x
Bald Eagle Pairs
Lines of FitWhen you use thegraphical method, the lineof fit is an approximation.So, you may draw anotherline of fit using otherpoints that is equally valid.Some valid lines of fit maynot contain any of thedata points.
Study Tip
BirdsThe bald eagle was listedas an endangered speciesin 1963, when the numberof breeding pairs haddropped below 500.Source: U.S. Fish and Wildlife
Service
3 5 7 9 11 14
2500 3000 3700 4500 5000 5800
Years since 1985
Bald Eagle Pairs
Source: U.S. Fish and Wildlife Service
Example 2Example 2
300 Chapter 5 Analyzing Linear Equations
PowerPoint®

Lesson 5-7 Statistics: Scatter Plots and Lines of Fit 301
CHECK Check your result by substituting (9, 4500) into y � 375x � 1125.
y � 375x � 1125 Line of fit equation
4500 � 375(9) � 1125 Replace x with 9 and y with 4500.
4500 � 3375 � 1125 Multiply.
4500 � 4500 � Add.
The solution checks.
Concept Check
Guided Practice
1. Explain how to determine whether a scatter plot has a positive or negativecorrelation. 1–3. See margin.
2. OPEN ENDED Sketch scatter plots that have each type of correlation.a. positive b. negative c. no correlation
3. Compare and contrast linear interpolation and linear extrapolation.
Determine whether each graph shows a positive correlation, a negativecorrelation, or no correlation. If there is a positive or negative correlation, describe its meaning in the situation.
4. 5.Weekly Activities
10 200 5 15 25 3530
Exer
cise
(h
ou
rs)
TV (hours)
1
2
3
4
5
6
7
Test Scores
0 6030 90
Test
Sco
re
Study Time (min)
50
60
70
80
90
100
120
In Lesson 5-4, you learned about linear extrapolation, which is predicting valuesthat are outside the range of the data. You can also use a linear equation to predictvalues that are inside the range of the data. This is called .linear interpolation
Linear InterpolationBIRDS Use the equation for the line of fit in Example 2 to estimate the numberof bald eagle pairs in 1998.
Use the equation y � 375x � 1125, where x is the number of years since 1985 and y is the number of bald eagle pairs.
y � 375x � 1125 Original equation
y � 375(13) � 1125 Replace x with 1998 � 1985 or 13.
y � 6000 Simplify.
There were about 6000 bald eagle pairs in 1998.
Example 3Example 3
GUIDED PRACTICE KEYExercises Examples
4, 5 16–8 2
9 3
4. Positive; the longeryou study, the betteryour test score.5. Negative; the moreTV you watch, the lessyou exercise.
Lesson 5-7 Statistics: Scatter Plots and Lines of Fit 301
33
In-Class ExampleIn-Class Example
3 Practice/Apply3 Practice/Apply
Study NotebookStudy Notebook
Teaching Tip Remind studentsthat any prediction is only asvalid as the equation used tofind it. Therefore, there are asmany predictions as there areequations that can be writtenfrom pairs of points.
Use the prediction equationin In-Class Example 2 topredict the world populationin 2010. 6296 million
Have students—• complete the definitions/examples
for the remaining terms on theirVocabulary Builder worksheets forChapter 5.
• include their sketches fromExercise 2.
• include any other item(s) that theyfind helpful in mastering the skillsin this lesson.
2a. 2b. y
xO
y
xO
Answers
1. If the data points form a linearpattern such that y increasesas x increases, there is apositive correlation. If thelinear pattern shows that ydecreases as x increases,there is a negative correlation.
Answers
2c.
3. Linear extrapolation predictsvalues outside the domain of thedata set. Linear interpolationpredicts values inside theextremes of the domain.
y
xO
PowerPoint®

Answers
6–7.
18–19.
24–25.
Spen
din
g (
bill
ion
s o
f d
olla
rs)
4
0
6
8
10
12
14
Year‘80 ‘85 ‘90 ‘95 ‘00
Bo
ilin
g P
oin
t ( ˚C
)
�90�60
�120
�300
306090
120
Number of Carbon Atoms1 32 4 5 6 7 8
Air
Tem
per
atu
re (˚C
)
10
0
15
20
25
30
35
Body Temperature (˚C)15 20 25 30 35
302 Chapter 5 Analyzing Linear Equations
Application
25.7 30.4 28.7 31.2 31.5 26.2 30.1 31.5 18.2
27.0 31.5 28.9 31.0 31.5 25.6 28.4 31.7 18.7
Temperature (°C)
Air
Body
Practice and ApplyPractice and Apply
Determine whether each graph shows a positive correlation, a negativecorrelation, or no correlation. If there is a positive or negative correlation, describe its meaning in the situation.
10. 11.
12. 13.
FARMING For Exercises 14 and 15, refer to the graph at the top of page 298 about apple storage.
14. Use the points (1997, 8.1) and (1999, 12.4) to write the slope-intercept form of an equation for the line of fit. y � 2.15x � 4285.45
15. Predict the number of bushels of apples in storage in 2002. 18.85
Cereal Bars
Source: Vitality
860 12 1610 14 18 20C
alo
ries
Sugar (grams)
80
90
100
110
120
130
140
150
Electronic Tax Returns
Source: IRS
’96’95 ’98 ’00’97 ’99
Nu
mb
er (
mill
ion
s)
Year
10
0
20
30
40
Hurricanes
Source: USA TODAY
’89’87 ’93 ’97’91 ’95 ’99
Nu
mb
er
Year
2
0
4
6
8
10
12
Census Forms Returned
Source: U.S. Census Bureau
1970 1980Year
1990 2000Pe
rcen
t50
0
60
70
80
BIOLOGY For Exercises 6–9, use the table that shows the average bodytemperature in degrees Celsius of 9 insects at a given air temperature.
6. Draw a scatter plot and determine what relationship exists, if any, in the data. See margin.
7. Draw a line of fit for the scatter plot. See margin.8. Write the slope-intercept form of an equation for the line of fit.
9. Predict the body temperature of an insect if the air temperature is 40.2°F. 40.1°F8. using (26.2, 25.6)and (31.2, 31.0) androunding, y � x � 0.6
10. Negative; as timegoes by, fewer peoplereturn their censusforms.11. no correlation12. Positive; as timegoes on, more peopleuse electronic taxreturns.13. Positive; the higher the sugar content, the moreCalories.
Homework HelpFor See
Exercises Examples10–13 1 14–33 2, 3
Extra PracticeSee page 833.
302 Chapter 5 Analyzing Linear Equations
About the Exercises…Organization by Objective• Interpret Points on a Scatter
Plot: 10–13• Lines of Fit: 14–17, 19–23,
25–28, 30–33
Odd/Even AssignmentsExercises 10–13 are structuredso that students practice thesame concepts whether theyare assigned odd or evenproblems.
Assignment GuideBasic: 11, 13, 14–17, 34–39,45–55Average: 11, 13, 18–28, 34–39,45–55 (optional: 40–44)Advanced: 10, 12, 24–55

Study Guide and Intervention
Scatter Plots and Lines of Fit
NAME ______________________________________________ DATE ____________ PERIOD _____
5-75-7
Less
on
5-7
Interpret Points on a Scatter Plot A scatter plot is a graph in which two sets ofdata are plotted as ordered pairs in a coordinate plane. If y increases as x increases, there isa positive correlation between x and y. If y decreases as x increases, there is a negativecorrelation between x and y. If x and y are not related, there is no correlation.
EARNINGS The graph at the right shows the amount of money Carmen earned eachweek and the amount she deposited in her savingsaccount that same week. Determine whether thegraph shows a positive correlation, a negativecorrelation, or no correlation. If there is a positive or negative correlation, describe itsmeaning in the situation.
The graph shows a positive correlation. The more Carmen earns, the more she saves.
Determine whether each graph shows a positive correlation, a negativecorrelation, or no correlation. If there is a positive correlation, describe it.
1. 2.
no correlationNegative correlation; as time increases, speed decreases.
3. 4.
Positive correlation; as the Positive correlation; as thenumber of years increases, the number of years increases, thenumber of clubs increases. number of funds increases.
Number of Mutual Funds
Years Since 1991
Nu
mb
er o
f Fu
nd
s(t
ho
usa
nd
s)
0 2 41 3 5 6 7
7
6
5
4
3
Source: The Wall Street Journal Almanac
Growth of Investment Clubs
Years Since 1990
Nu
mb
er o
f C
lub
s(t
ho
usa
nd
s)
0 2 41 3 5 6 7 8
35
28
21
14
7
Source: The Wall Street Journal Almanac
Average Jogging Speed
Minutes
Mile
s p
er H
ou
r
0 10 205 15 25
10
5
Average Weekly Work Hours in U.S.
Years Since 1990
Ho
urs
0 2 4 61 7 8 9 x
y
3 5
34.8
34.6
34.4
34.2
Source: The World Almanac
Carmen’s Earnings and Savings
Dollars Earned
Do
llars
Sav
ed
0 40 80 120
35
30
25
20
15
10
5
ExampleExample
ExercisesExercises
Study Guide and Intervention, p. 317 (shown) and p. 318
Determine whether each graph shows a positive correlation, a negativecorrelation, or no correlation. If there is a positive or negative correlation,describe its meaning in the situation.
1. 2.
no correlation Positive; as the mean elevationincreases, the highest point increases.
DISEASE For Exercises 3–6, use the table that shows the number of cases of mumps in the United States for the years 1995 to 1999.
3. Draw a scatter plot and determine what relationship, if any, exists in the data.
Source: Centers for Disease Control and Prevention
Negative correlation; as the year increases, the number of cases decreases.
4. Draw a line of fit for the scatter plot.Sample answer: Use (1996, 751), (1997, 683).
5. Write the slope-intercept form of an equation for theline of fit. Sample answer: y � �68x � 136,479
6. Predict the number of cases in 2004. about 207
ZOOS For Exercises 7–10, use the table that shows the average and maximum longevity ofvarious animals in captivity.
7. Draw a scatter plot and determine what relationship, if any, exists in the data. Source: Walker’s Mammals of the World
Positive correlation; as the average increases, the maximum increases.
8. Draw a line of fit for the scatter plot.Sample answer: Use (15, 40), (35, 70).
9. Write the slope-intercept form of an equation for the line of fit. Sample answer: y � 1.5x � 17.5
10. Predict the maximum longevity for an animal with an average longevity of 33 years. about 67 yr
Animal Longevity (Years)
Average
Max
imu
m
50 10 15 20 25 30 35 40 45
80
70
60
50
40
30
20
10
Longevity (years)
Avg. 12 25 15 8 35 40 41 20
Max. 47 50 40 20 70 77 61 54
U.S. Mumps Cases
Year
Cas
es
1995 1997 1999 2001
1000
800
600
400
200
0
U.S. Mumps Cases
Year 1995 1996 1997 1998 1999
Cases 906 751 683 666 387
State Elevations
Mean Elevation (feet)
Hig
hes
t Po
int
(th
ou
san
ds
of
feet
)
10000 2000 3000
16
12
8
4
Source: U.S. Geological Survey
Temperature versus Rainfall
Average Annual Rainfall (inches)
Ave
rag
eTe
mp
erat
ure
(�F
)
10 15 20 25 30 35 40 45
64
60
56
52
0
Source: National Oceanic and Atmospheric Administration
Practice (Average)
Statistics: Scatter Plots and Lines of Fit
NAME ______________________________________________ DATE ____________ PERIOD _____
5-75-7Skills Practice, p. 319 and Practice, p. 320 (shown)
Reading to Learn Mathematics
Statistics: Scatter Plots and Lines of Fit
NAME ______________________________________________ DATE ____________ PERIOD _____
5-75-7
Less
on
5-7
Pre-Activity How do scatter plots help identify trends in data?
Read the introduction to Lesson 5-7 at the top of page 302 in your textbook.
• What does the phrase linear relationship mean to you? Sampleanswer: It means that when you graph the data points on acoordinate grid, the points all lie on or close to a line thatyou could draw on the grid.
• Write three ordered pairs that fit the description as x increases, ydecreases. Sample answer: {(2, 5), (3, 3), (4, 1)}
Reading the Lesson
1. Look up the word scatter in a dictionary. How does this definition compare to the termscatter plot? One definition states “to occur or fall irregularly or atrandom.”The points in a scatter plots usually do not follow an exactlinear pattern, but fall irregularly on the coordinate plane.
2. What is a line of fit? How many data points fall on the line of fit? A line of fit showsthe trend of the data. It is impossible to say how many data points mayfall on a line of fit—maybe several, maybe none.
3. What is linear interpolation? How can you distinguish it from linear extrapolation?Linear interpolation is the process of predicting a y-value for a given x-value that lies between the least and greatest x-values in the data set.“Inter-” means between and “extra-” means beyond. If the x-value isbetween the extremes of the x-values in the data set, you sayinterpolation; if the x-value is less than or greater than the extremes,you say extrapolation.
Helping You Remember
4. How can you remember whether a set of data points shows a positive correlation or anegative correlation? If it looks like a line of fit for the points would have apositive slope, there is a positive correlation. If it looks like a line of fitwould have a negative slope, there is a negative correlation.
Reading to Learn Mathematics, p. 321
Latitude and Temperature The latitude of a place on Earthis the measure of its distancefrom the equator. What do youthink is the relationship between a city’s latitude and its January temperature? At the right is a table containing the latitudes and January mean temperatures for fifteenU.S. cities.Sample answers are given.
U.S. City Latitude January Mean Temperature
Albany, New York 42:40 N 20.7°F
Albuquerque, New Mexico 35:07 N 34.3°F
Anchorage, Alaska 61:11 N 14.9°F
Birmingham, Alabama 33:32 N 41.7°F
Charleston, South Carolina 32:47 N 47.1°F
Chicago, Illinois 41:50 N 21.0°F
Columbus, Ohio 39:59 N 26.3°F
Duluth, Minnesota 46:47 N 7.0°F
Fairbanks, Alaska 64:50 N �10.1°F
Galveston, Texas 29:14 N 52.9°F
Honolulu, Hawaii 21:19 N 72.9°F
Las Vegas, Nevada 36:12 N 45.1°F
Miami, Florida 25:47 N 67.3°F
Ri h d Vi i i 37 32 N 35 8°F
Enrichment
NAME ______________________________________________ DATE ____________ PERIOD _____
5-75-7Enrichment, p. 322
Lesson 5-7 Statistics: Scatter Plots and Lines of Fit 303
USED CARS For Exercises 16 and 17, use the scatter plot that shows the ages and prices of used cars fromclassified ads.
16. Use the points (2, 9600) and (5, 6000) to write the slope-interceptform of an equation for the line of fitshown in the scatter plot.
17. Predict the price of a car that is 7 years old. $3600
16. y � �1200x � 12,000
PHYSICAL SCIENCE For Exercises 18–23, use the following information.Hydrocarbons like methane, ethane, propane, and butane are composed of only carbon and hydrogen atoms. The table gives the number of carbon atoms and the boiling points for several hydrocarbons.
18. Draw a scatter plot comparing the numbers of carbon atoms to the boiling points. See margin.
19. Draw a line of fit for the data. See margin.20. Write the slope-intercept form of an equation for the line of fit. y � 37x � 15321. Predict the boiling point for methane (CH4), which has 1 carbon atom. �116°C22. Predict the boiling point for pentane (C5H12), which has 5 carbon atoms. 32°C23. The boiling point of heptane is 98.4°C. Use the equation of the line of fit to
predict the number of carbon atoms in heptane. 7
SPACE For Exercises 24–28, use the table that shows the amount the UnitedStates government has spent on space and other technologies in selected years.
24. Draw a scatter plot and determine what relationship, if any, exists in the data.
25. Draw a line of fit for the scatter plot. See margin.26. Let x represent the number of years since 1980. Let y represent the spending
in billions of dollars. Write the slope-intercept form of the equation for the line of fit. using (0, 4.5) and (16, 12.7), y � 0.5125x � 4.5
27. Predict the amount that will be spent on space and other technologies in 2005.
28. The government projects spending of $14.3 billion in space and othertechnologies in 2005. How does this compare to your prediction?
Used Cars
Source: Columbus Dispatch
10 3 5 72 4 6 8 9
Pric
e (t
ho
usa
nd
s o
f d
olla
rs)
Age (years)
2
4
6
8
3
5
7
9
10
11
(5, 6000)
(2, 9600)
1980 1985 1990 1995 1996 1997 1998 1999
4.5 6.6 11.6 12.6 12.7 13.1 12.9 12.4
Federal Spending on Space and Other Technologies
Year
Spending(billions of dollars)
Hydrocarbons
Number BoilingName Formula of Carbon Point
Atoms (°C)
Ethane C2H6 2 �89
Propane C3H8 3 �42
Butane C4H10 4 �1
Hexane C6H12 6 69
Octane C8H18 8 126
Source: U.S. Office of Management and Budget
www.algebra1.com/self_check_quiz
See margin.
27. about $17.3 billion28. Sample answer:less
Online ResearchFor information about a career as anaerospace engineer,visit:www.algebra1.com/careers
AerospaceEngineerAerospace engineersdesign, develop, and testaircraft and spacecraft.Many specialize in aparticular type ofaerospace product, suchas commercial airplanes,military fighter jets,helicopters, or spacecraft.
Lesson 5-7 Statistics: Scatter Plots and Lines of Fit 303
ELL

Answers
29–30.
34.
37. You can visualize a line todetermine whether the data has apositive or negative correlation.Answers should include thefollowing.
• Write a linear equation for thebest-fit line. Then substitute theperson’s height and solve forthe corresponding age.
y
xO
Hei
gh
t
Age
Inco
rrec
t A
nsw
ers
4
8
12
16
20
Correct Answers
084 12 16 20
Acr
es B
urn
ed (
tho
usa
nd
s)
0
200
400
600
800
Rainfall (in.)10 20 30
FORESTRY For Exercises 29–33, use the table that shows the number of acresburned by wildfires in Florida each year and the corresponding number of inchesof spring rainfall.
29. Draw a scatter plot with rainfall on the x-axis and acres on the y-axis.
30. Draw a line of fit for the data.
31. Write the slope-intercept form of an equation for the line of fit.
32. In 2000, there was only 8.25 inches of spring rainfall. Estimate the number ofacres burned by wildfires in 2000. 475 thousand acres
33. In 1998, there was 22.2 inches of rainfall, yet 507,000 acres were burned. Wherewas this data graphed in the scatter plot? How did this affect the line of fit?
Online Research Data Update What has happened to the number of acres burned by wildfires in Florida since 1999? Visit www.algebra1.com/data_update to learn more.
34. CRITICAL THINKING A test contains 20 true-false questions. Draw a scatter plotthat shows the relationship between the number of correct answers x and thenumber of incorrect answers y. See margin.
RESEARCH For Exercises 35 and 36, choose a topic to research that you believe maybe correlated, such as arm span and height. Find existing data or collect your own.35. Draw a line of fit line for the data. 35–36. See students’ work.36. Use the line to make a prediction about the data.
37. Answer the question that was posed at the beginning ofthe lesson. See margin.
How do scatter plots help identify trends in data?
Include the following in your answer:• a scatter plot that shows a person’s height and his or her age, with a
description of any trends, and• an explanation of how you could use the scatter plot to predict a person’s age
given his or her height.
38. Which graph is the best example of data that show a negative linear relationshipbetween the variables x and y? D
O
y
x
D
O
y
x
C
O
y
x
B
O
y
x
A
WRITING IN MATH
304 Chapter 5 Analyzing Linear Equations
33. The data point liesbeyond the maingrouping of datapoints. It can beignored as an extremevalue.
StandardizedTest Practice
Florida’s Burned Acreage and Spring Rainfall
YearRainfall Acres
YearRainfall Acres
(inches) (thousands) (inches) (thousands)
1988 17.5 194 1994 18.1 180
1989 12.0 645 1995 16.3 46
1990 14.0 250 1996 20.4 94
1991 30.1 87 1997 18.5 146
1992 16.0 83 1998 22.2 507
1993 19.6 80 1999 12.7 340
Source: Florida Division of Forestry
You can use a line of fitto describe the trend inwinning Olympic times.Visit www.algebra1.com/webquest to continuework on your WebQuestproject.
29–30. See margin.31. using (12.7, 340)and (17.5, 194) androunding, y � �30.4x � 726.3
304 Chapter 5 Analyzing Linear Equations
Intrapersonal Have students make a list of concepts from this chapterthat they feel they know well and some they may need to review. Havestudents review their lists after they complete the Study Guide andreevaluate what topics they need to study more before the chapter test.
Differentiated Instruction

Open-Ended Assessment
Writing Have students describea situation in which a scatter plotwould be a better representationof the data than a broken linegraph.
Assessment Options
Quiz (Lesson 5-7) is availableon p. 338 of the Chapter 5 ResourceMasters.
Maintain Your SkillsMaintain Your Skills
Lesson 5-7 Statistics: Scatter Plots and Lines of Fit 305
39. Choose the equation for the line that best fits the data in the table at the right. B
y � x � 4y � 2x � 3y � 7y � 4x � 5
GEOGRAPHY For Exercises 40–44, use the following information. The latitude of a place on Earth is themeasure of its distance from the equator.
40. MAKE A CONJECTURE What doyou think is the relationship betweena city’s latitude and its Januarytemperature?
41. RESEARCH Use the Internet or otherreference to find the latitude of 15cities in the northern hemisphere andthe corresponding January mean temperatures.
42. Make a scatter plot and draw a line of fit for the data.
43. Write an equation for the line of fit.
44. MAKE A CONJECTURE Find the latitude of your city and use the equation topredict its mean January temperature. Check your prediction by using anothersource such as the newspaper.
latitude 20˚ S
latitude 20˚ N
latitude 40˚ N
D
C
B
A
40. Sample answer:Cities with greater latitudes have lowerJanuary temperatures.41–44. See students’work.
Extending the Lesson
Mixed Review Write the slope-intercept form of an equation for the line that satisfies eachcondition. (Lesson 5-6)
45. parallel to the graph of y � �4x � 5 and passes through (�2, 5)
46. perpendicular to the graph of y � 2x � 3 and passes through (0, 0)
Write the point-slope form of an equation for a line that passes through eachpoint with the given slope. (Lesson 5-5)
47. 48. 49.
Find the x- and y-intercepts of the graph of each equation. (Lesson 4-5)
50. 3x � 4y � 12 4, 3 51. 2x � 5y � 8 4, �1.6 52. y � 3x � 6 �2, 6
Solve each equation. Then check your solution. (Lesson 3-4)
53. �r��
47
� � �r �
62
� �5 54. �n �
�(3�4)� � 7 �25 55. �
2x5� 1� � �
4x7� 5� 3
y
xO
(�3, �3)
m � 1
y
xO
(1, �2)
m � 3
y
xO
(�2, 3)
m � �2
x y
1 5
2 7
3 7
4 11
45. y � �4x � 3
46. y � ��12
�x
47. y � 3 � �2(x � 2)48. y � 2 � 3(x � 1)49. y � 3 � x � 3
Lesson 5-7 Statistics: Scatter Plots and Lines of Fit 305
4 Assess4 Assess

GraphingCalculatorInvestigation
TeachTeach
Getting StartedGetting StartedA Follow-Up of Lesson 5-7
Know Your Calculator Thegraphing calculator has twomodels to compute the equationof a best-fit line —
LinReg (ax+b) linear regressionMed-Med median-fit line
The linear regression methoduses a least-squares fit method todetermine the values for a and b.This utilizes calculus involvingthe distance each point is fromthe best-fit line.
The median-fit method calculatesthe medians of the coordinates ofthe data points.
Correlation Coefficient The cal-culator also displays values forr2 and r. The closer |r | is to 1, thebetter the equation fits the data.
306 Chapter 5 Analyzing Linear Equations
EARNINGS The table shows the average hourly earnings of U.S. productionworkers for selected years.
Find and graph a linear regression equation. Then predict the averagehourly earnings in 2010.
Predict using the regression equation. • Find y when x � 2010 using value on the
CALC menu.KEYSTROKES: [CALC] 1 2010
According to the regression equation, the average hourly earnings in 2010 will be about $15.97.
ENTER2ndThe graph and the coordinates of the point are shown.
Find a regression equation.• Enter the years in L1 and the earnings in L2.
KEYSTROKES: Review entering a list on page 204.
• Find the regression equation by selectingLinReg(ax+b) on the STAT CALC menu.KEYSTROKES: 4
The equation is about y � 0.30x � 588.35.
r is the linear correlation coefficient. Thecloser the absolute value of r is to 1, the betterthe equation models the data. Because the rvalue is close to 1, the model fits the data well.
Graph the regression equation. • Use STAT PLOT to graph the scatter plot.
KEYSTROKES: Review statistical plots on page 204.
• Copy the equation to the Y= list and graph. KEYSTROKES: 5 1
[1950, 2000] scl: 10 by [0, 20] scl: 5
GRAPHVARS
The equationis in the form y � ax � b.
ENTERSTAT
Regression and Median-Fit LinesOne type of equation of best-fit you can find is a linear .regression equation
Source: Bureau of Labor Statistics
1960 1965 1970 1975 1980 1985 1990 1995 1999
$2.09 2.46 3.23 4.53 6.66 8.57 10.01 11.43 13.24
Year
Earnings
www.algebra1.com/other_calculator_keystrokes
A Follow-Up of Lesson 5-7
306 Chapter 5 Analyzing Linear Equations
• Make sure students havecleared the L1 and L2 lists beforeentering new data.
• Have students completeExercises 1–5.

AssessAssess• Ask students why the calcu-
lator found two differentequations. There is more thanone way to calculate a best-fit line.
• What does the value of r tell youabout the regression equation?The closer the value is to 1 or �1,the closer the data points are to theline of that equation.
Answers
1. regression: y � 309.48x � 1555.88; median-fit: y � 311.76x � 1537.25
2. 0.9970385087; The data are verynearly linear.
3. Regression: 5579; median-fit:5590; both predictions are closeto the prediction in Example 4.But these predictions show fewerpairs of eagles in 1998.
4. regression: y � 1.23x � 3414.80;median-fit: y � 1.24x � 4454.74
5. Regression: 24,753; median-fit:23,882; the estimates both showthe number of votes increasingfrom 1996 to 2000. But both arefar from the actual number.
Graphing Calculator Investigation Regression and Median-Fit Lines 307
A second type of best-fit line that can be found using a graphing calculator is a . The equation of a median-fit line is calculated using themedians of the coordinates of the data points.
median-fit line
Find and graph a median-fit equation for the data on hourlyearnings. Then predict the average hourly earnings in 2010. Comparethis prediction to the one made using the regression equation.
Predict using the median-fit equation. KEYSTROKES: [CALC] 1 2010
According to the median-fit equation, the average hourly earnings in 2010 will be about $15.82. This is slightly less than the predicted value found using the regression equation.
ENTER2nd
ExercisesRefer to the data on bald eagles in Example 2 on pages 300 and 301.1. Find regression and median-fit equations for the data. 1–5. See margin.2. What is the correlation coefficient of the regression equation?
What does it tell you about the data? 3. Use the regression and median-fit equations to predict the number
of bald eagle pairs in 1998. Compare these to the number found inExample 3 on page 301.
For Exercises 4 and 5, use the table that shows the number of votescast for the Democratic presidential candidate in selected NorthCarolina counties in the 1996 and 2000 elections. 4. Find regression and median-fit equations for the data.5. In 1996, New Hanover County had 22,839 votes for the Democratic
candidate. Use the regression and median-fit equations to estimate thenumber of votes for the Democratic candidate in that county in 2000.How do the predictions compare to the actual number of 29,292?
1996 2000
14,447 16,284
19,458 19,281
28,674 30,921
31,658 38,545
32,739 38,626
46,543 52,457
49,186 53,907
69,208 80,787
103,429 126,911
103,574 123,466
Source: NC State Board ofElections
Find a median-fit equation.• The data are already in Lists 1 and 2. Find the
median-fit equation by using Med-Med on theSTAT CALC menu. KEYSTROKES: 3
The median-fit equation is y � 0.299x � 585.17.
Graph the median-fit equation. • Copy the equation to the Y= list and graph.
KEYSTROKES: 5 1
[1950, 2010] scl: 10 by [0, 20] scl: 5
GRAPHVARS
ENTERSTAT
Graphing Calculator Investigation Regression and Median-Fit Lines 307

Study Guide and Review
308 Chapter 5 Analyzing Linear Equations
Exercises Choose the correct term to complete each sentence.
1. An equation of the form y � kx describes a ( , linear extrapolation).2. The ratio of ( , run), or vertical change, to the (rise, ), or horizontal change,
as you move from one point on a line to another, is the slope of the line.3. The lines with equations y � �2x � 7 and y � �2x � 6 are ( , perpendicular)
lines.4. The equation y � 2 � �3(x � 1) is written in ( , slope-intercept) form.5. The equation y � ��
13
�x � 6 is written in ( , standard) form.6. The (x-intercept, ) of the equation �x � 4y � 2 is ��
12
�.y-interceptslope-intercept
point-slope
parallel
runrisedirect variation
See pages256–262.
SlopeConcept Summary
• The slope of a line is the ratio of the rise to the run.
• m � �yx
2
2
�
�
yx
1
1�
Determine the slope of the line that passesthrough (0, �4) and (3, 2).
Let (0, �4) � (x1, y1) and (3, 2) � (x2, y2).
m � �yx
2
2
�
�
yx
1
1� Slope formula
m � �2
3�
�
(�04)
� x1 � 0, x2 � 3, y1 � �4, y2 � 2
m � �63
� or 2 Simplify.
Exercises Find the slope of the line that passes through each pair of points. See Examples 1–4 on page 257.
7. (1, 3), (�2, �6) 3 8. (0, 5), (6, 2) ��12
� 9. (�6, 4), (�6, �2) undefined
10. (8, �3), (�2, �3) 0 11. (2.9, 4.7), (0.5, 1.1) 1.5 12. ��12
�, 1�, ��1, �23
�� �29
�
y
xO
(3, 2)
(0, �4)
(x1, y1)
y
xO
(x2, y2)y2 � y1
x2 � x15-15-1
ExampleExample
www.algebra1.com/vocabulary_review
Vocabulary and Concept CheckVocabulary and Concept Check
best-fit line (p. 300) constant of variation (p. 264)direct variation (p. 264)family of graphs (p. 265)linear extrapolation (p. 283)linear interpolation (p. 301)
line of fit (p. 300) negative correlation (p. 298) parallel lines (p. 292)parent graph (p. 265)perpendicular lines (p. 293)point-slope form (p. 286)
positive correlation (p. 298)rate of change (p. 258)scatter plot (p. 298) slope (p. 256)slope-intercept form (p. 272)
308 Chapter 5 Analyzing Linear Equations
Have students look through the chapter to make sure they haveincluded examples in their Foldables for each lesson of thechapter.Encourage students to refer to their Foldables while completingthe Study Guide and Review and to use them in preparing for theChapter Test.
TM
For more informationabout Foldables, seeTeaching Mathematicswith Foldables.
Lesson-by-LessonReviewLesson-by-LessonReview
Vocabulary and Concept CheckVocabulary and Concept Check
• This alphabetical list ofvocabulary terms in Chapter 5includes a page referencewhere each term wasintroduced.
• Assessment A vocabularytest/review for Chapter 5 isavailable on p. 336 of theChapter 5 Resource Masters.
For each lesson,• the main ideas are
summarized,• additional examples review
concepts, and• practice exercises are provided.
The Vocabulary PuzzleMakersoftware improves students’ mathematicsvocabulary using four puzzle formats—crossword, scramble, word search using aword list, and word search using clues.Students can work on a computer screenor from a printed handout.
Vocabulary PuzzleMaker
ELL
MindJogger Videoquizzesprovide an alternative review of conceptspresented in this chapter. Students workin teams in a game show format to gainpoints for correct answers. The questionsare presented in three rounds.
Round 1 Concepts (5 questions)Round 2 Skills (4 questions)Round 3 Problem Solving (4 questions)
MindJogger Videoquizzes
ELL

Study Guide and Review
Answers
13.
14.
15.
16.
17. y
xO
y � x32
y
xO
y � � x14
y
xO
y � x13
y
xOy � �4x
y
xO
y � 2x
Chapter 5 Study Guide and Review 309
Slope and Direct Variation Concept Summary
• A direct variation is described by an equation of the form y � kx, where k � 0.
• In y � kx, k is the constant of variation. It is also theslope of the related graph.
Suppose y varies directly as x, and y � �24 when x � 8. Write a direct variation equation that relates x and y.
y � kx Direct variation equation
�24 � k(8) Replace y with �24 and x with 8.
��
824� � �
k(88)� Divide each side by 8.
�3 � k Simplify.
Therefore, y � �3x.
Exercises Graph each equation. See Examples 2 and 3 on page 265. 13–18. See margin. 13. y � 2x 14. y � �4x 15. y � �
13
�x
16. y � ��14
�x 17. y � �32
�x 18. y � ��43
�x
Suppose y varies directly as x. Write a direct variation equation that relates x and y. See Example 4 on page 266.
19. y � �6 when x � 9 20. y � 15 when x � 2 21. y � 4 when x � �422. y � �6 when x � �18 23. y � �10 when x � 5 24. y � 7 when x � �14
y
xO
y � kx
Chapter 5 Study Guide and ReviewChapter 5 Study Guide and Review
ExampleExample
ExampleExample
See pages264–270.
5-25-2
See pages272–277.
5-35-3 Slope-Intercept Form Concept Summary
• The linear equation y � mx � b is written in slope-intercept form, where m is the slope, and bis the y-intercept.
• Slope-intercept form allows you to graph anequation quickly.
Graph �3x � y � �1.
�3x � y � �1 Original equation
�3x � y � 3x � �1 � 3x Add 3x to each side.
y � 3x �1 Simplify.
Step 1 The y-intercept is �1. So, graph (0, �1).
Step 2 The slope is 3 or �31
�. From (0, �1), move up
3 units and right 1 unit. Then draw a line.
y
xO(0, �1)
�3x � y � �1
y
xO
y � mx � b
(0, b)
19. y � ��23
�x
20. y � �125�x
21. y � �x
22. y � �13
�x
23. y � �2x
24. y � ��12
�x
Chapter 5 Study Guide and Review 309
18. y
xO
y � � x43

Study Guide and Review
Answers
31.
32.
33.
34.
35. y
xO
5x � 3y � �3
y
xO
y � � x � 143
y
xO
y � x � 3 12
y
xO
y � �x � 5
y
xO
y � 2x � 1
Chapter 5 Study Guide and ReviewChapter 5 Study Guide and Review
310 Chapter 5 Analyzing Linear Equations
Exercises Write an equation of the line with the given slope and y-intercept. See Examples 1 and 2 on pages 272 and 273.
25. slope: 3, y-intercept: 2 y � 3x � 2 26. slope: 1, y-intercept: �3 y � x � 3
27. slope: 0, y-intercept: 4 y � 4 28. slope: �13
�, y-intercept: 2 y � �13
�x � 2
29. slope: 0.5, y-intercept: �0.3 30. slope: �1.3, y-intercept: 0.4 y � 0.5x � 0.3 y � �1.3x � 0.4
Graph each equation. See Examples 3 and 4 on pages 273 and 274. 31–36. See margin. 31. y � 2x � 1 32. y � �x � 5 33. y � �
12
�x � 3
34. y � ��43
�x � 1 35. 5x � 3y � �3 36. 6x � 2y � 9
Writing Equations in Slope-Intercept Form Concept Summary
• To write an equation given the slope and one point, substitute the valuesof m, x, and y into the slope-intercept form and solve for b. Then, write theslope-intercept form using the values of m and b.
• To write an equation given two points, find the slope. Then follow thesteps above.
Write an equation of a line that passes through
(�2, �3) with slope �12
�.
y � mx � b Slope-intercept form
�3 � �12
�(�2) � b Replace m with �12
�, y with �3, and x with �2.
�3 � �1 � b Multiply.
�3 � 1 � �1 � b � 1 Add 1 to each side.
�2 � b Simplify.
Therefore, the equation is y � �12
�x � 2.
Exercises Write an equation of the line that satisfies each condition. See Examples 1 and 2 on pages 280 and 281.
37. passes through (�3, 3) 38. passes through (0, 6) with slope 1 y � x � 6 with slope �2 y � �2x � 6
39. passes through (1, 6) 40. passes through (4, �3)
with slope �12
� y � �12
�x � �121� with slope ��
35
� y � ��35
�x ��35
�
41. passes through (�4, 2) 42. passes through (5, 0) and (1, 12) y � 2x � 10 and (4, 5) y � �5x � 25
43. passes through (8, �1) 44. passes through (4, 6) with slope 0 y � �1 and has slope 0 y � 6
y
xO
(�2, �3)m � 1
2
See pages280–285.
5-45-4
ExampleExample
310 Chapter 5 Analyzing Linear Equations
36. y
xO
6x � 2y � 9

Study Guide and Review
Chapter 5 Study Guide and Review 311
Writing Equations in Point-Slope FormConcept Summary
• The linear equation y � y1�m(x � x1) is written in point-slope form,where (x1, y1) is a given point on a nonvertical line and m is the slope.
Write the point-slope form of an equation for a linethat passes through (�2, 5) with slope 3.
y � y1 � m(x � x1) Use the point-slope form.
y � 5 � 3[x � (�2)] (x1, y1) � (�2, 5)
y � 5 � 3(x � 2) Subtract.
Exercises Write the point-slope form of an equation for a line that passesthrough each point with the given slope. See Example 2 on page 287.
45. (4, 6), m � 5 46. (�1, 4), m � �2 47. (5, �3), m � �12
�
48. (1, �4), m � ��52
� 49. ��14
�, �2�, m � 3 50. (4, �2), m � 0y � 2 � 0
Write each equation in standard form. See Example 3 on page 287.
51. y � 1 � 2(x � 1) 52. y � 6 � �13
�(x � 9) 53. y � 4 � 1.5(x � 4)2x � y � �3 x � 3y � 27 3x � 2y � 20
Chapter 5 Study Guide and ReviewChapter 5 Study Guide and Review
ExampleExample
See pages286–291.
5-55-5
See pages292–297.
5-65-6
• Two nonvertical lines are parallel ifthey have the same slope.
• Two lines are perpendicular if theproduct of their slopes is �1.
y
xO
perpendicularlines
y
xO
parallellines
Geometry: Parallel and Perpendicular LinesConcept Summary
y
xO
(�2, 5)
m � 3
45. y � 6 � 5(x � 4) 46. y � 4 � �2(x � 1)
47. y � 3 � �12
�(x � 5) 48. y � 4 � ��52
�(x � 1)
ExampleExample Write the slope-intercept form for an equation of the line that passes through (5, �2) and is parallel to y � 2x � 7.
The line parallel to y � 2x � 7 has the same slope, 2.
y � y1 � m(x � x1) Point-slope form
y � (�2) � 2(x � 5) Replace m with 2, y with �2, and x with 5.
y � 2 � 2x � 10 Simplify.
y � 2x � 12 Subtract 2 from each side.
49. y � 2 �
3�x � �14
��
Chapter 5 Study Guide and Review 311

Study Guide and Review
Answer
66–67.
Answers (page 313)
2.
8.
9.
10. y
xO
2x � 3y � 9
y
xO
y � 2x � 3
y
xO
y � 3x � 1
y
xO
Wei
gh
t (l
on
g t
on
s)
10
0
20
30
4050
60
Length (ft)35 40 45 50 55 60
312 Chapter 5 Analyzing Linear Equations
Exercises Write the slope-intercept form for an equation of the line parallelto the given equation and passing through the given point.See Example 1 on page 292. 54. y � 3x � 6 55. y � �2x � 6 56. y � �6x � 854. y � 3x � 2, (4, 6) 55. y � �2x � 4, (6, �6) 56. y � �6x � 1, (1, 2)
57. y � �152�x � 2, (0, 4) 58. 4x � y � 7, (2, �1) 59. 3x � 9y � 1, (3, 0)
Write the slope-intercept form for an equation of the line perpendicular to thegiven equation and passing through the given point. See Example 3 on page 294.
60. y � 4x � 2, (1, 3) 61. y � �2x � 7, (0, �3) 62. y � 0.4x � 1, (2, �5) 63. 2x � 7y � 1, (�4, 0) 64. 8x � 3y � 7, (4, 5) 65. 5y � �x � 1, (2, �5)
See pages298–305.
5-75-760. y � ��
14
�x � �143� 61. y � �
12
�x � 3 62. y � �2.5x 63. y � ��72
�x � 14
40 42 45 46 50 52 55
25 29 34 35 43 45 51
Length (ft)
Weight (long tons)
y � �152�x � 4 y � 4x � 9 y � ��
13
�x � 1
• Extra Practice, see pages 831–833.• Mixed Problem Solving, see page 857.
Statistics: Scatter Plots and Lines of FitConcept Summary
• If y increases as x increases, then there is a positive correlation between x and y.
• If y decreases as x increases, then there is a negative correlation between x and y.
• If there is no relationship between x and y, then there is no correlation between x and y.
• A line of fit describes the trend of the data.
• You can use the equation of a line of fit to make predictions about the data.
Exercises For Exercises 66–70, use the table that shows the length and weight ofseveral humpback whales. See Examples 2 and 3 on pages 300 and 301. 66–67. See margin.
66. Draw a scatter plot with length on the x-axis and weight on the y-axis.67. Draw a line of fit for the data.68. Write the slope-intercept form of an equation for the line of fit. W � �
53
�� � �12
35
�
69. Predict the weight of a 48-foot humpback whale. 38�13
� long tons
70. Most newborn humpback whales are about 12 feet in length. Use the equation of the line of fit to predict the weight of a newborn humpback whale. Do you think your prediction is accurate? Explain. �21�2
3� long tons; No, a negative
weight is not reasonable.
No Correlation
y
xO
Negative Correlationy
xO
Positive Correlation
y
xO
64. y � ��38
�x � �123�
65. y � 5x � 15
312 Chapter 5 Analyzing Linear Equations
21–22.
Hu
man
Yea
rs
3530
404550
1050
152025
2 4 6 8
y
x

Practice Test
Chapter 5 Practice Test 313
Vocabulary and ConceptsVocabulary and Concepts
Skills and ApplicationsSkills and Applications
1. Explain why the equation of a vertical line cannot be in slope-intercept form. Vertical lines have no slope.2. Draw a scatter plot that shows a positive correlation. See margin. 3. Name the part of the slope-intercept form that represents the rate of change. slope
Find the slope of the line that passes through each pair of points.
4. (5, 8), (�3, 7) �18
� 5. (5, �2), (3, �2) 0 6. (6, �3), (6, 4) undefined
7. BUSINESS A web design company advertises that it will design and maintain a website for your business for $9.95 per month. Write a direct variation equation to find the total cost C for any number of months m. C � 9.95m
Graph each equation. 8–10. See margin.8. y � 3x � 1 9. y � 2x � 3 10. 2x � 3y � 9
11. WEATHER The temperature is 16°F at midnight and is expected to fall 2° each hour during the night. Write the slope-intercept form of an equation to find the temperature T for any hour h after midnight. T � 16 � 2h
Suppose y varies directly as x. Write a direct variation equation that relatesx and y.
12. y � 6 when x � 9 y � �23
�x 13. y � �12 when x � 4 y � �3x 14. y � �8 when x � 8 y � �x
Write the slope-intercept form of an equation of the line that satisfies eachcondition.
15. has slope �4 and y-intercept 3 y � �4x � 3 16. passes through (�2, �5) and (8, �3) y � �15
�x � 4�35
�
17. parallel to 3x � 7y � 4 and passes y � ��37
�x � �17
� 18. a horizontal line passing through (5, �8) y � �8through (5, �2)
19. perpendicular to the graph of 5x � 3y � 9 and passes through the origin y � ��35
�x
20. Write the point-slope form of an equation for a line that passes through (�4, 3) with slope �2. y � 3 � �2(x � 4)
ANIMALS For Exercises 21–24, use the table that shows therelationship between dog years and human years.21. Draw a scatter plot and determine what relationship,
if any, exists in the data. 21–22. See margin.22. Draw a line of fit for the scatter plot.23. Write the slope-intercept form of an equation for the line of fit. using (1, 15) and (7, 47), y � �1
36�x � �2
39�
24. Determine how many human years are comparable to 13 dog years. 79
25. STANDARDIZED TEST PRACTICE A line passes through (0, 4) and (3, 0). Which equation does not represent the equation of this line? B
y � 4 � ��43
�(x � 0) y � ��43
�x � 3 �x3
� � �y4
� = 1
y � 0 � ��43
�(x – 3) 4x � 3y � 12ED
CBA
1 2 3 4 5 6 7
15 24 28 32 37 42 47
DogYears
HumanYears
www.algebra1.com/chapter_test
Chapter 5 Practice Test 313
Introduction There is often more than one way to graph a line.Sometimes you use two points, sometimes you use a point and a slope,and sometimes you use the x- and y-intercepts.
Ask Students Find an equation from your work in this chapter anddescribe at least three ways in which to graph it. Place your descriptions inyour portfolio.
Portfolio Suggestion
Assessment Options
Vocabulary Test A vocabularytest/review for Chapter 5 can befound on p. 336 of the Chapter 5Resource Masters.
Chapter Tests There are sixChapter 5 Tests and an Open-Ended Assessment task availablein the Chapter 5 Resource Masters.
Open-Ended AssessmentPerformance tasks for Chapter 5can be found on p. 335 of theChapter 5 Resource Masters. Asample scoring rubric for thesetasks appears on p. A28.
TestCheck andWorksheet Builder
This networkable software hasthree modules for assessment.• Worksheet Builder to make
worksheets and tests.• Student Module to take tests
on-screen.• Management System to keep
student records.
Chapter 5 TestsForm Type Level Pages
1 MC basic 323–324
2A MC average 325–326
2B MC average 327–328
2C FR average 329–330
2D FR average 331–332
3 FR advanced 333–334
MC = multiple-choice questionsFR = free-response questions

StandardizedTest Practice
Standardized Test PracticeStudent Record Sheet (Use with pages 314–315 of the Student Edition.)
Select the best answer from the choices given and fill in the corresponding oval.
1 4 7
2 5 8
3 6 9
Solve the problem and write your answer in the blank.
For Questions 10 and 11, also enter your answer by writing each number orsymbol in a box. Then fill in the corresponding oval for that number or symbol.
10 (grid in) 10 11
11 (grid in)
12
13
Select the best answer from the choices given and fill in the corresponding oval.
14
16
15
17
Record your answers for Question 18 on the back of this paper.
DCBA
DCBA
DCBA
DCBA
0 0 0
.. ./ /
.
99 9 987654321
87654321
87654321
87654321
0 0 0
.. ./ /
.
99 9 987654321
87654321
87654321
87654321
DCBADCBADCBA
DCBADCBADCBA
DCBADCBADCBA
NAME DATE PERIOD
55
An
swer
s
Part 2 Short Response/Grid InPart 2 Short Response/Grid In
Part 3 Quantitative ComparisonPart 3 Quantitative Comparison
Part 4 Open-EndedPart 4 Open-Ended
Part 1 Multiple ChoicePart 1 Multiple Choice
Standardized Test PracticeStudent Recording Sheet, p. A1
Additional Practice
See pp. 341–342 in the Chapter 5Resource Masters for additionalstandardized test practice.
Record your answers on the answer sheetprovided by your teacher or on a sheet ofpaper.
1. If a person’s weekly salary is $x and she saves$y, what fraction of her weekly salary does shespend? (Lesson 1-1) B
�xy
� �x �
xy
�
�x �
yy
� �y �
xx
�
2. Evaluate �2x � 7y if x � �5 and y � 4. (Lesson 2-6) A
38 43
227 243
3. Find x, if 5x � 6 � 10. (Lesson 3-3) D
��54
� �110�
�156� �
45
�
4. According to the data in the table, which of thefollowing statements is true? (Lesson 3-7) C
mean age � median age
mean age median age
mean age median age
median age mode age
5. What relationship exists between the x- and y-coordinates of each of the data points shownin the table? (Lesson 4-1) D
x and y are opposites.
The sum of x and y is 2.
The y-coordinate is 1 more than thesquare of the x-coordinate.
The y-coordinate is 1 more than theopposite of the x-coordinate.
6. What is the y-intercept of the line with
equation �x3
� � �2y
� � 1? (Lesson 4-5) B
�3 �2
�23
� �32
�
7. Find the slope of a line that passes through (2, 4) and (24, 7). (Lesson 5-1) A
��12
� �12
�
�2 2
8. Which equation represents the line that passesthrough (3, 7) and (21, 21)? (Lesson 5-4) C
x � y � 10 y � �12
�x � �121�
y � 2x � 1 y � 3x � 2
9. Choose the equation of a line parallel to thegraph of y � 3x � 4. (Lesson 5-6) D
y � ��13
�x � 4 y � �3x � 4
y � �x � 1 y � 3x � 5DC
BA
DC
BA
DC
BA
DC
BA
D
C
B
A
D
C
B
A
DC
BA
DC
BA
DC
BA
Part 1 Multiple Choice
314 Chapter 5 Analyzing Linear Equations
8 1
10 3
14 2
16 1
17 2
Age Frequency
–3 4
–2 3
0 1
1 0
3 –2
5 –4
x y
314 Chapter 5 Analyzing Linear Equations
These two pages contain practicequestions in the various formatsthat can be found on the mostfrequently given standardizedtests.
A practice answer sheet for thesetwo pages can be found on p. A1of the Chapter 5 Resource Masters.
Log On for Test Practice The Princeton Review offersadditional test-taking tips and
practice problems at their web site. Visitwww.princetonreview.com orwww.review.com
TestCheck andWorksheet Builder
Special banks of standardized testquestions similar to those on the SAT,ACT, TIMSS 8, NAEP 8, and Algebra 1End-of-Course tests can be found onthis CD-ROM.

Evaluating Open-EndedAssessment Questions
Open-Ended Assessment ques-tions are graded by using a multi-level rubric that guides you inassessing a student’s knowledgeof a particular concept.
Goal: Analyze the given data todetermine the best cellularphone service plan.
Sample Scoring Rubric: Thefollowing rubric is a samplescoring device. You may wish toadd more detail to this sample tomeet your individual scoringneeds.
Test-Taking TipQuestions 14–17 Before you choose answer A,B, or C on quantitative comparison questions, askyourself: “Is this always the case?” If not, mark D.
Chapter 5 Standardized Test Practice 315
Aligned and verified by
x x � 1
the slope of any the slope of thenonvertical line line parallel to the
line in Column A
the slope of the slope of they � �2x line perpendicular
to y � �2x
www.algebra1.com/standardized_test
Column A Column B
Part 4 Open Endedx y
�1 6
0 4
1 2
2 0
3 �2
Record your answers on the answer sheetprovided by your teacher or on a sheet ofpaper.
10. While playing a game with her friends,Ellen scored 12 points less than twice thelowest score. She scored 98. What was thelowest score in the game? (Lesson 3-4) 55
11. The graph of 3x � 2y � 3 isshown at the right.What is the y-intercept?(Lesson 5-3) 1.5
12. The table of ordered pairs shows the coordinates of some of the points on the graph of a function.
What is the y-coordinate of a point (5, y) that lies on the graph of the function?(Lesson 5-4) �6
13. The equation y � 3 � �2(x � 5) is written in point-slope form. What is the slope of the line? (Lesson 5-5) �2
Compare the quantity in Column A and thequantity in Column B. Then determinewhether:
the quantity in Column A is greater,
the quantity in Column B is greater,
the two quantities are equal, or
the relationship cannot be determinedfrom the information given.
14.
A (Lesson 1-2)
15.
D (Lesson 2-1)
16.
C (Lesson 5-6)
17.
B (Lesson 5-6)
Record your answers on a sheet of paper.Show your work.
18. A friend wants to enroll for cellular phoneservice. Three different plans are available.(Lesson 5-5)
Plan 1 charges $0.59 per minute.Plan 2 charges a monthly fee of $10, plus
$0.39 per minute.Plan 3 charges a monthly fee of $59.95.
a. For each plan, write an equation thatrepresents the monthly cost C for mnumber of minutes per month.See pp. 315A–315B.
b. Graph each of the three equations.See pp. 315A–315B.
c. Your friend expects to use 100 minutesper month. In which plan do you thinkthat your friend should enroll? Explain.Plan 2; when m � 100, the cost is leastfor Plan 2.
.
D
C
B
A
y
xO
Part 3 Quantitative Comparison
Part 2 Short Response/Grid In
Column A Column B
2(x � 6) 2x � 6
Chapter 5 Standardized Test Practice 315
Score Criteria4 A correct solution that is supported
by well-developed, accurateexplanations
3 A generally correct solution, butmay contain minor flaws inreasoning or computation
2 A partially correct interpretationand/or solution to the problem
1 A correct solution with nosupporting evidence or explanation
0 An incorrect solution indicating nomathematical understanding of the concept or task, or no solution is given

Page 263, Reading Mathematics
Term Everyday MathematicalMeaning Meaning
2a. slope 1. to diverge from the the ratio of the vertical or horizontal; rise to the runincline
2. to move on a slant; ascend or descend
2b. intercept to stop, deflect, or the coordinate at interrupt the progress which a graph or intended course of intersects an axis
2c. parallel Of, relating to, or carry- lines that never ing out the simultane- intersect; nonverti-ous performance of cal lines that have separate tasks the same slope
Pages 267–270, Lesson 5-2
21. 22.
23. 24.
25. 26.
27. 28.
29. 30.
31. 32.
Page 271, Preview of Lesson 5-36. 7.
8.
Pages 275–277, Lesson 5-328. 29.
30. 31. y
xO
y � �x � 2
y
xO
y � �4x � 1
y
xO
y � x � 2
y
xO
y � 3x � 1
Len
gth
(cm
)
0
6
5
78
91011
12
Number of Washers1 2 3 4 5
y
xLe
ng
th (
cm)
0
8
6
1012
1416
Number of Washers1 2 3 4 5
y
xLe
ng
th (
cm)
0
8
6
1012
1416
Number of Washers1 2 3 4 5
y
x
yxO
y � � x92
y
xO
y � � x43
y
xO
y � � x23
y
xO
y � x15
y
xO
y � x75
y
xO
y � x52
y
xO
y � x35
y
xO
y � x14
y
xO
y � �4x
y
xO
y � �x
y
xO
y � 3x
y
xO
y � x
315A Chapter 5 Additional Answers
Addit
ion
al
An
sw
ers
for
Ch
apte
r 5

32. 33.
34. 35.
36. 37.
38. 39.
Page 279, Follow-Up of Lesson 5-3Graphing Calculator Investigation
1. All same slope of 0, different intercepts; the family is linear equations with slope of 0.
2. All same y-intercept of 1, different slopes; the family is linear equations with y-intercept of 1.
3. All positive slopes, different intercepts; the equations are not in the same family.
4. All positive slopes, different intercepts; the equations are not in the same family.
5. All same y-intercept of �2, different slopes; the family is linear equations with y-intercept of �2.
6. All same slope of 3, different intercepts; the family is linear equations with slope of 3.
Pages 289–291, Lesson 5-5
61. R�Q�: y � 3 � (x � 1) or y � 1 � (x � 3);
Q�P�: y � 1 � �2(x � 3) or y � 3 � �2(x � 1);
P�S�: y � 3 � (x � 1) or y � 1 � (x � 3);
R�S�: y � 3 � �2(x � 1) or y � 1 � �2(x � 3)
62. R�Q�: y � x � ; Q�P�: y � �2x � 5; P�S�: y � x � ;
R�S�: y � �2x � 5
63. R�Q�: x � 2y � 5; Q�P�: 2x � y � 5; P�S�: x � 2y � �5;R�S�: 2x � y � �5
64. Sample answer: The point-slope form of the equation isy � 1 � �(x � 9). Let x � 10 and y � 0. The equationbecomes 0 � 1 � �(10 � 9) or �1 � �1. Since theequation holds true, (10, 0) is a point on the linepassing through (9, 1) and (5, 5).
Pages 314–315, Standardized Test Practice
18a. Plan 1: C � 0.59m; Plan 2: C � 0.39m � 10; Plan 3: C � 59.95
18b.
0
10
20
30
40
50
60
20 40 60 80 100
C
m
C � 0.39m � 10
C � 0.59m
C � 59.95
5�2
1�2
5�2
1�2
1�2
1�2
1�2
1�2
y
xO
4x � 3y � 3
y
xO
2x � 3y � 6
y
xO
�2y � 6x � 4
y
xO
3y � 2x � 3
y
xO
2x � y � �3
y
xO
3x � y � �2
y
xO
y � � x � 313
y
xO
y � x � 412
Chapter 5 Additional Answers 315B
Additio
nal A
nsw
ers
for C
hapte
r 5