Embed Size (px)
Citation preview

Solvency II Risk Management
for Infrastructure Investments
February 22, 2018

Assetklasse “Flugzeugfinanzierungen”
2
17
26
Infrastructure as a Solvency II Asset Class
Infrastructure & Risk Management
Asset: “Infrastruktur Equity”
Ökonomisches RM (quantitativ)
Agenda
2
13 Anhang29
42 Kontakt & Vorstellung
17 Ökonomisches RM (qualitativ)
10
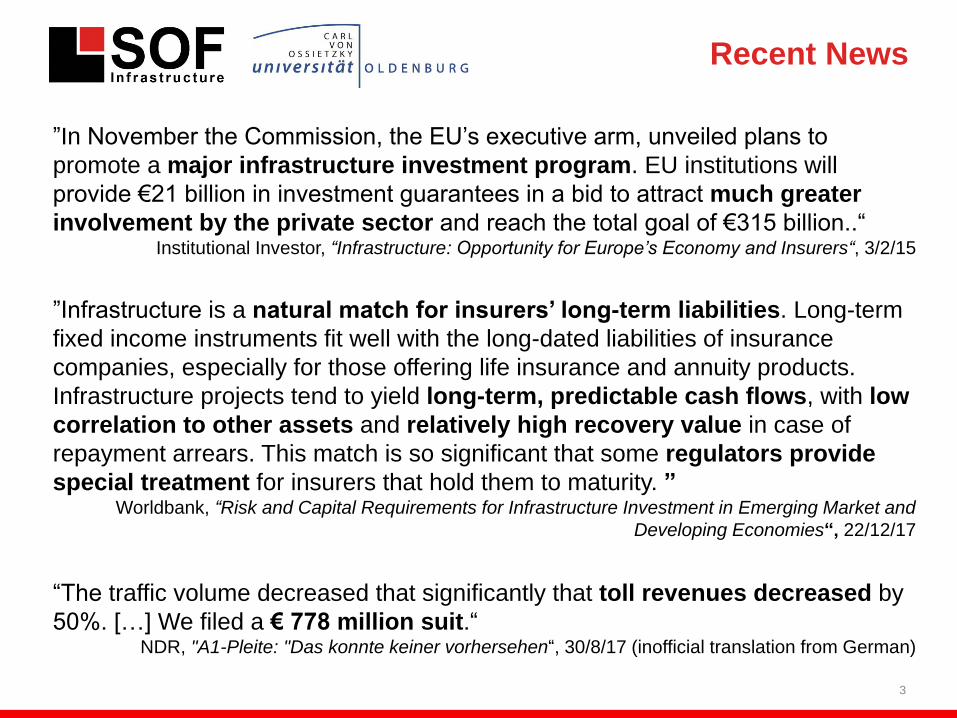
”Infrastructure is a natural match for insurers’ long-term liabilities. Long-term
fixed income instruments fit well with the long-dated liabilities of insurance
companies, especially for those offering life insurance and annuity products.
Infrastructure projects tend to yield long-term, predictable cash flows, with low
correlation to other assets and relatively high recovery value in case of
repayment arrears. This match is so significant that some regulators provide
special treatment for insurers that hold them to maturity. ”Worldbank, “Risk and Capital Requirements for Infrastructure Investment in Emerging Market and
Developing Economies“, 22/12/17
“The traffic volume decreased that significantly that toll revenues decreased by
50%. […] We filed a € 778 million suit.“NDR, "A1-Pleite: "Das konnte keiner vorhersehen“, 30/8/17 (inofficial translation from German)
”In November the Commission, the EU’s executive arm, unveiled plans to
promote a major infrastructure investment program. EU institutions will
provide €21 billion in investment guarantees in a bid to attract much greater
involvement by the private sector and reach the total goal of €315 billion..“Institutional Investor, “Infrastructure: Opportunity for Europe’s Economy and Insurers“, 3/2/15
Recent News
3

Investment Case:
Value Drivers & Risks
4
Tokarevich, Düsterlho (2018) in Insurance Asset Risk. „FAQ: investing in infrastructure under Solvency II”

Investment Case:
Example
5
Infrastructure Loan Government Bond
Market value EUR 100,000,000
(at par)
EUR 93,000,000
(below par)
Purpose of financing Operating management of a tunnel in
UK & France
Government activities of
Italy
Currency EUR EUR
Residual maturity in years 33 30
Listing / External rating No / No (internal rating CQS 3) Yes / CQS 3 (e.g. BBB)
Mod. duration in years 17.6 19.5
Coupon 3.75%, semi-annual 2.7% (of EUR 100,000,000), semi-annual
Return / IRR / Yield to Maturity 3.63% 3.05%
Z spread 1.9% Ca. 1.5%
Solvency II pillar 1 spread risk EUR 18,500,000
(qualifying infrastructure investment)
EUR 0
(government bond)
Economic spread risk EUR 27,600,000
(approximated by the pillar 1 spread
shock for a CQS 3 bond)
EUR 29,500,000
(approximated by the pillar 1 spread
shock for a CQS 3 bond)
Reduction of the economic market risk
through diversification
EUR 20,670,000
(Correlation = 0.25)
EUR 7,360,000
(Correlation = 0.75)
Reduction of the Solvency II interest
rate risk (interest rate down)
EUR 1,200,000 EUR 3,500,000
Operational requirements Higher Lower
Regulatory risk Higher Lower

Investment Case:
Possible Conclusion
6
Lower contribution to the economic market risk (spread) on the portfolio level due
to the stronger diversification benefit
(EUR 6.9m (infrastructure) vs. EUR 22.1m (government bond))
-> Infrastruktur kann sich als Beimischung zu liquiden Portfolios eignen, da
hier der Diversifikationseffekt am höchsten ist
• Higher infrastructure spread compared to the government bond due to the
illiqudity premium and the complexity premium amongst others
• Higher operational requirements and regulatory risks for the infrastructure
loan compared to the government bond
-> Infrastructure could be a suitable complement to liquid Solvency II
portfolios due to the diversification benefit
-> Effective and standardised investment processes could reduce the operational
expenses and thus increase the net spread
-> Ineffecient or ineffective investment processes could reduce the net spread
Please note: Further factors such as regulatory capital requirements or interest rate
risks could play an important role based on the specific requirements of an
individual insurance investor

▪ Wirtschaftliche Definitionen nach Sektoren /
Risikoprofil
• Economic(e.g. transport, energy, IT, environment,...)
• Social(e.g. education, health, sports,…)
• Institutional(e.g. administration, defense,…)
Example
Wind park
selling electricity to
a car manufacturer
for its own usage
Economic: yes
Solvency II: no
Definitions
Economic definition based on sectors / risk profiles*
Wirtschaftliche Definitionen nach Sektoren /
Risikoprofil
• physical assets, structures, facilities, systems, networks
• provide or support
• essential public services
Solvency II definition based on the intended use**
**see Article 55a DR 2015/35 and EIOPA papers such as EIOPA-16-490
*e.g. see Trunzer (1980), “Infrastrukturinvestitionen und Wirtschaftswachstum“
7
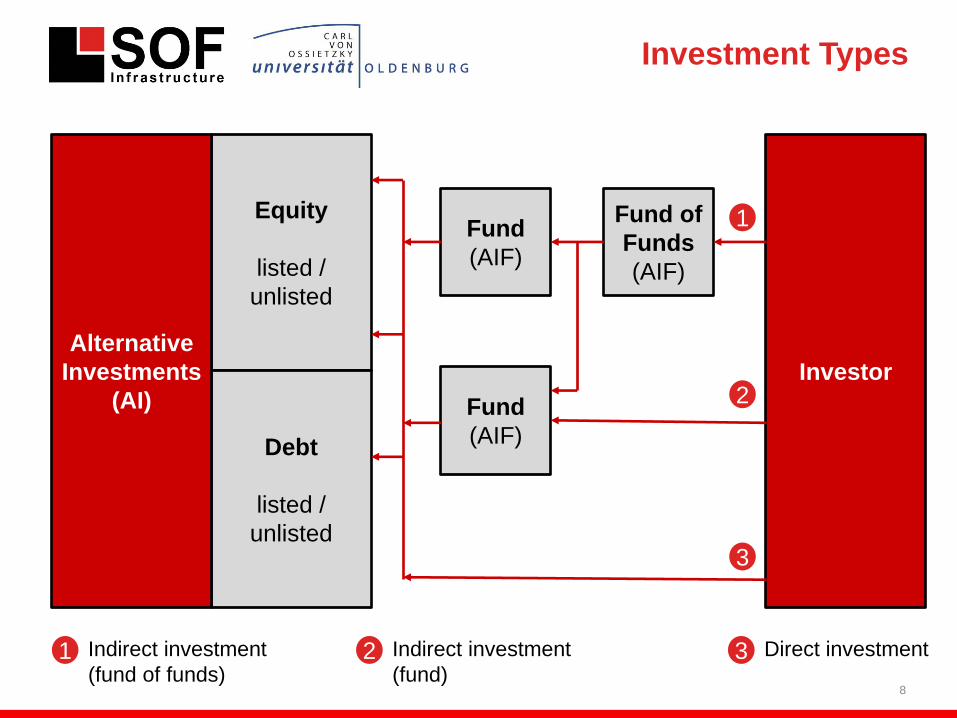
Investment Types
8
Equity
listed /
unlisted
Debt
listed /
unlisted
Alternative
Investments
(AI) Fund
(AIF)
Investor
Fund of
Funds
(AIF)
Fund
(AIF)
3
1
2
1 Indirect investment
(fund of funds)2 Indirect investment
(fund)3 Direct investment

Solvency II Requirements
9
Solvency II Requirements for Infrastructure Investments
Pillar 1 Pillar 3Pillar 2
Valuation according to
the Fair Value
Hierarchy• Market prices
• Peer group
• Valuation model
Capital requirement
(SCR)*• Equity risk
(Type 1 / Type 2 / QI / QIC)**
• Spread risk(Loan/ Securitisation / QI / QIC)**
• Interest rate risk
• FX risk
• For funds: Look-through
Prudent Person
Principle (PPP)• Security, quality, liquidity,
and profitability of the
portfolio
• Risk management
requirements for
• Non-routine investments
• Illiquid investments
*Only material SCR modules are in scope of this presentation
** QI = qualifying infrastructure investment; QIC = qualifying infrastructure corporate investment
Further process
requirements• ORSA including own risk
assessments, stress tests &
look-through
• Outsourcing
Reporting to the
supervisor (RSR +
QRT) / Disclosure
(SFCR)
• Quantitative Reporting
Templates (QRTs) for
• Infrastructure investments
• Fair Value (model)
valuation
• SCR
• For Fonds: Look-through
• Description of the risk profile
• Description of processes
including risk management
Assetklasse “Flugzeugfinanzierungen”
2
17
26
Infrastructure as a Solvency II Asset Class
Infrastructure & Risk Management
Asset: “Infrastruktur Equity”
Ökonomisches RM (quantitativ)
Agenda
10
13 Anhang29
42 Kontakt & Vorstellung
17 Ökonomisches RM (qualitativ)
10

Characteristics & Risks
11
Typical Characteristics
• Key importance for the real economy
-> collaboration with the public
sector is often required
• Usually (de facto) monopolies,
especially with regard to revenues
• Long-term regular cash flows
• Relatively high barriers to entry
• Relatively high investment volumes
Typical Risks
• Construction risk (greenfield)
• Revenue risk
• Operational risk
• Financial risk
• Sponsor risk
• Project risk & other risks
• Corporate risks

Historical Default Rates
12
Quelle: S&P. Lessons Learned From 20 Years Of Rating Global Project Finance Debt. 2014.
=> The occurance of the construction risk and the revenue risk historically
led to the most frequent defaults
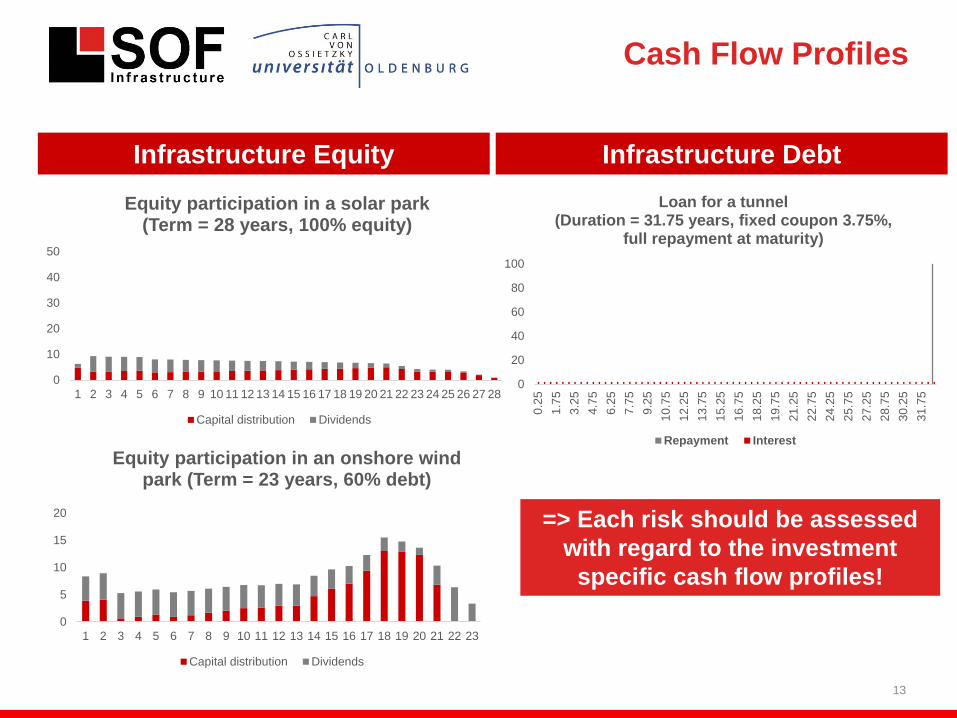
Cash Flow Profiles
13
Infrastructure Equity Infrastructure Debt
0
10
20
30
40
50
1 2 3 4 5 6 7 8 9 10 11 12 13 14 15 16 17 18 19 20 21 22 23 24 25 26 27 28
Equity participation in a solar park(Term = 28 years, 100% equity)
Capital distribution Dividends
0
20
40
60
80
100
0.2
5
1.7
5
3.2
5
4.7
5
6.2
5
7.7
5
9.2
5
10.7
5
12.2
5
13.7
5
15.2
5
16.7
5
18.2
5
19.7
5
21.2
5
22.7
5
24.2
5
25.7
5
27.2
5
28.7
5
30.2
5
31.7
5
Loan for a tunnel(Duration = 31.75 years, fixed coupon 3.75%,
full repayment at maturity)
Repayment Interest
0
5
10
15
20
1 2 3 4 5 6 7 8 9 10 11 12 13 14 15 16 17 18 19 20 21 22 23
Equity participation in an onshore wind park (Term = 23 years, 60% debt)
Capital distribution Dividends
=> Each risk should be assessed
with regard to the investment
specific cash flow profiles!

SCR – Infrastructure Equity
Assumption: Symmetric Adjustment = 2.4% (30/9/17)
QI
• Up to 37% or
19 percentage points less than
for type 2 equities
• Up to 22% or
9 percentage points less than for
type 1 equities
QIC
• Up to 25% or
13 percentage points less
than for type 2 equities
• Up to 7% or 3 percentage points
less than for type 1 equities
31%
37%40%
50%
0%
10%
20%
30%
40%
50%
60%
QI QIC Unqualifying(Type 1 AIF)
Unqualifying(Type 2 AIF)
SCR Equity Risk for Infrastructure Equity
Equity Risk
14

SCR – Infrastructure Debt
8%
13%
17%
20%
9%
15%
19%
23%
15%
24%
30%
36%
0%
5%
10%
15%
20%
25%
30%
35%
40%
5 10 15 20
SCR Spread Risk for Unrated Debt withDifferent Modified Durations
QI QIC Unqualifying
Rating (CQS) BB
(4)
Unrated BBB (3)
Loan 44% 30% 25%
QI 44% 17% 17%
QIC 44% 19% 19%
Securitisation 100% 100% 45%-
100%
Example for modified duration = 15 years
QI• Up to 44% or
16 percentage points less than
for an unrated unqualifying loan
• Up to 32% or
8 percentage points less than for
an unqualifying BBB rated loan
QIC• Up to 36% or
13 percentage points less than
for an unrated unqualifying loan
• Up to 24% or
6 percentage points less than for
an unqualifying BBB rated loan
General• Unrated QI / QIC =
BBB rated QI / QIC
Spread Risk
15
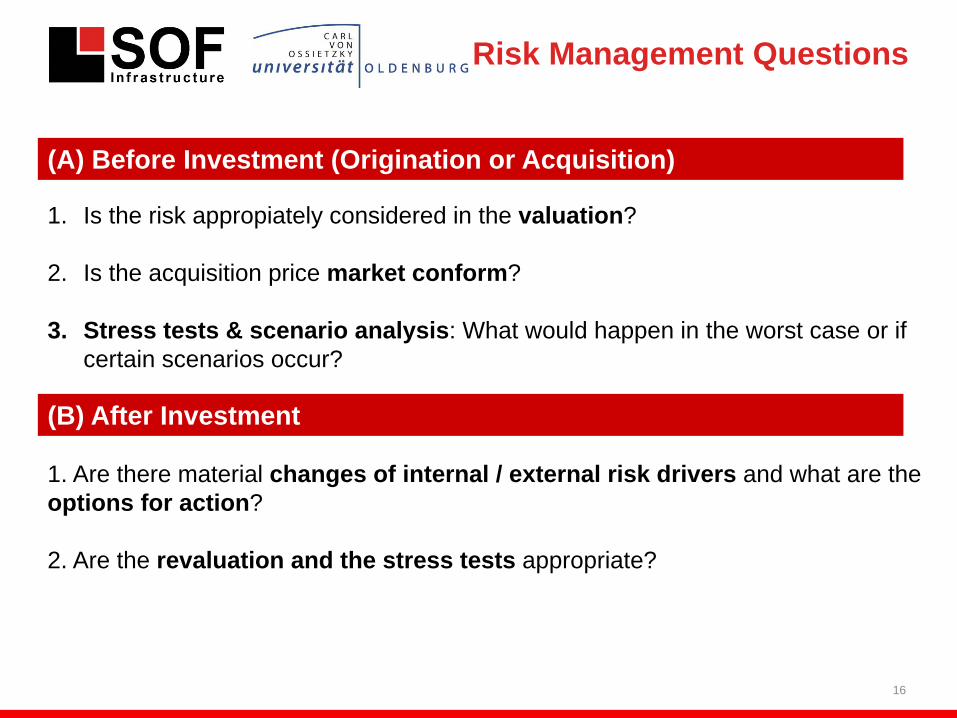
16
(A) Vor Investition (Gewährung oder Erwerb)
1. Is the risk appropiately considered in the valuation?
2. Is the acquisition price market conform?
3. Stress tests & scenario analysis: What would happen in the worst case or if
certain scenarios occur?
(B) Nach Investition
1. Are there material changes of internal / external risk drivers and what are the
options for action?
2. Are the revaluation and the stress tests appropriate?
Risk Management Questions
(A) Before Investment (Origination or Acquisition)
(B) After Investment

17
(A.1) Valuation Methods
Fair Value Valuation
Market Approach Income Approach Replacement Cost
• Price of recent
investment
• Multiples
• Industry Valuation
Benchmarks
• (Available Market Prices)
• DCF methods* • Net Assets
See e.g. IPEV. International Private Equity and Venture Capital Valuation Guidelines. December 2015.
*Industry Best Practice

18
(A.1) Valuation Risks
Commercial Due Diligence (DD)
• Future revenues & market forecasts
• Business model
Financial & Tax DD
• Tax & financial risks from the internal
structure and the external environment
Legal DD
• Legal risks from agreements &
regulations
Other DD (e.g. technical)
• e.g. technical condition of the assets
Financial
Model
Assumptions
Calculations
Theoretical
Value
Cash
Flows
Other
indicators
Investment
Risks
Model
Risks
Assumptions
Assumptions
Assumptions

(A.1) Valuation Risks:
Examples
NCHRP. Estimating Toll Road Demand and Revenue. 2008.
Significant deviations of
material input parameters
such as toll road revenue
forecasts possible

20
(A.1) Valuation Risks:
Mitigants
Managing Valuation Risks
Model Process
• Identification and usage of other
independent data (e.g. through
further DD)
• Definition of further assumptions
as a case may be
• Validation of the implementation
of DD assumptions in the model
• Stress tests & sensitivity analysis
• Governance &
separation of functions
• Transparent &
comprehensive process
• Effective controls
• Documented valuation
guidelines
• Validation with other
models (e.g. multiples)
• Model audit
(e.g. recalculation)
• Stress tests &
Sensitivity analysis
Inputs
See e.g. Art. 67-74 Delegated Regulation (EU) 231/2013.

21
(A.2) Market Conformity
(1) Transaction parameters (2) Market parameters
• Model value & transaction price
• Financial / operational indicators
(e.g. IRR, rating, feed-in tariff)
• Market prices (e.g. latest transaction price)
• Comparable transactions / asset prices
• Financial / operational indicators
(e.g. IRR, rating, feed-in tariff)
• Choose the method for the market-conformity assessment
• Define the benchmark / comparative market, eliminate outliers
• Determine the market-conformity interval (e.g. IRR 7%-8%)
• Ensure the comparability between (1) and (2) through adjustments (e.g. leverage), compare (1) &
(2) and assess the market conformity
“Fund transactions that are not market-conform are generally prohibited. Exceptions are admitted for
transactions that benefit the investor (e.g. transactions at beneficial prices […]). For special AIF
(„Spezial-AIF“) exceptions are admitted for transactions that are not market-conform where the transaction
is approved by all investors, is objectively reasonable and documented.“
BaFin. Zf. 4.6.10. BaFin-Rundschreiben 01/2017 (WA).10.01.2017. (inofficial translation from German)

22
(A.3) Stress tests &
scenario analysis (1)
IAA. Stress Testing and Scenario Analysis. Juli 2013.

23
(A.3) Stress tests &
scenario analysis (2)
Valuation / Base Case
(= expected risk)
• Cash Flows
• Cost of Capital
• Other parameters
Worst Case (= unexpected risk)
• Stress tests
• Reverse stress tests
• Scenario analysis
• (Back testing)
Assumptions
(1) “How much“ risk is already contained in the
base case?
-> starting point for the definition of stress cases
(2) Calibration & application
(2.1) Data
• Historical (e.g. market data)
• Forecasts (e.g. worst case in DD)
• Expert judgement
(2.2) Methods
• Point of time vs. period of time
• Qualitative vs. quantitative
• Historical vs. hypothetical
• Deterministic vs. stochastic
(3) Impact analysis
• Target variable
(Net Present Value, returns, cash flows, DSCR)
• Analysis, discussion and decisions
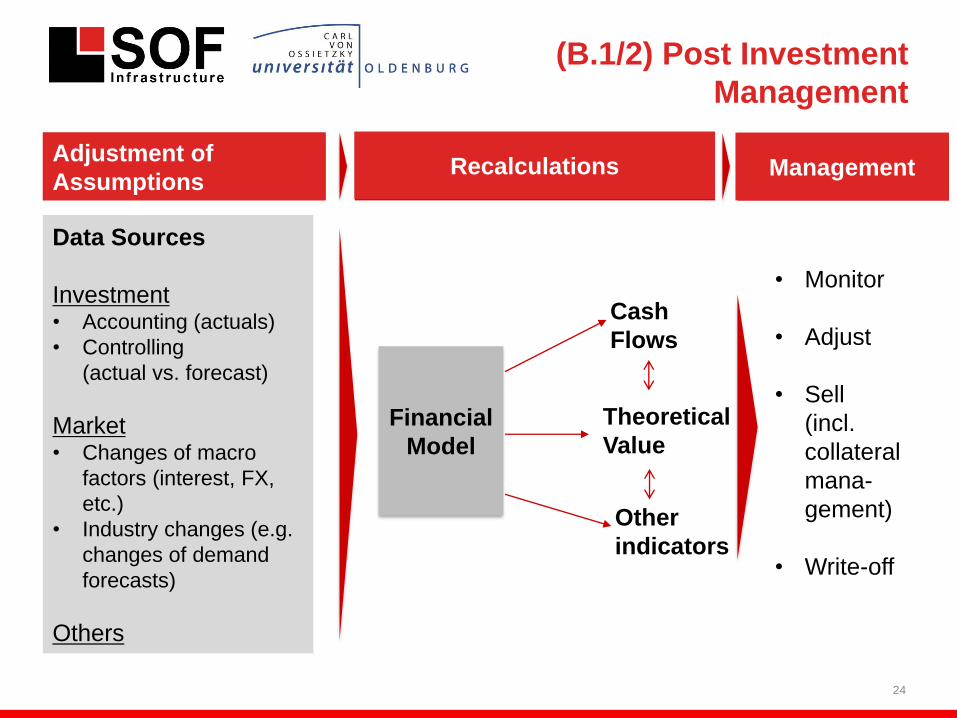
24
(B.1/2) Post Investment
Management
Data Sources
Investment• Accounting (actuals)
• Controlling
(actual vs. forecast)
Market• Changes of macro
factors (interest, FX,
etc.)
• Industry changes (e.g.
changes of demand
forecasts)
Others
Financial
Model
Adjustment of
Assumptions
• Monitor
• Adjust
• Sell
(incl.
collateral
mana-
gement)
• Write-off
Recalculations ManagementAdjustment of
AssumptionsRecalculations Management
Theoretical
Value
Cash
Flows
Other
indicators

25
Case Study “Eurotunnel”
Folie 25
Text and image source: Vilanova. Financial distress, lender
passivity and project finance: the case of Eurotunnel. Juni 2005.
*See also: Moody‘s. Moody's assigns Baa2 ratings to Notes to
be issued by Channel Link Enterprises Finance; stable outlook.
9.5.17.
1987 Financing via IPO (ca. 700.000 equity investors) und 220 banks (junior debt)
for ca. GBP 6 bn
1987 - 1994 Construction phase with significant budget overruns (GBP 4 bn) and time overruns
1994 Construction completed
1995 Suspension of an interest payment to junior debtholders
1995 - 1998 Financial restructuring
Until 2004 Significant deviations of the actual revenues from the budget
2007 Restructuring and debt relief
2017 Equity: 5y performance: > 80%
Senior Bonds Rating: Baa2 (CQS = 3)*

26
Indirect Investments
Alternative
Investment
Fund (AIF)
Solvency II
Balance Sheet
(Assets)
Target Investment 1
Target Investment n
…
SII-Investor• Portfolio manager
• Risk manager
AIFM*• Portfolio manager
• Risk manager
Fund shares Participations,
loans,
fund shares
Manages fund
assets (e.g. in
accordance with AIFMD)
Manages
own assets
according to Solvency II
(1) Object of the investment and risk management activities
• Fund share (no look-through):
• Assessment of the fund share as a whole
(e.g. investment guidelines before the investment, benchmarking with other funds)
• Assessment of the AIFM (Manager Due Diligence)
• Target investments (look-through):
• Separate assessment of each individual target investment; sometimes veto / approval rights
(2) Division of responsibilities between the SII Investor and the AIFM
• Acceptance of the AIFM data without controls vs. additional own assessments
• Outsourcing requirements vs. double work
*AIFM = Alternative Investment Fund Manager
27
Conclusions
• Infrastructure investments might have characteristics that are suitable to a
Solvency II balance sheet such as diversification effects, reduction of the
interest rate risk, excess returns and reduced SCR (QI / QIC)
• An effective and efficient investment & risk management process
designed under the proportionality principle is a key success driver and has to
fulfil various regulatory requirements
• Indirect investments require a clear division of responsibilities between the
fund manager (AIFM) and the Solvency II investor under consideration of
outsourcing provisions and the efficiency aspects (double work)
Contact
Get in touch!
28
Jegor Tokarevich
Partner (SOF / SOFI)
DE: + 49 (0) 174 497 857 3
UK: + 44 (0) 748 208 226 1
www.sof-ltd.com
Disclaimer
The information contained in this presentation is confidential and must not be disclosed to any other party. The Recipient should conduct its own independent
investigation and assessment as to the validity of the information contained in this presentation, and the economic, financial, regulatory, legal, taxation, stamp duty
and accounting implications of that information. The Recipient confirms that it is not relying on any recommendation or statement of SOF Infrastructure Ltd.. Except
as required by law, SOF Infrastructure Ltd. and its respective directors, officers, employees, agents and consultants make no representation or warranty as to the
accuracy or completeness of the information contained in this presentation, and take no responsibility under any circumstances for any loss or damage suffered as a
result of any omission, inadequacy, or inaccuracy in this presentation. This presentation may contain certain forward-looking statements, forecasts, estimates,
projections and opinions ("Forward Statements"). No representation is made or will be made that any Forward Statements will be achieved or will prove to be correct.
Actual future results and operations could vary materially from the Forward Statements. Similarly no representation is given that the assumptions disclosed in this
presentation upon which Forward Statements may be based are reasonable. The Recipient acknowledges that circumstances may change and the contents of this
presentation may become outdated as a result. The Recipient acknowledges that neither it nor SOF Infrastructure Ltd. intends that SOF Infrastructure Ltd. act or be
responsible as a fiduciary to the Recipient, its management, stockholders, creditors or any other person. Source: SOF Infrastructure Ltd.
SOF Infrastructure Ltd (SOFI) is an appointed representative of Aldgate Advisors Ltd which is authorised and regulated by the Financial Conduct Authority. SOFI may
provide certain regulated investment services concerning infrastructure investments and is registered with the FCA. Further information is provided on the website of
FCA: https://register.fca.org.uk/.


![Infrastruktur TI [Compatibility Mode]](https://img.pdfslide.us/doc/110x75/546a9f97b4af9fe5268b4898/infrastruktur-ti-compatibility-mode.jpg)