Embed Size (px)
Citation preview

Solvency II reporting across the UK and IrelandLCP survey August 2017

2 LCP Pillar 3 survey — August 2017
The data analysed in this report was sourced from Solvency II Wire Data and the company disclosures. Solvency II Wire Data provides detailed information about the Solvency II figures, enabling users to build reports and view changes over time to better understand the impact of Solvency II.
The data is available via subscription from https://solvencyiiwiredata.com/landing-page/
This report may be reproduced in whole or in part, without permission, provided prominent acknowledgement of the source is given. The report is not intended to be an exhaustive analysis of the Solvency II regulations. Although every effort is made to ensure that the information in this report is accurate, Lane Clark & Peacock LLP accepts no responsibility whatsoever for any errors, or omissions, or the actions of third parties. Information and conclusions are based on what an informed reader may draw from each company’s Solvency and Financial Condition Report, the supporting public Quantitative Reporting Templates and from other publicly available information. None of the companies has been contacted to provide additional explanation or further details.
For further copies of the report, please download a PDF copy from our website www.lcp.uk.com, email [email protected] or contact Nelly Geudin on +44 (0)20 7432 6710.
© Lane Clark & Peacock LLP August 2017
We would like to thank those from LCP who have made this report possible:
Lizzie CavillJessica ClarkJohn ClementsCharl CronjeCat DrummondRichard FootmanOliver GrossmanSteve HillGill HoyleVanessa HughesDeclan LavelleLaura McMasterDorothy MendozaRob MurrayRebeccah RobinsonJames SandowJinita ShahKate SinclairSarah Yu
For further information please contact Cat Drummond or the partner who normally advises you.

3LCP Pillar 3 survey — August 2017
4Introduction
6Executive summary
7At a glance
8Quantitative Reporting Templates
20Solvency and Financial Condition Reports
26Tips and trip hazards
28Survey constituents and other notes
Contents

4 LCP Pillar 3 survey — August 2017
1. Introduction
Welcome to LCP’s review of the Solvency II reporting produced by 100 of the largest non-life insurers in the UK and Ireland.

5LCP Pillar 3 survey — August 2017
Firms are still finding their feet in the first year of public reporting under Solvency II. The Solvency and Financial Condition Reports and supporting Quantitative Reporting Templates provide a window into the inner workings of insurers. We’ve peered in, and gained insights into the financial strength of insurers in the UK and Ireland, how they run their businesses, and how they communicate with the outside world.
Our conclusion is that financial strength is generally good, but firms can do more to improve the quality and value of their public reporting. This will not only show that they take compliance seriously, but also help develop another tool in their arsenal to positively promote their business to key stakeholders.
Cat Drummond Partner
6 LCP Pillar 3 survey — August 2017
2. Executive summary
Solvency II went live on 1 January 2016, bringing a new era for European insurance regulation. As part of the new regime, insurers and reinsurers are now required to publicly disclose key metrics relating to their financial strength together with details of how they manage their business.
We have analysed the Solvency and Financial Condition Reports (SFCRs) and public Quantitative Reporting Templates (QRTs) for 100 of the top non-life insurers in the UK and Ireland.
The aim of the review was twofold – to analyse the numbers disclosed by firms for the first time and to consider how well firms have dealt with the narrative reporting required of them under Solvency II.
We have also drawn upon our Pillar 3 roundtables with insurers and reinsurers across the market to understand how the first year of submissions has worked in practice.
Our key conclusions are:
• Insurers are generally sufficiently capitalised, but the buffers firms have in place to protect against balance sheet volatility may not be enough to prevent them from having to recapitalise over the short term.
• Motor insurers typically have the least financial headroom, compared with other insurers.
• Brexit is on the agenda for many insurers, with some firms setting up internal steering groups to ensure they are well placed to access the European Market after the UK leaves the EU.
• Uncertainty around the Ogden discount rate used to calculate personal injury compensation payments poses a material risk to some insurers, with two firms disclosing that the recent change required them to recapitalise significantly.
• Firms must work harder to publish better quality QRTs, with over a quarter of the firms we reviewed disclosing QRTs containing obvious errors.
• Some firms’ SFCRs are not fully compliant with the Solvency II regulations, with particular areas of weakness including disclosure around sensitivity testing of the SCR and uncertainty within technical provisions.

7LCP Pillar 3 survey — August 2017
Firms who see Brexit as a key risk
Firms publishing QRTs containing errors
Firms noting the Ogden discount rate change as a material event
3. At a glance
Firms who had insufficient capital to cover their SCR at the balance sheet date
Total gross written premium (non-life)
Total gross Solvency II technical provisions (non-life)
Firms who have a 15% chance of needing to recapitalise over the next year
See page 8
See page 14 See page 15
See page 10
Risk margin as a percentage of net best estimate non-life technical provisions (aggregated)
See page 13
See page 18 See page 19
See page 13
23%
9%
36%
£65bn
2 23
£87bn
Over a quarter

8 LCP Pillar 3 survey — August 2017
4. Quantitative Reporting Templates
Overall financial strengthThe Quantitative Reporting Templates provide a window into the finances of Solvency II regulated firms. Details include the Solvency II balance sheet, regulatory capital requirements and recent claims experience.
The charts below show those firms with the most and least capital coverage, according to their Solvency II disclosures.
Eligible own funds ratio - top twenty
Eligible own funds ratio - bottom twenty
0%
200%
400%
600%
800%
1000%
1200%
1400%
Rat
io o
f elig
ible
ow
n fu
nds t
o SC
R
UK insurersIrish insurers
Gresh
am
Assur
ed G
uara
nty
St And
rews
WPA
Sompo Ja
pan N
ipponk
oa
Irish
Pub
lic B
odies
Housto
n Cas
ualty
Com
pany
Avon
UnipolR
e
StarS
tone VHI
Mitsui
Sum
itom
o Eur
ope
Stone
bridge
Inte
rnat
iona
l
Simply
Health
Acc
ess
Wre
n
Stewar
t Titl
e
Newlin
e
Pinnac
le
Endur
ance
World
wide
Samsu
ng F
ire &
Mar
ine
Rat
io o
f elig
ible
ow
n fu
nds t
o SC
R
UK insurersIrish insurers
0%
20%
40%
60%
80%
100%
120%
140%
AXA Irela
nd
QBE Re
Europe
Sabre
RSA Irela
ndFBD XL
Tokio M
arin
e Kiln
AXA UK
Chubb E
urope
Equine
and
Live
stock
Covéa
Starr
Tokio M
illenn
ium
Re
AIG E
urope
Live
rpool V
ictoria
Tradex
Tesco
Und
erwrit
ing
Exete
r Frie
ndly
Society
Ageas
Ambac
Assur
ance
Around a third of the firms we analysed disclosed eligible own funds ratios in the range 125% - 150%.

9LCP Pillar 3 survey — August 2017
The average ratio of the excess funds eligible to cover the Solvency Capital Requirement (eligible own funds ratio) was 206%. The highest ratio was disclosed by Gresham, part of the Aviva Group, whose eligible own funds were nearly 12 times its regulatory capital as at 31 December 2016. Ambac Assurance and Ageas were the only two firms to disclose that they had insufficient capital to cover their SCRs as at 31 December 2016.
Ambac Assurance, which is in run-off, notes that its significant capital shortfall is expected to persist for a number of years. In addition, they note that a post balance sheet litigation settlement has improved the position slightly, but that there is no current prospect of a capital injection to rectify the position. That said, they state that the company has sufficient resources to meet obligations as they fall due.
Ageas identified the Lord Chancellor’s decision to change the personal injury discount rate (Ogden rate) as a key factor in the Solvency II ratio falling below 100%. The report describes the actions taken to remediate this, which included issuing an additional £50m of share capital and the purchase of a whole account stop loss reinsurance treaty in April 2017.
Insurer typeWe classified insurers according to whether they wrote more than 50% of their gross written premiums in a single Solvency II line of business. Those who did not were classed as “multi-line”. The following graph sets out our findings of how capital coverage varies by type of insurer.
Eligible own funds ratio by insurer type
0%
200%
400%
600%
800%
1000%
1200%
Credit
and su
rety
ship
Inco
me
prote
ctio
n
Proper
ty (d
irect
and
non-
prop R
I)
Marine
, avia
tion,
trans
port (d
irect
and n
on-pro
p RI)
Medica
l exp
ense
Gener
al lia
bility
Misc. fi
nanc
ial lo
ss
Legal
expen
ses
Multi-
line
Assist
ance
Motor (
liabilit
y an
d oth
er)
Elig
ible
ow
n fu
nds /
SC
R 50%-75%25%-50%
AverageTotal range
4. Quantitative Reporting Templatescontinued
Motor insurers typically have the least excess capital compared with insurers that write other lines of business.
10 LCP Pillar 3 survey — August 2017
4. Quantitative Reporting Templatescontinued
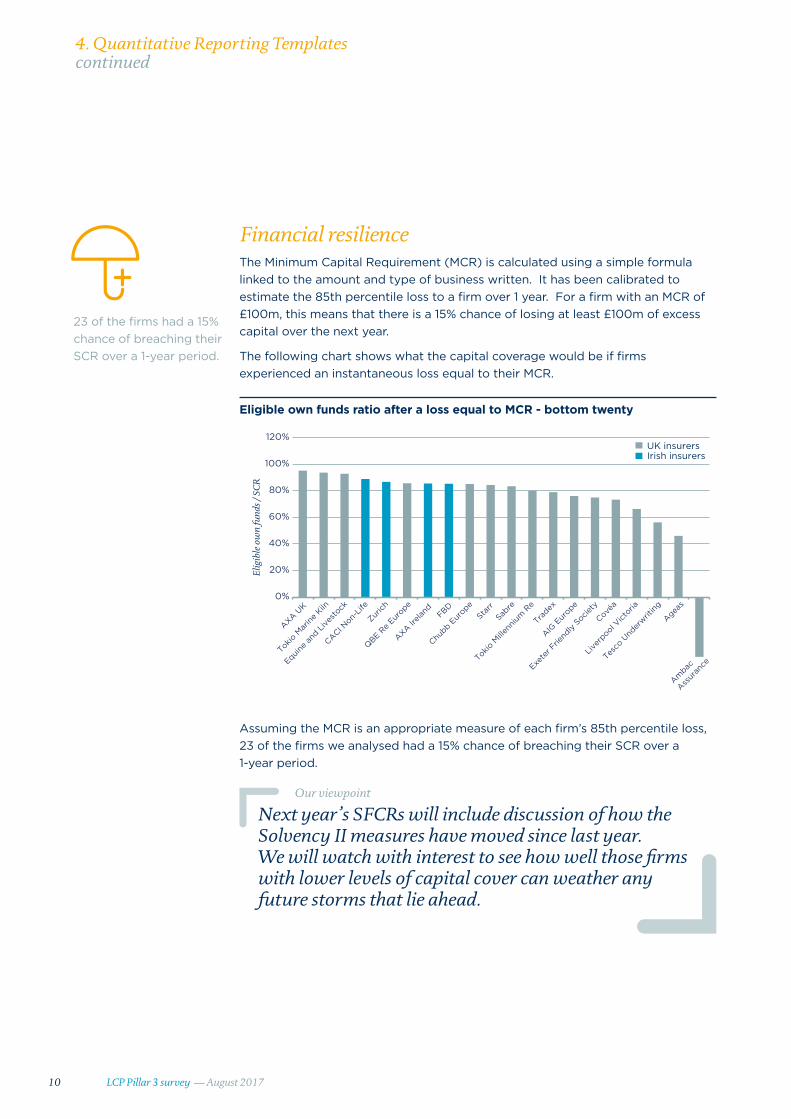
Financial resilienceThe Minimum Capital Requirement (MCR) is calculated using a simple formula linked to the amount and type of business written. It has been calibrated to estimate the 85th percentile loss to a firm over 1 year. For a firm with an MCR of £100m, this means that there is a 15% chance of losing at least £100m of excess capital over the next year.
The following chart shows what the capital coverage would be if firms experienced an instantaneous loss equal to their MCR.
Eligible own funds ratio after a loss equal to MCR - bottom twenty
0%
20%
40%
60%
80%
100%
120%
Elig
ible
ow
n fu
nds /
SC
R
UK insurersIrish insurers
AXA UK
Tokio M
arin
e Kiln
Equine
and
Live
stock
CACI Non-
Life
Zurich
QBE Re
Europe
AXA Irela
nd FBD
Chubb E
urope
Starr
Sabre
Tokio M
illenn
ium
Re
Tradex
AIG E
urope
Exete
r Frie
ndly
Society
Covéa
Live
rpool V
ictoria
Tesco
Und
erwrit
ing
Ageas
Ambac
Assur
ance
Assuming the MCR is an appropriate measure of each firm’s 85th percentile loss, 23 of the firms we analysed had a 15% chance of breaching their SCR over a 1-year period.
Next year’s SFCRs will include discussion of how the Solvency II measures have moved since last year. We will watch with interest to see how well those firms with lower levels of capital cover can weather any future storms that lie ahead.
Our viewpoint
23 of the firms had a 15% chance of breaching their SCR over a 1-year period.

11LCP Pillar 3 survey — August 2017
4. Quantitative Reporting Templatescontinued
Calculating regulatory capitalUnder Solvency II, firms may calculate their regulatory capital using the standard formula set out in the regulations or opt for a partial or full internal model (subject to regulatory approval) to better reflect their own risk profile.
Percentage of firms using SF/PIM/IM
Standard formulaPartial internal modelFull internal model
80%
6%
14%
80% of the firms we analysed were using the standard formula, with around 70% of the remaining firms using full internal models.
In the run up to Solvency II going live, a key incentive to obtain regulatory approval for a full or partial internal model was to reduce capital requirements. However, regulators, particularly the UK’s Prudential Regulation Authority, have been vocal in their expectations that firms will not be allowed to “game the system” or have regulatory capital that drifts down over time.
The following chart shows the ratio of eligible own funds to SCR for standard formula, partial and full internal model firms.
Eligible own funds ratio
0%
200%
400%
600%
800%
1000%
1200%
1400%
Standard formula Partial internal model Full internal model
Elig
ible
ow
n fu
nds /
SC
R
50%-75%
25%-50%
Average
Total range
The average ratio for standard formula firms was 217%, whereas the averages for partial and full internal model firms were 146% and 173% respectively.

12 LCP Pillar 3 survey — August 2017
4. Quantitative Reporting Templatescontinued
Key risksInsurers must consider their exposures to insurance business, investment markets, defaults by counterparties and operational risks.
The following charts set out the contribution of each risk to firms’ SCRs.
Undiversified risk as a proportion of diversified SCR
0%
20%
40%
60%
80%
100%
120%
140%
Non-life insurance
Market Counterparty Operational Diversification
25%-50% 50%-75% Average Total range
Und
iver
sifi
ed r
isk
/ SC
R
15% of firms showed market risk as the greatest risk and 5% showed counterparty default risk as the greatest risk. These are all on an undiversified basis.
Non-life insurance
Health insurance
Life insurance
Market
Counterparty
Capital add-ons already set
Operational
65%11%
15%
5% 2% 1%
1%
Percentage of firms by largest risk area

13LCP Pillar 3 survey — August 2017
4. Quantitative Reporting Templatescontinued
Allianz disclosed undiversified market risk of £1,020m, compared with its overall diversified SCR of £829m. Key drivers of its market risk exposures were identified as credit spread risk and inflation risk, primarily driven by its corporate bond holdings and defined benefit pension scheme.
Three firms – British Gas, Tradex and Trans Re London – held capital add-ons that have been agreed with the Prudential Regulation Authority. Tradex’s add-on of £9.7m, which is held in respect of its reinsurance arrangements, was the greatest contributor to its overall SCR.
Trans Re London and British Gas both disclosed their intention to develop or extend existing partial internal models to better model key aspects of their risk exposures that were identified as the drivers for their add-ons.
Firms used their narrative reports to highlight their key risks. Perhaps unsurprisingly, Brexit and the recent changes to the Ogden discount rate were highlighted by a number of firms as key risks to the future performance of the business.
BrexitFBD, Greenlight Reinsurance, VHI and Zurich all highlighted the risk of Brexit to the Irish economy, with a further 19 UK firms identifying this as a material risk to the business. Possible impacts focused on the potential loss of passporting rights, changes in gilt yields on the value of asset holdings, losses due to adverse changes in exchange rates and an increased risk of insurance fraud and theft losses. QBE Insurance Europe and QBE Re Europe reported setting up a specific Brexit Steering Group to ensure they are well placed to access the European Market post-Brexit.
Ogden discount rateThe UK Lord Chancellor’s announcement in February to reduce the discount rate used to value lump sum awards in personal injury claims from 2.5% pa to minus 0.75% pa saw many insurers ramp up their estimates of the cost of future claims. 36 firms mentioned the change, with 12 of these firms identifying this as being a key risk to the business. Ageas identified the rate change as a key factor in the Solvency II ratio falling below 100% (see page 9). Tesco Underwriting also noted that the effect resulted in shareholders injecting a further £31m of capital to improve the capital coverage ratio.
Defined benefit pension schemesAround a third of firms disclosed having defined benefit (DB) pension schemes which expose them to additional market and longevity risks. It is widely accepted that the standard formula does not allow appropriately for pensions risk, in particular not capturing the inflation risk exposures that such schemes often pose. DB pensions are becoming legacy issues as these schemes close to new entrants and to the accrual of future benefits. Despite this, the long term nature of the liabilities means that DB pensions will be an issue for insurers for many years to come if they do not take steps to address this risk.
23 firms identified Brexit as a material risk to the business.
14 LCP Pillar 3 survey — August 2017
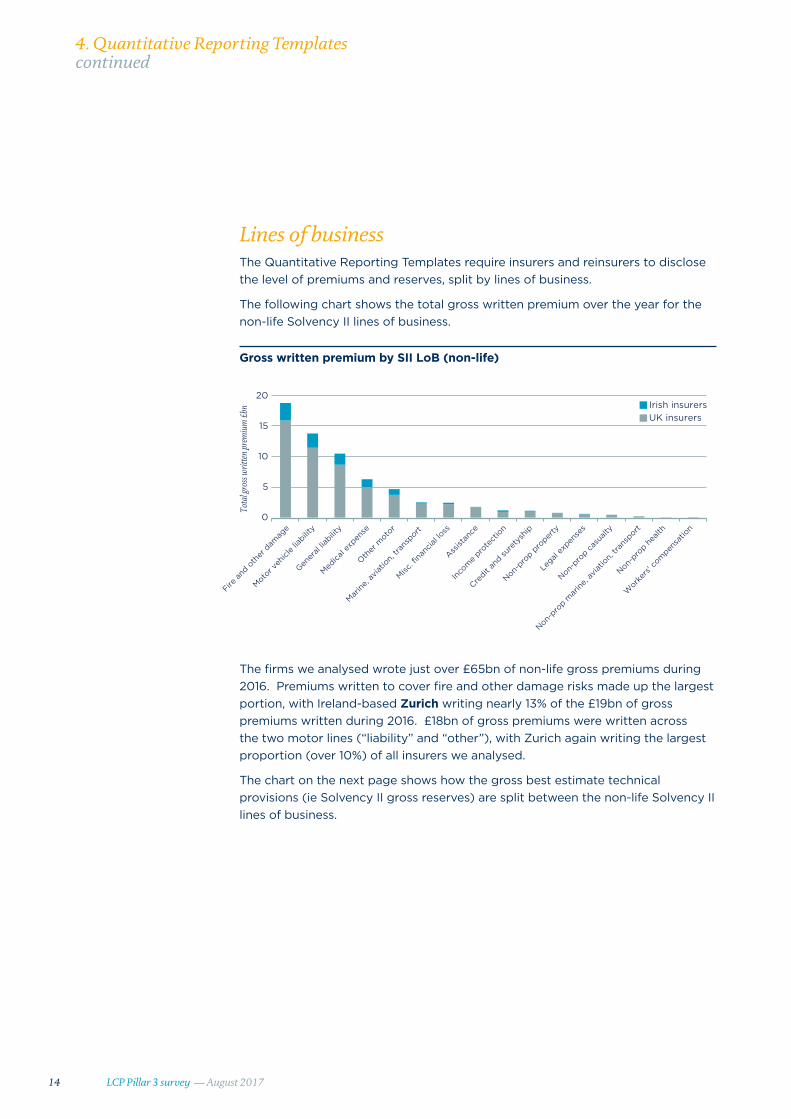
Lines of businessThe Quantitative Reporting Templates require insurers and reinsurers to disclose the level of premiums and reserves, split by lines of business.
The following chart shows the total gross written premium over the year for the non-life Solvency II lines of business.
Gross written premium by SII LoB (non-life)
The firms we analysed wrote just over £65bn of non-life gross premiums during 2016. Premiums written to cover fire and other damage risks made up the largest portion, with Ireland-based Zurich writing nearly 13% of the £19bn of gross premiums written during 2016. £18bn of gross premiums were written across the two motor lines (“liability” and “other”), with Zurich again writing the largest proportion (over 10%) of all insurers we analysed.
The chart on the next page shows how the gross best estimate technical provisions (ie Solvency II gross reserves) are split between the non-life Solvency II lines of business.
4. Quantitative Reporting Templatescontinued
Fire a
nd o
ther
dam
age
Motor v
ehicl
e lia
bility
Gener
al lia
bility
Medica
l exp
ense
Other
moto
r
Misc. fi
nanc
ial lo
ss
Marine
, avia
tion,
trans
port
Assist
ance
Inco
me
prote
ctio
n
Credit
and su
rety
ship
Non-pro
p pro
perty
Legal
expen
ses
Non-pro
p cas
ualty
Non-pro
p mar
ine, a
viatio
n, tra
nsport
Work
ers'
com
pensa
tion
Non-pro
p hea
lth0
5
10
15
20
Tota
l gro
ss w
ritte
n pr
emiu
m £
bn
Irish insurersUK insurers

15LCP Pillar 3 survey — August 2017
4. Quantitative Reporting Templatescontinued
Gross best estimate technical provisions by SII LoB (non-life)
Irish insurersUK insurers
Fire a
nd o
ther
dam
age
Motor v
ehicl
e lia
bility
Gener
al lia
bility
Medica
l exp
ense
Other
moto
r
Credit
and su
rety
ship
Non-lif
e an
nuiti
es
Non-pro
p casu
alty
Misc. fi
nanc
ial lo
ss
Marine
, avia
tion,
trans
port
Assist
ance
Inco
me
prote
ctio
n
Non-pro
p pro
perty
Legal
expen
ses
Non-pro
p mar
ine, a
viatio
n, tra
nsport
Work
ers’
com
pensa
tion
Non-pro
p hea
lth 0
5
10
15
20
25
30
35
40
Tot
al g
ross
bes
t est
imat
e £
bn
The firms we analysed were holding nearly £87bn of best estimate technical provisions on their balance sheets, which reduced to £57bn after allowing for expected reinsurance recoveries. 70%, or £61bn, of these gross liabilities were in respect of liability lines, which is typically long-tailed business, where claims can take years to be reported and settled.
Firms held more than £3bn of gross best estimate technical provisions in respect of annuities stemming from non-life insurance contracts. These liabilities are typically due to periodical payment orders (PPOs), which are life-long regular compensation payments payable to the victims of catastrophic injuries.
We expect to see PPO liabilities, which are typically very long-tailed (often being paid for 50 years or more), becoming an even more material part of insurers’ balance sheets. This is starting to become evident for UK insurers, where these have been more routinely awarded to claimants since around 2008. We expect the balance sheets of Irish insurers to follow suit in due course, once the recent draft changes in legislation to permit PPOs are finalised.
Our viewpoint
Firms held more than £3bn of gross best estimate technical provisions in respect of annuities stemming from non-life insurance contracts.
16 LCP Pillar 3 survey — August 2017
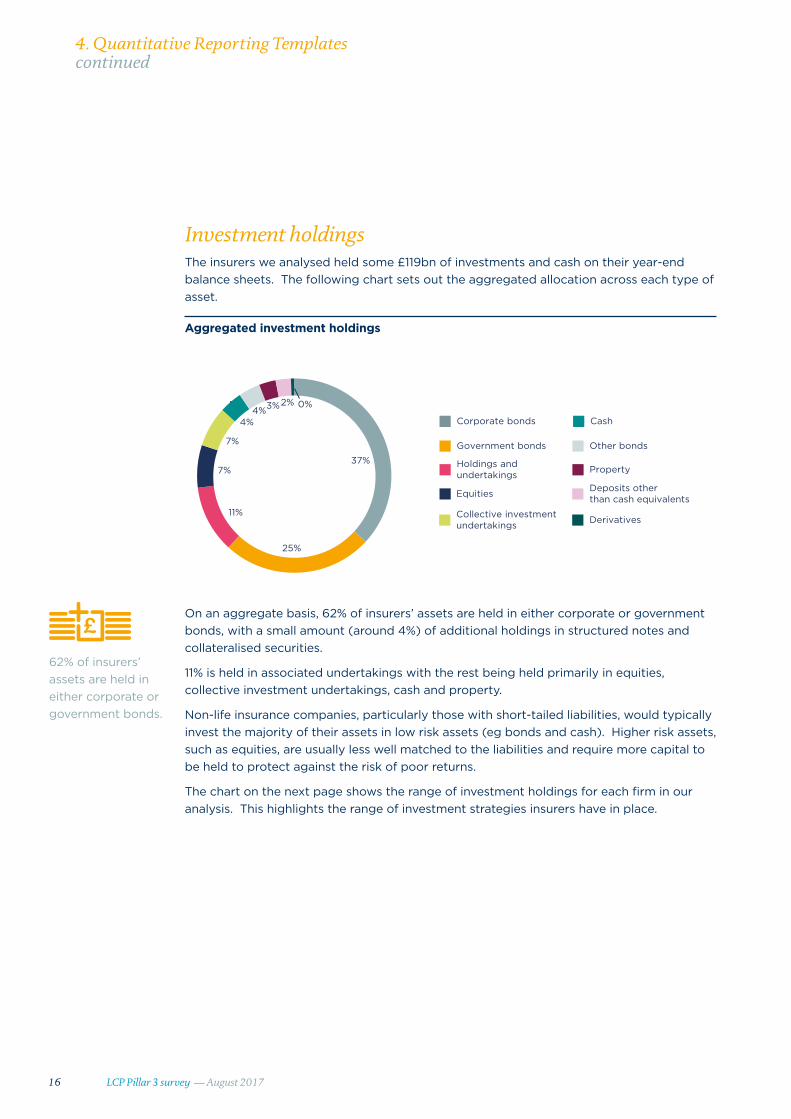
Investment holdingsThe insurers we analysed held some £119bn of investments and cash on their year-end balance sheets. The following chart sets out the aggregated allocation across each type of asset.
On an aggregate basis, 62% of insurers’ assets are held in either corporate or government bonds, with a small amount (around 4%) of additional holdings in structured notes and collateralised securities.
11% is held in associated undertakings with the rest being held primarily in equities, collective investment undertakings, cash and property.
Non-life insurance companies, particularly those with short-tailed liabilities, would typically invest the majority of their assets in low risk assets (eg bonds and cash). Higher risk assets, such as equities, are usually less well matched to the liabilities and require more capital to be held to protect against the risk of poor returns.
The chart on the next page shows the range of investment holdings for each firm in our analysis. This highlights the range of investment strategies insurers have in place.
4. Quantitative Reporting Templatescontinued
Aggregated investment holdings
37%
25%
11%
7%
7%
4%4%3%2% 0%
Collective investment undertakings
CashCorporate bonds
Holdings and undertakings
Deposits other than cash equivalentsEquities
Derivatives
Property
Other bondsGovernment bonds
62% of insurers’ assets are held in either corporate or government bonds.
17LCP Pillar 3 survey — August 2017
4. Quantitative Reporting Templatescontinued
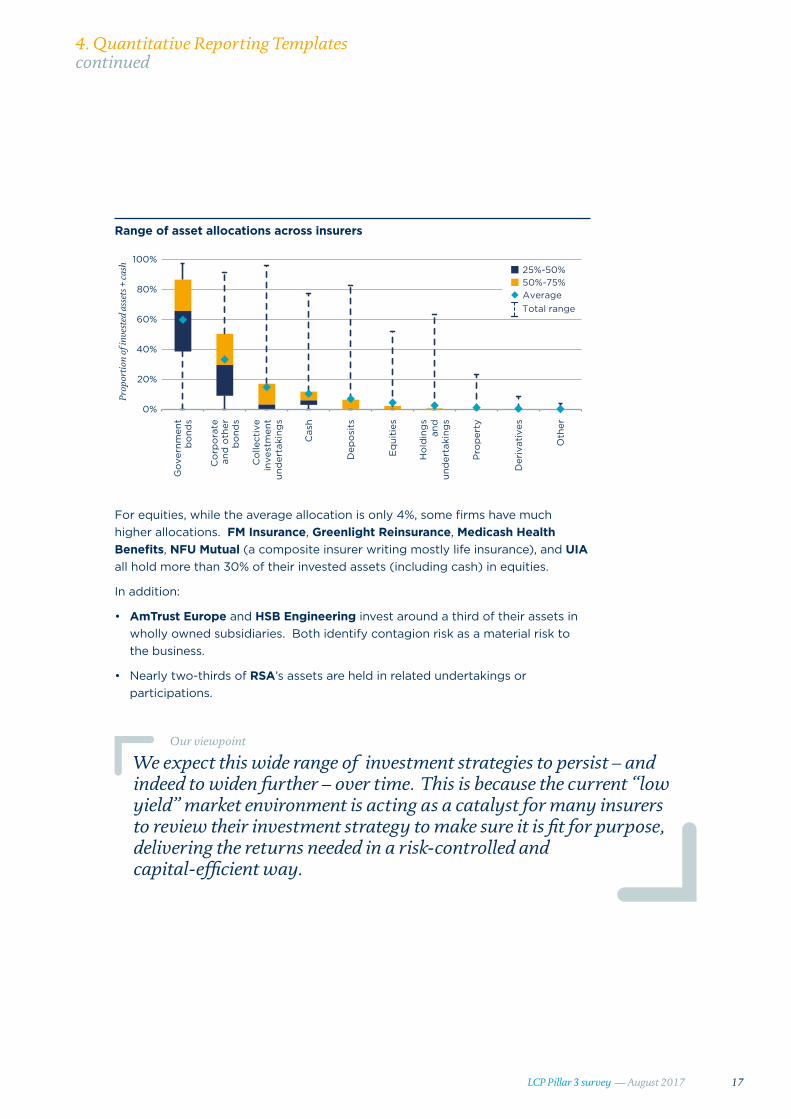
Range of asset allocations across insurers
0%
20%
40%
60%
80%
100%
Go
vern
men
tb
ond
s
Co
rpo
rate
and
oth
erb
ond
s
Co
llect
ive
inve
stm
ent
und
erta
king
s
Cas
h
Dep
osi
ts
Eq
uiti
es
Ho
ldin
gs
and
und
erta
king
s
Pro
per
ty
Der
ivat
ives
Oth
er
Prop
orti
on o
f inv
este
d as
sets
+ c
ash
50%-75%25%-50%
AverageTotal range
For equities, while the average allocation is only 4%, some firms have much higher allocations. FM Insurance, Greenlight Reinsurance, Medicash Health Benefits, NFU Mutual (a composite insurer writing mostly life insurance), and UIA all hold more than 30% of their invested assets (including cash) in equities.
In addition:
• AmTrust Europe and HSB Engineering invest around a third of their assets in wholly owned subsidiaries. Both identify contagion risk as a material risk to the business.
• Nearly two-thirds of RSA’s assets are held in related undertakings or participations.
We expect this wide range of investment strategies to persist – and indeed to widen further – over time. This is because the current “low yield” market environment is acting as a catalyst for many insurers to review their investment strategy to make sure it is fit for purpose, delivering the returns needed in a risk-controlled and capital-efficient way.
Our viewpoint

18 LCP Pillar 3 survey — August 2017
Risk marginFirms must hold a risk margin on their balance sheets. This is intended to represent the additional amount that another entity would need to be paid to take on the insurance liabilities, over and above the value of the net best estimate technical provisions. This measure has been heavily criticised, particularly in the case of longer-term liabilities, and may be an area that is revised as part of an overall review of Solvency II.
The following table shows the aggregated risk margin as a proportion of aggregated technical provisions.
The average risk margin was 9% of the net best estimate technical provisions when aggregated across non-life lines of business.
4. Quantitative Reporting Templatescontinued
Risk margin as a percentage of best estimate technical provisions
Credit
and su
rety
ship
Non-lif
e an
nuiti
es
Non-pro
p casu
alty
Non-pro
p pro
perty
Non-pro
p hea
lth
Legal
expen
ses
Misc. fi
nanc
ial lo
ss
Gener
al lia
bility
Inco
me
prote
ctio
n
Marin
e, av
iatio
n, tra
nsport
Assist
ance
Fire a
nd o
ther
dam
age
Other
moto
r
Motor v
ehicl
e lia
bility
Medica
l exp
ense
Work
ers'
com
pensa
tion
Non-pro
p mar
ine,
aviat
ion,
trans
port
Gross
Net
0%
10%
20%
30%
40%
50%
60%
Ris
k m
argi
n / b
est e
stim
ate
tech
nica
l pro
visi
ons
The risk margin has been a heavily criticised aspect of Solvency II with many firms lobbying to improve the calculation or scrap it completely.

19LCP Pillar 3 survey — August 2017
4. Quantitative Reporting Templatescontinued
Upon deeper inspection, the underlying figures for each firm are highly variable. This variability may be driven by the specifics of each business, for example the timing of reinsurance purchase relative to the financial year end.
In other cases, firms have allocated their risk margin to lines of business inappropriately or inconsistently. For example, 9 firms disclosed negative risk margins at a line of business level. 16 firms took a simplified approach to the allocation. Rather than allowing for the different levels of risk within each line of business, 14 firms allocated the risk margin in proportion to net technical provisions and 2 firms allocated it on a gross basis.
It remains to be seen whether changes to the risk margin will be picked up as part of future reviews of Solvency II. In the meantime, we encourage firms to review their allocation methodology to check that it is appropriate in the context of their business.
Our viewpoint
Overall qualityThe quality of many of the disclosures was disappointing, with over a quarter of firms publishing QRTs containing obvious errors. Key issues included disclosures in the wrong units, figures that were internally inconsistent and forms that were incomplete.
We have set out a list of the common pitfalls on page 27.
We encourage firms to spend more time ensuring their QRTs pass muster. Having a “second pair of eyes” or applying a simple checklist can help avoid having to re-publish disclosures. This will not only save time in the long run but also reduce the risk of public embarrassment.
Our viewpoint
Over a quarter of firms published QRTs containing obvious errors.
20 LCP Pillar 3 survey — August 2017
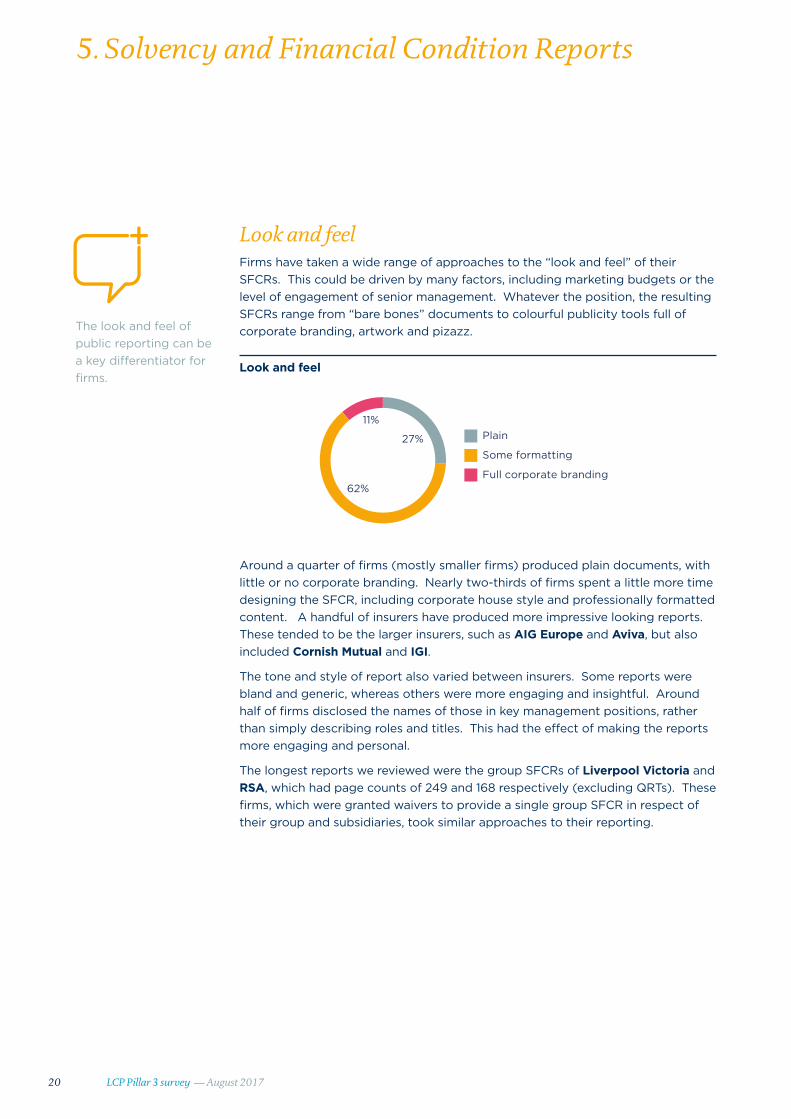
Look and feelFirms have taken a wide range of approaches to the “look and feel” of their SFCRs. This could be driven by many factors, including marketing budgets or the level of engagement of senior management. Whatever the position, the resulting SFCRs range from “bare bones” documents to colourful publicity tools full of corporate branding, artwork and pizazz.
Look and feel
Plain
Some formatting
Full corporate branding
27%
62%
11%
Around a quarter of firms (mostly smaller firms) produced plain documents, with little or no corporate branding. Nearly two-thirds of firms spent a little more time designing the SFCR, including corporate house style and professionally formatted content. A handful of insurers have produced more impressive looking reports. These tended to be the larger insurers, such as AIG Europe and Aviva, but also included Cornish Mutual and IGI.
The tone and style of report also varied between insurers. Some reports were bland and generic, whereas others were more engaging and insightful. Around half of firms disclosed the names of those in key management positions, rather than simply describing roles and titles. This had the effect of making the reports more engaging and personal.
The longest reports we reviewed were the group SFCRs of Liverpool Victoria and RSA, which had page counts of 249 and 168 respectively (excluding QRTs). These firms, which were granted waivers to provide a single group SFCR in respect of their group and subsidiaries, took similar approaches to their reporting.
The look and feel of public reporting can be a key differentiator for firms.
5. Solvency and Financial Condition Reports

21LCP Pillar 3 survey — August 2017
A simple page count can be misleading because each firm lays its report out differently (eg including tables of content, glossaries, section dividers, blank space to help with pagination and additional content not required by the regulations).
Therefore, to improve consistency, we analysed the number of pages of narrative content. RSA’s group SFCR had the most content1 at 124 pages, and the shortest was Cornish Mutual’s at 17 pages. There were 45 pages of narrative content, on average.
The chart below shows how the narrative length of the SFCRs varied by company.
Narrative length1 compared to SCR
UK insurersIrish insurers
1
10
100
1000
10000
0 20 40 60 80 100 120 140
SCR
£ m
illio
ns (c
onve
rted
)
Report length (pages)
The length of the narrative is positively correlated with the size of the SCR – that is, firms with a higher SCR are more likely to write longer SFCRs than those firms with lower SCRs. Nevertheless, the range is wide, which is driven in part by the number of lines of business firms write, their overall complexity and (possibly) how seriously they take Pillar 3 reporting.
5. Solvency and Financial Condition Reportscontinued
1 Total length equals length of summary plus sections A-E only.

22 LCP Pillar 3 survey — August 2017
The following chart shows the content firms have dedicated to each required section of the SFCR. On average, the “Capital Management” section is the shortest of the five core areas, despite having more compliance requirements than the others.
Length of each section
0
5
10
15
20
25
30
35
40
45
Summary Section A: Business andPerformance
Section B: System of
Governance
Section C: Risk Profile
Section D: Valuation
for solvency purposes
Section E: Capital
Management
Num
ber
of p
ages
of c
onte
nt
50%-75%25%-50%AverageTotal range
The “Valuation for solvency purposes” section, which sets out details on how firms have valued their assets and liabilities under Solvency II, had the greatest variation in length. Equine and Livestock provided 2 pages describing their Solvency II balance sheet, including only a high-level description of the methodology used to calculate the Solvency II Technical Provisions. On the other hand, NFU Mutual’s group SFCR provided nearly 40 pages of content. Whilst this was partly driven by separate descriptions of the life and non-life business, the approach to describing the Technical Provisions was far more detailed than others typically provided.
Some commentators have berated firms for not including sufficient detail, while others have suggested that short can be sweet. In reality, the length of the SFCR will be highly dependent on the nature and complexity of the business. We recommend firms aim to comply with the regulations as concisely as possible, avoiding jargon and unnecessary detail and using diagrams and charts to improve clarity.
Our viewpoint
5. Solvency and Financial Condition Reportscontinued

23LCP Pillar 3 survey — August 2017
ComplianceChapter XII of the Delegated Regulation sets out what should be included in an SFCR. With nearly 100 separate requirements, firms must work hard to ensure they comply with what’s needed. Those who don’t will be open to criticism from regulators, analysts, the media and other interested parties.
Overall, firms broadly complied with the “clearer cut” requirements, but struggled with the more descriptive points, or those that could arguably give sensitive information to competitors.
Five firms, Cornish Mutual, IGI, Medicash Health Benefits, Tokio Millenium Re and UnipolRe, failed to include a summary at the beginning of the report.
Firms are required to disclose the amount of expected profit included in the future premiums allowed for within their technical provisions. More than a third of firms failed to comply with this requirement, instead requiring readers to scour the publicly disclosed Quantitative Reporting Templates in search of this figure.
Around a third of firms who disclosed that they outsourced significant parts of their activities did not include details of where their providers were based.
Two firms, Equine & Livestock and AMT Mortgage Insurance, did not disclose the public Quantitative Reporting Templates at all, opting to weave the relevant figures into the narrative reporting. It remains to be seen whether this interpretation of the Solvency II requirements will be allowable in practice.
Firms should consider undertaking post-release reviews of their SFCRs to identify where they may be non-compliant, to compare their initial efforts to their peers and to find out how they can make the most of their public disclosures.
Our viewpoint
5. Solvency and Financial Condition Reportscontinued
Many firms’ publications fell short of full compliance with the requirements.
24 LCP Pillar 3 survey — August 2017
Narrative contentUncertainty within technical provisionsThe best estimate of the technical provisions is calculated using assumptions that may themselves be uncertain. Therefore, there may be a range of best estimates that could be reasonably calculated and held on the Solvency II balance sheet.
The regulations require “a description of the level of uncertainty associated with the valuation of the technical provisions”. Of the reports we reviewed, only 6 provided readers with a quantitative indication of the sensitivity of the technical provisions to key assumptions.
We encourage firms to improve disclosure in this area to better articulate the level of uncertainty in their business.
Our viewpoint
Additional informationThe Solvency II regulations require firms to set out extra detail that is not strictly needed in separate “additional information” sections within each core area of the SFCR.
Around half of firms have provided some narrative in the “additional information” sections. However, in most cases, it appears that these sections are not being used as intended. Instead, they have been used to improve the readability of the SFCRs by covering those requirements in Articles 293 to 297 that may otherwise disrupt the flow of the other sections of the report.
35% of reports included glossaries to help readers understand the technical terms and acronyms used throughout the reports.
A glossary of terms is a helpful addition for non-technical readers which we encourage all firms to include in their future disclosures.
Our viewpoint
5. Solvency and Financial Condition Reportscontinued
Whilst some of the Delegated Regulation’s requirements are clear and prescriptive, others have been interpreted differently by firms.
25LCP Pillar 3 survey — August 2017
Stress and sensitivityAccording to the regulations, firms must include “a description of the methods used, the assumptions made and the outcome of stress testing and sensitivity analysis for material risks and events”. Firms have interpreted this requirement in different ways.
Some have provided chapter and verse on the results of testing, together with the expected impact on capital strength. For example, Aviva sets out a summary of the key results of its sensitivity testing, including the impact on capital coverage and the limitations of the sensitivity analyses undertaken.
Some, on the other hand, have provided only a high-level description of the work undertaken, with no quantitative impacts disclosed. Esure does not provide any quantitative results but does describe how the output from its stress and scenario testing feeds into its capital modelling, business planning, ORSA process, risk appetite and margin setting processes.
Insurers should include greater detail on the quantitative impact of key stresses and scenarios on their capital coverage. This will help stakeholders understand more clearly how exposed a firm’s balance sheet is to particular risks and events.
Our viewpoint
5. Solvency and Financial Condition Reportscontinued
Nearly half of firms included quantitative analysis of stress and sensitivity testing on their key business metrics.
26 LCP Pillar 3 survey — August 2017
We’ve compiled some top tips to help you and your firm’s stakeholders get the most out of your SFCR.
6. Tips and trip hazards
1. Avoid jargon – the readers of your SFCR may not have an insurance or actuarial background. It’s worth getting an independent review from a non-technician to ensure your report can be understood by a lay person. Including a glossary can also be helpful.
2. Review the published QRTs – check that the QRTs you are publishing are consistent with your narrative report and contain no obvious errors or omissions.
3. Be specific – make sure your report clearly articulates how you are running the business, who is involved and what your specific risks are. This will give stakeholders a clearer view of the company, and give greater confidence that you’re running the business well.
4. Consider formatting and file quality – every public document is a form of advertising, so it’s important that it makes a good impression.
• Ensure your SFCR is an electronically produced PDF (rather than a Word document, or a scanned image file)
• Check that your QRTs are legible
• Add branding to your document, particularly if you produce a glossy annual report and accounts
• Include graphs and diagrams to help understanding and make the report visually appealing
5. Check for compliance – develop a framework to check that your SFCR complies with the Solvency II requirements. Ideally, this should be undertaken by someone independent from the process who has experience of regulatory expectations and how market practice is emerging.

27LCP Pillar 3 survey — August 2017
Our in-depth analysis also uncovered several pitfalls that befell many firms. We set out the main ones below, together with some examples.
6. Tips and trip hazardscontinued
1. Numbers published in wrong units – several firms disclosed their QRTs in units, rather than in thousands as required
2. Missing rows of data – eg failing to disclose technical provisions less recoverables in form S.17.01.02
3. Incorrect QRTs published – several firms published some private QRTs in place of the public versions (for example the private balance sheet form S.02.01.01 instead of the public version S.02.01.02)
4. Missing totals – some firms did not disclose total non-life (excluding health) technical provisions in form S.02.01.02
5. Inconsistent entries – eg one firm’s net premium provisions disclosed did not reconcile with the gross premium provisions and reinsurance recoveries
6. Missing detail – eg one firm did not publish the breakdown of its partial internal model output, as required in form S.25.02.21
7. Poor quality files – the SFCR and QRTs disclosures for some firms were barely legible, as a result of poor quality low-tech scanning
8. Inconsistencies with the narrative report – eg one firm’s SCR in form S.23.01.01 did not reconcile with the SCR disclosed in the SFCR

28 LCP Pillar 3 survey — August 2017
Survey constituents and other notes
Insurance company name Report name
Admiral Insurance Company Ltd Admiral
Aetna Insurance Company Ltd Aetna
Ageas Insurance Ltd Ageas
AIG Europe Ltd AIG Europe
Aioi Nissay Dowa Insurance Company of Europe Ltd Aioi Nissay Dowa
Allianz Insurance PLC Allianz
AmTrust Europe Ltd AmTrust Europe
Ambac Assurance UK Ltd Ambac Assurance
AMT Mortgage Insurance Ltd AMT Mortgage
Arch Insurance Company (Europe) Ltd Arch Europe
Aspen Insurance UK Ltd Aspen
Assurant General Insurance Ltd Assurant GI
Assured Guaranty (Europe) Ltd Assured Guaranty
Aviva Insurance Ltd Aviva
Aviva International Insurance Ltd Aviva International
Avon Insurance PLC Avon
AXA ART Insurance SE AXA ART
AXA Insurance UK PLC AXA UK
Berkshire Hathaway International Insurance Ltd Berkshire Hathaway International
BHSF Ltd BHSF
British Gas Insurance Ltd British Gas
Bupa Insurance Ltd Bupa
Catlin Insurance Company (UK) Ltd Catlin
China Taiping Insurance (UK) Co Ltd China Taiping
Chubb Insurance Company of Europe SE Chubb Europe
CIS General Insurance Ltd CIS GI
Civil Service Healthcare Society Ltd Civil Service Healthcare Society
CNA Insurance Company Ltd CNA
Cornish Mutual Assurance Co Ltd Cornish Mutual
Covéa Insurance PLC Covéa
UK-based insurers
To improve readability throughout this report, we have shortened the names of some insurers when referring to them. The following table sets out the full entity names of the insurers we reviewed, together with the name used in this report, if applicable.

29LCP Pillar 3 survey — August 2017
Survey constituents and other notescontinued
Insurance company name Report name
DAS Legal Expenses Insurance Company Ltd DAS Legal Expenses
EC Insurance Company Ltd EC Insurance
Ecclesiastical Insurance Office PLC Ecclesiastical
Endurance Worldwide Insurance Ltd Endurance Worldwide
Equine and Livestock Insurance Co Ltd Equine and Livestock
Esure Insurance Ltd Esure
Exeter Friendly Society Ltd Exeter Friendly Society
Financial Insurance Company Ltd Financial
First Title Insurance PLC First Title
FM Insurance Company Ltd FM Insurance
Gresham Insurance Company Ltd Gresham
The Griffin Insurance Association Ltd Griffin
HCC International Insurance Company PLC HCC International
Highway Insurance Company Ltd Highway
Hiscox Insurance Company Ltd Hiscox
Houston Casualty Company - London Branch HCC - London Branch
HSB Engineering Insurance Ltd HSB Engineering
International General Insurance Company (UK) Ltd IGI
Lancashire Insurance Company (UK) Ltd Lancashire
Legal & General Insurance Ltd L&G
Liberty Mutual Insurance Europe Ltd Liberty Mutual
Liverpool Victoria Insurance Company Ltd Liverpool Victoria
Lloyds Bank General Insurance Ltd Lloyds Bank GI
London General Insurance Company Ltd London General
Markel International Insurance Company Ltd Markel International
Medicash Health Benefits Ltd Medicash Health Benefits
Mitsui Sumitomo Insurance Company (Europe) Ltd Mitsui Sumitomo Europe
Motors Insurance Company Ltd Motors
National Farmers Union Mutual Insurance Society Ltd NFU Mutual
Newline Insurance Company Ltd Newline
Personal Assurance PLC Personal Assurance
Pinnacle Insurance PLC Pinnacle
QBE Insurance (Europe) Ltd QBE Insurance Europe
QBE Re (Europe) Ltd QBE Re Europe
RiverStone Insurance (UK) Ltd RiverStone
Royal & Sun Alliance Insurance PLC RSA

30 LCP Pillar 3 survey — August 2017
Survey constituents and other notescontinued
Insurance company name Report name
Sabre Insurance Company Ltd Sabre
Samsung Fire & Marine Insurance Company of Europe Ltd Samsung Fire & Marine
Scor UK Company Ltd Scor
Simply Health Access Simply Health Access
Sompo Japan Nipponkoa Insurance Company Sompo Japan Nipponkoa
St Andrew’s Insurance PLC St Andrew’s
StarStone Insurance SE StarStone
Starr International (Europe) Ltd Starr
Stewart Title Ltd Stewart Title
Stonebridge International Insurance Ltd Stonebridge International
Tesco Underwriting Ltd Tesco Underwriting
The Wren Insurance Association Ltd Wren
Tokio Marine Kiln Insurance Ltd Tokio Marine Kiln
Tokio Millennium Re (UK) Ltd Tokio Millennium Re
Tradex Insurance Company Ltd Tradex
Trans Re London Ltd Trans Re London
Travelers Insurance Company Ltd Travelers
UIA (Insurance) Ltd UIA
U K Insurance Ltd U K Insurance
Vitality Health Ltd Vitality Health
Western Provident Association Ltd WPA
WR Berkley Insurance (Europe) Ltd WR Berkley Europe
XL Insurance Company SE XL
Insurance company name Report name
Allianz PLC Allianz Ireland
AXA Insurance DAC AXA Ireland
CACI Non-Life DAC CACI Non-Life
FBD Insurance PLC FBD
Greenlight Reinsurance Ireland DAC Greenlight Reinsurance
IPB Insurance CLG Irish Public Bodies
Liberty Insurance DAC Liberty
RSA Insurance Ireland DAC RSA Ireland
UnipolRe Designated Activity Company UnipolRe
VHI Insurance DAC VHI
Zurich Insurance DAC Zurich
Irish insurers

31LCP Pillar 3 survey — August 2017
Groups vs solo entitiesSome of the entities listed above are part of a larger group. When analysing the QRTs, we have considered only the QRTs of the solo entities listed. Where a firm has provided an SFCR at a group level for multiple solo entities, we have applied their comments to all entities within the group unless they explicitly disclosed otherwise.
Year ends and aggregating figures94% of the firms analysed had financial year ends as at 31 December 2016. When we have aggregated figures within this report, we have done so for all companies, regardless of the as at date of their SFCR.
Exchange ratesFor those firms which do not report in Pounds Sterling, we have taken all of their reported figures and converted them to Sterling using the prevailing exchange rate as at their financial year end.
Survey constituents and other notescontinued

Contact usFor further information please contact our team.
Cat Drummond Partner
+44(0)20 7432 0637
Laura McMaster Partner
+44 (0)20 7432 6746
Robert Murray Partner
+44 (0)20 7432 6690
Declan Lavelle Partner
+353 (0)1 614 43 93
All rights to this document are reserved to Lane Clark & Peacock LLP (“LCP”). This document may be reproduced in whole or in part, provided prominent acknowledgement of the source is given.
We accept no liability to anyone to whom this document has been provided (with or without our consent). Lane Clark & Peacock LLP is a limited liability partnership registered in England and Wales
with registered number OC301436. LCP is a registered trademark in the UK (Regd. TM No 2315442) and in the EU (Regd. TM No 002935583). All partners are members of Lane Clark & Peacock LLP.
A list of members’ names is available for inspection at 95 Wigmore Street, London W1U 1DQ, the firm’s principal place of business and registered office. The firm is regulated by the Institute and
Faculty of Actuaries in respect of a range of investment business activities. The firm is not authorised under the Financial Services and Markets Act 2000 but we are able in certain circumstances to
offer a limited range of investment services to clients because we are licensed by the Institute and Faculty of Actuaries. We can provide these investment services if they are an incidental part of the
professional services we have been engaged to provide.
At LCP, our experts provide clear, concise advice focused on your needs. We use innovative technology to give you real time insight & control. Our experts work in insurance, pensions, investment, energy and employee benefits.
© Lane Clark & Peacock LLP 2017
Lane Clark & Peacock LLP
London, UK
Tel: +44 (0)20 7439 2266
Lane Clark & Peacock LLP
Winchester, UK
Tel: +44 (0)1962 870060
Lane Clark & Peacock Ireland Limited
Dublin, Ireland
Tel: +353 (0)1 614 43 93
Lane Clark & Peacock Netherlands B.V.
(operating under licence)
Utrecht, Netherlands
Tel: +31 (0)30 256 76 30