Embed Size (px)
Citation preview

SOLVENCY II
REPORT ON LONG-TERM GUARANTEES MEASURES AND MEASURES ON EQUITY RISK 2020
EIOPA-BoS-20-706 3 December 2020

2/146
Table of Contents
Executive summary ............................................................................................3 I. Introduction ..............................................................................................5 I.1 Review of the LTG measures and measures on equity risk ............................................. 5 I.2 Legal background ..................................................................................................... 6 I.3 Data ...................................................................................................................... 7 I.4 Introduction to Solvency II quantitative requirements ................................................... 8 I.5 Overview of the European insurance market .............................................................. 10 II.1 Use of the measures .......................................................................................... 12 II.2 Impact on the financial position of undertakings .............................................. 19 II.3 Impact on policyholder protection ..................................................................... 35 II.4 Impact on the investments of undertakings ...................................................... 37 II.5 Impact on consumers and products ................................................................... 51 II.6 Impact on competition and level playing field in the EU insurance market ........ 53 II.7 Impact on financial stability .............................................................................. 56 III.1 Matching adjustment ....................................................................................... 59 III.2 Volatility adjustment ....................................................................................... 71 III.3 Transitional measure on the risk-free interest rates ....................................... 102 III.4 Transitional measure on technical provisions ................................................. 111 III.5 Duration-based equity risk sub-module .......................................................... 136 III.6 Symmetric adjustment to the equity risk charge ............................................ 137 III.7 Extension of the recovery period .................................................................... 138 Annexes ......................................................................................................... 140 Annex 1: Overview of the European insurance market ............................................ 140 Annex 2: Impact of the measures on the financial position of undertakings ........... 141 Annex 3: Asset classes ............................................................................................ 145 Annex 4: Use and impact of the measures in UK ...................................................... 146

3/146
Executive summary
The Solvency II Directive requires a review of the long-term guarantees measures (LTG)
and the measures on equity risk until 1 January 2021. As part of this review, EIOPA
reports annually on the impact of the application of the LTG measures and the measures
on equity risk to the European Parliament, the Council and the Commission. This report
on the LTG measures and the measures on equity risk is the fifth and last annual report.
The LTG measures are the extrapolation of risk-free interest rates, the matching
adjustment, the volatility adjustment, the extension of the recovery period in case of
non-compliance with the Solvency Capital Requirement, the transitional measure on the
risk-free interest rates and the transitional measure on technical provisions. The equity
risk measures are the application of a symmetric adjustment mechanism to the equity
risk charge and the duration-based equity risk sub-module.
The use of the matching adjustment, the volatility adjustment, the two transitional
measures and the duration-based equity risk sub-module are not mandatory for
undertakings. In the European Economic Area (EEA), 651 insurance and reinsurance
undertakings in 21 countries were using at least one of these measures on 31 December
2019.
The aggregated amount of technical provisions for the undertakings using the matching
adjustment, the volatility adjustment, the transitional measure on the risk-free interest
rates, the transitional measure on technical provisions and the duration-based equity
risk sub-module amounts to 80% of the technical provisions in the EEA insurance and
reinsurance market. 631 undertakings representing 79% of the overall amount of
technical provisions at EEA level are using the volatility adjustment. The transitional on
technical provisions is the second most used measure, applied by 136 undertakings
representing 19% of the overall amount of technical provisions at EEA level. The
matching adjustment is used by 14 undertakings representing 2% of the overall amount
of technical provisions in the EEA. The transitional on the risk-free interest rates is used
by 8 undertakings with a negligible market share in technical provisions. Finally the
duration-based equity risk sub-module is only used by one undertaking.
The impact of the measures on the financial position is reported to national supervisory
authorities through the regular annual reporting. For the undertakings using these
measures, removing the measures would result, on average, in a reduction to the
Solvency Capital Requirement ratio of 43 percentage points; the weighted average ratio
with the measures is 247% while the same ratio without the measures would be 204%.
Insurance and reinsurance undertakings comply with the Solvency Capital Requirement
if their Solvency Capital Requirement ratio is at least 100%. Removing these measures
would decrease the amount of eligible own funds to cover the Solvency Capital
Requirement by 76 billion euro and increase the Solvency Capital Requirement by 40
billion euro.
Where insurance or reinsurance undertakings depend on the transitional measures to
comply with the Solvency Capital Requirement, national supervisory authorities are
generally confident that undertakings will be able to reduce the dependency on
transitional measures, to the point of no dependency by 1 January 2032. National

4/146
supervisory authorities reported that the measures planned by undertakings in their
phasing-in plans have already provided an effective contribution to strengthening
undertakings’ solvency position under the low-rate environment. However, they also
noted that it is still very early in the transitional period. The total number of
undertakings not complying with the Solvency Capital Requirement without the
transitional measures at EEA level increased by 3 from 13 undertakings at the beginning
of 2019, to 16 undertakings at the end of the year. The missing amount of eligible own
funds to comply with the Solvency Capital Requirement without the transitional
measures increased by 1.34 billion euro, from 0.61 billion euro at the beginning of 2019
to 1.95 billion euro at the end of the year.
At the end of 2019, the symmetric adjustment to the equity capital charge, which can
vary from -10 to +10 percentage points, was at -0.08 percentage points. At EEA level
the estimated average impact of removing the symmetric adjustment on the SCR is
negligible.
The feedback from national supervisory authorities indicates that there is almost no
specific case where undue capital relief was observed for an undertaking due to the
application of the LTG measures or measures on equity risk, only one case of undue
capital relief in relation to the VA and SA in 2019 and beginning of 2020.
Most of the national supervisory authorities have identified no relevant and significant
trends in the investment behaviour of the insurance undertakings they supervise. Most
of the trends that were identified relate to search-for-yield behaviour in the ongoing
context of low interest rates. None of the observations could be clearly linked to the use
of LTG-measures on the basis of factual evidence. A search-for-yield was observed by
five national supervisory authorities, with explicit mention of a switch to alternative
investments such as infrastructure, mortgages and loans and other property
investments.
Consistent with the trends observed in the last years, availability of long-term guarantee
products is mainly stable or decreasing across EEA. In the 2019 report, approximately
half of the jurisdictions observed a reduction in the availability of traditional life
insurance products with long-term guarantees and an increase in the availability of unit-
linked business. All jurisdictions that observed this trend last year, have responded that
the trend has continued this year. Overall, national supervisory authorities have
observed a decrease in the size and duration of guarantees.
With regard to the impact of the LTG measures and the measures on equity risk on
competition and level playing field or on financial stability, the majority of national
supervisory authorities did not report any observed impact.

5/146
I. Introduction
I.1 Review of the LTG measures and measures on equity risk
The long-term guarantees (LTG) measures were introduced in the Solvency II Directive1
through the Omnibus II Directive2 in order to ensure an appropriate treatment of
insurance products that include long-term guarantees. The measures on equity risk
should ensure an appropriate measure of equity risk in setting the capital requirement
for insurance and reinsurance undertakings in relation to the risks arising from changes
in the level of equity prices.
The Solvency II Directive requires a review of the LTG measures and the measures on
equity risk by 1 January 2021. The review consists of the following elements:
EIOPA annually reports on the impact of the application of the LTG measures and the
measures on equity risk to the European Parliament, the Council and the Commission.
EIOPA provides an opinion on the assessment of the application of the LTG measures
and the measures on equity risk to the Commission.
Based on the opinion submitted by EIOPA the Commission submits a report on the
impact of the LTG measures and the measures on equity risk to the European Parliament
and to the Council. The report will be accompanied, if necessary, by legislative
proposals.
The 2020 EIOPA report on the LTG measures and the measures on equity risk is the
fifth annual report3. The 2020 report is structured in three main sections. The first
section provides introductory information, among others on the legal background of the
review of the LTG measures and measures on equity risk and on the data used for this
report, and concludes with a short overview of the European insurance market. The
second section captures the overall impact of the LTG measures and measures on equity
risk on the financial position of the undertakings, the impact on policyholder protection,
the impact on investments, the impact on consumer protection and availability of
products, the impact on competition and level playing field in the EU insurance market
and the impact on financial stability.
The third section of the report sets out in more detail the impact of each of the
measures.
1 Directive 2009/138/EC of 25 November 2009 of the European Parliament and of the Council on the taking-up and
pursuit of the business of Insurance and Reinsurance (Solvency II), OJ L 335, 17.12.2009, p.1. 2 Directive 2014/51/EU of the European Parliament and of the Council of 16 April 2014 amending Directives 2003/71/EC
and 2009/138/EC and Regulations (EC) No 1060/2009, (EU) No 1094/2010 and (EU) No 1095/2010 in respect of the powers of the European Supervisory Authority (European Insurance and Occupational Pensions Authority) and the European Supervisory Authority (European Securities and Markets Authority), OJ L153, 22.05.2014, p.1. 3 The 2016, 2017,2018 and 2019 reports can be found on EIOPA’s website at the following links:
https://eiopa.europa.eu/Publications/Responses/EIOPA-BoS-16-279_LTG_REPORT_2016.pdf https://eiopa.europa.eu/Publications/Reports/2017-12-20%20LTG%20Report%202017.pdf https://eiopa.europa.eu/Publications/Reports/2018-12-18%20_LTG%20AnnualReport2018.pdf https://www.eiopa.europa.eu/sites/default/files/publications/reports/eiopa-ltg-report2019.pdf

6/146
EIOPA plans to submit the opinion on the assessment of the application of the LTG
measures and the measures on equity risk to the Commission by the end of 2020, based
on the annual reports submitted by then.
In February 2019, the European Commission issued a request to EIOPA for technical
advice on the review of the Solvency II Directive4 on several topics, including LTG
measures and measures on equity risk. EIOPA will provide its technical advice in the
form of an opinion, in line with the requirement of Article 77f(2) of the Solvency II
Directive to provide an opinion on the assessment of the application of the LTG
measures and measures on equity risk. On 15 October 2019, EIOPA has published a
consultation paper on the opinion on the 2020 review of Solvency II5, which includes a
draft assessment on the application of the LTG measures and measures on equity risk
based on the LTG reports 2016-2018. EIOPA will provide its final assessment, including
eventual proposed changes regarding the measures, by 31 December 2020.
I.2 Legal background
Article 77(f)(1) of the Solvency II Directive requires EIOPA on an annual basis and until
1 January 2021 to report to the European Parliament, the Council and the Commission
about the impact of the application of Articles 77a to 77e and 106, Article 138(4) and
Articles 304, 308c and 308d, including the delegated or implementing acts adopted
pursuant thereto.
The table below summarises the LTG measures and the measures on equity risk subject
to the review and the relevant articles of the Solvency II Directive.
Table 1.1
Articles Name of the measure Abbreviation in
this report
77a Extrapolation of the risk-free interest rates -
77b, 77c Matching adjustment MA
77d Volatility adjustment VA
106 Symmetric adjustment mechanism to the
equity risk charge
SA
138(4) Extension of the recovery period -
304 Duration-based equity risk sub-module DBER
308c Transitional on the risk-free rate TRFR
308d Transitional on technical provisions TTP
4 Commission’s call for advice can be found in the following link:
https://eiopa.europa.eu/Publications/Requests%20for%20advice/RH_SRAnnex%20-%20CfA%202020%20SII%20review.pdf 5 See Consultation paper in the folloing link: https://eiopa.europa.eu/Pages/Consultation-Paper-on-the-Opinion-on-the-
2020-review-of-Solvency-II.aspx

7/146
The review also covers Article 77e of the Solvency Directive on technical information on
the risk-free interest rates produced by EIOPA.
Article 77(f)(1) also requires national supervisory authorities (NSAs) to provide the
following information to EIOPA on an annual basis:
the availability of long-term guarantees in insurance products in their national
markets and the behaviour of insurance and reinsurance undertakings as long-
term investors;
the number of insurance and reinsurance undertakings applying the matching
adjustment, the volatility adjustment, the extension of the recovery period in
accordance with Article 138(4), the duration-based equity risk sub-module and
the transitional measures set out in Articles 308c and 308d;
the impact on the insurance and reinsurance undertakings' financial position of
the matching adjustment, the volatility adjustment, the symmetric adjustment
mechanism to the equity capital charge, the duration-based equity risk sub-
module and the transitional measures set out in Articles 308c and 308d, at
national level and in anonymised way for each undertaking;
the effect of the matching adjustment, the volatility adjustment, the symmetric
adjustment mechanism to the equity capital charge and the duration-based
equity risk sub-module on the investment behaviour of insurance and reinsurance
undertakings and whether they provide undue capital relief;
the effect of any extension of the recovery period in accordance with Article
138(4) on the efforts of insurance and reinsurance undertakings to re-establish
the level of eligible own funds covering the Solvency Capital Requirement or to
reduce the risk profile in order to ensure compliance with the Solvency Capital
Requirement;
where insurance and reinsurance undertakings apply the transitional measures
set out in Articles 308c and 308d, whether they comply with the phasing-in plans
referred to in Article 308e of the Solvency II Directive and the prospects for a
reduced dependency on these transitional measures, including measures that
have been taken or are expected to be taken by the undertakings and supervisory
authorities, taking into account the regulatory environment of the Member State
concerned.
I.3 Data
The data used for this report are taken from the quantitative reporting templates (QRT)
submitted by insurance and reinsurance undertakings to their NSAs with reference date
31 December 20196.
6 Few undertakings with a reporting year different than the natural year reported data for a point in time earlier than
31 December 2019. Implausible figures affecting individual data submitted by 2 undertakings were disregarded in the analysis. This is not expected to have a material impact on the results presented in the report. Data from the QRT were

8/146
It should be noted that, consistently with the withdrawal of the United Kingdom (UK)
from the European Union (EU) on 31 January 2020, the EEA data shown in the report
do not take into account data from UK undertakings (i.e. EEA equals EU27 plus IS, NO
and LI). UK data with respect to the use and impact of the measures at the end of 2019
are presented separately in Annex 4 of this report.
EIOPA also carried out a questionnaire to ascertain the experience of NSAs with regard
to the impact of the LTG measures and the measures on equity risk during 2019 as well
as during the first half of 2020.
I.4 Introduction to Solvency II quantitative requirements
The main objective of Solvency II is to protect the insurance policyholders and
beneficiaries. An essential aspect of policyholder protection is the ability of insurance
and reinsurance undertakings to fulfil their insurance and reinsurance contracts, even
under adverse circumstances, for example in a financial crisis or when a natural
catastrophe occurs. Solvency II includes quantitative requirements on insurance and
reinsurance undertakings to ensure that their financial position allows them to pay the
expected insurance benefits and also to bear unexpected losses that they might incur
under adverse circumstances.
The quantitative requirements include in particular:
market-consistent valuation of assets and liabilities,
economic determination of own funds,
risk-based capital requirements.
Assets and liabilities
Solvency II introduced a valuation of assets and liabilities specifically for supervisory
purposes. Assets and liabilities are valued at the amount for which they could be
exchanged between knowledgeable willing parties in an arm’s length transaction.
The assets of an insurance or reinsurance undertaking consist mainly of the investments
that insurers make with the insurance premiums they receive. Typically these
investments comprise bonds, equities and real estate, held directly or through
investment funds.
The liabilities of an insurance or reinsurance undertaking consist mainly of technical
provisions set up for the insurance and reinsurance obligations of the undertaking.
Insurance and reinsurance obligations can be of long duration.
The long-term guarantee measures extrapolation, MA, VA, TRFR and TTP relate to the
calculation of technical provisions, the first four of them specifically to the risk-free
interest rates.
extracted between 28 July and 6 October 2020. Figures in the report may differ from what is published as part of EIOPA statistics due to differences in sample selection, size and extraction date.

9/146
Own funds and capital requirements
Insurance and reinsurance undertakings have to hold own funds that cover their capital
requirements. The own funds are based on the difference between assets and liabilities.
There are two capital requirements in Solvency II, the Solvency Capital Requirement
(SCR) and the Minimum Capital Requirement (MCR).
The SCR is a risk-based capital requirement. The SCR corresponds to the amount of
own funds needed to withstand the worst annual loss expected to occur over the next
200 years. If an insurance or reinsurance undertaking is not complying with the SCR, it
has to take measures to meet the SCR again within six months, for example by
increasing its capital or by reducing its risk.
The SCR can be calculated with a standard formula that is specified in the law or with
an internal model that was approved by the NSA. It is also possible to calculate a part
of the SCR with an internal model (partial internal model) and the remaining part with
the standard formula.
The SCR standard formula consists of modules for the different risks that an insurance
and reinsurance undertaking is exposed to (in particular market risks, underwriting
risks, counterparty default risks, operational risks). The risk that relates to the change
of equity prices is captured in the equity risk sub-module of the standard formula. The
measures on equity risk relate to the calculation of the equity risk sub-module.
The MCR is usually lower than the SCR. It corresponds to the minimum level of security
that is required under Solvency II. An insurance or reinsurance undertaking not
complying with the MCR would expose policyholders and beneficiaries to an
unacceptable level of risk. If an insurer does not cover the MCR with own funds, its
authorisation will be withdrawn unless the MCR is covered again within 3 months.
Other than the SCR, the MCR is calculated in a simple manner. The MCR is usually
between 25% and 45% of the SCR.
The existence of two capital requirements establishes a “ladder of supervisory
intervention”. It allows NSAs and undertakings to take early measures to ensure that
the capital requirements are met.
The SCR ratio is the ratio of eligible own funds and SCR. If the SCR ratio is 100% or
higher, then the SCR is complied with, otherwise not. The MCR ratio is the ratio of
eligible own funds and MCR. If the MCR ratio is 100% or higher, then the MCR is
complied with, otherwise not.
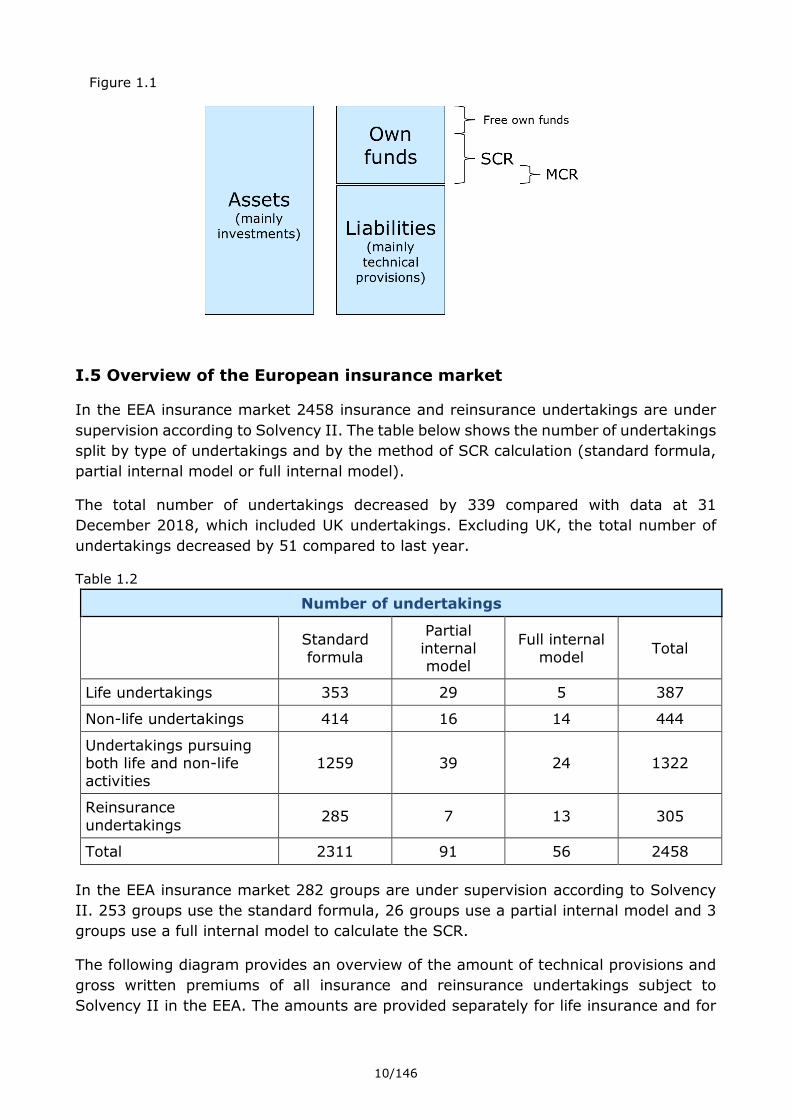
The following figure provides a stylised description of the quantitative requirements of
Solvency II.
10/146
Figure 1.1
I.5 Overview of the European insurance market
In the EEA insurance market 2458 insurance and reinsurance undertakings are under
supervision according to Solvency II. The table below shows the number of undertakings
split by type of undertakings and by the method of SCR calculation (standard formula,
partial internal model or full internal model).
The total number of undertakings decreased by 339 compared with data at 31
December 2018, which included UK undertakings. Excluding UK, the total number of
undertakings decreased by 51 compared to last year.
Table 1.2
Number of undertakings
Standard
formula
Partial
internal model
Full internal
model Total
Life undertakings 353 29 5 387
Non-life undertakings 414 16 14 444
Undertakings pursuing both life and non-life
activities
1259 39 24 1322
Reinsurance
undertakings 285 7 13 305
Total 2311 91 56 2458
In the EEA insurance market 282 groups are under supervision according to Solvency
II. 253 groups use the standard formula, 26 groups use a partial internal model and 3
groups use a full internal model to calculate the SCR.
The following diagram provides an overview of the amount of technical provisions and
gross written premiums of all insurance and reinsurance undertakings subject to
Solvency II in the EEA. The amounts are provided separately for life insurance and for

11/146
non-life insurance obligations. Additional information with respect to the European
insurance market is presented in Annex 1 of this report.
Technical provisions and gross written premiums of EEA undertakings
Figure 1.2 Figure 1.3
Table 1.3
EEA undertakings Life Non-life Total
Technical provisions
(billion EUR) 6809 677 7486
Gross written premiums
(billion EUR) 676 434 1110

12/146
II.1 Use of the measures
Some of the LTG measures and measures on equity risk are applied by insurance and
reinsurance undertakings on an optional basis, while the use of other measures is
mandatory.
The application of MA, VA, TRFR, TTP and DBER is optional for undertakings, subject to
conditions laid down in the Solvency II Directive and Regulations.
All other measures are an integral part of the Solvency II framework and hence of
mandatory application. In particular, the extrapolation of risk-free interest rates is
applicable to all undertakings for the calculation of their technical provisions. The
symmetric adjustment mechanism is applicable to all undertakings that use the
standard formula to calculate the equity risk sub-module of the SCR, including all
undertaking using a partial internal model not covering that sub-module.
Finally, the extension of the recovery period in exceptional adverse situations is only
applicable to undertakings breaching the SCR after a declaration of such a situation by
EIOPA. So far, EIOPA has not declared an exceptional adverse situation.
All information on the use of the measures set out in this section relates to the
situation as known on 31 December 2019. The graphs and tables are predominantly
based on QRT data. For a limited number of tables use has also been made of the
information in the NSA questionnaires. This applies to the combination of measures
and to the use of the symmetric adjustment on equity risk in case of (partial) internal
models.
Use of MA, VA, TRFR, TTP and DBER by solo undertakings
In the EEA, 651 insurance and reinsurance undertakings in 21 countries are using at
least one of the optional LTG measures MA, VA, TRFR, TTP or DBER. The aggregated
amount of technical provisions for those undertakings is 80% of the technical provisions
in the European market.
Out of the total 2458 undertakings, 1807 undertakings, nearly three out of four are not
using any of the LTG measures MA, VA, TRFR, TTP or DBER. The use of the measures
differs between types of undertaking, as illustrated below. The undertakings not using
any measures represent 20% of the technical provisions in the European market. There
are 9 countries where none of these measures are applied by any of the national
undertakings (CY, EE, HR, IS, LT, LV, PL, RO and SI – please see section III for further
detail).
The overall picture of the use of the measures is thus very similar to that of last year.

13/146
Figure 2.1
Table 2.1
Number of undertakings
Undertakings not
applying any of the measures
Undertakings
applying at least one measure
Total
Life 196 248 444
Non-Life 1127 195 1322
Both Life and non-life 203 184 387
Reinsurance 281 24 305
Total 1807 651 2458
Figure 2.2

14/146
Table 2.2
Technical provisions in EUR billions
Undertakings not applying
any of the measures
Undertakings applying at least
one measure
Life 1157 (17%) 5652 (83%)
Non-life 358 (53%) 319 (47%)
Total 1515 (20%) 5971 (80%)
631 undertakings located in 21 countries are using the VA. The TTP is used by 137
undertakings in 11 countries. The MA is used by 14 undertakings in Spain. The TRFR is
used by 8 undertakings in 4 countries. The DBER sub-module is only used by one
undertaking in France.
Undertakings may, and sometimes do, use more than one of the measures, as is also
illustrated in this table: the total of users per measure and the number of undertakings
not using any of the measures exceeds the total number of undertakings. The use of a
combination of measures is addressed in more detail in a separate section below.
Table 2.3
Number of undertakings using the measures
Type of undertaking
Total number of
undertakings
VA TTP MA TRFR DBER No
measure
Life 444 236 84 2 2 0 196
Non-life 1322 193 10 0 3 1 1127
Both life
and non-life 387 178 42 12 2 0 203
Reinsurance 305 24 0 0 1 0 281
Total 2458 631 136 14 8 1 1807
Without consideration of UK,the number of undertakings using the VA decreased by 6
compared with the data as at 31 December 2018. For the other measures, the number
of undertakings using the TTP increased by 3, whilst the number of undertakings using
the TRFR increased by 1. The number of undertakings applying the MA decreased by 1.
Finally, the number of undertakings using the DBER was kept at 1.
The following table and diagram provide an overview, by type of undertaking, of the
proportion of undertakings using each measure. The table and diagram show that the
use of the measures is in particular relevant for life undertakings, as well as for
undertakings pursuing both life and non-life activities. More half of all life insurance
undertakings in the EEA (53%) are using the VA.

15/146
Table 2.4
Proportion of undertakings using each measure
Type of undertaking
Total number of
undertakings
VA TTP MA TRFR DBER No
measure
Life 444 53% 19% 0% 0% 0% 44%
Non-life 1322 15% 1% 0% 0% 0% 85%
Both life and non-life 387 46% 11% 3% 1% 0% 52%
Reinsurance 305 8% 0% 0% 0% 0% 92%
Total 2458 26% 6% 1% 0% 0% 74%
Figure 2.3
The following diagram shows the market share of technical provisions of undertakings
using one of the LTG measures. This further illustrates the widespread use of the VA in
the European market (with undertakings using the VA holding 79% of all technical
provisions in the EEA), followed by the TTP (market share of 19%) and the MA (market
share of 2%). These technical provisions, to a very large extent, relate to life insurance
obligations.
53%
19%
0%
44%
15%
1% 0%
85%
46%
11%
3%
52%
8%
0% 0%
92%
26%
6%1%
74%
VA TTP MA No measure
Proportion of undertakings using each measure
Life Non-life Both life and non-life Reinsurance Total

16/146
Figure 2.4
Table 2.5
EEA market share in technical provisions using the measures
VA TTP MA TRFR DBER
Life 75% 18% 2% 0% 0%
Non-life 3% 0% 0% 0% 0%
Total 79% 19% 2% 0% 0%
The overall picture of the use of the LTG measures is thus very similar to that of last
year. The measures are most important for life undertakings and undertakings with
both life and non-life obligations. More than three quarters of the technical provisions
in the EEA is calculated using at least one of the measures. This relates nearly
exclusively to life obligations. The VA is used most widely, in terms of number of
countries, number of undertakings and the amount of technical provisions. The TTP is
also quite widely used. The MA is used less, but it is still applied to a substantial part of
the technical provisions. The use of the TRFR is limited. However, please note that a
measure may nevertheless be of importance in a specific EEA country. Please see
chapter III for more detailed information.
Table 2.6
Proportion of use of at least one measure
Countries Undertakings Technical Provisions
VA 71% 26% 79%
TTP 32% 6% 19%
MA 6% 1% 2%
TRFR 6% 0% 0%

17/146
Table 2.7
Proportion of use of at least one measure (last year's report)7
Countries Undertakings Technical Provisions
VA 71% 24% 67%
TTP 32% 6% 25%
MA 6% 1% 15%
TRFR 10% 0% 0%
Use of MA, VA, TRFR, TTP and DBER by insurance groups8
Of the 282 EEA insurance groups subject to Solvency II, 128 groups use the VA, 68
groups use the TTP and 7 groups use the MA. The TRFR is used by 3, and the DBER by
1 insurance group. Note that, within a group, use can be made of more than one of the
measures. This explains why the total of number of groups using the measures and the
number of groups not using any of the measures, exceeds the total number of groups
in the table and graph below.
Table 2.8
Number of EEA Solvency II groups using the measures
Total Number
of
EEA groups
VA TTP MA TRFR DBER No
measure
EEA Groups 282 128 68 7 3 1 163
Figure 2.5
7 It should be noted that last year’s report figures include UK, which explains main differences between numbers in table
2.6 and 2.7. 8 An EEA group using a measure means that at least one solo insurance or reinsurance undertaking part of the group
uses the measure.
45%
24%
2% 1% 0%
58%
0%
10%
20%
30%
40%
50%
60%
70%
VA TTP MA TRFR DBER No measure
Percentage of number of EEA groups using each measure

18/146
Use of a combination of the measures MA, VA, TRFR, TTP and DBER
According to the Solvency II Directive it is admissible for an insurance or reinsurance
undertaking to apply several measures at the same time. Certain combinations of
measures, however, are explicitly excluded:
Undertakings that apply the TTP cannot apply the TRFR (see Articles 308c(4)(b)
and 308d(5)(a) of the Solvency II Directive).
Undertakings that apply the TRFR cannot apply the MA to the same insurance
and reinsurance obligations (see Article 308c(3) of the Solvency II Directive).
Undertakings that apply the MA to a portfolio of insurance or reinsurance
obligations cannot apply the VA to those obligations (see Articles 77b(3) and
77d(5) of the Solvency II Directive).
The following table shows the simultaneous application of two measures with respect to
the same liabilities, with the number and market share of undertakings at EEA level
applying such combination:
Table 2.9
Combination of measures Number of
undertakings
Market share
(technical provisions)
Use of TTP and MA 8 1%
Use of TTP and VA 118 21%
Use of TRFR and VA 5 0%
Note that an undertaking may also use other combinations of measures, e.g. it may
combine the use of the VA and the MA, but not to the same liabilities.
Use of Symmetric adjustment to the equity risk charge
The symmetric adjustment mechanism applies to the undertakings that use the
standard formula to calculate the equity risk sub-module of the SCR, including all
undertakings using a partial internal model not covering that submodule.
Table 2.10
Type of undertakings Number of undertakings
Market share
(technical
provisions)
Standard formula 2309 68%
Partial internal model
not covering equity risk
37 4%
Total 2346 73%

19/146
II.2 Impact on the financial position of undertakings
Background on the impact of the measures MA, VA, TRFR and TTP
The LTG measures MA, VA, TRFR and TTP relate to the calculation of technical
provisions. But the impact of these measures on the financial position of insurance and
reinsurance undertakings is not restricted to a change in the amount of technical
provisions. The change in technical provisions itself can also have an impact on other
items of the balance sheet and on the capital requirements and own funds.
This section contains an explanation of how these LTG measures impact the financial
position of insurance and reinsurance undertakings. The description is based on the
typical effects and may not be applicable to all undertakings.
Impact on technical provisions
Removing MA, VA and TRFR usually decrease the relevant risk-free interest rates used
to calculate the technical provisions9 and consequently in most cases increase the
technical provisions10. Apart from the discounting effect the measures may also impact
some assumptions made in the calculation of technical provisions, for example about
the amount of future discretionary benefits of insurance with profit participation.
The TTP directly impacts the amount of technical provisions. Removing it typically
increases the amount of technical provisions.
Impact on assets and liabilities other than technical provisions
Where removing the measures increase the amount of technical provisions this increase
in liabilities may often be accompanied by a decrease of net deferred tax liabilities.
Impact on SCR and MCR
The measures can impact parts of the SCR and MCR calculation in different directions.
Some parts may not at all be affected by the use of the measures, for others an increase
or a decrease of the capital requirements can occur. An increase of the capital
requirement after removing the measures may in particular happen where the technical
provisions are used as measure for the size of risk that the capital requirements aim to
capture. The capital requirements may also be increased through a higher loss-
absorbing capacity of technical provisions where the removal of the measures decreased
the amount of future discretionary benefits in technical provisions. A similar effect is
the increase of the capital requirements through a higher loss-absorbing capacity of
deferred taxes where deferred taxes are decreased by the removal of the measures.
9 Removing MA, VA and TRFR will in most instances reduce the relevant risk-free term structures. However, under
certain circumstances, the adjustments can turn negative. In that situation, removing the adjustment would increase the relevant risk-free interest rates. 10
It is possible under Solvency II that the part of technical provisions to which the measures are applied is negative
(for example when the value of expected insurance premiums exceeds the value of expected insurance payments). In that specific case, lower discount rates result in lower technical provisions.

20/146
Typically removing the measures will increase SCR and MCR11.
Impact on own funds
The increase in technical provisions leads to a decrease of own funds. A slight relative
increase of technical provisions may lead to a significant relative reduction of own funds,
in particular for life insurance undertakings. For a typical life insurance undertaking the
ratio of own funds and technical provisions is 1/10. Therefore an increase of technical
provisions by 1% would lead to a reduction of own funds of 10%. This comparison is
only based on the direct impact of changes in technical provisions on the amount of
own funds. The impact may be mitigated by indirect effects, for example a reduction in
deferred tax liabilities.
Also the changes to the SCR and MCR caused by the removal of the measures can have
an impact on the eligible own funds to cover these capital requirements because there
are limits to these own funds that depend on the capital requirements.
Typically removing the measures will reduce the amount of own funds.
Summary of the impacts on the financial position
The following table summarises the typical impact on different items of the financial
position. The arrows are upward (resp. downward) if it is more likely than unlikely that
the items concerned will increase (resp. decrease) when the measures are removed.
Table 2.11
Items
Typical impact of
removing MA, VA,
TRFR and TTP
Technical provisions ↗
Net deferred tax liabilities ↘
Eligible own funds ↘
SCR and MCR ↗
Loss-absorbing capacity of future discretionary
benefits and deferred tax liabilities ↘
Data availability and reliability for assessing the impact of the measures in
2019
Two approaches were used to collect the necessary data in order to produce this report.
EIOPA has collected information about the impact of the measures MA, VA, TRFR and
TTP on 31 December 2019 through the dedicated Quantitative Reporting Templates that
were sent to NSAs in 2020. The information collected allows a consistent analysis of the
11
It should be noted that removing the MA can decrease the SCR due to the gain of the diversification effect between
portfolios. This is developed in the MA section of this report.

21/146
impact of these four measures. For the SA, whose impact is not directly reported by
undertakings, an analysis has been made based on data extracted from the Quantitative
Reporting Templates.
Concerning the DBER, at 31 December 2019 only 1 insurance undertaking was using
this measure. For this reason, the remainder of this section deals only with
extrapolation, MA, VA, TRFR and TTP. The presented results relate to the reference date
of 31 December 2019.
Finally, the extension of the recovery period has by definition no direct impact on the
financial position of undertakings.
Impact of the measures MA, VA, TRFR and TTP
The absolute impact of the measures MA, VA, TRFR and TTP on the whole EEA market
is set out in the following tables for all the solo undertakings and all the groups
separately. For the whole market (all solo undertakings) removing the measures would
increase the amount of technical provisions by 107 billion euro. Eligible own funds to
cover the SCR would reduce by 76 billion euro. The SCR would increase by 40 billion
euro. In comparison with last year, the impacts of removing the measures have
decreased. This is especially the case for the VA which is the main contributor to the
decrease observed. It should be noted that at 31 December 2019 the VA was 7 bps
whereas it was 24 bps at 31 December 2018.
Table 2.12 - Aggregation of the impact on all the insurance and reinsurance
undertakings
Amount with MA,
VA, TRFR and TTP
(billion euro)
Impact of removing the measures (billion euro)
Amount without
MA, VA, TRFR, and
TTP (billion euro)
Impact of
TTP
Impact of
TRFR
Impact of
VA
Impact of
MA
Impact of
all
measures
Technical provisions 7,485 86 1 17 3 107 7,592
Basic own Funds 1,120 -60 0 -14 -2 -76 1,043
Excess of assets
over liabilities 1,062 -61 0 -13 -2 -77 984
Restricted own
funds due to ring-
fencing and
matching portfolio
0 -1 0 0 0 -1 -1
Eligible own funds to
cover the SCR 1550 -60 0 -14 -2 -76 1474
Tier 1 1453 -62 0 -15 -2 -79 1374
Tier 2 88 0 0 0 0 1 89
Tier 3 9 1 0 1 0 2 10
SCR 598 5 0 35 0 40 637
Eligible own funds to
cover the MCR 1,068 -61 0 -14 -2 -78 990
MCR 147 2 0 9 0 11 159

22/146
Table 2.13 - Aggregation of the impact on all groups
Amount with MA,
VA, TRFR and TTP
(billion euro)
Impact of the measures (billion euro)
Amount without
MA, VA, TRFR, and
TTP (billion euro)
Impact of
TTP
Impact of
TRFR
Impact of
VA
Impact of
MA
Impact of
all
measures
Technical provisions 5,996 70 0 16 3 89 6085
Basic own Funds 709 -44 0 -5 -2 -51 658
Excess of assets
over liabilities 715 -51 0 -12 -2 -65 650
Restricted own
funds due to ring-
fencing and
matching portfolio
0 0 0 0 0 0 0
Eligible own funds
to cover the SCR 758 -44 0 -4 -2 -51 707
Tier 1 664 -45 0 -6 -2 -53 611
Tier 2 87 0 0 0 0 0 87
Tier 3 8 1 0 1 0 2 10
SCR 339 4 0 39 0 42 381
The following graphs provide an overview of the evolution of the absolute impact of the
measures MA, VA, TRFR and TTP since the first year of entry into force of Solvency II
on the whole EEA market12.
Figure 2.6
12
Data yer-end 2019 exclude UK, which explains the lower absolute impact for 2019 compared with previous years (in
particular for MA)

23/146
Figure 2.7
Figure 2.8
The following graph displays the overall impact of the use of the measures MA, VA,
TRFR and TTP on the SCR ratio for the whole EEA market (including both undertakings
using and not using the measures). The impact is shown at EEA and at country level.
The graph shows the SCR ratio with (dark blue) and without (light blue) these measures.
No results at country level are shown for CY, EE, HR, IS, LT, LV, PL, RO and SI because
the undertakings from these countries do not apply any of the measures (MA, VA, TRFR
and TTP).
At the EEA level, removing the measures would result on average13 in a decrease of the
SCR ratio by 28 percentage points. The largest impact at a country level is 47
percentage points. No country has the average solvency ratios without the use of the
measures below 100%. Throughout this report average ratios are weighted averages,
13
Figures at the EEA level are derived through the sum of eligible own funds and SCR of every country, including the
ones where no measures are used.

24/146
where the denominator of the ratios was used as weights. For example, in the following
graph, the average EEA SCR ratio with the measures of 259% is computed as :
∑𝑆𝐶𝑅𝑖
∑ 𝑆𝐶𝑅𝑖𝑢𝑛𝑑𝑒𝑟𝑡𝑎𝑘𝑖𝑛𝑔𝑠 𝐸𝐸𝐴∗
𝐸𝑜𝐹 𝑆𝐶𝑅𝑖
𝑆𝐶𝑅𝑖𝑢𝑛𝑑𝑒𝑟𝑡𝑎𝑘𝑖𝑛𝑔𝑠 𝐸𝐸𝐴 where SCR and eligible of own funds to cover
the SCR (EoF SCR) take into account the measures at undertaking level and where the
sums include all undertakings in the EEA using at least one measure.
Figure 2.9
The following graph shows the overall impact of the use of the measures MA, VA, TRFR
and TTP on the SCR ratio for the whole EEA market during the last four years. The
highest impact was observed in 2018, where removing the measures would result on
average in a decrease of the SCR ratio by 49 percentage points.

25/146
Figure 2.10
The following graphs display the overall impact of the use of the measures MA, VA,
TRFR and TTP on the SCR ratio for undertakings that apply at least one of the measures.
The impact is shown at EEA and at country level. The first graphs shows the SCR ratio
with (dark blue) and without (light blue) these measures. The red bars are for the EEA
level. The second graph shows the impact in percentage points.
At the EEA level, removing the measures result on average in a decrease of the SCR
ratio by 43 percentage points. The largest impact at a country level is 78 percentage
points. For all countries, the average solvency ratio without the use of the measures is
above 100%. In comparison with last year, average impacts on SCR ratio increased for
all countries, except for AT, CZ and LU.

26/146
Figure 2.11

27/146
Figure 2.12
The following graph shows the overall impact of the use of the measures MA, VA, TRFR
and TTP on the SCR ratio of undertakings using at least one of the measures the last
four years. The highest impact was observed in 2018, where removing the measures
would result on average in a decrease of the SCR ratio by 76 percentage points.
Figure 2.13

28/146
The following graphs display the impact of removing the measures MA, VA, TRFR and
TTP on the SCR ratio of every undertaking using at least one of those measures. Each
dot in the diagram represents one undertaking. The type of each undertaking is
indicated by the colour of the dot.
The horizontal axis relates to the SCR ratio without the measures MA, VA, TRFR and
TTP. The solvency ratios allowing for the impact of all measures (current SCR ratio) are
shown on the vertical axis. The continuous diagonal line corresponds to undertakings
without an impact of the measures. Undertakings located on this line have the
same SCR ratios with and without measures. The more an undertaking is located
away from the diagonal line, the bigger the impact of the measures. The broken
diagonal lines corresponds to an impact of 100, 200 and 400 percentage points on the
SCR ratio.
Figure 2.14

29/146
In terms of SCR ratio, 88% of undertakings using at least one measure reported an
absolute impact of less than 100 percentage points.
4% of the undertakings using at least one measure reported an SCR ratio without
measures below 100%. 0,3% of undertakings using at least one measure reported
negative eligible own funds to cover the SCR without measures.
The following graphs display the impact of removing the measures MA, VA, TRFR and
TTP on the MCR ratio of every undertaking using at least one of those measures.
Figure 2.15
In terms of MCR ratio, 79% of undertakings using at least one measure reported an
absolute impact of less than 100 percentage points.
1,4% of undertakings using at least one measure reported an MCR ratio without
measures below 100%. 0,3% of undertakings using at least one measure reported
negative eligible own funds to cover the MCR without measures.
The following graph shows the impact of removing the measures on the SCR (light blue)
and on the eligible own funds to cover the SCR (dark blue). The red bars are for the
EEA level. On average, eligible own funds to cover the SCR would decrease by 8.5%,
while the SCR would increase by almost 11% if the measures were removed.

30/146
Figure 2.16
The following graph displays the impact of removing the measures on the value of
technical provisions (TP) at EEA and national level. Removing the measures for those
undertakings applying the measure would result in an average increase of technical
provisions by 1.8% at EEA level. The impact goes up to 4.6% at country level. Overall,
unlike last year, average impacts on TP have decreased.

31/146
Figure 2.17
The following graphs show the impact on the MCR ratio, the MCR and the eligible own
funds to cover the MCR for undertakings using at least one of the measures.
At the EEA level, removing the measures to these undertakings would result in an
average loss of 98 percentage points with regard to the MCR ratio. The impact goes up
to 221 points at country level.
At the EEA level, removing the measures decreases eligible own funds to cover the MCR
by 9%, while the MCR increases by 8%.

32/146
Figure 2.18

33/146
Figure 2.19
The box-plots bellow illustrate how the impact of removing the measures MA, VA, TTP
and TRFR is distributed across undertakings. For example, in case the removal of the
measures for an individual undertaking would lead to a decrease of basic own funds
(BoF) from 100 to 35 units, the relative decrease of -65% is reflected in the box-plot.
The bottom of the blue box represents the lower quartile (25th percentile) of the data
set. The top of the blue box represents the higher quartile (75th percentile) of the data
set. The black band inside the box is always the middle quartile (50th percentile or
median). The lines extending from the boxes represent data that lies within 1.5x the
interquartile-range (the span of the blue box, covering half of the individual values)
from the 25th percentile at the bottom or the 75th percentile at the top. Data points
outside of this range are considered outliers and plotted as individual points. Finally,
the ‘X’ marking denotes the mean of the data series. We can observe that, in general,
all relevant variables show skewed distributions and a significant number of outliers,
which can also be compared against the scatterplots on SCR and MCR impacts displayed
above.

34/146
Figure 2.20
Impact of the symmetric adjustment mechanism
For the EIOPA LTG report 2019, the financial impact of the symmetric adjustment on
the SCR was determined using QRT data.
Since the SA at 31 Dec 2019 was -0.08%, setting the SA to zero would have a negligible
impact on equity exposures applied to calculate the SCR.
Impact of extrapolation
In order to assess the impact of the extrapolation of risk-free interest rates for previous
LTG reports, EIOPA carried out ad-hoc information requests to insurance and
reinsurance undertakings. Undertakings assessed the impact of different scenarios to
change parameters of the extrapolation.
Similar information request has not been done for year-end 2019 taking into account
the on-going review of Solvency II. Insurance and reinsurance undertakings have been
requested instead to provide information on the combined impact of the draft advice for
the 2020 review of Solvency II with a material impact on the solvency position of
undertakings, including the impact of possible changes to the current extrapolation
method14.
14
See EIOPA’s website for more detail on the 2020 review of Solvency II:
https://www.eiopa.europa.eu/browse/solvency-ii/2020-review-solvency-ii_en

35/146
II.3 Impact on policyholder protection
The review analyses the effect of the LTG measures and measures on equity risk on
policyholder protection. For this purpose, EIOPA has asked NSAs to report observations
on the impact of the measures on policyholder protection and in particular on cases of
revocation of the approval to apply one of the measures and cases of undue capital
relief by the LTG measures or measures on equity risk.
Some NSAs commented on general observations but most NSAs did not raise any
concrete observations of positive or negative impacts of the LTG measures and equity
risk measures on policyholder protection. Though, one NSA noted that it may have been
desirable to take supervisory action in respect of one undertaking where the solvency
position was close to 100% without application of the VA but still comfortably above
with the VA.
As in the previous LTG reports, it was assessed whether cases of undue capital relief
have occurred due to the application of the MA, the VA, the DBER or the SA. An undue
capital relief would be an unduly low amount of technical provisions or capital
requirement negatively impacting policyholder protection.
NSAs typically monitor the impact of the application of the LTG measures and equity
risk measures on the undertaking’s solvency position.
With respect to the VA, NSAs typically assess the impact of setting the VA to zero.
Several NSAs reported that they monitor undertaking’s investment portfolio considering
the actual investment return, changes to the portfolio’s composition and credit quality
and their investment strategy. This includes a comparison to the “reference portfolio”
used for the determination of the VA and undertaking’s ability to maintain its assets (do
they face the risk of a forced sale of assets). One NSA outlined that they assess whether
undertaking’s capital planning depends on the application or design of the VA and that
they require undertakings to assess the impact thereof. Some NSAs particularly outline
that they focus on the question of whether undertakings are able to earn the VA in
practice. For that purpose, a comparison of the rates actually earned by undertakings
to the size of the VA or a retrospective check are suggested. These assessments are
performed on a case by case basis, but no automatic checks are performed. The
processes of NSAs thereby vary, depending on whether an approval process for the VA
is foreseen.
With respect to the MA, one NSA assesses whether it is confident with the SCR
calculation and own funds determination when assessing whether cases of undue capital
relief occur. It is analyzed whether the SCR calculation is adequate considering the risks
inherent in undertaking’s asset portfolio (either because of non-adequacy of the
standard formula or miss-calibration of the internal model) and whether own funds are
overestimated due to an incorrect calibration of the fundamental spread (either because
of an under-calibration of the floors or incorrect mapping of assets by undertakings).
The feedback from NSAs indicated one case of undue capital relief in relation to the VA
and SA in 2019 and beginning of 2020. According to Article 37(1)(d) of the Solvency II
Directive a capital-add on can be applied to undertakings applying the MA, the VA or

36/146
the transitional measures where the supervisory authority concludes that the risk profile
of that undertaking deviates significantly from the assumptions underlying those
adjustments and transitional measures. No NSA imposed yet a capital add-on based on
observed cases of undue capital relief in respect of the LTG measures and equity risk
measures.NSAs were also asked about whether they had considered circumstances
where they would deem it appropriate to apply a capital add-on in respect of the use of
the MA, VA, TTP or the TRFR. 3 NSAs responded that they had considered the necessity
of capital add-ons in relation to the TTP – one of those explained that a capital add-on
could be a reasonable option where – taking into account the information in the progress
reports provided by the undertaking – the supervisor has considerable concerns that
the measures in the phasing-in plan are sufficient to ensure that capital requirements
are fulfilled until 01.01.2032. A capital add-on could be a preferable solution – compared
to a revocation - where the current measures in the phasing-in plan appear insufficient
to ensure that the undertaking is solvent at the end of the transitional period, but where
the undertaking still has options to take further measures to strengthen its solvency
position so that compliance with capital requirements until 01.01.2032 is realistic.
In 2019, one NSA revoked an approval to use the MA as a result of an on-site inspection
where it was revealed that the undertaking had ceased to meet the requirements for
using MA.
Also in 2019, one NSA revoked an approval to use the TTP as the undertaking did not
comply with the measures included in the PIP for TTP nor with the updates of the plan
included in the progress report sent to the supervisor on an annual basis, according to
art. 308.d.5 letter b) Directive 2009/138/EC.
During 2019 no undertaking was affected by adoption of reorganisation measures or
opening of winding-up proceedings (as defined in Article 268(1) of the Solvency II
Directive), though at the beginning of 2020 this was the case for 2 undertakings which
did not use any of the LTG measures or measures on equity risk.
Undue capital relief from MA could arise from the use of MA where the liabilities are not
sufficiently illiquid and/or where the calibration of the fundamental spread (FS) does
not provide adequate buffer against the risk of adverse credit events.
This analysis will focus on whether more adverse credit events are occurring in MA
portfolios than has been anticipated by the calibration of FS.
Undertakings with approval to use MA in Spain were asked to provide information about
the losses due to default and/or downgrade that had been experienced during 2019,
alongside the fundamental spread that had been assumed during 2019. No UK data
were collected as this survey was conducted in 2020 (after the so-called Brexit).
14 responses were received (all MA users in Spain). No default was reported. Only one
downgrade was reported in one undertaking, with an immaterial cost (the loss was
equals to 0.03 basic points and that undertaking had a fundamental spread of 28 bps).
The fundamental spread is designed to absorb the long-term average cost of default
and downgrade (see Article 77c (2) of the Solvency II Directive). This is not expected
to be directly comparable to a single time period. Continuing this comparison on an

37/146
annual basis should help to identify periods where the fundamental spread is insufficient
to absorb the costs of adverse credit events.
II.4 Impact on the investments of undertakings
Investment portfolios of undertakings using the measures MA, VA, TRFR or
TTP According to Article 77f(1)(a) and (3) of the Solvency II Directive, the review should
analyse the effect of the long-term guarantees measures and measures on equity risk
on long term investment strategies. To assess the impact of measures MA, VA, TRFR
and TTP on the investments of insurance and reinsurance undertakings, EIOPA has
analysed the investment allocation of undertakings as reported to NSAs under Solvency
II.
The tables and graphs in this general section of the report consider the investments of
undertakings from three perspectives:
- The investment allocation
- The credit quality of the bond portfolio, separately for government bonds and
corporate bonds
- The duration of the bond portfolio, separately for government bonds and corporate
bonds
These perspectives are considered both for the total EEA market and separately for
undertakings using the measures MA, VA, TTP, TRFR or no measure, also distinguishing
between types of undertaking. Further detail is provided in the separate sections per
measure in chapter III.
The following graph describes the investment allocation of insurance and reinsurance
undertakings on the end of 2019. The graph shows the allocation to the main asset
classes at EEA level and for each country.
With regard to the following tables and graphs on investments, caution should be
applied when analysing any correlation between the asset allocation or the
characteristics of the bond portfolios and the use of the measures, as it is difficult to
draw any conclusion from these graphs on any causal effect of the LTG measures on
the investments of undertakings.15
15
For more detail on the asset allocation please see Annex 3 “Assets classes”. In particular, please note that a one
level of look-through has been applied; consequently the figures in the column ‘Collective Investments Undertakings’ do not show the total investments in CIUs, but only those cases where the look-through could not be applied.

38/146
Table 2.14
Table 2.15
As was noted in previous reports, a diversity of the allocations at country level can be
observed. These country specificities should be taken into account when analysing the
investments of undertakings that apply the LTG measures and equity risk measures, in
particular where the use of a measure is not equally common in all countries16. Note
16 Please refer to the section on use of the measures.
Country Government bonds Corporate bondsUnit linked/index
linkedEquity
Collective
Investment
Undertakings
Mortgages and
loansCash and deposits Other
EEA 25% 24% 19% 13% 7% 4% 3% 4%
AT 21% 26% 14% 18% 5% 4% 3% 8%
BE 42% 19% 13% 8% 1% 12% 3% 4%
BG 47% 16% 5% 13% 1% 5% 9% 4%
CY 10% 23% 40% 8% 5% 2% 8% 5%
CZ 43% 15% 19% 11% 1% 4% 6% 1%
DE 19% 27% 5% 20% 16% 5% 4% 4%
DK 7% 18% 43% 13% 13% 2% 2% 2%
EE 14% 36% 33% 1% 3% 1% 12% 0%
ES 54% 20% 7% 7% 1% 1% 6% 4%
FI 5% 18% 54% 6% 6% 3% 5% 4%
FR 28% 32% 14% 12% 3% 2% 3% 5%
GR 53% 18% 16% 5% 1% 1% 5% 2%
HR 61% 4% 6% 9% 1% 6% 7% 7%
HU 45% 2% 45% 3% 2% 0% 3% 0%
IE 8% 9% 69% 2% 1% 2% 6% 2%
IS 23% 22% 5% 26% 11% 2% 10% 1%
IT 43% 18% 19% 11% 2% 1% 2% 5%
LI 4% 7% 83% 1% 1% 1% 4% 0%
LT 53% 12% 26% 1% 0% 1% 5% 1%
LU 9% 14% 64% 3% 0% 3% 5% 1%
LV 41% 13% 32% 2% 0% 2% 8% 2%
MT 21% 15% 5% 2% 3% 6% 42% 5%
NL 28% 13% 18% 5% 4% 21% 4% 7%
NO 9% 32% 21% 18% 10% 8% 2% 1%
PL 42% 5% 25% 14% 9% 2% 2% 0%
PT 35% 23% 24% 7% 5% 0% 5% 1%
RO 53% 6% 22% 5% 0% 1% 11% 1%
SE 8% 16% 45% 17% 6% 2% 2% 3%
SI 33% 25% 21% 14% 0% 1% 4% 2%
SK 37% 30% 20% 6% 1% 1% 5% 1%
Investment allocation at EEA and country Level
Country Government bonds Corporate bonds EquityCollective Investment
UndertakingsMortgages and loans Cash and deposits Other
EEA 31% 30% 16% 8% 5% 4% 5%
AT 25% 31% 21% 6% 5% 4% 9%
BE 48% 21% 9% 1% 13% 3% 4%
BG 49% 17% 13% 1% 6% 10% 4%
CY 17% 38% 13% 8% 3% 14% 8%
CZ 54% 19% 14% 1% 4% 7% 1%
DE 20% 29% 21% 17% 5% 4% 4%
DK 13% 31% 23% 23% 4% 3% 3%
EE 21% 54% 2% 4% 1% 18% 0%
ES 59% 22% 7% 1% 1% 7% 4%
FI 11% 39% 14% 13% 6% 10% 9%
FR 33% 37% 15% 4% 2% 4% 6%
GR 63% 22% 5% 1% 1% 6% 2%
HR 65% 4% 9% 1% 7% 7% 7%
HU 80% 4% 6% 4% 0% 5% 1%
IE 27% 30% 8% 4% 6% 20% 5%
IS 24% 23% 27% 12% 2% 11% 1%
IT 53% 22% 13% 2% 1% 2% 6%
LI 24% 38% 6% 5% 3% 22% 2%
LT 71% 17% 2% 0% 1% 6% 2%
LU 26% 38% 9% 1% 9% 14% 2%
LV 60% 19% 3% 0% 3% 12% 2%
MT 22% 16% 2% 3% 7% 44% 6%
NL 35% 16% 6% 5% 26% 5% 8%
NO 11% 40% 22% 13% 10% 3% 1%
PL 56% 7% 19% 12% 2% 3% 0%
PT 47% 30% 9% 6% 0% 7% 2%
RO 68% 8% 7% 1% 1% 14% 2%
SE 14% 30% 32% 12% 4% 4% 5%
SI 41% 32% 18% 0% 1% 5% 2%
SK 46% 38% 7% 1% 1% 6% 1%
Investment allocation at EEA and country Level (without assets held for IL & UL contracts)

39/146
that differences in the average asset allocation or in the characteristics of the bond
portfolios between the different groups of undertakings as shown in tables and graphs
below, are, to some extent, due to the high degree of variety of asset investments by
insurers across different countries in the EEA, and the fact that the use of the measures
is not evenly spread across different markets. This is in particular relevant for the MA,
which is, after Brexit, only used in Spain. Therefore the overall observations relating to
firms that apply the measures may simply reflect the specificities of insurance business
in any country rather than the use or non-use of LTG-measures. More detailed
information on the investments of insurers using the MA, VA, TRFR or TTP at the level
of individual countries is provided in the third section of this report.
The following tables illustrate the investment allocation at the end of 2019 of
undertakings that apply the MA, VA, TRFR or TTP, or that do not apply one of these
measures, in comparison with the investment allocation of all EEA undertakings. In
these tables the unit-linked/index-linked investments have been excluded:
Table 2.16
Table 2.17
Table 2.18
Governmen
t bonds
Corporate
bonds Equity
Collective
Investment
Undertakings
Mortgages
and loans
Cash and
deposits Other
Total 31% 30% 16% 8% 5% 4% 5%
VA 34% 30% 13% 9% 5% 3% 5%
MA 75% 15% 2% 0% 0% 6% 1%
TTP & TRFR 34% 34% 8% 9% 4% 4% 6%
No measure 22% 30% 27% 6% 4% 8% 5%
Total of undertakings
Governmen
t bonds
Corporate
bonds Equity
Collective
Investment
Undertakings
Mortgages
and loans
Cash and
deposits Other
Total 31% 33% 10% 11% 7% 2% 6%
VA 31% 33% 9% 11% 7% 2% 6%
MA 66% 12% 2% 0% 0% 8% 12%
TTP & TRFR 29% 38% 8% 10% 5% 2% 5%
No measure 35% 30% 14% 5% 5% 4% 6%
Life undertakings
Governmen
t bonds
Corporate
bonds Equity
Collective
Investment
Undertakings
Mortgages
and loans
Cash and
deposits Other
Total 41% 28% 13% 6% 3% 3% 6%
VA 43% 28% 12% 5% 3% 3% 5%
MA 75% 15% 2% 0% 0% 6% 1%
TTP & TRFR 43% 27% 8% 6% 3% 6% 7%
No measure 22% 29% 25% 8% 3% 6% 7%
Undertakings pursuing both Life and non-Life

40/146
As can be seen, differences between undertakings using at least one LTG measure and
those that do not use them, are present in composite as well as pure life insurance to
a certain degree. In life insurance, which accounts for a majority of technical provisions,
the differences between VA users, with VA being the most widely applied measure and
undertakings applying no measure, continues to be small, as also observed in previous
years. A substantial difference can be identified with MA users, but this is due to country
specific asset allocations in the jurisdiction where the MA is used (see section III.2).
Apart from the question of country-specific impacts it is hard however to resolve the
question of causality in these numbers. Rather than LTG-measures being the cause for
certain investment allocations, the undertakings that chose to apply certain measures
might not be a fully representative sample of insurance companies to begin with.
The final graph of this section compares the investment allocations by LTG measure
between 2019 and 2018:
Figure 2.21
As can be seen the only area with significant differences is the investment allocations
of MA undertakings. This is due to the departure of the UK, leaving a small number of
ES undertakings as the only remaining EEA users of the measure and therefore shifting
the average capital allocations. Apart from this, the investment allocations of the
insurance undertakings have on average stayed roughly the same from 2018 to 2019.
Bond portfolio of undertakings using the MA, VA, TRFR or TTP
The following graphs illustrate the credit quality of the bond portfolio of the undertakings
applying the measures MA, VA, TRFR or TTP as at end 2019, separately for government
bonds and corporate bonds. The credit quality is measured in credit quality steps (CQS),
which vary from 0 to 6, with 0 denoting the highest credit quality and 6 denoting the
lowest credit quality. Bonds considered as “investment grade” usually have a CQS
between 0 and 3.
Table 2.19

41/146
Table 2.20
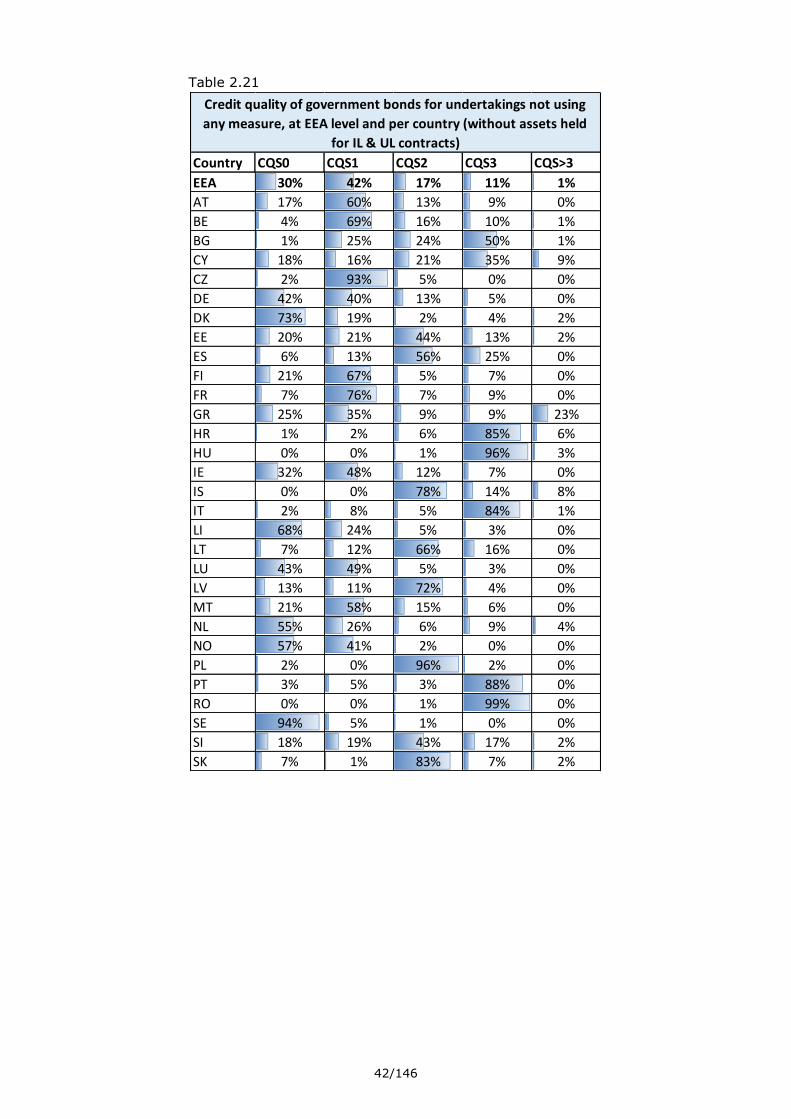
As can be seen there is a gap in credit quality ratings between undertakings using the
LTG measures and undertakings not using any voluntary measures. This difference is
especially pronounced in the subset of MA users however, the differences in the
investments for the MA users are explained by country factors since MA is applied only
in Spain. The gap is still sizeable in undertakings using the VA, with 15% CQS0 rated
government and 16% CQS0 rated corporate bonds. Overall, the vast majority of assets
held are rated between CQS0 and CQS3 and therefore investment grade, regardless of
the use of LTG measures.
Overall the results presented here for 2019 are well comparable to last years numbers
for 2018. On a country-specific basis some shifts in either direction can be observed,
but no clear trend emerges. It also seems that, especially in the case of government
bonds, most larger changes in average CQS come from adapted ratings rather than a
different portfolio composition.
The following graphs illustrate the credit quality of the bond portfolio of the undertakings
applying at least one of the measures MA, VA, TRFR or TTP and of undertakings not
applying any of these measures, as at end 2019 at EEA and at national level. Separate
graphs are provided for government bonds and corporate bonds. Please note that, due
to confidentiality reasons, any cells that relate to less than three undertakings are
denoted by (*).
CQS0 CQS1 CQS2 CQS3 CQS>3
All undertakings 17% 43% 15% 24% 1%
MA 1% 0% 84% 15% 0%
VA 15% 43% 15% 27% 1%
TTP&TRFR 16% 35% 18% 30% 1%
No measure 30% 42% 17% 11% 1%
Credit quality step of investments in government bonds (without assets held
for IL & UL contracts)
CQS0 CQS1 CQS2 CQS3 CQS>3
All undertakings 22% 17% 32% 28% 2%
MA 1% 14% 37% 46% 2%
VA 17% 17% 33% 31% 2%
TTP&TRFR 30% 19% 26% 22% 3%
No measure 38% 17% 26% 17% 1%
Credit quality step of investments in corporate bonds (without assets held for
IL & UL contracts)
42/146
Table 2.21
Country CQS0 CQS1 CQS2 CQS3 CQS>3
EEA 30% 42% 17% 11% 1%
AT 17% 60% 13% 9% 0%
BE 4% 69% 16% 10% 1%
BG 1% 25% 24% 50% 1%
CY 18% 16% 21% 35% 9%
CZ 2% 93% 5% 0% 0%
DE 42% 40% 13% 5% 0%
DK 73% 19% 2% 4% 2%
EE 20% 21% 44% 13% 2%
ES 6% 13% 56% 25% 0%
FI 21% 67% 5% 7% 0%
FR 7% 76% 7% 9% 0%
GR 25% 35% 9% 9% 23%
HR 1% 2% 6% 85% 6%
HU 0% 0% 1% 96% 3%
IE 32% 48% 12% 7% 0%
IS 0% 0% 78% 14% 8%
IT 2% 8% 5% 84% 1%
LI 68% 24% 5% 3% 0%
LT 7% 12% 66% 16% 0%
LU 43% 49% 5% 3% 0%
LV 13% 11% 72% 4% 0%
MT 21% 58% 15% 6% 0%
NL 55% 26% 6% 9% 4%
NO 57% 41% 2% 0% 0%
PL 2% 0% 96% 2% 0%
PT 3% 5% 3% 88% 0%
RO 0% 0% 1% 99% 0%
SE 94% 5% 1% 0% 0%
SI 18% 19% 43% 17% 2%
SK 7% 1% 83% 7% 2%
Credit quality of government bonds for undertakings not using
any measure, at EEA level and per country (without assets held
for IL & UL contracts)

43/146
Table 2.22
Country CQS0 CQS1 CQS2 CQS3 CQS>3
EEA 15% 43% 15% 27% 1%
AT 16% 49% 27% 8% 0%
BE 9% 72% 10% 8% 0%
BG 3% 1% 15% 81% 0%
CY (*) (*) (*) (*) (*)
CZ 5% 60% 29% 5% 1%
DE 34% 46% 14% 5% 0%
DK 67% 16% 4% 10% 3%
EE 0% 0% 0% 0% 0%
ES 2% 2% 74% 22% 0%
FI 45% 49% 2% 3% 1%
FR 8% 76% 7% 9% 0%
GR 10% 13% 8% 13% 56%
HR 0% 0% 0% 0% 0%
HU 1% 1% 0% 99% 0%
IE 36% 45% 13% 6% 0%
IS 0% 0% 0% 0% 0%
IT 2% 5% 7% 85% 0%
LI (*) (*) (*) (*) (*)
LT 0% 0% 0% 0% 0%
LU 26% 53% 7% 14% 0%
LV 0% 0% 0% 0% 0%
MT (*) (*) (*) (*) (*)
NL 55% 35% 3% 6% 0%
NO 51% 36% 12% 0% 0%
PL 0% 0% 0% 0% 0%
PT 4% 10% 13% 72% 1%
RO 0% 0% 0% 0% 0%
SE (*) (*) (*) (*) (*)
SI 0% 0% 0% 0% 0%
SK 10% 21% 64% 5% 0%
Credit quality of government bonds for undertakings using at
least one of the measures, at EEA level and per country
(without assets held for IL & UL contracts)

44/146
Table 2.23
Country Use of the measures CQS0 CQS1 CQS2 CQS3 CQS>3
No use of measures 30% 42% 17% 11% 1%
Use of at least one measure 15% 43% 15% 27% 1%
No use of measures 17% 60% 13% 9% 0%
Use of at least one measure 16% 49% 27% 8% 0%
No use of measures 4% 69% 16% 10% 1%
Use of at least one measure 9% 72% 10% 8% 0%
No use of measures 1% 25% 24% 50% 1%
Use of at least one measure 3% 1% 15% 81% 0%
No use of measures 18% 16% 21% 35% 9%
Use of at least one measure (*) (*) (*) (*) (*)
No use of measures 2% 93% 5% 0% 0%
Use of at least one measure 5% 60% 29% 5% 1%
No use of measures 42% 40% 13% 5% 0%
Use of at least one measure 34% 46% 14% 5% 0%
No use of measures 73% 19% 2% 4% 2%
Use of at least one measure 67% 16% 4% 10% 3%
No use of measures 20% 21% 44% 13% 2%
Use of at least one measure 0% 0% 0% 0% 0%
No use of measures 6% 13% 56% 25% 0%
Use of at least one measure 2% 2% 74% 22% 0%
No use of measures 21% 67% 5% 7% 0%
Use of at least one measure 45% 49% 2% 3% 1%
No use of measures 7% 76% 7% 9% 0%
Use of at least one measure 8% 76% 7% 9% 0%
No use of measures 25% 35% 9% 9% 23%
Use of at least one measure 10% 13% 8% 13% 56%
No use of measures 1% 2% 6% 85% 6%
Use of at least one measure 0% 0% 0% 0% 0%
No use of measures 0% 0% 1% 96% 3%
Use of at least one measure 1% 1% 0% 99% 0%
No use of measures 32% 48% 12% 7% 0%
Use of at least one measure 36% 45% 13% 6% 0%
No use of measures 0% 0% 78% 14% 8%
Use of at least one measure 0% 0% 0% 0% 0%
No use of measures 2% 8% 5% 84% 1%
Use of at least one measure 2% 5% 7% 85% 0%
No use of measures 68% 24% 5% 3% 0%
Use of at least one measure (*) (*) (*) (*) (*)
No use of measures 7% 12% 66% 16% 0%
Use of at least one measure 0% 0% 0% 0% 0%
No use of measures 43% 49% 5% 3% 0%
Use of at least one measure 26% 53% 7% 14% 0%
No use of measures 13% 11% 72% 4% 0%
Use of at least one measure 0% 0% 0% 0% 0%
No use of measures 21% 58% 15% 6% 0%
Use of at least one measure (*) (*) (*) (*) (*)
No use of measures 55% 26% 6% 9% 4%
Use of at least one measure 55% 35% 3% 6% 0%
No use of measures 57% 41% 2% 0% 0%
Use of at least one measure 51% 36% 12% 0% 0%
No use of measures 2% 0% 96% 2% 0%
Use of at least one measure 0% 0% 0% 0% 0%
No use of measures 3% 5% 3% 88% 0%
Use of at least one measure 4% 10% 13% 72% 1%
No use of measures 0% 0% 1% 99% 0%
Use of at least one measure 0% 0% 0% 0% 0%
No use of measures 94% 5% 1% 0% 0%
Use of at least one measure (*) (*) (*) (*) (*)
No use of measures 18% 19% 43% 17% 2%
Use of at least one measure 0% 0% 0% 0% 0%
No use of measures 7% 1% 83% 7% 2%
Use of at least one measure 10% 21% 64% 5% 0%
SI
SK
NL
NO
PL
PT
RO
SE
MT
FI
FR
HR
HU
IE
IS
IT
LI
LT
GR
LU
LV
ES
EEA
AT
BE
BG
CY
CZ
DE
DK
EE
Credit quality of government bonds for undertakings not using a measure or using at least one measure,
at EEA level and per country (without assets held for IL & UL contracts)

45/146
Table 2.24
Country CQS0 CQS1 CQS2 CQS3 CQS>3
EEA 38% 17% 26% 17% 1%
AT 31% 14% 32% 21% 1%
BE 8% 21% 43% 24% 4%
BG 6% 8% 21% 58% 8%
CY 20% 9% 29% 37% 5%
CZ 2% 31% 36% 31% 0%
DE 40% 21% 24% 14% 1%
DK 91% 2% 3% 2% 2%
EE 13% 19% 32% 34% 2%
ES 4% 14% 36% 42% 4%
FI 5% 8% 39% 44% 5%
FR 9% 20% 39% 29% 2%
GR 29% 11% 30% 24% 6%
HR 3% 3% 33% 50% 11%
HU 1% 0% 27% 52% 21%
IE 7% 14% 46% 32% 1%
IS 0% 0% 0% 99% 1%
IT 14% 8% 31% 45% 2%
LI 13% 19% 47% 19% 1%
LT 24% 16% 20% 36% 4%
LU 12% 17% 41% 29% 1%
LV 17% 6% 38% 35% 4%
MT 10% 13% 35% 41% 2%
NL 8% 22% 33% 31% 7%
NO 46% 11% 29% 13% 1%
PL 0% 7% 34% 54% 5%
PT 1% 7% 35% 54% 3%
RO 0% 0% 57% 43% 0%
SE 78% 6% 8% 6% 2%
SI 8% 10% 32% 45% 5%
SK 1% 25% 22% 46% 5%
Credit quality of corporate bonds for undertakings not using any
measure, at EEA level and per country (without assets held for IL
& UL contracts)

46/146
Table 2.25
Country CQS0 CQS1 CQS2 CQS3 CQS>3
EEA 17% 17% 33% 31% 2%
AT 20% 21% 35% 23% 1%
BE 10% 18% 34% 37% 2%
BG 6% 3% 42% 47% 3%
CY (*) (*) (*) (*) (*)
CZ 0% 3% 41% 52% 4%
DE 37% 22% 23% 17% 1%
DK 82% 7% 5% 5% 1%
EE 0% 0% 0% 0% 0%
ES 2% 14% 32% 49% 3%
FI 10% 10% 27% 40% 14%
FR 8% 19% 41% 31% 1%
GR 1% 13% 35% 42% 9%
HR 0% 0% 0% 0% 0%
HU 0% 4% 30% 66% 0%
IE 21% 14% 40% 24% 1%
IS 0% 0% 0% 0% 0%
IT 2% 7% 28% 55% 8%
LI (*) (*) (*) (*) (*)
LT 0% 0% 0% 0% 0%
LU 7% 12% 44% 36% 2%
LV 0% 0% 0% 0% 0%
MT (*) (*) (*) (*) (*)
NL 4% 12% 40% 41% 3%
NO 33% 14% 36% 17% 0%
PL 0% 0% 0% 0% 0%
PT 3% 8% 38% 45% 7%
RO 0% 0% 0% 0% 0%
SE (*) (*) (*) (*) (*)
SI 0% 0% 0% 0% 0%
SK 7% 14% 35% 44% 0%
Credit quality of corporate bonds for undertakings using at
least one of the measures, at EEA level and per country
(without assets held for IL & UL contracts)

47/146
Table 2.26
Country Use of the measures CQS0 CQS1 CQS2 CQS3 CQS>3
No use of measures 38% 17% 26% 17% 1%
Use of at least one measure 17% 17% 33% 31% 2%
No use of measures 31% 14% 32% 21% 1%
Use of at least one measure 20% 21% 35% 23% 1%
No use of measures 8% 21% 43% 24% 4%
Use of at least one measure 10% 18% 34% 37% 2%
No use of measures 6% 8% 21% 58% 8%
Use of at least one measure 6% 3% 42% 47% 3%
No use of measures 20% 9% 29% 37% 5%
Use of at least one measure (*) (*) (*) (*) (*)
No use of measures 2% 31% 36% 31% 0%
Use of at least one measure 0% 3% 41% 52% 4%
No use of measures 40% 21% 24% 14% 1%
Use of at least one measure 37% 22% 23% 17% 1%
No use of measures 91% 2% 3% 2% 2%
Use of at least one measure 82% 7% 5% 5% 1%
No use of measures 13% 19% 32% 34% 2%
Use of at least one measure 0% 0% 0% 0% 0%
No use of measures 4% 14% 36% 42% 4%
Use of at least one measure 2% 14% 32% 49% 3%
No use of measures 5% 8% 39% 44% 5%
Use of at least one measure 10% 10% 27% 40% 14%
No use of measures 9% 20% 39% 29% 2%
Use of at least one measure 8% 19% 41% 31% 1%
No use of measures 29% 11% 30% 24% 6%
Use of at least one measure 1% 13% 35% 42% 9%
No use of measures 3% 3% 33% 50% 11%
Use of at least one measure 0% 0% 0% 0% 0%
No use of measures 1% 0% 27% 52% 21%
Use of at least one measure 0% 4% 30% 66% 0%
No use of measures 7% 14% 46% 32% 1%
Use of at least one measure 21% 14% 40% 24% 1%
No use of measures 0% 0% 0% 99% 1%
Use of at least one measure 0% 0% 0% 0% 0%
No use of measures 14% 8% 31% 45% 2%
Use of at least one measure 2% 7% 28% 55% 8%
No use of measures 13% 19% 47% 19% 1%
Use of at least one measure (*) (*) (*) (*) (*)
No use of measures 24% 16% 20% 36% 4%
Use of at least one measure 0% 0% 0% 0% 0%
No use of measures 12% 17% 41% 29% 1%
Use of at least one measure 7% 12% 44% 36% 2%
No use of measures 17% 6% 38% 35% 4%
Use of at least one measure 0% 0% 0% 0% 0%
No use of measures 10% 13% 35% 41% 2%
Use of at least one measure (*) (*) (*) (*) (*)
No use of measures 8% 22% 33% 31% 7%
Use of at least one measure 4% 12% 40% 41% 3%
No use of measures 46% 11% 29% 13% 1%
Use of at least one measure 33% 14% 36% 17% 0%
No use of measures 0% 7% 34% 54% 5%
Use of at least one measure 0% 0% 0% 0% 0%
No use of measures 1% 7% 35% 54% 3%
Use of at least one measure 3% 8% 38% 45% 7%
No use of measures 0% 0% 57% 43% 0%
Use of at least one measure 0% 0% 0% 0% 0%
No use of measures 78% 6% 8% 6% 2%
Use of at least one measure (*) (*) (*) (*) (*)
No use of measures 8% 10% 32% 45% 5%
Use of at least one measure 0% 0% 0% 0% 0%
No use of measures 1% 25% 22% 46% 5%
Use of at least one measure 7% 14% 35% 44% 0%SK
NO
PL
PT
RO
SE
SI
GR
ES
NL
FR
HR
HU
IE
IS
IT
LI
LT
LU
LV
MT
FI
CZ
DE
DK
EE
EEA
AT
BE
BG
CY
Credit quality of corporate bonds for undertakings not using a measure or using at least one measure, at
EEA level and per country (without assets held for IL & UL contracts)

48/146
Duration of bonds The following graphs show, for each of the countries, the average duration of the bond
portfolios, separately for government bonds and corporate bonds. A distinction has been
made between undertakings using at least one measure and undertakings using no
measure. Please note that the graphs on duration do not include unit-linked/index-
linked-investments.
Figure 2.22
Figure 2.23

49/146
These graphs show that on average the duration of bonds is higher in undertakings
using at least one LTG measure. This trend is much more apparent in government bonds
than in corporate bonds however and strong national differences also play an important
role in the durations.
The tables below provide further detail, on a national level, on the duration of bond
portfolios of undertakings, distinguishing between the use or omission of any of the LTG
measures:
Table 2.27
Total VA MA TRFR/TTP No measure
EEA 9 10 10 11 7
AT 10 10 10 9
BE 10 10 (*) 6
BG 6 8 5
CY 5 (*) 5
CZ 7 7 7
DE 13 15 16 10
DK 7 7 7
EE 7 7
ES 9 9 10 9 9
FI 7 7 6 6
FR 9 9 8 6
GR 7 7 8 6
HR 6 6
HU 5 5 5
IE 7 9 (*) 5
IS 5 5
IT 8 8 4
LI 7 5 (*) 9
LT 6 6
LU 6 7 4
LV 5 5
MT 6 6
NL 11 12 4
NO 6 6 6 8
PL 5 5
PT 5 6 5 5
RO 4 (*) 4
SE 5 (*) 5
SI 7 7
SK 9 9 8
Duration of government bonds per country and per measure (without assets held for IL
& UL contracts)

50/146
Table 2.28
Again, some noticeable differences between the different countries become apparent.
Overall, a trend of slightly increasing bond durations from 2018 to 2019 is visible. This
trend is stronger in government bonds, where the average duration within the EEA has
increased by almost 0,8 years. The durations of corporate bonds have only increased
slightly on average and in some countries a decrease was observed. The longer
durations can potentially hint at search-for-yield-behaviour in the context of the ongoing
low-interest market situation.
Total VA MA TRFR/TTP No measure
EEA 6 6 5 7 6
AT 7 7 6 6
BE 5 5 (*) 3
BG 4 5 3
CY 3 (*) 3
CZ 3 3 4
DE 8 8 9 8
DK 4 4 3
EE 4 4
ES 5 5 5 5 3
FI 3 4 4 2
FR 5 5 7 5
GR 4 4 4 5
HR 7 7
HU 3 3 3
IE 5 6 (*) 5
IS 4 4
IT 5 5 3
LI 4 3 (*) 5
LT 5 5
LU 5 5 4
LV 4 4
MT 4 4
NL 4 4 3
NO 5 5 5 9
PL 4 4
PT 4 3 4 4
RO 3 (*) 3
SE 3 (*) 3
SI 4 4
SK 6 6 7
Duration of corporate bonds per country and per measure (without assets held for IL & UL
contracts)

51/146
Supervisory observations on the investment behaviour
To collect information about the impact of the LTG measures and measures on equity
risk on the investment behaviour of undertakings, as for the precious LTG reports EIOPA
asked NSAs about their observations regarding trends in the behaviour of undertakings
as long-term investors, the drivers associated with those trends and their view on any
connections between the measures and the trends observed. Specific questions were
asked on any noticeable trends in the holding of equities as well as the duration of bond
portfolios.
Overall, the responses from NSAs were similar compared to the observations for the
previous year. Most of the NSAs have identified no relevant and significant trends in the
investment behaviour of the insurance undertakings they supervise. Most of the trends
that were identified relate to search-for-yield behaviour in the ongoing context of low
interest rates. None of the observations could be clearly linked to the use of LTG-
measures on the basis of factual evidence, which would however be hard to achieve in
any case.
The main trends observed by NSAs during 2019 are similar to last year. A search-for-
yield was observed by five NSA, with explicit mention of a switch to alternative
investments such as infrastructure, mortgages and loans and other property
investments. One NSA commented that there is an increased awareness of ESG criteria
in investment decisions. NSAs did not observe any significant change in this trend during
the first half of 2020.
Seven NSAs mentioned specific trends regarding the holding of equities. Four of those
identified a slight increase of equities, with three a slight decrease. NSAs did not observe
any significant change in this trend during the first half of 2020, with one NSA observing
an increase in equity investment, and another NSA observing more active buying and
selling behaviour. If one also takes the graphs provided in the ‘allocation of assets’-
section into account, a slight increase of the overall holding of equities has been
observed from 2018 to 2019.
Three NSAs identified a trend of increasing bond duration. Two of those NSAs that
witnessed an upward trend in durations directly linked this to search-for-yield
behaviour.
Two NSAs linked trends in investments to the use of LTG measures. The first of these
mentioned that the VA influences the composition of the bond portfolios in their market,
due to requirements in the approvals process. The second NSA observed that the LTG
measures are a motivation for the increase in longevity reinsurance. They observed that
the decrease in longevity risk allows insuers to take on more investment risk..
II.5 Impact on consumers and products
Trend regarding availability of products with long-term guarantees
The 2018 LTG report contained an extensive analysis of the product environment. This
analysis will not be repeated in the 2020 report, as it was intended as a one off exercise
that gave an overall snapshot of the European insurance market and the availability of
products with long-term guarantees. For the report this year, similar to the 2019 report,

52/146
NSAs have been asked to comment on any new trends they have observed in their
market since the previous report.
In the 2018 and 2019 reports, approximately half of the jurisdictions observed a
reduction in the availability of traditional life insurance products with long-term
guarantees and an increase in the availability of unit-linked business. All jurisdictions
that observed this trend last year, have responded that the trend has continued this
year. One NSA (LT) commented that this transition increased during 2019, due to
ongoing pension reform. A second NSA (DK) commented that a large insurer stopped
selling products with minimum guarantee and profit participation during 2019.
One NSA (IT) reported a significant decrease in the volume of new pure unit-linked
business (excluding hybrid products) written in 2019. A second NSA (BG) observed that
insurers in their market have either reduced the guarantees to 0 – 0.5% and therefore
the selling of products with guarantees decreased or in some cases have ceased selling
products with guarantees.
Over the first half of 2020, the majority of NSAs did not observe any new trends in
relation to the availability of products with long-term guarantees. One NSA (LT)
reported a decrease in the volume of new contracts, both traditional life insurance and
unit-linked, due to the uncertainty brought on by Covid-19
Trend in size of guarantee
In relation to the size of guarantees, the trend appears to have continued from last
year, where the majority of jurisdictions observed a reduction in the size and duration
of guarantees. The main drivers observed for this are the low interest rate environment,
in particular the increase in the cost of guarantees driven by the decrease in interest
rates, which is also reflected under Solvency II in technical provisions as well as the
SCR. In some countries the trend started already before Solvency II became into effect
and the long-term guarantee products have been in run-off.
Customer Detriment
Similar to last year, the majority of NSAs observed that the current trends in the
availability of products with long-term guarantees had not raised consumer protection
issues. However, one specific case of consumer detriment has been observed, this was
in relation to undertakings encouraging policyholders to transfer away from traditional
products with high guaranteed interest rates (CZ).
During 2020, one NSA (MT) observed a case where there was a significant fall in the
with profit fund value, due to risky investment strategy and annual management
charges. A number of NSAs indicated that they have taken or plannedactivities and
measures over the year, this includes:
- Thematic reviews of certain products, with a focus on consumer aspects.
- Focus on conduct of insurance brokers, intermediaries and financial advisors.
- Market surveys, so that trends can be identified faster.
- Implementation of a consumer protection risk based system of early warning.

53/146
During the first half of 2020, a number of NSAs commented that they have increased
monitoring activities, but no specific new cases of consumer detriment have been
observed.
II.6 Impact on competition and level playing field in the EU insurance
market
The topic on competition and level playing field is included in the list of relevant items
for the review of the LTG measures and measures on equity risk in Article 77f(3)(c) of
the Solvency II Directive. It has been covered since the report 2017 (it was not included
in the first report because of the scarcity of data and limited experience on the topic at
that time).
In response to the question of whether they had observed any impact of the LTG
measures and measures on equity risk on competition, the vast majority of NSAs did
not report any such observations. However the same issues than in 2019 were raised
in respect of over- and undershooting effects created by the VA creating advantages,
e.g. for undertakings that use a VA which expresses a level of spread volatility much
higher than the one experienced by their portfolios, and disadvantages, e.g. because of
the difficulties on the activation of the national component of VA. Also comparability of
solvency ratios was identified as being negatively influenced,because, in some contexts
and publications, the differentiation between SCR with or without LTG measures is not
sufficiently transparent17.No specific observations were made with respect to the first
half of 2020.
With regard to the internal models to calculate the SCR, two different treatments of
the VA can be observed, the modelling of a constant VA and the modelling of a dynamic
VA. The approaches are further explained in section III.3. Switching on the dynamic VA
typically significantly reduces SCR for spread risk, compared to switching on a constant
VA18. 16 NSAs commented that they would allow undertakings using internal models to
apply the dynamic VA. The table below shows the number of undertakings and groups
using dynamic VA as at year-end 2019:
Table 2.29
17
A similar issue was also addressed by IMF - see LTG report 2018 p.81 18
Note that dynamic VA approaches were only approved, if all credit risks are modelled including sovereign risk.
Member State Solo Groups
AT 6 1
BE 3
CZ 1
FR 13 1
DE 26 2
IE 3
IT 2 1
NL 9 3
Total 63 8

54/146
With respect to VA, the questionnaire investigated if NSAs require undertakings in their
market to perform (regular) specific additional analysis as a consequence of applying
the VA in addition to what is already foreseen by the regulation. Only three NSAs
provided comments of additional analyses requested.
In one case the NSA provided a detailed description of the approach applied that
requests to undertakings experiencing material effects due to the use of VA (scenario
with VA equal to zero) to evaluate also the impact of a forced sale of assets under
specific conditions. If any of the two previous scenarios would result in non-compliance
SCR/MCR undertakings are requested to consider effects of the investment policy,
consistency of the average duration of assets vs liabilities vs the duration of the
representative portfolios considered by EIOPA to calculate VA. The entity should
establish criteria to evaluate the results and, where appropriate, the measures to be
adopted. Undertakings are also recommended to consider possible substantial
differences with the representative portfolios and the concrete possibility to earn the VA
'without assuming credit risk'.
The majority of NSAs did not identify undertakings where the risk profile of the
undertaking deviates significantly from the assumptions underlying the VA. In one
country, deviations in investments from undertakings compared to the reference
portfolio have been identified. Another NSA referred to deviations which led to change
in DVA models. No capital add on was considered by NSAs so far.
The MA is a measure applied currently only in Spain, where governance rules are
established to ensure that the assigned portfolio of assets cannot be used to cover
losses arising from other activities of the undertaking. In this country, undertakings are
requested to identify in the investments book the assets assigned to the MA.
Undertakings are then required to appoint someone responsible for the Asset and
Liability management policy of the MA portfolio. Every change in the assets of the MA
portfolio must be approved by the responsible persons (Actuarial function and Risk
Management function) and be documented in a report which is raised to the Board.
Investments are assessed asset by asset. These assets have to be fixed income assets
and nominated in the currency of liabilities. These features can be intrinsic to the assets
or be obtained through other assets (for instance, a suitable derivative which transforms
the cashflows of the asset into fixed cash flows). Undertakings are expected to
determine, for each asset, whether the issuer or a third party are permitted to change
the cash flows. Where cash flows may be changed at the unfettered discretion by the
issuer, there should be sufficient compensation paid such that reinvestment is possible
to replicate the cashflows.
The assessment to identify any mismatch refers to cash flows and is requested to be
run monthly. If the risk profile of an undertaking deviates significantly from the
assumptions underlying the MA, the authorisation to use it is withdrawn. That was the
case for one undertaking in 2019.
With respect to the TTP

55/146
In 2019, 4 recalculations in respect of the TTP were initiated by the NSAs, none in the
first half of 2020. In addition, undertakings applied for a recalculation of the transitional
amount, 7 cases in 2019 and 18 cases in the first half of 2020. Only 1 of the 7 cases in
2019 was based on an identified material change of the risk profile (a merge of two
undertakings). In the first half of 2020, 11 recalculations were applied due to the
material market distortions during the Covid pandemic which caused material changes
in the risk profile.
Practices for recalculations differ. In the case of 5 NSAs, a fixed term for recalculations
(e.g. every 24 months) is specified where undertakings need to recalculate the
adjustment (independent on whether a change in risk profile occurred).
Also, NSA practices differ in respect of identifying changes in risk profiles. 5 NSAs
outline, that they have processes in place to systematically monitor material changes
in risk profile, e.g. by using internal tools assessing changes in the SCR, MCR or balance
sheet or explicitly recognizing this as part of regular prudential supervision. One NSA
provided guidance to the market.
As for last year, different supervisory practices were observed concerning the possibility
to apply a lower amount of transitional deduction to technical provisions than the
maximum amount that has been approved by the NSA.
Again, responses show a mixed picture:
17 NSAs indicated that undertakings in their jurisdiction always have to apply the
maximum amount.
9 NSAs allow the application of a lower amount, but reductions were actually
applied only by 3 undertakings in two countries. In one country the reduction is
subject to the NSA’s approval. The NSAs generally do not apply any limits to such
reductions.
13 NSAs allow undertakings to exit the measure early. In most cases, NSAs
require to be informed on the reasons of the exit and on the undertaking’s
solvency position without the measure to ensure it has successfully transferred
to the new regulatory system.
Another aspect that was assessed was if NSAs considered in their approval of the
transitionals whether these were necessary to ensure a smooth transition to SII.
Similar to last year, varying approaches were observed. 7 NSAs stated that during the
approval process they explicitly considered or intend to consider whether the
transitional was necessary for the undertaking applying.
Other NSAs also assessed how necessary the use of the transitionals was for
undertakings. Two NSA mentioned an increased resilience against potentially adverse
future situations as a motivation to apply the transitionals. Another NSA considers the
measure to be a relevant and necessary tool to ensure a successful transition to
Solvency II. Prior to the introduction of Solvency II, during the approval process, this
jurisdiction did not focus on the solvency position of undertakings under the Solvency

56/146
II regime. The NSA also observed a high number of undertakings who did not meet the
solvency capital requirement without the transitional measures.
NSAs were also asked on whether they identified cases where the risk profile of the
undertaking deviates significantly from the assumptions underlying the TTP or TRFR.
Two NSAs indicated such cases, one of which related to the change in business which
is subject to the TTP. AS a response to this, a capital add-on was investigated and a
recalculation required.
An unlevel playing field can stem from different application of the LTG measures and
measures of equity risk as observed above. An unlevel playing field can also result
where the measures themselves differentiate between national markets. That is
naturally the case for transitionals from a minimum harmonisation system like Solvency
I to a maximum harmonisation system like Solvency II. The transitional adjustments
for the TTP and the TRFR are calculated with reference to the valuation rules of Solvency
I. These rules were not harmonised and hence they may be different across Member
States and result in different amounts of technical provisions and different discount
rates across national markets. Two undertakings with the same liabilities and risks but
located in different Member States may therefore have different technical provisions
when they both apply the TTP or the TRFR.
Similar than last year, the majority of NSAs did not identify any impact of the VA, MA,
DBER, TRFR or TTP on the number of transfers of portfolio, mergers, and acquisitions
in 2019. One NSA outlined that LTG measures, may have an impact on portfolio
transfers, mergers and acquisitions. In negotiations between buyers and sellers, buyers
are willing to pay more for the shares of an insurance undertaking, i.e. require less
funds for the transfer of the liabilities, if the undertaking can apply a measure that
allows for a reduction of the liabilities. When applying the VA, there could also be a rise
of the risk profile of the assets to increase alignment with the reference portfolio;
increasing alignment with the reference portfolio reduces own fund volatility and this is
also considered to create value from a shareholder perspective, while the increased
asset risks are not beneficial from a policyholder perspective. Another NSA outlined that
in case of transfer, merger or acquisition of an undertaking applying TTP it does not
allow a transfer of the deduction in view of negative implications for the policyholders
of the target undertaking.
II.7 Impact on financial stability
EIOPA has asked NSAs about their experience with the LTG measures in relation to
financial stability.
VA and MA
4 NSAs stated that there was no impact of the MA and VA on financial stability in 2019,
as expected, because of the still stable market circumstances in which credit spreads
did not significantly change with relatively low overall credit spreads. As such the MA
and VA also did not change a lot in 2019 and had not a lot of impact.

57/146
In contrast, this picture changed during the first months of 2020. 8 NSAs outline that
the VA had a relevant impact on financial stability in the first half of 2020. 1 NSA
identified a positive impact of the MA on financial stability.
Overshooting VA
One NSA commented that applying the VA has led to overshooting effects on own funds
in the first half of 2020 for undertakings with relatively long-term liabilities and
relatively little and relatively less risky fixed income investments. In case spreads
increase, the application of the VA by those undertakings implies a larger decrease in
the valuation of the technical provisions than the decrease of value in their investments;
as such the own funds of those undertakings increase when credit spreads increase.
Behaviour of euro VA in case of a spread widening affecting a single Eurozone
country
With regard to the VA of the Eurozone another NSA commented that, in case of a spread
widening affecting a single country of the area, some undesirable effects could be
observed in terms of volatility of technical provisions, own funds and solvency ratio
affecting all Eurozone countries. These effects, described already in last year’s Report,
were driven by the widening of the spreads of Italian government bonds and persisted
in the first half of 2019.
TTP
2 NSAs replied to the questionnaire regarding the impact of the TTP on financial stability
that it has helped a smooth transition to Solvency II and strengthened the perceived
resilience of the insurance market.
Symmetric Adjustment for equity risk
One NSA responded that the symmetric adjustment for equity risk has positive
implications on financial stability, even though in 2019 it was negligible in size. Another
NSA outlined the positive implications of the the symmetric adjustment in the first half
of 2020.
Extrapolation
One NSA replied that the current parametrization of the extrapolation for the euro
currency stabilizes the value of the technical provisions. Another NSA commented that
whereas the valuation of technical provisions may be stabilized, the amount of own
funds may become less stable because of the current parametrization. Whether or not
the amounts of own funds are stabilized depends on the extent of interest rate hedging
and cash flow matching. 19 This NSA also outlined that the term structure was not
sufficiently realistic and would lead to too low technical provisions enabling undertaking
19
Undertakings that match their cash flows beyond the LLP to a large extent experience more volatility in own funds
than undertakings that match the cash flows of their liabilities beyond the LLP to a lesser extent. This can be explained by the fact that current parametrization decreases the volatility of the rates beyond the LLP only for the purpose of the valuation of the technical provisions, while the value of the assets for which the market values are available remains fully sensitive to the volatility of market rates beyond the LLP. The amount of cash flow matching that would minimize the own fund volatility depends, among other aspects, on the relative amount of cash flows beyond the LLP and the level and shape of the risk-free interest rate term structure. Those undertaking that match to a large extent would have a lower volatility of own funds with a different parametrization, for example a ‘later’ LLP. Undertakings that match relatively less would experience more volatility in own funds in case of a ‘later’ LLP.

58/146
to increase risks due to higher regulatory own funds thus negatively impacting financial
stability.

59/146
III. Specific analysis for each of the measures
III.1 Matching adjustment
According to Recital 31 of the Omnibus Directive, where insurance and reinsurance
undertakings hold bonds or other assets with similar cash-flow characteristics to
maturity, they are not exposed to the risk of changing spreads on those assets. In order
to avoid changes of asset spreads from impacting on the amount of own funds of those
undertakings, they should be allowed to adjust the relevant risk-free interest rate term
structure in line with the spread movements of their assets.
Insurance and reinsurance undertakings may therefore apply a matching adjustment
(MA) to the relevant risk-free interest rate term structure when they value their life
insurance or reinsurance obligations, including annuities stemming from non-life
insurance.
The MA can only be applied where specific requirements on the insurance and
reinsurance obligations, the assets covering the obligations and the management of
these obligations and assets are met (Article 77c of the Solvency II Directive). In
particular, the expected asset cash flows must replicate each of the expected cash flows
of the insurance or reinsurance obligations (cash-flow matching, Article 77c(1)(c) of
that Directive).
The use of the matching adjustment under the Solvency II regime is subject to prior
supervisory approval.
The matching adjustment is derived from the spreads between the interest rate that
could be earned from the undertaking’s assets and the basic risk-free interest rates.
The matching adjustment is reduced by a fundamental spread that allows for expected
loss from default and downgrade of the undertaking’s assets.
Undertakings calculate the MA themselves, based on their own portfolios of assets. The
fundamental spreads are specified in implementing acts.
The MA is applied in the same two European countries as at the implementation date of
Solvency II. The 2016 EIOPA LTG report investigated the reasons why this was the case,
at the time e.g. the majority of NSAs reported that no products matched the legal
requirements for MA set out in Article 77b of the Solvency II Directive.
Use of the matching adjustment
14 insurance undertakings from Spain apply the MA. Undertakings are permitted to
have more than one matching adjustment portfolio and each portfolio needs separate
approval. The number of undertakings using the MA decreased by 1 compared to the
data as at 31 December 2018.
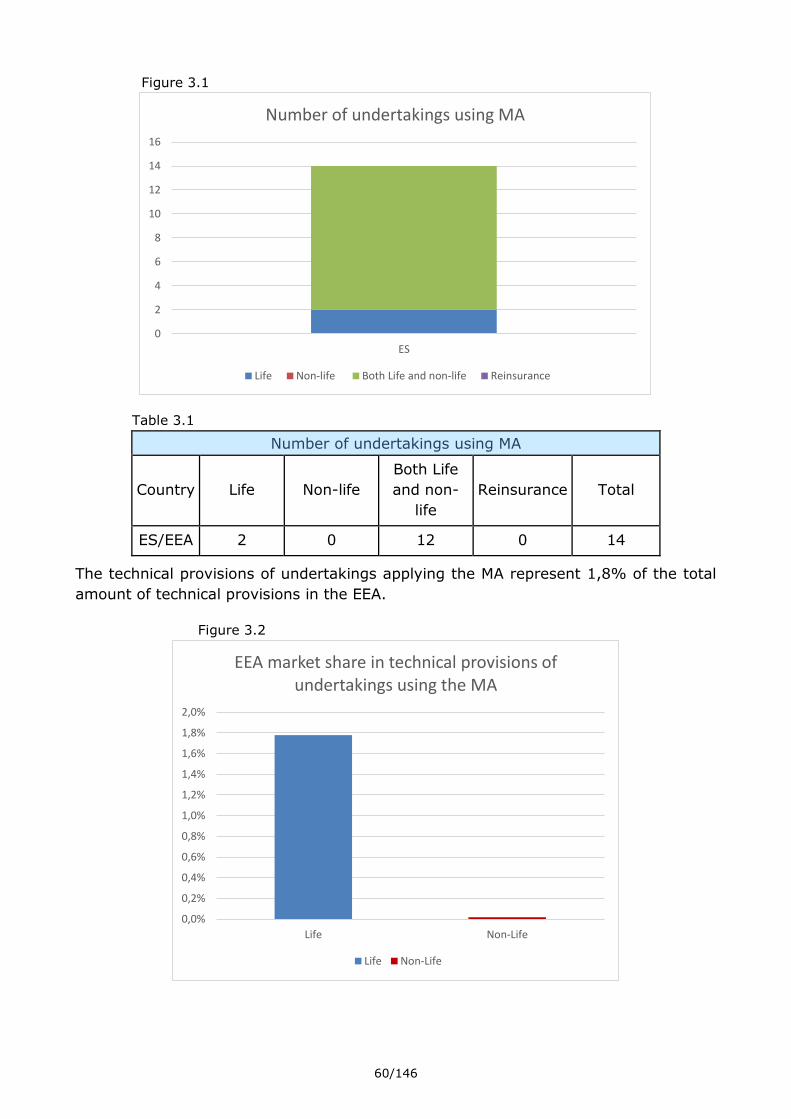
60/146
Figure 3.1
Table 3.1
Number of undertakings using MA
Country Life Non-life
Both Life
and non-
life
Reinsurance Total
ES/EEA 2 0 12 0 14
The technical provisions of undertakings applying the MA represent 1,8% of the total
amount of technical provisions in the EEA.
Figure 3.2
0
2
4
6
8
10
12
14
16
ES
Number of undertakings using MA
Life Non-life Both Life and non-life Reinsurance
0,0%
0,2%
0,4%
0,6%
0,8%
1,0%
1,2%
1,4%
1,6%
1,8%
2,0%
Life Non-Life
EEA market share in technical provisions of undertakings using the MA
Life Non-Life

61/146
The following graph displays the market share in terms of technical provisions at
national level for undertakings using the MA. In Spain, undertakings representing 59%
of the national market are using the MA.
Figure 3.3
According to the Solvency II Directive it is possible to apply the TTP and the MA to the
same liabilities simultaneously. 8 of the 14 undertakings in Spain are applying the TTP
and the MA to the same liabilities simultaneously, which is 1 less undertaking than in
the previous year.
Table 3.2
Undertakings applying the TTP and MA to the same liabilities simultaneously
Country Number of
undertakings
% EEA market share
in TP
% National market
share in TP
ES/EEA 8 0% 10%
The following diagram provides a summary of the number of EEA groups using the
matching adjustment.
Figure 3.4
0% 10% 20% 30% 40% 50% 60%
ES
National market share in technical provisions of undertakings using MA
Life Non-Life
1
6
7
0
1
2
3
4
5
6
7
8
NL ES EEA
Number of EEA groups using MA

62/146
Impact on the financial position of undertakings
The results presented in this section are based on data from 2019 and 2Q 2020.The
following graph displays the average size of the MA for undertakings in Spain.
Figure 3.5
This shows that on a weighted average basis, the MA amounted to 34bps at the end of
2019 and 65bps at the end of the second quarter of 2020 in Spain. The weighted
average MA in 2018 was 70bps for Spain. The movement in the MA was consistent
with movement in credit spreads over the period.
The following graph illustrates the dispersion of individual values for the MA in the
Spain at the end of year 2019. The whiskers show the lowest and highest values
recorded. The box shows the 25th to 75th percentile with the change in colour
representing the 50th percentile (or the median).
Figure 3.6
The following graph shows the overall impact of the use of the MA on the SCR ratio for
the whole market of the countries where the MA is used.
0 10 20 30 40 50 60 70
ES 2Q 2020
ES 2019
Weighted average of Matching Adjustment (bps)
0
20
40
60
80
100
120
140
160
ES 2019
Dispersion of Matching Adjustment rates (bps)

63/146
Figure 3.7
The following graph shows the overall impact of the use of the MA on the SCR ratio for
the whole EEA market during the last four years. The highest impact was observed in
2018, where removing the MA would result on average in a decrease of the SCR ratio
by 19 percentage points. The lowest impact observed in 2019 is due to the exclusion of
UK undertakings compared to the previous years.
Figure 3.8
The following graphs display the overall impact of the use of the MA on the SCR ratio
for undertakings that apply this measure. The impact is shown at EEA and at country
level. The first graphs shows the SCR ratio with (dark blue) and without (light blue) the
MA. The red bars are for the EEA level. The second graph shows the impact in
percentage points.

64/146
At the EEA level, removing the MA result on average in a decrease of the SCR ratio by
19 percentage points. In the jurisdiction, the average impact has decreased in
comparison with last year, explained by the decrease of the government bond spreads.
Figure 3.9
Figure 3.10
The following graph shows the overall impact of the use of the MA on the SCR ratio for
undertakings using the measure during the last four years. The highest impact was
observed in 2018, where removing the MA would result on average in a decrease of the
SCR ratio by 98 percentage points. The lowest impact observed in 2019 is due to the
exclusion of UK undertakings compared to the previous years.
Figure 3.11

65/146
The following graph displays the impact of removing the MA on the SCR ratio of every
undertaking using this measures. Each dot in the diagram represents one undertaking,
comparing the individual SCR ratio against the estimated SCR ratio without the MA. The
type of each undertaking is indicated by the colour of the dot.
In terms of SCR ratio, all undertakings reported an absolute impact of less than 100
percentage points.
None of the undertakings using the measure reported an SCR ratio without MA below
100%. These numbers differ significantly from those of previous years. This is mostly
due to UK undertakings not being included in the statistics any more, leaving just the
Spanish insurers which are significantly less dependent on the MA for fulfilling their SCR.
Figure 3.12

66/146
The following graph displays the impact of removing the MA on the MCR ratio of every
undertaking using the MA, comparing the individual MCR ratio against the estimated
MCR ratio without the MA.
Figure 3.13
In terms of MCR ratio, 93% reported an absolute impact of less than 100 percentage
points.
None of undertakings using the measure reported an MCR ratio without MA below 100%.
The following graph shows the impact of removing the MA on the SCR (light blue) and
on the eligible own funds to cover the SCR (dark blue). The red bars are for the EEA
level. On average, eligible own funds to cover the SCR would decrease by 13%, while
the SCR would decrease by 6% if the MA were removed.
Regarding the impact of the MA on the SCR shown in the graph below, note that
removing the MA typically increases the capital requirement for spread risk which leads
to an increase in the SCR. At the same time, where the MA is applied, no diversification
between the MA portfolio and the remaining part of the portfolio can be recognized
according to articles 216 and 217 of the Solvency II Delegated Regulation. With the
removal of the MA, such diversification effect can be taken into account which leads to
a decrease in the SCR. For the Spanish undertakings the latter effect overweighs and
thus the effect observed when removing this measure is a reduction of the SCR due to
the recognition of diversification between the matching adjustment portfolio and the
remaining part of the undertaking.
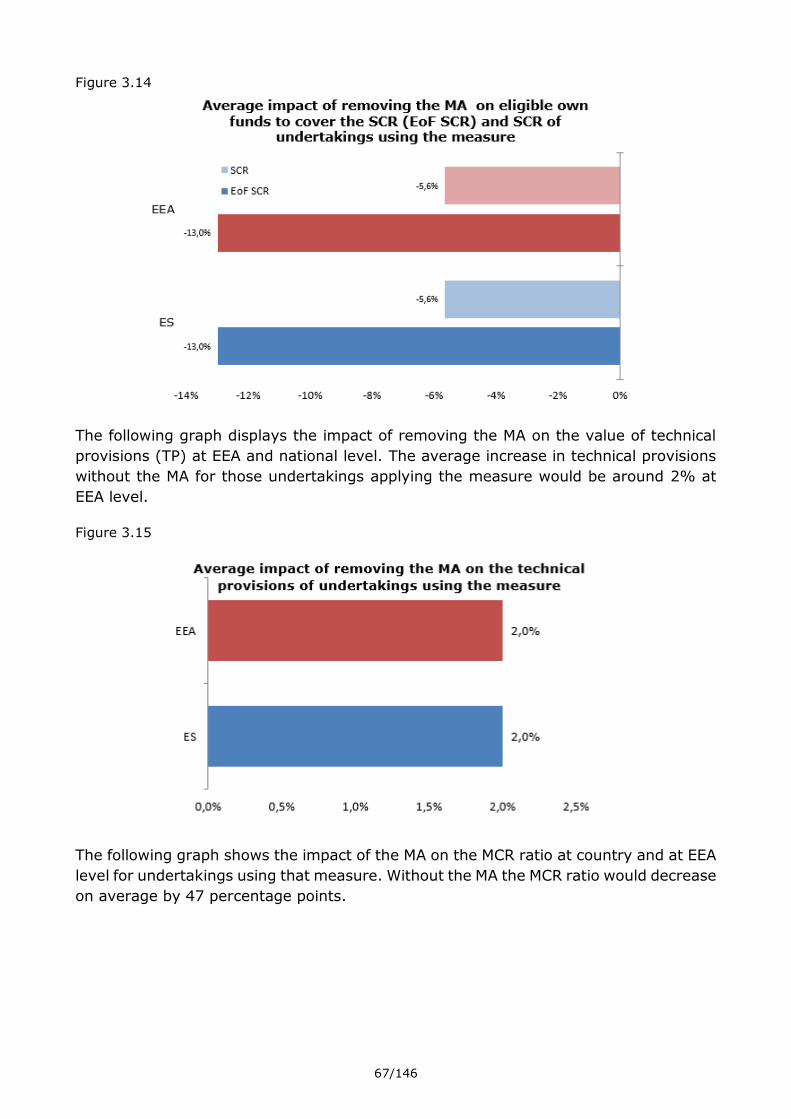
67/146
Figure 3.14
The following graph displays the impact of removing the MA on the value of technical
provisions (TP) at EEA and national level. The average increase in technical provisions
without the MA for those undertakings applying the measure would be around 2% at
EEA level.
Figure 3.15
The following graph shows the impact of the MA on the MCR ratio at country and at EEA
level for undertakings using that measure. Without the MA the MCR ratio would decrease
on average by 47 percentage points.
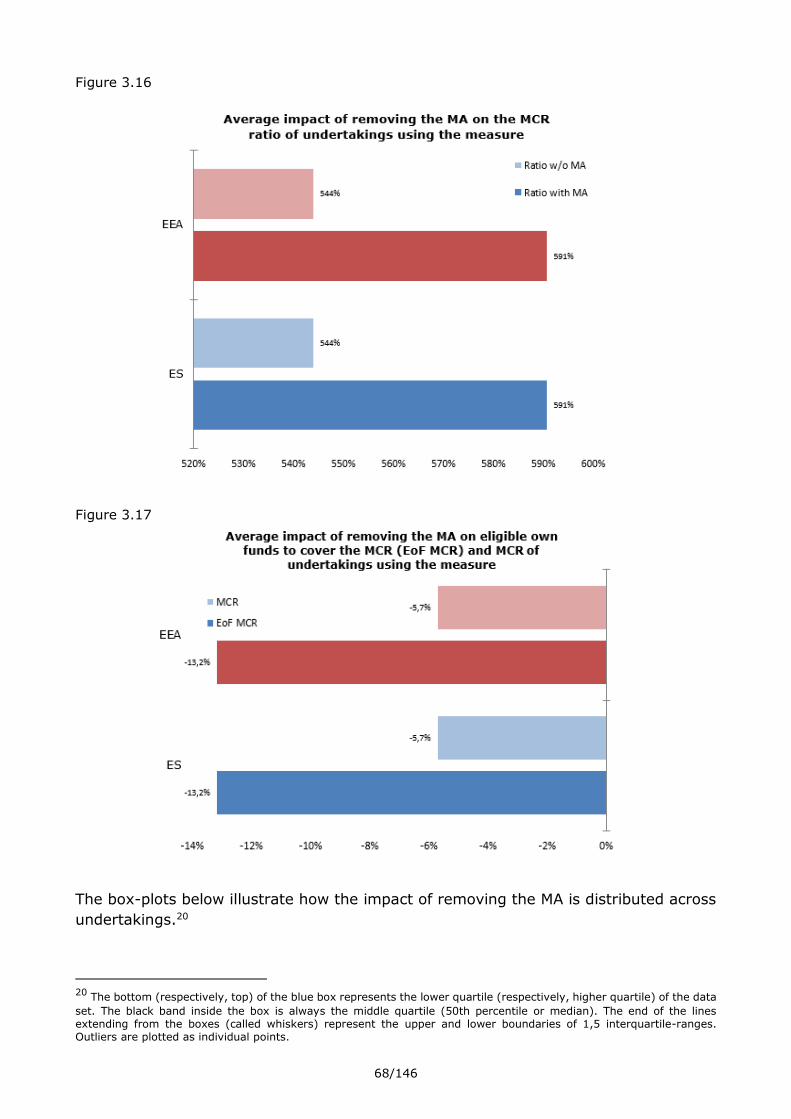
68/146
Figure 3.16
Figure 3.17
The box-plots below illustrate how the impact of removing the MA is distributed across
undertakings.20
20
The bottom (respectively, top) of the blue box represents the lower quartile (respectively, higher quartile) of the data
set. The black band inside the box is always the middle quartile (50th percentile or median). The end of the lines extending from the boxes (called whiskers) represent the upper and lower boundaries of 1,5 interquartile-ranges. Outliers are plotted as individual points.

69/146
Figure 3.18
Impact on the investments of undertakings
The following graphs compare the average asset portfolio of undertakings applying the
MA. Please note that the information in this section does not address specific
consequences for the investments resulting from the matching requirements when
applying the MA.
The tables below show the average investment allocation of undertakings using the MA
in ES.
Table 3.3
Table 3.4
The tables below show the credit quality of the portfolio of government and corporate
bonds. This is shown separately for undertakings applying the MA and the undertakings
not applying the MA respectively. These tables indicate that there are some differences
in credit quality of bonds, between undertakings applying the MA or not applying the
MA. However, when comparing these data with the differences in the credit quality of
bonds between countries, as presented in section II.4 of the report, the differences
between undertakings applying the MA or not applying the MA are relatively limited. In
other words, the “country effect” is considerably larger than the effect of using the MA
Country Government bonds Corporate bondsUnit linked/index
linkedEquity
Collective
Investment
Undertakings
Mortgages and
loans
Cash and
depositsOther
ES 68% 14% 9% 2% 0% 0% 5% 1%
Investment allocation at EEA and country level of undertakings applying the MA
Country Government bonds Corporate bonds EquityCollective Investment
UndertakingsMortgages and loans Cash and deposits Other
ES 75% 15% 2% 0% 0% 6% 1%
Investment allocation at EEA and country level (without assets held for IL & UL contracts) of undertakings applying the MA

70/146
or not using the MA. Furthermore it is not possible to prove a causality in this difference,
as the subset of undertakings applying the MA in ES might allocate assets differently
from the other insurers independent of the MA. Also, the number of undertakings
applying the MA is quite small, so any attempts to identify clear trends need to bear
this in mind.
Table 3.5
Table 3.6
The graphs below show the duration of investments in government bonds and corporate
bonds for undertakings using the MA and undertakings not using the MA in ES.
Figure 3.19
Country Use of the measures CQS0 CQS1 CQS2 CQS3 CQS>3
No use of MA 4% 7% 50% 38% 1%
Use of the MA 1% 0% 84% 15% 0%
Credit quality of government bonds for undertakings not using the MA or using the MA,
for ES (without assets held for IL & UL contracts)
ES
Country Use of the measures CQS0 CQS1 CQS2 CQS3 CQS>3
No use of MA 3% 14% 29% 50% 4%
Use of the MA 1% 14% 37% 46% 2%
Credit quality of corporate bonds for undertakings not using the MA or using the MA,
for ES (without assets held for IL & UL contracts)
ES
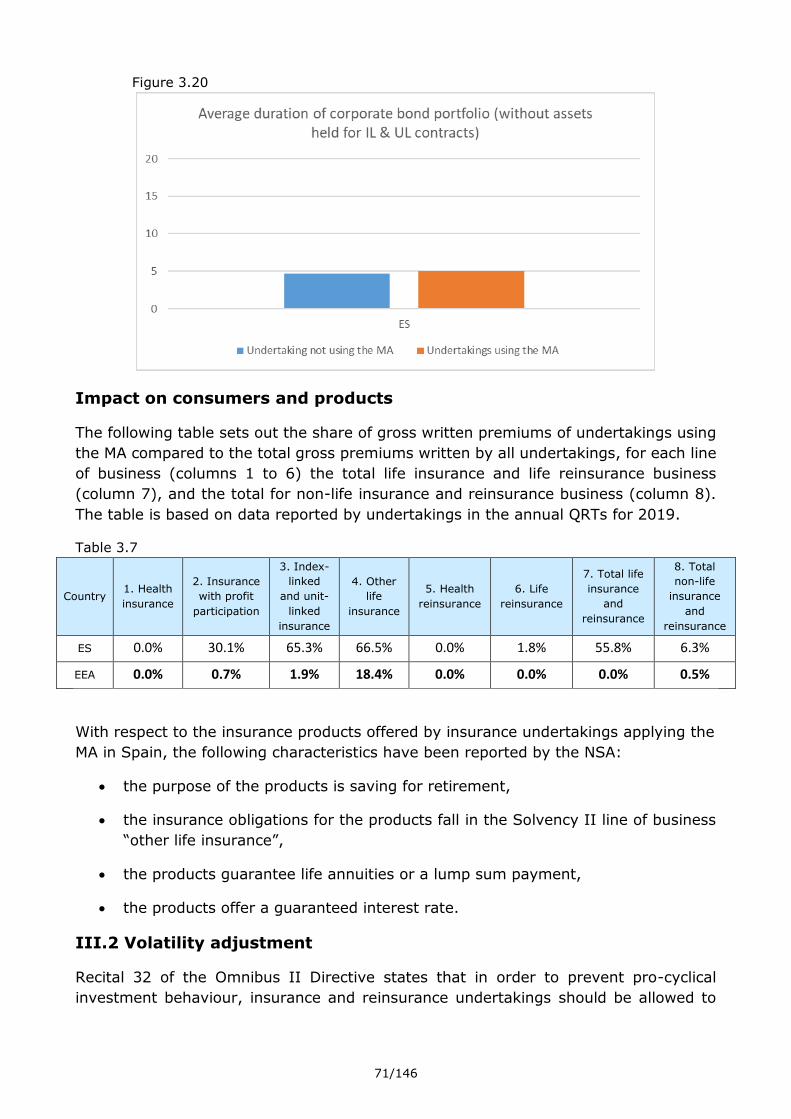
71/146
Figure 3.20
Impact on consumers and products
The following table sets out the share of gross written premiums of undertakings using
the MA compared to the total gross premiums written by all undertakings, for each line
of business (columns 1 to 6) the total life insurance and life reinsurance business
(column 7), and the total for non-life insurance and reinsurance business (column 8).
The table is based on data reported by undertakings in the annual QRTs for 2019.
Table 3.7
Country 1. Health
insurance
2. Insurance
with profit
participation
3. Index-
linked
and unit-
linked
insurance
4. Other
life
insurance
5. Health
reinsurance
6. Life
reinsurance
7. Total life
insurance
and
reinsurance
8. Total
non-life
insurance
and
reinsurance
ES 0.0% 30.1% 65.3% 66.5% 0.0% 1.8% 55.8% 6.3%
EEA 0.0% 0.7% 1.9% 18.4% 0.0% 0.0% 0.0% 0.5%
With respect to the insurance products offered by insurance undertakings applying the
MA in Spain, the following characteristics have been reported by the NSA:
the purpose of the products is saving for retirement,
the insurance obligations for the products fall in the Solvency II line of business
“other life insurance”,
the products guarantee life annuities or a lump sum payment,
the products offer a guaranteed interest rate.
III.2 Volatility adjustment
Recital 32 of the Omnibus II Directive states that in order to prevent pro-cyclical
investment behaviour, insurance and reinsurance undertakings should be allowed to

72/146
adjust the relevant risk-free interest rate term structure to mitigate the effect of
exaggerations of bond spreads.
For that purpose insurance and reinsurance undertakings can apply a volatility
adjustment (VA) to the risk-free interest rate term structure. The VA is based on 65%
of the risk-corrected spread between the interest rate that could be earned from a
reference portfolio of assets and the risk-free interest rates without any adjustment.
The reference portfolio is representative for the assets which insurance and reinsurance
undertakings are invested in to cover their insurance and reinsurance obligations.
Member States may require prior approval by supervisory authorities for insurance and
reinsurance undertakings to apply a VA.
The VA is derived per currency. It is the same for all insurance and reinsurance
obligations of a currency unless a country specific increase applies.
Undertakings that apply a VA to a portfolio of insurance or reinsurance obligations shall
not apply a MA to those obligations.
Article 77d(6) of the Solvency Directive states that by way of derogation from Article
101, the SCR shall not cover the risk of loss of basic own funds resulting from changes
of the VA.
Use of the volatility adjustment
The VA is used by 631 undertakings in 21 countries.
Figure 3.21
0
20
40
60
80
100
120
140
160
180
AT BE BG CZ DE DK ES FI FR GR HU IE IT LI LU NL NO PT SE SK
Number of undertakings using the VA
Life Non-Life Both Life and non-life Reinsurance

73/146
Table 3.8
Number of undertakings using the VA
Country Life Non-Life
Both Life
and non-
life
Reinsurance Total Last year
Variation
from last
year
AT 3 2 6 1 12 12 0
BE 7 14 17 1 39 38 1
BG 1 1 2 0 4 5 -1
CZ 0 1 6 0 7 8 -1
DE 58 21 0 5 86 84 2
DK 9 4 6 0 19 20 -1
ES 15 26 38 1 80 80 0
FI 5 2 2 0 9 8 1
FR 47 58 54 1 160 167 -7
GR 2 4 13 0 19 19 0
HU 0 1 5 0 6 6 0
IE 3 2 0 4 9 8 1
IT 25 24 18 0 67 64 3
LI 2 1 0 0 3 2 1
LU 25 7 0 9 41 43 -2
NL 20 15 0 1 36 40 -4
NO 4 1 4 0 9 9 0
PT 8 8 2 0 18 17 1
RO 0 0 0 0 0 0 0
SE 1 0 0 0 1 1 0
SK 0 0 5 0 5 5 0
EEA 236 193 178 24 631 636 -6
The total number of undertakings using the VA in the EEA decreased by 6 in comparison
to last year’s report (excluding the effect of UK in this analysis).
Figure 3.22
0%
5%
10%
15%
20%
25%
30%
35%
AT BE BG CZ DE DK ES FI FR GR HU IE IT LI LU NL NO PT SE SK
EEA market share in technical provisions of undertakings using the VA
Life Non-life

74/146
Insurance and reinsurance undertakings using the VA represent 79% of the overall
amount of technical provisions at EEA level.
The following graph shows how widespread the use of the VA is for each country. It
gives the technical provisions of undertakings that use the VA as a percentage of their
market share. The graph clearly shows the importance of the VA in many countries,
where undertakings using the VA together hold more than 75% of the national amount
of technical provisions. Most of the technical provisions for life insurance liabilities are
held by undertakings using the VA.
Figure 3.23
According to the Solvency II Directive it is possible to apply simultaneously the TTP or
the TRFR and the VA to the same liabilities. At EEA level, undertakings with 21% of the
overall amount of technical provisions are applying the VA and the TTP to the same
liabilities.
Table 3.9
Undertakings applying simultaneously TTP and VA to the same liabilities
Country Number of
undertakings
% EEA market
share in TP
% National market
share in TP
AT 2 (*) (*)
BE 1 (*) (*)
0% 10% 20% 30% 40% 50% 60% 70% 80% 90% 100%
AT
BE
BG
CZ
DE
DK
ES
FI
FR
GR
HU
IE
IT
LI
LU
NL
NO
PT
SE
SK
Total Geral
National market share in technical provisions of undertakings using the VA
Life Non-life
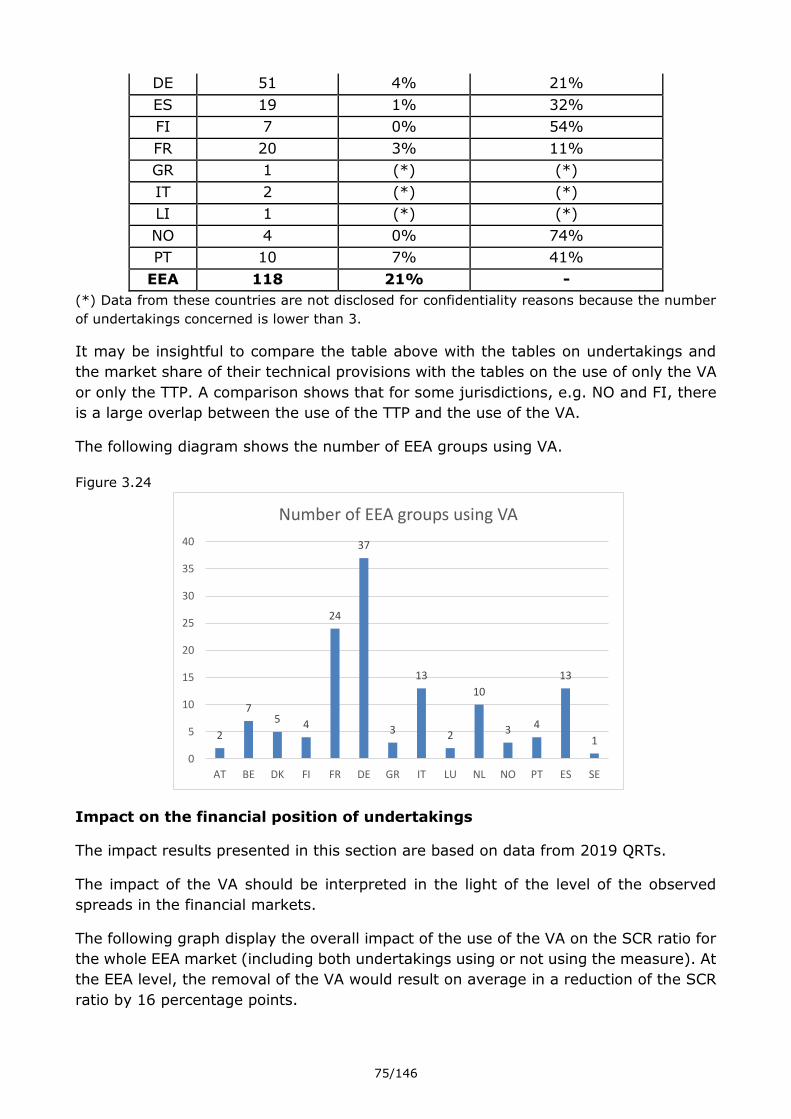
75/146
DE 51 4% 21%
ES 19 1% 32%
FI 7 0% 54%
FR 20 3% 11%
GR 1 (*) (*)
IT 2 (*) (*)
LI 1 (*) (*)
NO 4 0% 74%
PT 10 7% 41%
EEA 118 21% -
(*) Data from these countries are not disclosed for confidentiality reasons because the number
of undertakings concerned is lower than 3.
It may be insightful to compare the table above with the tables on undertakings and
the market share of their technical provisions with the tables on the use of only the VA
or only the TTP. A comparison shows that for some jurisdictions, e.g. NO and FI, there
is a large overlap between the use of the TTP and the use of the VA.
The following diagram shows the number of EEA groups using VA.
Figure 3.24
Impact on the financial position of undertakings
The impact results presented in this section are based on data from 2019 QRTs.
The impact of the VA should be interpreted in the light of the level of the observed
spreads in the financial markets.
The following graph display the overall impact of the use of the VA on the SCR ratio for
the whole EEA market (including both undertakings using or not using the measure). At
the EEA level, the removal of the VA would result on average in a reduction of the SCR
ratio by 16 percentage points.
2
75 4
24
37
3
13
2
10
3 4
13
1
0
5
10
15
20
25
30
35
40
AT BE DK FI FR DE GR IT LU NL NO PT ES SE
Number of EEA groups using VA

76/146
Figure 3.25

77/146
The following graph shows the overall impact of the use of the VA on the SCR ratio for
the whole EEA market during the last four years. The highest impact was observed in
2018, where removing the VA would result on average in a decrease of the SCR ratio
by 19 percentage points; the VA for the Euro was 24 bp at the end of that year. The
lowest impact observed in 2017 is due to the size of the VA, which was only 4 bp for
the Euro at the end of that year.
Figure 3.26
The following graphs show the average impact at EEA level and per country of the VA
on the SCR ratio. The graphs are based on impact of the VA for the undertakings that
apply the VA.
At EEA level removing the VA results in an average reduction of the SCR ratio of 25
percentage points. The average change in SCR ratios is the highest for undertakings in
Netherlands, Germany and Norway. This comes from the fact that the impacts on SCR
are significantly higher for those countries.
In comparison with last year, the average impact of removing the VA has overall
decreased.
Figure 3.27

78/146
Figure 3.28

79/146
The following graph shows the overall impact of the use of the VA on the SCR ratio for
for undertakings using the measure during the last four years. The highest impact was
observed in 2018, where removing the VA would result on average in a decrease of the
SCR ratio by 35 percentage points.
Figure 3.29

80/146
The following graph displays the impact of removing the VA on the SCR ratio of every
undertaking using this measures. Each dot in the diagram represents one undertaking,
comparing the individual SCR ratio against the estimated SCR ratio without the VA. The
type of each undertaking is indicated by the colour of the dot.
In terms of SCR ratio, 97% of undertakings that use the VA reported an absolute impact
of less than 100 percentage points.
0,8% of undertakings using the measure reported an SCR ratio without VA below 100%.
0,16% of undertakings using the measure reported negative eligible own funds to cover
the SCR without VA.
Also note that the Life and Composite undertakings show, in general, slightly higher
impacts on this level than Non-life undertakings.
Figure 3.30

81/146
The following graph displays the impact of removing the VA on the MCR ratio of every
undertaking using the VA, comparing the individual MCR ratio against the estimated
MCR ratio without the VA. In terms of MCR ratio, 94% of undertakings that use the VA
reported an absolute of less than 100 percentage points.
0,16% of undertakings using the measure reported an MCR ratio without VA below
100%. The same 0,16% of undertakings reported negative eligible own funds to cover
the MCR without VA.
Figure 3.31
The following graph shows the impact of removing the VA on the SCR (light blue) and
on the eligible own funds to cover the SCR (dark blue). The red bars are for the EEA
level. On average, eligible own funds to cover the SCR would decrease by 1.5%, while
the SCR would increase by 10% if the VA were removed. In comparison with last year,
impacts have overall decreased for both SCR and eligible own funds to cover the SCR.
Figure 3.32

82/146

83/146
The following graph displays the impact of removing the VA on the value of technical
provisions (TP) at EEA and national level. Removing the VA for those undertakings
applying the measure would result in an average increase of technical provisions by
0.3% at EEA level.
Figure 3.33

84/146
The following graphs show the average impact of the VA on the MCR ratio, the MCR and
the eligible own funds to cover the MCR, at country and at EEA level for undertakings
using that measure. At the EEA level, the removal of the VA would result on average in
a reduction of the MCR ratio by 48 percentage points.
Figure 3.34

85/146
Figure 3.35

86/146
The box-plots below illustrate how the impact of removing the VA is distributed across
undertakings.21
Figure 3.36
The size of the VA as at year end 2019 for the Euro is 7 bps and has thus decreased
from year end 2018 where it was 24bps. The graphs presented in this section show that
the impact of a removal of the VA on the solvency position is considerable for a number
of countries. This was already observed in the previous LTG reports. With the decrease
in the size of the VA, the financial impact of the VA on the solvency positions of
undertakings has decreased as well.In any case, the magnitude of the impact differs
from one country to another. One should keep in mind that the comparisons of the
figures are affected by the dynamic modelling of the VA of some internal model users
that are embedded in the analysis.
Treatment of the VA in internal models
Two different treatments of the VA can be observed where internal models are used to
calculate the SCR. In some internal models the VA is considered to remain unchanged
during the 1-year forecast (constant VA). This approach is the same as the treatment
of the VA in the standard formula for the calculation of the SCR. Other internal models
take account of the possible change of the VA during the 1-year forecast (dynamic VA).
The VA can change over time because the spreads of the market indices that the VA
calculation is based on change or because the risk correction to the VA changes. Another
reason for change to the VA can be changes in the investment behaviour of insurance
21
The bottom (respectively, top) of the blue box represents the lower quartile (respectively, higher quartile) of the data
set. The black band inside the box is always the middle quartile (50th percentile or median). The end of the lines extending from the boxes (called whiskers) represent the upper and lower boundaries of 1,5 interquartile-ranges. Outliers are plotted as individual points.

87/146
and reinsurance undertakings as reflected in the annual updates of the representative
portfolio of assets that are applied in the VA calculation.
Where the VA moves in line with the spreads on the assets of the undertaking, the
modelling of a dynamic VA reduces the effect of spread widening and spread narrowing
on the own funds of the insurer: decreases in asset value caused by the spread widening
are partially or fully compensated by decreases of technical provisions caused by the
change of the VA. In the same way increases in asset values caused by narrower
spreads are compensated. As a result the capital requirements for the risk of spread
widening are usually lower if a dynamic VA is modelled than if a constant VA is being
used by those undertakings22.
The table below displays the number of undertakings using a dynamic modelling of the
VA per country and type of undertakings.
Table 3.10
Number of undertakings using the Dynamic VA
Country Life Non-Life Both Life
and non-life Reinsurance Total
AT 2 1 2 1 6
BE 0 2 1 0 3
CZ 0 0 1 0 1
DE 10 12 0 4 26
FR 6 5 1 1 13
IE 0 1 0 2 3
IT 1 0 1 0 2
NL 4 4 0 1 9
EEA 23 25 6 9 63
The following graphs display the impacts of removing the VA on SCR ratio and the SCR
of undertakings using the measure. They are broken down between undertakings using
the standard formula; undertakings using an internal model with a constant VA; and
undertakings using an internal model and using a dynamic VA. These impacts are
displayed at EEA level and country level for countries where there are internal model
users. Impacts on SCR ratio are shown in percentage points.
The graph shows that the use of dynamic VA has a considerable effect on the SCR ratio
of undertakings using it. It should be noted that the size of the three samples (standard
formula users, undertakings using an internal model using a constant VA and
undertakings using an Internal model and using a dynamic VA) varies from one country
to another. For example, undertakings using an internal model and using a dynamic VA
represents 3% to 64% of the technical provisions in the concerned jurisdictions.
22
Note that dynamic VA approaches were only approved, if all credit risks are modelled including sovereign risk.

88/146
Figure 3.37
The graph provides for the weighted average results per market for the standard
formula users compared to IM users that apply the VA. These results are reflective of
the composition of these samples in the different markets.
The following graphs therefore provide for a more detailed split differentiating by life
and composite undertakings compared to non-life and reinsurance undertakings.

89/146
Figure 3.38

90/146
Figure 3.39
Additional information on the VA based on the QRT information
Based on the quantitative information that undertakings regularly provide to
supervisory authorities further analysis was performed.
The following graph outlines the split of Best Estimate subject to VA that is written in
different currencies as at year end 2019. Only the most material currencies are
considered in this graph.

91/146

92/146
Figure 3.40
Application of a country-specific increase to the VA
Background information on the calculation of the VA
For each currency the VA is calculated as 65% of a risk-corrected spread (S_RCcurrency).
The relevant spread is the difference between the interest rate that could be earned
from assets included in a reference portfolio for assets in that currency and the basic
risk-free interest rates for that currency.
A country-specific increase to the VA may apply, depending on the spread on the assets
of a country-specific reference portfolio. That increase is calculated as 65% of the
difference between the risk-corrected spread of that country reference portfolio
(S_RCcountry) and twice the risk-corrected currency spread S_RCcurrency. The country-
specific increase applies whenever that difference is positive (i.e. when S_RCcountry > 2*
S_RCcurrency) and the risk-corrected country spread is higher than 85 basis points23. This
implies that the country-specific increase cannot be negative while the VA before
increase can assume both positive and negative values.
The VA with country-specific increase is given by the following equation:
VA = 65% * [S_RCcurrency + max (S_RCcountry – 2* S_RCcurrency, 0) ] ,
where S_RCcountry > 85 bps.
S_RCcurrency and S_RCcountry are calculated as the difference between the spread at
portfolio level (Scurrency and Scountry) and the related risk correction (RCcurrency and RCcountry):
S_RCcurrency = Scurrency – RCcurrency and S_RCcountry = Scountry – RCcountry
23 The threshold has been lowered from 100 bps to 85 bps by the Directive 2019/2177 of 18 December 2019 (art. 2).
0%
10%
20%
30%
40%
50%
60%
70%
80%
90%
100%
Euro PoundSterling
Danish Krone NorwegianKrone
US Dollar
Share of Best Estimate subject to VA per currency

93/146
The reference portfolio comprises two asset classes that contribute to the spread:
government bonds and corporate bonds. For each class the average spreads (Sgov and
Scorp) and the risk corrections (RCgov and RCcorp) are derived.
The portfolio spreads (Scurrency and Scountry) and portfolio risk corrections (RCcurrency and
RCcountry) are calculated by applying portfolio weights (wgov, wcorp) to the government
and corporate components:
Scurrency = wgov*max(Sgov;0) + wcorp*max (Scorp; 0)
RCcurrency = wgov*max(RCgov;0) + wcorp*max(0;RCcorp)
Scountry and RCcountry are calculated in the same way, but based on the reference portfolio
per country.
The reference portfolios are representative of assets held by European insurance and
reinsurance undertakings to cover:
- the best estimate for (re)insurance obligations denominated in that currency
(reference portfolio per currency)
- the best estimate for (re)insurance obligations of products sold in the insurance
market of that country and denominated in the currency of that country (reference
portfolio per country).
In particular the reference portfolios considers:
a. Data from the relevant government bonds yield market indices, required to determine
the interest rates of government bonds including in the representative portfolio, by
duration and country of issuance (those interest rates are then used to compute the
spread S and the risk correction RC for those government bonds).
For countries of the euro area not having a government yield curve, there is no country-
specific increase and the spread of government bond is approximated considering a
peer country24.
b. Data from the relevant corporate bonds yield market indices, required to determine
the interest rates of corporate bonds including in the representative portfolio, by
duration, sector and credit quality step (those interest rates are then used to compute
the spread S and the risk correction RC for corporate bonds).
The reference portfolios are updated on an annual basis.
1) Analysis of the amount of the currency and country risk-corrected spread for the
calculation of the VA (S_RCcountry and S_RCcurrency)
24
Countries without government yield curves are Cyprus, Estonia, Latvia, Liechtenstein, Lithuania and
Malta.

94/146
Figure 3.41
The graph shows the risk-corrected currency spread (blue bar), the risk-corrected
country spread (red bar) and the final value of the VA (green triangle), for each country
relevant in reference portfolios. It also shows the trigger level of the country-specific
increase of 85 bps (red line). When applying 65% to the blue bar, the final value of the
VA (represented by the green triangle) results. The reference date for the data is the
31 December 2019.
It can be observed that the risk-corrected currency spreads are considerably lower than
at 2018 year-end, with the exception of Norway, whose currency spread decreased only
by a relatively small amount.
Heterogeneity among countries with regard to the risk-corrected country spread
persists, although it decreased considerably among the countries of the euro area that
apply the same amount of VA due to the compression of spreads occurred at the end of
2019. Outside the euro area a risk corrected country spread higher than the currency
one can be observed in the Czech Republic, Croatia, Romania and Iceland, whereas in
the euro area this happens only in Italy (about four times higher) and Spain (but only
by one basis point). Italian spreads, although decreased at the end of the year from the
highs of the period May 2018 – September 2019, remained higher than the Eurozone
spreads. It is interesting to note that the Greek risk corrected country spread became
negative (-10 bps) at year end 2019, even though the level of spreads in Greece was
still high. This heterogeneity means that, at country level, the spread deriving from
assets held by the national undertakings can be significantly different (higher or lower)
than the level of spread of the assets included in the representative portfolio defined at
currency level, leading to a potentially high balance sheet volatility.

95/146
2) Analysis of the amount of the government and corporate risk-corrected spread for
the calculation of the country VA (S_RC_gov_country, S_RC_corp_country and
S_RC_country)
Background information on the calculation of the risk correction
The risk correction is intended to account for expected losses, unexpected credit
risk, and any other relevant risks of the assets. It is calculated as follows:
For the spread on government bonds:
RC= 30% LTAS for exposures to governments of EEA countries
RC= 35% LTAS for exposures to other governments
where LTAS is the long-term average of the spread over the risk-free interest rate of
assets of the same duration, credit quality and asset class. The average relates to the
last 30 years.
For the spread on corporate bonds:
RC = MAX ( PD + CoD, 35% LTAS ), where
PD = the credit spread corresponding to the probability of default on the assets;
CoD = the credit spread corresponding to the expected loss resulting from
downgrading of the assets;
LTAS = as above
Where no reliable credit spreads can be derived from long-term default statistics, the
risk correction can be expressed as:
RC= 35% LTAS.

96/146
Figure 3.42
Figure 3.43
These graphs look at the national component of the VA only (the first graph relates to
the countries of the euro area, and the second graph relates to the countries with other
currencies). The reference date for the data is the 31 December 2019.
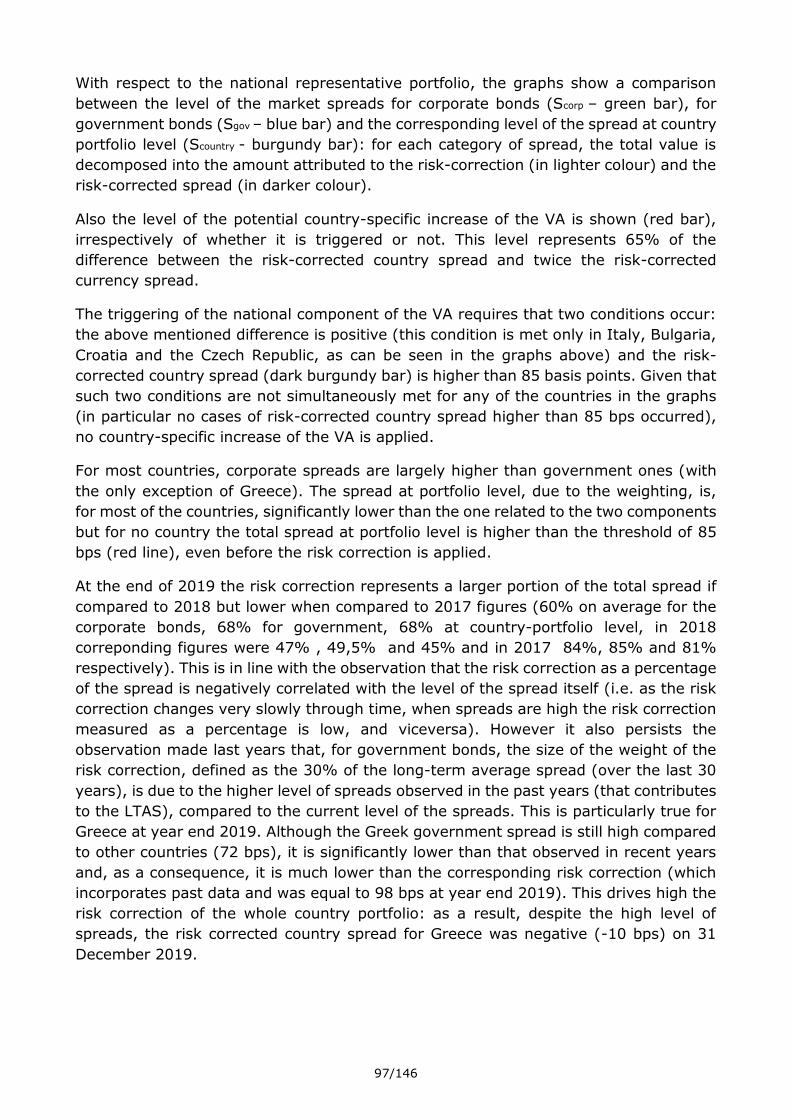
97/146
With respect to the national representative portfolio, the graphs show a comparison
between the level of the market spreads for corporate bonds (Scorp – green bar), for
government bonds (Sgov – blue bar) and the corresponding level of the spread at country
portfolio level (Scountry - burgundy bar): for each category of spread, the total value is
decomposed into the amount attributed to the risk-correction (in lighter colour) and the
risk-corrected spread (in darker colour).
Also the level of the potential country-specific increase of the VA is shown (red bar),
irrespectively of whether it is triggered or not. This level represents 65% of the
difference between the risk-corrected country spread and twice the risk-corrected
currency spread.
The triggering of the national component of the VA requires that two conditions occur:
the above mentioned difference is positive (this condition is met only in Italy, Bulgaria,
Croatia and the Czech Republic, as can be seen in the graphs above) and the risk-
corrected country spread (dark burgundy bar) is higher than 85 basis points. Given that
such two conditions are not simultaneously met for any of the countries in the graphs
(in particular no cases of risk-corrected country spread higher than 85 bps occurred),
no country-specific increase of the VA is applied.
For most countries, corporate spreads are largely higher than government ones (with
the only exception of Greece). The spread at portfolio level, due to the weighting, is,
for most of the countries, significantly lower than the one related to the two components
but for no country the total spread at portfolio level is higher than the threshold of 85
bps (red line), even before the risk correction is applied.
At the end of 2019 the risk correction represents a larger portion of the total spread if
compared to 2018 but lower when compared to 2017 figures (60% on average for the
corporate bonds, 68% for government, 68% at country-portfolio level, in 2018
correponding figures were 47% , 49,5% and 45% and in 2017 84%, 85% and 81%
respectively). This is in line with the observation that the risk correction as a percentage
of the spread is negatively correlated with the level of the spread itself (i.e. as the risk
correction changes very slowly through time, when spreads are high the risk correction
measured as a percentage is low, and viceversa). However it also persists the
observation made last years that, for government bonds, the size of the weight of the
risk correction, defined as the 30% of the long-term average spread (over the last 30
years), is due to the higher level of spreads observed in the past years (that contributes
to the LTAS), compared to the current level of the spreads. This is particularly true for
Greece at year end 2019. Although the Greek government spread is still high compared
to other countries (72 bps), it is significantly lower than that observed in recent years
and, as a consequence, it is much lower than the corresponding risk correction (which
incorporates past data and was equal to 98 bps at year end 2019). This drives high the
risk correction of the whole country portfolio: as a result, despite the high level of
spreads, the risk corrected country spread for Greece was negative (-10 bps) on 31
December 2019.

98/146
Impact on investments of undertakings
The following tables and graphs illustrate some characteristics of the investments held
by undertakings using the VA.
Similar to the tables and graphs in the general section II.4 of the report, the tables and
graphs below consider the investments of undertakings from three perspectives:
- The investment allocation
- The credit quality of the bond portfolio, separately for government bonds and
corporate bonds
- The duration of the bond portfolio, separately for government bonds and
corporate bonds
The following tables show the investment allocation of undertakings applying the VA.
Please note that, due to confidentiality reasons, any cells that relate to less than three
undertakings are denoted by (*).
Table 3.11
Table 3.12
Country Government bonds Corporate bondsUnit linked/index
linkedEquity
Collective
Investment
Undertakings
Mortgages and
loans
Cash and
depositsOther
EEA 28% 25% 18% 11% 7% 4% 3% 4%
AT 22% 28% 16% 14% 7% 5% 2% 6%
BE 43% 18% 12% 8% 1% 12% 3% 4%
BG 54% 9% 17% 10% 0% 1% 5% 3%
CY (*) (*) (*) (*) (*) (*) (*) (*)
CZ 37% 18% 25% 11% 0% 5% 3% 1%
DE 19% 25% 6% 16% 21% 6% 3% 4%
DK 8% 18% 37% 15% 17% 3% 2% 1%
ES 58% 20% 8% 5% 0% 1% 5% 3%
FI 5% 16% 61% 4% 5% 1% 5% 3%
FR 28% 33% 16% 10% 3% 2% 2% 5%
GR 55% 15% 18% 5% 1% 0% 4% 1%
HU 42% 1% 51% 1% 3% 0% 2% 0%
IE 11% 11% 65% 1% 1% 1% 10% 1%
IT 43% 18% 18% 11% 2% 1% 2% 5%
LI 20% 38% 25% 4% 0% 2% 11% 0%
LU 7% 10% 79% 2% 0% 0% 2% 1%
NL 29% 12% 20% 3% 4% 22% 3% 7%
NO 8% 31% 24% 17% 9% 8% 2% 0%
PT 40% 20% 31% 1% 4% 1% 2% 1%
RO (*) (*) (*) (*) (*) (*) (*) (*)
SE (*) (*) (*) (*) (*) (*) (*) (*)
SK 42% 27% 20% 5% 1% 0% 4% 1%
Investment allocation at EEA and country level of undertakings applying the VA
Country Government bonds Corporate bonds EquityCollective Investment
UndertakingsMortgages and loans Cash and deposits Other
EEA 34% 30% 13% 9% 5% 3% 5%
AT 27% 34% 17% 8% 6% 3% 7%
BE 49% 21% 9% 1% 13% 3% 4%
BG 65% 11% 12% 1% 1% 6% 4%
CY (*) (*) (*) (*) (*) (*) (*)
CZ 49% 24% 15% 0% 7% 4% 1%
DE 21% 26% 17% 22% 6% 3% 4%
DK 13% 28% 23% 26% 5% 3% 2%
ES 63% 21% 5% 0% 1% 6% 4%
FI 13% 41% 10% 14% 3% 12% 7%
FR 34% 39% 12% 4% 2% 3% 6%
GR 68% 19% 6% 1% 1% 5% 2%
HU 86% 1% 2% 5% 1% 5% 0%
IE 31% 31% 2% 3% 3% 28% 2%
IT 53% 22% 14% 2% 1% 2% 6%
LI 27% 51% 5% 0% 2% 14% 0%
LU 32% 48% 7% 1% 2% 7% 3%
NL 37% 15% 4% 4% 28% 4% 9%
NO 10% 41% 23% 12% 11% 3% 0%
PT 58% 29% 2% 6% 1% 3% 1%
RO (*) (*) (*) (*) (*) (*) (*)
SE (*) (*) (*) (*) (*) (*) (*)
SK 52% 34% 7% 1% 0% 5% 1%
Investment allocation at EEA and country Level (without assets held for IL & UL contracts) of undertakings applying the VA

99/146
The following table shows the credit quality of government bonds. Please note that the
data at EEA level for undertakings not using the VA includes data from countries where
the VA is not used at all.
Table 3.13
Country Use of the measures CQS0 CQS1 CQS2 CQS3 CQS>3
No use of VA 30% 41% 16% 12% 1%
Use of the VA 14% 44% 15% 27% 1%
No use of VA 15% 59% 18% 8% 0%
Use of the VA 0% 58% 32% 10% 1%
No use of VA 4% 69% 16% 10% 1%
Use of the VA 9% 72% 10% 8% 0%
No use of VA 1% 25% 24% 50% 1%
Use of the VA 3% 1% 15% 81% 0%
No use of VA 18% 16% 21% 35% 9%
Use of the VA (*) (*) (*) (*) (*)
No use of VA 2% 93% 5% 0% 0%
Use of the VA 5% 60% 29% 5% 1%
No use of VA 42% 40% 12% 6% 1%
Use of the VA 34% 47% 15% 5% 0%
No use of VA 73% 19% 2% 4% 2%
Use of the VA 67% 16% 4% 10% 3%
No use of VA 20% 21% 44% 13% 2%
Use of the VA 0% 0% 0% 0% 0%
No use of VA 6% 12% 57% 24% 0%
Use of the VA 2% 2% 74% 22% 0%
No use of VA 21% 67% 5% 7% 0%
Use of the VA 45% 49% 2% 3% 1%
No use of VA 8% 76% 7% 9% 0%
Use of the VA 8% 76% 7% 9% 0%
No use of VA 25% 35% 9% 9% 23%
Use of the VA 10% 13% 8% 13% 56%
No use of VA 1% 2% 6% 85% 6%
Use of the VA 0% 0% 0% 0% 0%
No use of VA 0% 0% 1% 96% 3%
Use of the VA 1% 1% 0% 99% 0%No use of VA 32% 48% 12% 7% 0%Use of the VA 36% 45% 13% 6% 0%
No use of VA 0% 0% 78% 14% 8%
Use of the VA 0% 0% 0% 0% 0%
No use of VA 2% 8% 5% 84% 1%
Use of the VA 2% 5% 7% 85% 0%
No use of VA 68% 24% 5% 3% 0%
Use of the VA 49% 28% 16% 7% 0%
No use of VA 43% 49% 5% 3% 0%
Use of the VA 26% 53% 7% 14% 0%
No use of VA 55% 26% 6% 9% 4%
Use of the VA 55% 35% 3% 6% 0%
No use of VA 60% 34% 5% 1% 0%
Use of the VA 50% 37% 12% 0% 0%
No use of VA 1% 2% 1% 95% 0%
Use of the VA 6% 14% 18% 61% 1%
No use of VA 0% 0% 1% 99% 0%
Use of the VA (*) (*) (*) (*) (*)
No use of VA 94% 5% 1% 0% 0%
Use of the VA (*) (*) (*) (*) (*)
No use of VA 7% 1% 83% 7% 2%
Use of the VA 10% 21% 64% 5% 0%
NL
NO
PT
RO
SE
SK
LU
ES
FI
FR
GR
HR
HU
IS
IT
LI
IE
EE
Credit quality of government bonds for undertakings not using the VA or using the VA, per country
(without assets held for IL & UL contracts)
EEA
AT
BE
BG
CY
CZ
DE
DK

100/146
The following table shows the credit quality of corporate bonds. Please note that the
data at EEA level for undertakings not using the VA includes data from countries
where the VA is not used at all.
Table 3.14
Country Use of the measures CQS0 CQS1 CQS2 CQS3 CQS>3
No use of VA 37% 17% 26% 18% 2%
Use of the VA 17% 17% 33% 31% 2%
No use of VA 32% 16% 29% 22% 1%
Use of the VA 19% 21% 36% 23% 1%
No use of VA 8% 21% 43% 24% 4%
Use of the VA 10% 18% 34% 37% 2%
No use of VA 6% 8% 21% 58% 8%
Use of the VA 6% 3% 42% 47% 3%
No use of VA 20% 9% 29% 37% 5%
Use of the VA (*) (*) (*) (*) (*)
No use of VA 2% 31% 36% 31% 0%
Use of the VA 0% 3% 41% 52% 4%
No use of VA 40% 21% 24% 14% 1%
Use of the VA 37% 22% 23% 17% 1%
No use of VA 91% 2% 3% 2% 2%
Use of the VA 82% 7% 5% 5% 1%
No use of VA 13% 19% 32% 34% 2%
Use of the VA 0% 0% 0% 0% 0%
No use of VA 4% 14% 35% 43% 4%
Use of the VA 2% 14% 32% 49% 3%
No use of VA 5% 8% 39% 44% 5%
Use of the VA 10% 10% 27% 40% 14%
No use of VA 9% 20% 40% 29% 2%
Use of the VA 8% 19% 41% 31% 1%
No use of VA 29% 11% 30% 24% 6%
Use of the VA 1% 13% 35% 42% 9%
No use of VA 3% 3% 33% 50% 11%
Use of the VA 0% 0% 0% 0% 0%
No use of VA 1% 0% 27% 52% 21%
Use of the VA 0% 4% 30% 66% 0%
No use of VA 7% 14% 46% 32% 1%
Use of the VA 21% 14% 40% 24% 1%
No use of VA 0% 0% 0% 99% 1%
Use of the VA 0% 0% 0% 0% 0%
No use of VA 14% 8% 31% 45% 2%
Use of the VA 2% 7% 28% 55% 8%
No use of VA 13% 19% 47% 19% 1%
Use of the VA 38% 16% 25% 21% 0%
No use of VA 12% 17% 41% 29% 1%
Use of the VA 7% 12% 44% 36% 2%
No use of VA 8% 22% 33% 31% 7%
Use of the VA 4% 12% 40% 41% 3%
No use of VA 40% 10% 31% 19% 1%
Use of the VA 34% 14% 36% 16% 0%
No use of VA 0% 3% 43% 44% 10%
Use of the VA 5% 14% 33% 46% 3%
No use of VA 0% 0% 57% 43% 0%
Use of the VA (*) (*) (*) (*) (*)
No use of VA 78% 6% 8% 6% 2%
Use of the VA (*) (*) (*) (*) (*)
No use of VA 1% 25% 22% 46% 5%
Use of the VA 7% 14% 35% 44% 0%SK
NO
PT
RO
SE
NL
GR
HR
HU
IS
IT
LI
LU
IE
FR
EEA
AT
BE
BG
CY
CZ
DE
DK
EE
ES
FI
Credit quality of corporate bonds for undertakings not using the VA or using the VA per country
(without assets held for IL & UL contracts)

101/146
The following graph shows the average duration of government bonds and corporate
bonds for undertakings using the VA and not using the VA. Please note that the data at
EEA level for undertakings not using the VA includes data from countries where the VA
is not used at all. When considering these graphs, it may be worthwhile also referring
to the earlier section on the use of the VA at the beginning of this chapter. The VA is
used relatively more often by life undertakings than by non-life undertakings.
The differences between undertakings using the VA and those that do not use it are
comparatively small overall. There have been no significant changes between 2018 and
2019, with the exception of some minor shifts in some countries, which as in preceding
years most likely represent bond rating changes rather than changed investment
behaviour.
Figure 3.44
Impact on consumers and products
The following table sets out the share of gross written premiums of undertakings using
the VA compared to the total gross written premiums by all undertakings in that
country, for each line of business (columns 1 to 6) the total life insurance and life
reinsurance business (column 7), and the total for non-life insurance and reinsurance
business (column 8). The table is based on data reported by undertakings in the annual
QRTs for 2019.
For instance, in Austria 75.8% of the total life insurance and life reinsurance premiums
and 83% of health insurance premiums are written by undertakings applying the VA.

102/146
Table 3.15
Countr
y
1. Health
insuranc
e
2.
Insurance
with profit
participatio
n
3. Index-
linked
and unit-
linked
insuranc
e
4. Other
life
insuranc
e
5. Health
reinsuranc
e
6. Life
reinsuranc
e
7. Total life
insurance
and
reinsuranc
e
8. Total
non-life
insurance
and
reinsuranc
e
AT 81.2% 75.8% 74.4% 85.5% 23.4% 83.0% 77.4% 67.8%
BE 95.7% 96.0% 92.2% 89.3% -0.2% 29.0% 94.5% 72.1%
BG 87.9% 65.2% 88.6% 39.8% 0.0% 0.0% 56.1% 15.0%
CY (*) (*) (*) (*) (*) (*) (*) (*)
CZ 31.8% 52.6% 94.0% 85.7% 0.0% 1.8% 68.9% 46.8%
DE 32.8% 83.8% 84.1% 90.9% 31.9% 45.2% 63.5% 32.8%
DK 56.9% 81.6% 81.1% 57.4% 0.0% 0.0% 80.2% 11.9%
ES 97.3% 97.2% 98.7% 94.2% 0.0% 9.7% 93.5% 44.6%
FI 100.0% 96.1% 91.3% 70.5% 0.0% 100.0% 91.4% 41.2%
FR 96.6% 96.0% 97.7% 88.7% 54.8% 85.1% 93.8% 55.5%
GR 99.8% 93.1% 97.5% 99.4% 0.0% 100.0% 97.7% 63.3%
HU 78.4% 21.2% 46.3% 36.1% 0.0% 0.0% 36.7% 40.7%
IE 18.3% 0.3% 28.7% 28.3% 34.1% 10.1% 24.4% 15.0%
IT 100.0% 98.9% 92.9% 94.9% 100.0% 100.0% 97.1% 87.7%
LE 0.0% 2.3% 4.0% 0.0% 0.0% 0.0% 2.9% 9.7%
LU 0.0% 97.0% 92.4% 38.3% 0.0% 1.3% 81.1% 18.5%
MT (*) (*) (*) (*) (*) (*) (*) (*)
NL 93.3% 80.4% 100.0% 98.8% 53.9% 90.7% 94.9% 16.2%
NO 52.9% 90.6% 96.6% 99.0% 0.0% 0.0% 91.2% 17.3%
PT 0.0% 56.9% 59.8% 31.2% 0.0% 74.4% 48.3% 57.9%
RO (*) (*) (*) (*) (*) (*) (*) (*)
SE (*) (*) (*) (*) (*) (*) (*) (*)
SK 21.4% 23.2% 47.3% 49.1% 0.0% 0.0% 33.3% 53.4%
EEA 45.0% 89.8% 74.1% 78.5% 35.6% 55.7% 76.6% 40.1%
III.3 Transitional measure on the risk-free interest rates
For a period of 16 years after the start of Solvency II, insurance and reinsurance
undertakings may apply the transitional measure on the risk-free interest rate. Under
the transitional measure undertakings apply a transitional adjustment to the risk-free
interest rate for the valuation of insurance and reinsurance obligations. The transitional
adjustment is based on the difference between the discount rates of Solvency I and the
risk-free interest rates. At the beginning of Solvency II, the transitional adjustment is
100% of that difference. Over the transition period of 16 years, the transitional
adjustment is linearly reduced to zero. The transitional measure applies only to
insurance and reinsurance obligations from contracts in force before the start of
Solvency II.
The use of the transitional measure is subject to supervisory approval.
Use of the transitional measure on the risk-free interest rates

103/146
Only 5 undertakings, in 3 countries, are using the TRFR.
Figure 3.45
The market share in technical provisions of undertakings using the TRFR is negligible at
both EEA and national level, except in Greece where the aggregated market share of
the three undertakings using the TRFR is 24% of the national market.
According to the Solvency II Directive, it is possible to apply simultaneously the TRFR
and the VA to the same liabilities. All 5 European undertakings applying TRFR also apply
the VA.
Three EEA groups are using the TRFR.
Figure 3.46
Impact on the financial position of undertakings
The impact results presented in this section are based on data from 2019 Quantitative
Reporting Templates.
The number of TRFR users is limited (only 5 undertakings). In each country, the average
impact of the TRFR mirrors, to a large extent, the specifics of the individual undertakings
in that market, rather than the countries’ specificities.
0
1
2
3
4
DE GR IE
Number of undertakings using the TRFR
Life Reinsurance Both Life and non-life Non-Life
1 1 1
0
0,2
0,4
0,6
0,8
1
1,2
FR DE NL
Number of EEA groups using TRFR

104/146
The following graph shows the overall impact of the use of the TRFR on the SCR ratio
for the whole market of the countries where the TRFR is used. For those countries, it
includes both undertakings using and not using the TRFR. This shows that removing the
TRFR has merely no impact on the average SCR ratio for the whole market, except for
Greece.
Figure 3.47
The following graph shows the overall impact of the use of the TRFR on the SCR ratio
for the whole EEA market during the last four years. The impact was always closed to
zero due to the small market share at EEA level of those undertakings using the TRFR.
Figure 3.48

105/146
The following graphs display the overall impact of the use of the TRFR on the SCR ratio
for undertakings that apply this measure. The impact is shown at EEA and at country
level. The first graphs shows the SCR ratio with (dark blue) and without (light blue) the
TRFR. The red bars are for the EEA level. The second graph shows the impact in
percentage points.
The impact of the TRFR on the SCR ratio for undertakings applying the measure is 48
percentage points. The average SCR ratio with the TRFR is 2129% and 181% without
the measure.

106/146
Figure 3.49
Figure 3.50
The following graph shows the overall impact of the use of the TRFR on the SCR ratio
for undertakings using the measure during the last four years.

107/146
Figure 3.51
The following graph shows the impact of removing the TRFR on the SCR (light blue) and
on the eligible own funds to cover the SCR (dark blue). The red bars are for the EEA
level. On average, eligible own funds to cover the SCR would decrease by 11%, while
the SCR would increase by 12.7% if the TRFR were removed.
Figure 3.52
186%
206%
188%
229%
123%
156%
149%
181%
2016
2017
2018
2019
Impact of removing TRFR on SCR ratio of
undertakings using the measure
SCR ratio w/o TRFR
SCR ratio with TRFR

108/146
The following graph displays the impact of removing the TRFR on the value of technical
provisions (TPs) at EEA and national level. The average impact of the TRFR on the
technical provisions for undertakings applying the measure is an increase of 3.2% when
the measure is removed.
Figure 3.53
The impact of removing the TRFR on the MCR ratio for undertakings applying the
measure is 131 percentage points. The average MCR ratio with the TRFR is 660% and
529% without the measure.
Figure 3.54

109/146
Figure 3.55
Information on the phasing-in plans for the TRFR and the prospects for a reduced
dependency on the measures can be found in Section III.5.
Additional information on the TRFR based on the QRT information

110/146
Based on the quantitative information that undertaking regularly provide to supervisory
authorities further analysis could be performed for this year’s report.
The following graph outlines the average adjustment to the risk free rate for year-end
for year end 2016 to 2019:
Figure 3.56
The information provided in the regular quantitative reporting also allows NSAs to
assess the share of best estimate in bands of guarantee level. The following graph
provides an overview based on all undertakings applying the TRFR:25
Figure 3.57
Figure 3.58
25
Note that changes between 2016 and 2017 are mainly due to changes in the set of undertakings using the TRFR,
which can have a material effect on the average since the overall number of undertakings using the TRFR is small.
- 1 2 3 4 5 6 7
Up to0.5 per
cent
Above0.5%
and upto 1.0%
Above1.0%
and upto 1.5%
Above1.5%
and upto 2.0%
Above2.0%
and upto 2.5%
Above2.5%
and upto 3.0%
Above3.0%
and upto 4.0%
Above4.0%
and upto 5.0%
Above5.0%
and upto 6.0%
Above6.0%
and upto 7.0%
Above7.0%
and upto 8.0%
Above8.0%
TRFR: Distribution of Best Estimate in bands of guarantee level (in bn. Euro)
2016 2017 2018 2019

111/146
Impact on investments of undertakings, consumers and products
As only 6 insurers are applying the TRFR, it is not possible to disclose more detailed
data on the impact of this measure on investments of undertakings, consumers and
products per country. This data has been combined with the data for the TTPs and is
presented in subsection III.5.
The following table sets out the share of gross written premiums for undertakings using
the TRFR compared to the total gross premiums written by all undertakings. It also
shows each line of business (columns 1 to 6), the total life insurance and life reinsurance
business (column 7) and the total for non-life insurance and reinsurance business
(column 8). The table is based on data reported by undertakings in the annual QRTs for
2019. Please note that due to the small number of undertakings in individual markets
using this transitional measure, results have been presented at EEA level, and not been
split by individual country.
Table 3.16
Countr
y
1. Health
insuranc
e
2.
Insurance
with profit
participatio
n
3. Index-
linked
and unit-
linked
insuranc
e
4. Other
life
insuranc
e
5. Health
reinsuranc
e
6. Life
reinsuranc
e
7. Total life
insurance
and
reinsuranc
e
8. Total
non-life
insurance
and
reinsuranc
e
EEA 0.5% 0.2% 0.4% 0.2% 0.0% 0.5% 0.3% 0.1%
III.4 Transitional measure on technical provisions
For a period of 16 years after the start of Solvency II, insurance and reinsurance
undertakings may apply the transitional measure on technical provisions (TTP). Under
the transitional measure, undertakings apply a transitional deduction to the technical
provisions for their insurance and reinsurance obligations.
-
5
10
15
20
25
Up to0.5 per
cent
Above0.5%
and upto 1.0%
Above1.0%
and upto 1.5%
Above1.5%
and upto 2.0%
Above2.0%
and upto 2.5%
Above2.5%
and upto 3.0%
Above3.0%
and upto 4.0%
Above4.0%
and upto 5.0%
Above5.0%
and upto 6.0%
Above6.0%
and upto 7.0%
Above7.0%
and upto 8.0%
Above8.0%
TFRF: Distribution of duration in bands of guarantee level
2016 2017 2018 2019

112/146
The transitional deduction is based on the difference between the technical provisions
under Solvency I and the technical provisions under Solvency II. At the beginning of
Solvency II the transitional adjustment is 100% of that difference, i.e. the technical
provisions are equal to the technical provisions under Solvency I. Over the transitional
period of 16 years the transitional deduction is reduced to zero. The transitional
measure applies only to insurance and reinsurance obligations from contracts concluded
before the start of Solvency II.
The use of the transitional measure is subject to supervisory approval.
Use of the transitional measure on technical provisions
The TTP is applied by 159 undertakings from 11 countries.
The technical provisions of undertakings applying the TTP represent 25% of the total
amount of technical provisions in the EEA.
Figure 3.59
Table 3.17
Number of undertakings using TTP
Country Life Non-
Life
Both Life
and non-
life
Reinsurance Total Last
year
Variation
from
last year
AT 1 0 4 0 5 5 0
BE 0 0 1 0 1 1 0
DE 57 2 0 0 59 58 1
ES 3 1 15 0 19 20 -1
FI 3 2 2 0 7 6 1
0
10
20
30
40
50
60
AT BE DE ES FI FR GR IT LI NO PT
Number of undertakings using TTP
Life Non-Life Both Life and non-life Total Geral

113/146
FR 9 0 12 0 21 20 1
GR 0 0 1 0 1 1 0
IT 1 0 1 0 2 1 1
LI 1 0 0 0 1 0 1
NO 2 0 3 0 5 6 -1
PT 7 5 3 0 15 15 0
EEA 84 10 42 0 136 133 3
The total number of undertakings using the TTP in the EEA increased by 3 since last
year’s report.
The market share in technical provisions of undertakings using the TTP is shown in the
graph below. This illustrates that among undertakings using the TTP, undertakings in
the DE have the highest EEA market share, followed by undertakings in FR.
Figure 3.60
The following graph displays the market share in terms of technical provisions at
national level for undertakings using the TTP. In Norway, undertakings representing
79% of the national market share use the TTP. In Portugal and Finland, undertakings
representing more than 50% of the national market are using TTP.
Figure 3.61
0,0%
1,0%
2,0%
3,0%
4,0%
5,0%
6,0%
7,0%
8,0%
9,0%
10,0%
AT BE DE ES FI FR GR IT NO PT
EEA market share in technical provisions of undertakings using the TTP
Life Non-life

114/146
According to the Solvency II Directive it is possible to apply simultaneously the TTP
and the MA or the VA to the same liabilities.
Table 3.18
Undertakings applying simultaneously TTP and VA to the same
liabilities
Country Number of
undertakings
% EEA market
share in TP
% National market
share in TP
AT 2 (*) (*)
BE 1 (*) (*)
DE 51 4% 21%
ES 19 1% 32%
FI 7 0% 54%
FR 20 3% 11%
GR 1 (*) (*)
IT 2 (*) (*)
LI 1 (*) (*)
NO 4 0% 74%
PT 10 7% 41%
EEA 118 21% -
(*)Data from these countries are not disclosed for confidentiality reasons because the number
of undertakings concerned is lower than 3.
0% 10% 20% 30% 40% 50% 60% 70% 80%
AT
BE
DE
ES
FI
FR
GR
IT
NO
PT
National market share in technical provisions of undertakings using the TTP
Life Non-life

115/146
It may be insightful to compare the table above with the table on undertakings and the
market share of their technical provisions and the tables on the use of only the VA or
only the TTP. A comparison shows that for some jurisdictions, e.g. NO and FI, there is
a large overlap between the use of the TTP and the use of the VA.
Table 3.19
Undertakings applying the TTP and MA to the same liabilities simultaneously
Number of
undertakings
% EEA market
share in TP
% National market
share in TP
ES/EEA 8 0% 10%
Similarly, it may be insightful to compare the table above with the table on undertakings
and the market share of their technical provisions and the tables on the use of only the
MA or only the TTP.
The following diagram shows the number of EEA groups using the TTP.
Figure 3.62
Impact on the financial position of undertakings
The impact results presented in this section are based on data from 2019 Quantitative
Reporting Templates.
The following graph displays the overall impact of the TTP on the SCR ratio for the whole
EEA sample (including both undertakings using or not using the measure). At the EEA
level, removing the TTP would result, on average, in a decrease of the SCR ratio by 12
percentage points.
1 1
38
3 46
1 1 2 3
6
1
0
5
10
15
20
25
30
35
40
AT BE DE ES FI FR GR IT NL NO PT SE
Number of EEA groups using TTP

116/146
Figure 3.63
The following graph shows the overall impact of the use of the TTP on the SCR ratio for
the whole EEA market during the last four years. The highest impact was observed in
2016, where removing the TTP would result on average in a decrease of the SCR ratio
by 17 percentage points; since then, the impact has decreased until 12 percentage
points at the end of 2019.
Figure 3.64

117/146
The following graphs show the overall impact of TTP on the SCR ratio for undertakings
that apply the measure. At EEA level, by removing the TTP the financial position of the
insurance and reinsurance undertakings using that measure would decrease the SCR
ratio from 318% to 196%.
The average change in SCR ratios is the highest for undertakings in Germany, Austria,
and France. Usually both components of the SCR ratio (SCR and eligible own funds) are
affected by the use of the TTP, but in opposite direction. Typically eligible own funds
decrease when the TTP is removed whereas the SCR increases. Germany has the largest
decrease of eligible own funds and the largest increase in the SCR.
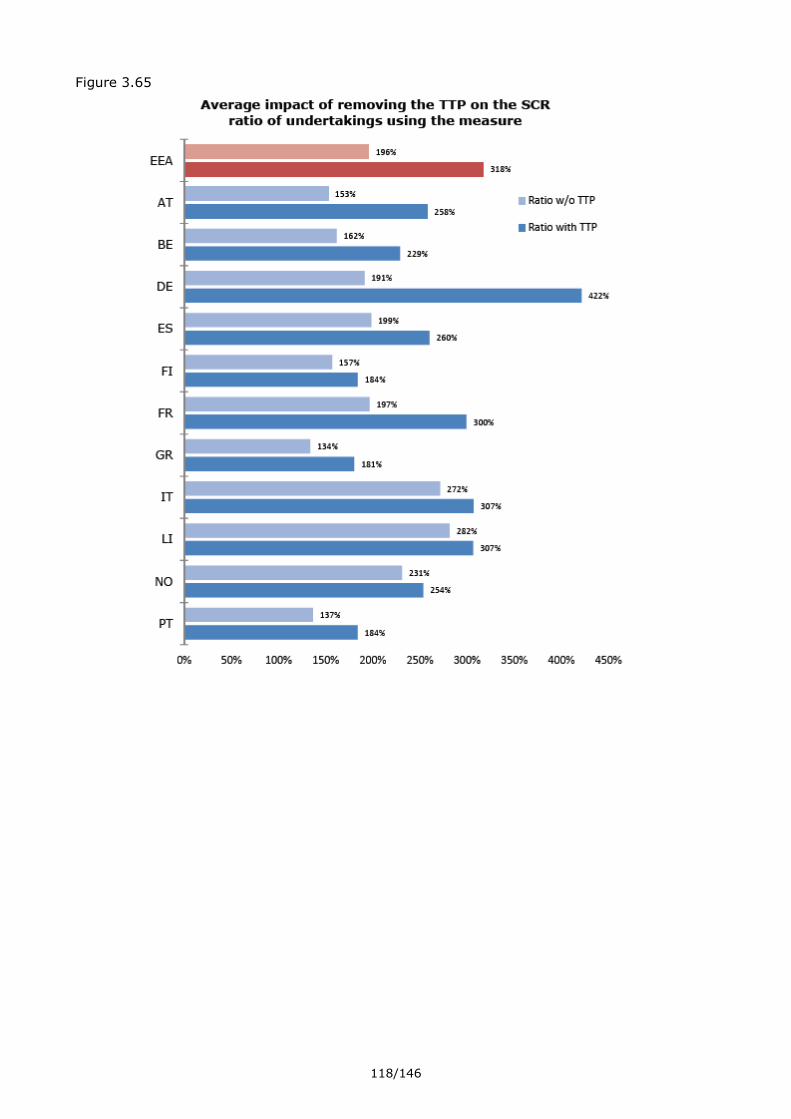
118/146
Figure 3.65

119/146
Figure 3.66
The following graph shows the overall impact of the use of the TTP on the SCR ratio for
undertakings using the measure during the last four years.
Figure 3.67
The following graph displays the impact of removing the TTP on the SCR ratio of every
undertaking using the measure. Each dot in the diagram represents one undertaking,
comparing the individual SCR ratio against the estimated SCR ratio without the TTP.
The type of each undertaking is indicated by the colour of the dot. In terms of SCR ratio,
51% reported an absolute impact of less than 100 percentage points.

120/146
11% of undertakings using the TTP reported an SCR ratio without the measure below
100%. 0,75% of the undertakings using the measure reported negative eligible own
funds to cover the SCR without TTP.
Figure 3.68
The following graph displays the impact of removing the TTP on the MCR ratio of every
undertaking using TTP, comparing the individual MCR ratio against the estimated MCR
ratio without TTP.
Figure 3.69
In terms of the MCR ratio, 21% reported an absolute impact of less than 100 percentage
points.
6% of undertakings using the TTP reported an MCR ratio without the measure below
100%. 0,75% of the undertakings using the measure reported negative eligible own
funds to cover the MCR without TTP.

121/146
The following graph shows the impact of removing the TTP on the SCR (light blue) and
on the eligible own funds to cover the SCR (dark blue). The red bars are for the EEA
level. On average, eligible own funds to cover the SCR would decrease by 32.5%, while
the SCR would increase by 9.2% if the TTP were removed.
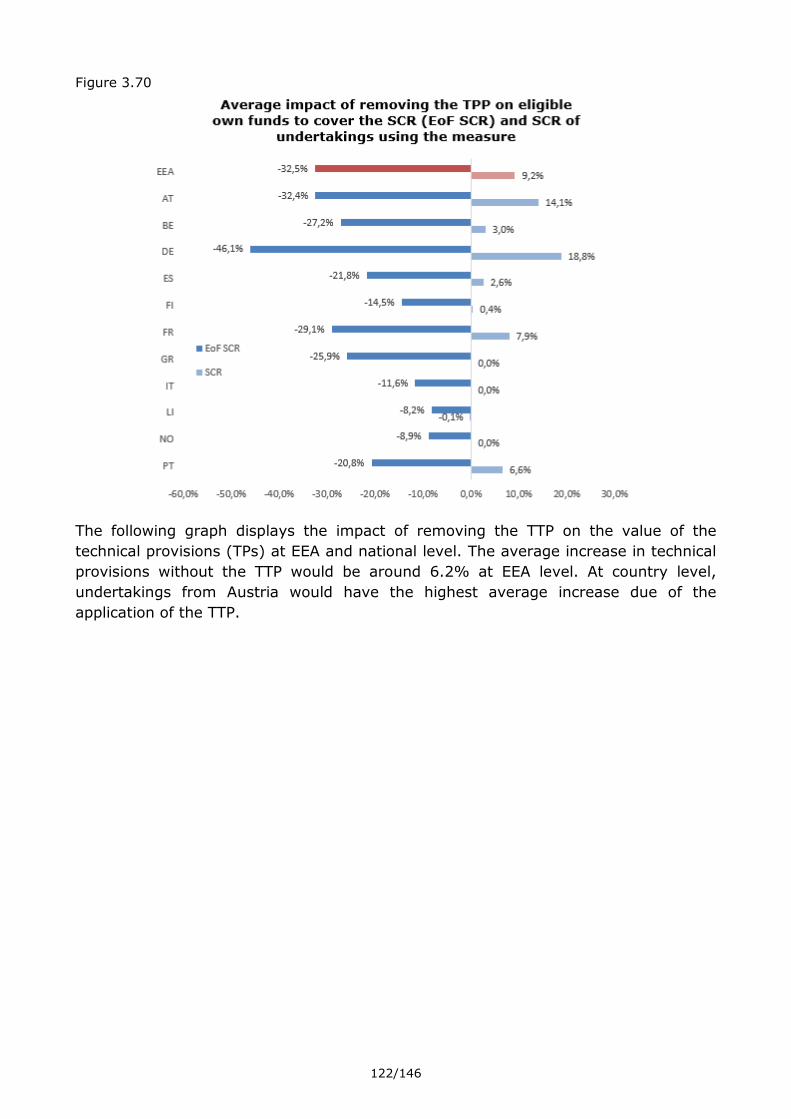
122/146
Figure 3.70
The following graph displays the impact of removing the TTP on the value of the
technical provisions (TPs) at EEA and national level. The average increase in technical
provisions without the TTP would be around 6.2% at EEA level. At country level,
undertakings from Austria would have the highest average increase due of the
application of the TTP.

123/146
Figure 3.71
The following graph shows the impact of the TTP on the MCR ratio at country and EEA
level for undertakings using that measure. Without TTP, the MCR ratio decreases on
average by 299 percentage points.
At country level, average MCR solvency ratios are not below 100% without applying the
TTP. The effects noted on the SCR are similar to the MCR and the analysis shows that
undertakings from Germany, Austria and France have the highest average impact.

124/146
Figure 3.72

125/146
Figure 3.73

126/146
The box-plots below illustrate how the impact of removing the TTP is distributed across
undertakings.26
Figure 3.74
Additional information on the TTP based on the QRT information
Based on the quantitative information that undertakings regularly provide to
supervisory authorities, further analysis could be performed for this year’s report.The
quantitative information identifies the number of limitations applied by NSAs. The
following table outlines the number of limitations applied:
Table 3.20
Country 2019
AT 5
DE 55
ES 10
FI 5
FR 18
NO 4
PT 15
Others 5
Total EEA 117
26
The bottom (respectively, top) of the blue box represents the lower quartile (respectively, higher quartile) of the data
set. The black band inside the box is always the middle quartile (50th percentile or median). The end of the lines extending from the boxes (called whiskers) represent the upper and lower boundaries of 1,5 interquartile-ranges. Outliers are plotted as individual points.

127/146
The maximum portion of the adjustment that can be applied is decreasing linearly
during the 16 years of the transitional period. At year end 2017 the maximum portion
that could be applied was 93.75% whereas at year end 2018 the maximum portion
amounts to 87.50% and for year end 2019 to 81,25%. At year end 2019, the average
portion applied (across all undertakings appliying the TTP) amounted to 77%.
The following graph outlines the differences across countries in the portion of the
adjustment that is applied to SII technical provisions:27
Figure 3.75
The figures provided by undertakings also allow assessment of the portion of SII
technical provisions that is in the scope of the TTP. For that purpose, the SII technical
provisions to which the adjustment is applied to can be compared to the total technical
provisions for each undertaking. For 2019 in the EU, 78% of the technical provisions of
undertakings applying the TTP are in scope for application of the transitional. However,
the results vary by country:
27
Data for 2016 and 2017 has been updated since data quality has improved. Therefore figures are not identical to
those presented in last year’s report.
0%
10%
20%
30%
40%
50%
60%
70%
80%
90%
100%
AT DE ES FI FR NO PT UK EU
Average portion of the difference adjusted
2016 2017 2018 2019

128/146
Figure 3.76
Reliance on transitional measures (TTP and TRFR)
The table below shows the overall number of undertakings using either the TTP or TRFR
and for these undertakings the table also show the number required to submit a
phasing-in plan (“PIP”) in 2018 and 2019.
Table 3.21
Country Number of undertakings using TTP/TRFR
Number of undertakings
for which a PIP was requested (2019)
Number of undertakings for which a PIP
was requested
(2018)
AT 5 1 0
BE 1 0 0
DE 61 27 26
ES 19 6 7
FI 7 1 0
FR 21 2 1
GR 4 1 1
IT 2 2 0
LI 1 0 /
NO 5 0 0
PT 15 5 5
IE 1 0 0
EEA 142 45 39
0%
10%
20%
30%
40%
50%
60%
70%
80%
90%
100%
AT DE ES FI FR NO PT UK EU
Share of SII technical provisions in the scope of application of the TTP for undertakings applying the TTP

129/146
There are 142 undertakings that use the TTP or TRFR and of these, 45 were required to
submit a phasing-in plan in 2019. This is because they were reliant on the TTP or the
TRFR to have full SCR coverage at some point. In 2018, 39 undertakings were required
to submit a phasing-in plan.
Review of phasing-in plans
In comparison with 2018 where no undertaking was required to submit a phasing-in
plan for the first time, in 2019, 6 undertakings where required to submit one.
6 undertakings in 5 juridictions, that met 100% SCR coverage in 2018 were required to
submit a phasing-in plan in 2019. Among these 6 undertakings, 1 failed to submit the
phasing-in plan.
Update of phasing-in plans
Firms have revised existing plans in 2 jurisdictions, either upon supervisor’s request or
at the undertaking’s own initiative. Amendments are mostly the result of updates in
phasing-in or business projections.
One undertaking introduced future cash flows arising from liabilities and backing assets
in its phasing-in plan at the supervisory request, in order to better monitor the
estimated runoff of the portfolio under the transitional measure.
Review of progress reports
Undertakings that are reliant on transitional measures to fully cover the SCR are
expected to submit progress reports on an annual basis. NSAs generally reported that
the progress reports are considered sufficient and illustrate the progress of undertakings
in complying with the SCR without the transitional measures.
It was noted in most cases that undertakings showed continuous progress in complying
with the solvency capital requirement without transitional measures. However, there is
still a high dependency on the interest rate environment.
Views of NSAs
As in 2018, NSAs are generally confident that undertakings will be able to reduce the
dependency on transitional measures, to the point of no dependency by 1 January 2032.
This is confidence has been strengthened this year with progress made. It was reported
that the measures planned by undertakings in their PIP have already provided an
effective contribution to strengthening undertaking’s solvency position under the low-
rate environment. However, two NSAs has noticed that dependency of undertakings to
the transitional measures has been increased due to low interest rate environment.
The following table provides an overview of the number of undertakings who do not
comply with the SCR without the transitional measures at the entry into force of
Solvency II and at year end until 31 December 201928. It also shows the missing
amount of eligible own funds to comply with the SCR without the transitional measures
28
The table does note include UK data at 1 january 2016 since this were not available at the time of the LTG report
2016; UK data are also not considered for year end 2019 due to the Brexit.

130/146
on 1st January 2016, 31 December 2016, 31st December 2017, on 31st December 2018
and on 31st December 2019.
Table 3.22
Undertakings not complying with the SCR without the transitional measures
Country 1 January
2016
Year end 2016 Year end 2017 Year end 2018 Year end 2019
FR 0 1 1 0 0
DE 16 13 8 6 10
ES 4 3 2 2 1
GR 3 2 1 1 2
NO 0 1 0 0 0
PT 12 10 6 4 3
UK - 13 9 8 -
Total 32 43 27 21 16
Missing amount of eligible own funds to comply with the SCR without the
transitional measures (billion euro)
Country 1 January
2016
Year end 2016 Year end 2017 Year end 2018 Year end 2019
FR 0 0.13 0.06 0 0
DE 3.46 1.59 0.53 0.39 1.74
ES 0.14 0.23 0.14 0.13 0.01
GR 0.27 0.06 0.04 0.06 0.10
NO 0 0.01 0 0 0
PT 1.39 0.76 0.25 0.03 0.10
UK - 6.12 5.71 3.71 -
Total 5.26 8.9 6.82 4.32 1.95
In comparison with last year (without considering UK), the total number of undertakings
who do not comply with the SCR without the transitional measures at EEA level
increased by 3.This went from 13 undertakings at year end 2018, to 16 undertakings
at the end of 2019. The missing amount of eligible own funds to comply with the SCR
without the transitional measures increased by 1.34 billion euro, from 0.61 billion euro
at year end 2018 to 1.95 billion euro at the end of year29.
Supervisory measures taken or expected to be taken by NSAs
29
It should be noted that during the observed time period (i.e. between 1st January 2017 and year end 2019), the set
of undertakings not complying with the SCR without the transitionals might have changed

131/146
NSAs were asked to report about the measures that they have taken or that they expect
to take with respect to undertakings depending on these transitional measures to
comply with the SCR. NSAs reported a variety of approaches.
One NSA noted that they consider the solvency position of undertakings both with TTP
and without TTP when assessing the riskiness of undertakings.
Two NSAs measure the riskiness of undertakings without the effect of transitional
measures when constructing a work plan, and will prioritise reviews of undertakings
using TTP or TRFR – particularly if they are reliant on transitional measures to fully
cover the SCR. The NSAs expect companies to use appropriate metrics to measure their
risks, define their risk appetite (i.e. without transitional measures), take into account
in their strategies the fact that they comply with their SCR only through the use of
transitional measures, present clear and relevant information to their AMSB regarding
solvency issues and provide the relevant information in their SFCR.
One NSA explicitly informs the market on a regular basis about the number of
undertakings depending on transitional measures and the extent to which transitional
measures are necessary to comply with the SCR.
One NSA noted that through an "early warning" with an additional quaterly reporting,
they identify the undertakings that they deem risky and would disagree to dividend
payments if those payments were considered likely to endanger the future solvency
situation.
One NSA reported that on-site inspections have been made with respect to undertakings
depending on transitional measures on technical provisions to comply with their SCR.
As a result of these on-site inspection, the supervisory measures taken have been to
modify PIPs if the measures adopted have not been effective and require recalculation
NSAs generally reported that they expect companies to implement the measures they
have committed to in phasing-in plans, and intend to monitor the progress made during
the transitional period by reviewing the progress reports. Where necessary, a regulatory
meeting for an in-depth discussion with the undertaking's representatives is arranged.
NSAs reported that in the event that the phasing-in plans or progress reports are
inadequate and this inadequacy is not remediated by an amended plan, revocation of
the transitional measure will be considered.
Impact on the investments of undertakings
The following tables and graphs illustrate some characteristics of the investments held
by undertakings using the TTP or the TRFR. In total this relates to 11 countries30.
Similar to the tables and graphs in the general section II.4 of the report, the tables and
graphs below consider the investments of undertakings from three perspectives:
- The investment allocation
30
The TTP is used by undertakings in 11 countries; the TRFR is used in 4 countries. In IE the TRFR is used, but not TTP.
In the other 3 countries where TRFR is used, the TTP is also used. Due to lack of data, LI is not included in the tables on investments in this section, the UK is excluded and separately

132/146
- The credit quality of the bond portfolio, separately for government bonds and
corporate bonds
- The duration of the bond portfolio, separately for government bonds and
corporate bonds
The following tables show the investment allocation of undertakings applying the TTP
or the TRFR. Please note that, due to confidentiality reasons, any cells that relate to
less than three undertakings are denoted by (*).
Table 3.23
Table 3.24
The following table shows the credit quality of government bonds. Please note that the
data at EEA level for undertakings not using the TTP or TRFR includes data from
countries where the TTP or TRFR is not used at all.
Table 3.25
Country Government bonds Corporate bondsUnit linked/index
linkedEquity
Collective
Investment
Undertakings
Mortgages and
loans
Cash and
depositsOther
EEA 30% 29% 13% 7% 8% 4% 3% 5%
AT 30% 29% 15% 6% 1% 5% 3% 11%
BE (*) (*) (*) (*) (*) (*) (*) (*)
DE 26% 33% 10% 5% 13% 5% 1% 6%
ES 53% 19% 9% 6% 0% 0% 9% 3%
FI 6% 21% 52% 5% 5% 2% 6% 3%
FR 27% 32% 17% 8% 5% 1% 5% 6%
GR 49% 18% 27% 2% 0% 1% 2% 1%
IE (*) (*) (*) (*) (*) (*) (*) (*)
NO 8% 33% 15% 21% 10% 10% 2% 0%
PT 36% 26% 17% 9% 6% 0% 5% 1%
Investment allocation at EEA and country Level of undertakings applying the TTP or the TRFR
Country Government bonds Corporate bonds EquityCollective Investment
UndertakingsMortgages and loans Cash and deposits Other
EEA 34% 34% 8% 9% 4% 4% 6%
AT 35% 35% 7% 2% 5% 3% 13%
BE (*) (*) (*) (*) (*) (*) (*)
DE 29% 37% 6% 14% 6% 2% 6%
ES 58% 21% 7% 0% 0% 10% 3%
FI 12% 44% 10% 11% 4% 13% 7%
FR 32% 38% 10% 6% 1% 7% 7%
GR 67% 24% 3% 0% 1% 3% 2%
IE (*) (*) (*) (*) (*) (*) (*)
NO 10% 39% 25% 12% 12% 2% 0%
PT 43% 31% 10% 7% 0% 6% 1%
Investment allocation at EEA and country Level (without assets held for IL & UL contracts) of undertakings applying the TTP or the TRFR

133/146
The following table shows the credit quality of corporate bonds. Please note that the
data at EEA level for undertakings not using the TTP or TRFR includes data from
countries where the TTP or TRFR is not used at all.
Table 3.26
Country Use of the measures CQS0 CQS1 CQS2 CQS3 CQS>3
No use of TTP and TRFR 17% 45% 14% 23% 1%
Use of the TTP or TRFR 16% 35% 18% 30% 1%
No use of TTP and TRFR 16% 50% 25% 9% 0%
Use of the TTP or TRFR 0% 64% 30% 6% 0%
No use of TTP and TRFR 9% 73% 11% 8% 0%
Use of the TTP or TRFR (*) (*) (*) (*) (*)
No use of TTP and TRFR 39% 40% 15% 5% 0%
Use of the TTP or TRFR 34% 49% 12% 5% 0%
No use of TTP and TRFR 2% 3% 69% 26% 0%
Use of the TTP or TRFR 1% 2% 81% 15% 0%
No use of TTP and TRFR 37% 60% 1% 2% 0%
Use of the TTP or TRFR 46% 46% 3% 4% 2%
No use of TTP and TRFR 8% 77% 7% 8% 0%
Use of the TTP or TRFR 5% 71% 8% 16% 0%
No use of TTP and TRFR 15% 15% 6% 8% 56%
Use of the TTP or TRFR 6% 16% 11% 22% 45%
No use of TTP and TRFR 63% 35% 2% 0% 0%
Use of the TTP or TRFR 49% 37% 14% 0% 0%
No use of TTP and TRFR 4% 9% 28% 59% 0%
Use of the TTP or TRFR 4% 10% 5% 80% 1%
Credit quality of government bonds for undertakings not using the TTP or TRFR or using the TTP or
TRFR, per country (without assets held for IL & UL contracts)
EEA
AT
BE
DE
GR
ES
FI
FR
NO
PT

134/146
The following graph shows the average duration of investments in government bonds
and corporate bonds of undertakings using the TTP or TRFR and of undertakings not
using the TTP and TRFR.
Figure 3.77
Country Use of the measures CQS0 CQS1 CQS2 CQS3 CQS>3
No use of TTP and TRFR 19% 17% 33% 29% 2%
Use of the TTP or TRFR 30% 19% 26% 22% 3%
No use of TTP and TRFR 20% 20% 35% 23% 1%
Use of the TTP or TRFR 29% 18% 28% 23% 1%
No use of TTP and TRFR 10% 18% 34% 36% 2%
Use of the TTP or TRFR (*) (*) (*) (*) (*)
No use of TTP and TRFR 34% 20% 27% 18% 1%
Use of the TTP or TRFR 45% 24% 19% 12% 1%
No use of TTP and TRFR 3% 13% 29% 51% 4%
Use of the TTP or TRFR 2% 14% 39% 43% 2%
No use of TTP and TRFR 11% 7% 32% 41% 9%
Use of the TTP or TRFR 9% 10% 27% 41% 13%
No use of TTP and TRFR 8% 19% 41% 30% 1%
Use of the TTP or TRFR 6% 13% 39% 38% 4%
No use of TTP and TRFR 15% 13% 37% 29% 6%
Use of the TTP or TRFR 1% 12% 31% 46% 10%
No use of TTP and TRFR 53% 12% 23% 11% 0%
Use of the TTP or TRFR 30% 14% 38% 18% 0%
No use of TTP and TRFR 3% 13% 26% 57% 1%
Use of the TTP or TRFR 2% 7% 40% 43% 7%
Credit quality of corporate bonds for undertakings not using the TTP or TRFR or using the TTP or TRFR,
per country (without assets held for IL & UL contracts)
FI
EEA
AT
BE
DE
ES
FR
GR
NO
PT

135/146
Figure 3.78

136/146
Impact on consumers and products
The following table sets out the share of gross written premiums of undertakings using
the TTP compared to the total gross premiums written by all undertakings in that
country. It also shows each line of business (columns 1 to 6), the total life insurance
and life reinsurance business (column 7) and the total for non-life insurance and
reinsurance business (column 8). The table is based on data reported by undertakings
in the annual QRTs for 2019.
For instance in Austria, 12.4% of the total life insurance and life reinsurance premiums
and 12.6% of premiums for index-linked and unit-linked business are written by
undertakings applying the TTP.
Table 3.27
Country 1. Health
insurance
2. Insurance
with profit
participation
3. Index-
linked and
unit-linked
insurance
4. Other life
insurance
5. Health
reinsuranc
e
6. Life
reinsuranc
e
7. Total life
insurance
and
reinsuranc
e
8. Total non-
life insurance
and
reinsurance
AT 0.2% 19.4% 12.6% 19.1% 0.0% 3.4% 12.4% 4.5%
BE (*) (*) (*) (*) (*) (*) (*) (*)
DE 13.0% 42.6% 50.9% 16.0% 0.2% 0.9% 28.9% 0.0%
ES 8.2% 42.1% 38.0% 24.2% 0.0% 1.5% 30.6% 12.8%
FI 100.0% 82.9% 53.3% 37.5% 0.0% 100.0% 56.3% 41.2%
FR 5.0% 15.6% 16.7% 15.1% 1.9% 22.0% 15.6% 5.8%
GR (*) (*) (*) (*) (*) (*) (*) (*)
IT 12.7% 22.5% 6.7% 4.4% 0.0% 0.0% 17.3% 0.0%
NO 24.6% 96.2% 49.0% 44.6% 0.0% 0.0% 69.6% 2.9%
PT 100.0% 72.3% 34.1% 74.9% 0.0% 100.0% 64.0% 67.0%
EEA 10.6% 24.5% 13.2% 16.6% 0.6% 9.7% 17.7% 3.5%
(*) Data from this country is not disclosed for confidentiality reasons because the number of
undertakings applying the measure is lower than 3.
III.5 Duration-based equity risk sub-module
The standard formula for the SCR includes an equity risk sub-module that captures the
risk stemming from changes in the level of equity market prices. The equity risk sub-
module is based on risk scenarios that envisage a fall in equity market prices of 39%
or 49%, depending on the type of equity.
Instead of that equity risk sub-module, undertakings can use a duration-based equity
risk sub-module that is, with regard to certain equity investments, based on a risk
scenario that envisages a fall in equity market prices of 22%. The duration-based equity
risk sub-module can only be applied by life insurance undertakings that provide certain
occupational retirement provisions, or retirement benefits, and meet further
requirements – in particular that the average duration of the undertaking’s liabilities
exceeds an average of 12 years and that the undertaking is able to hold equity
investments at least for 12 years.

137/146
The possibility to apply the DBER is a Member State option of the Solvency II Directive
(Article 304(1)). The application of the DBER by an insurance undertaking is subject to
supervisory approval.
Similarly to the scenario in the end of 2018, only one undertaking in France was using
the DBER as at 31 December 2019.
According to the information disclosed by the undertaking in its Solvency and Financial
Condition Report, removing the DBER would reduce the SCR ratio by 24 points from a
ratio of 156% with the DBER (but without TTP and VA) to a ratio of 132% without the
DBER. Removing the measure would reduce the MCR ratio by 46 points from a ratio of
323% with the DBER (but without TTP and VA) to a ratio of 277% without the measure.
As only one undertaking in France was using the DBER as at 31 December 2019, no
impact on investments and consumers and products is shown for the DBER due to
confidentiality reasons.
III.6 Symmetric adjustment to the equity risk charge
Recital 61 of the Solvency II Directive states that in order to mitigate undue potential
pro-cyclical effects of the financial system and to avoid a situation in which insurance
and reinsurance undertakings are unduly forced to raise additional capital or sell their
investments as a result of unsustained adverse movements in financial markets, the
market risk module of the standard formula for the SCR should include a symmetric
adjustment mechanism with respect to changes in the level of equity prices.
The symmetric adjustment is expected to be positive (i.e. the capital requirement is
higher) when markets have risen recently, and negative (i.e. the capital requirement is
lower) when equity markets have dropped in the previous months.
Impact on the financial position of undertaking
For the 2019 report, there were no information requests to undertakings concerning the
impact of the symmetric adjustment on their financial position.
Instead, the financial impact of the symmetric adjustment on the SCR was determined
using QRT data31. Specifically, the impact on the equity risk charge has been produced
using the exposures per equity class (type 1 equity, type 2 equity…) and the overall
SCR has then been aggregated based on underlying assumptions32. For instance, the
impact of risk mitigation techniques has not been considered when removing the
symmetric adjustment.
Since the SA at 31 Dec 2019 was -0.08%, setting the SA to zero would have a negligible
impact on equity exposures applied to calculate the SCR. Removing the measure at EEA
and national level has practically no effect on the SCR.
31
Note that the QRT data does not allow for a distinction between undertakings which apply the transitional measure
on equity risk according to Article 308b (13) of the Solvency II Directive and undertakings which do not apply that measure. 32
In particular, the operational risk charge has been kept constant. Similarly, the LAC DT has been kept as a percentage
of the BSCR, and the LAC TP as a percentage of the sum of BSCR, operational risk and LAC DT.

138/146
III.7 Extension of the recovery period
Under Solvency II, insurance and reinsurance undertakings are required to hold eligible
own funds that cover their SCR. When an undertaking is not covering its SCR, the
national supervisory authority shall require it to take the necessary measures to
achieve, within six months from the observation of non-compliance with the SCR, the
re-establishment of the level of eligible own funds covering the SCR or the reduction of
its risk profile to ensure compliance with the SCR. The supervisor may, if appropriate,
extend that period by three months.
Article 138(4) of the Solvency II Directive states that supervisory authorities may, under
certain circumstances, further extend the recovery period for the re-establishment of
compliance with the SCR as set out in Article 138(2) of that Directive by a maximum
period of 7 years.
This power applies in the event of exceptional adverse situations affecting insurance
and reinsurance undertakings that represent a significant share of the market or of the
affected lines of business. The condition for an exceptional adverse situation are one or
more of the following:
• A sharp, steep and unforeseen fall in financial markets;
• A persistent low interest rate environment;
• A high-impact catastrophic event.
This extension of the recovery period can only be granted after EIOPA has declared the
existence of an exceptional adverse situation. A necessary condition for the declaration
is a request by a national supervisory authority. Article 288 of the Solvency II Delegated
Regulation further states several factors and criteria that EIOPA shall take into account
when assessing the existence of an exceptional adverse situation. Where appropriate,
EIOPA could consult the European Systemic Risk Board (ESRB) before deciding on the
existence of an exceptional adverse situation.
Once EIOPA has declared the existence of an exceptional adverse situation, the national
supervisory authorities can decide on an extension of the period and determine its
length for individual insurance and reinsurance undertakings. For that purpose, the
supervisors shall take into account the factors and criteria set out in Article 289 of the
Solvency II Delegated Regulation. To ensure a consistent approach in the extension of
the recovery period, on 14 September 2015 EIOPA issued Guidelines on the extension
of the recovery period in exceptional adverse situations. In particular the guidelines
relate to the decision to grant an extension, the duration of the extension and the
withdrawal and revocation of the extension.
During the extended recovery period, the undertakings affected are required to submit
a progress report every three months to their NSA setting out the measures taken and
the progress made to meet the SCR. In case of no significant progress, the extension
of the recovery period will be withdrawn.
To date EIOPA has not received a request to declare an exceptional adverse situation.

139/146
The following table shows the number of undertakings breaching the SCR (taking into
account all LTG measures and equity measures applied) on 31 December 2019 and their
market share (national market share for undertakings in each country and EEA market
share for all undertakings). For countries not listed in the table all undertakings meet
the SCR.
Table 3.28
Country Undertakings breaching the SCR
Market share in non-life gross
written premiums
Market share in life technical provisions
CY 1 7.91% 2.24%
DE 1 0.00% 0.00%
DK 1 0.00% 0.00%
FR 1 0.02% 0.00%
HR 1 0.00% 0.00%
HU 1 1.49% 0.00%
LU 4 0.00% 0.00%
NL 1 0.00% 0.20%
SE 1 0.00% 0.00%
Total EEA 12 0.01% 0.01%
Without consideration of UK, the total number of undertakings breaching the SCR has
increased by 3 during the last year – from 9 on 31 December 2018 to 12 on 31
December 2019. The total number of undertakings breaching the SCR can be split
according to their type as follows: 5 non-life insurance undertakings, 1 life insurance
undertakings, 2 undertaking pursuing both life and non-life insurance activity and 4
reinsurance undertakings.

140/146
Annexes
Annex 1: Overview of the European insurance market
The following charts show for each EEA country the number of insurance and
reinsurance undertakings and their share of the EEA insurance market expressed as
percentage of technical provisions and of gross written premiums.
Figure 4.1
Figure 4.2

141/146
Annex 2: Impact of the measures on the financial position of
undertakings
The following graphs show the impact of removing the measures MA, VA and TTP on
technical provisions, eligible own funds to cover the SCR and the SCR per undertaking.
The impact is measured relative to the amount with the measures. Each bar corresponds
to one undertaking. The bars are ordered by size in each graph. The graphs demonstrate
that there is a wide disparity of the impact.
Figure 4.3
Figure 4.4
Figure 4.5

142/146
Figure 4.6
Figure 4.7
Figure 4.8
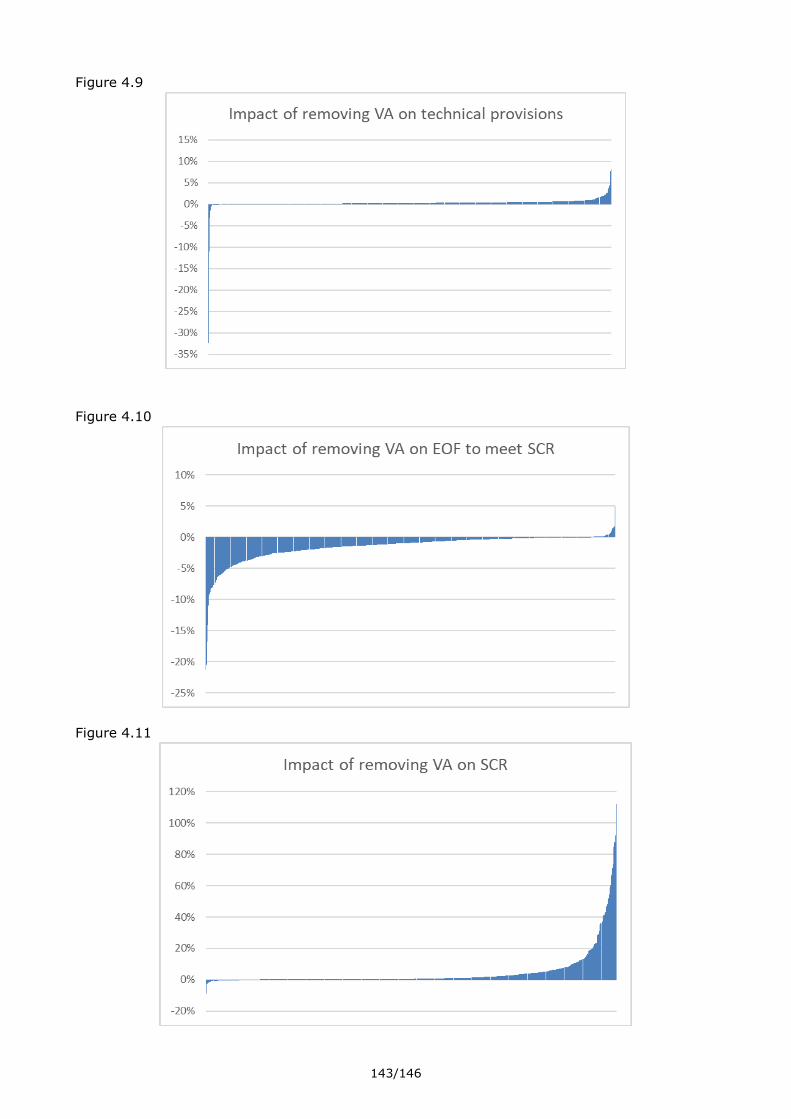
143/146
Figure 4.9
Figure 4.10
Figure 4.11

144/146
Figure 4.12
Figure 4.13
Figure 4.14

145/146
Annex 3: Asset classes
The statistics on investments of insurance and reinsurance undertakings presented in
this report are based on the following asset classification. Please also note that for this
year’s report, a look-through has been applied to the data on collective investment
undertaking, albeit limited to one level of look-through (i.e. if the collective investment
undertaking itself holds another collective investment undertaking no further look-
through has been applied).
Table 4.1
Asset category Grouping
Government bonds Government bonds
Corporate bonds Corporate bonds
Unlisted equity Equity
Listed equity Equity
Collective Investment
Undertakings
Collective Investment
Undertakings
Mortgages and loans Mortgages and loans
Cash and deposits Cash and deposits
Blank Other
Call Options Other
Collateralised securities Other
Credit derivatives Other
Forwards Other
Futures Other
Liabilities Other
Other investments Other
Property Other
Put Options Other
Structured notes Other
Swaps Other
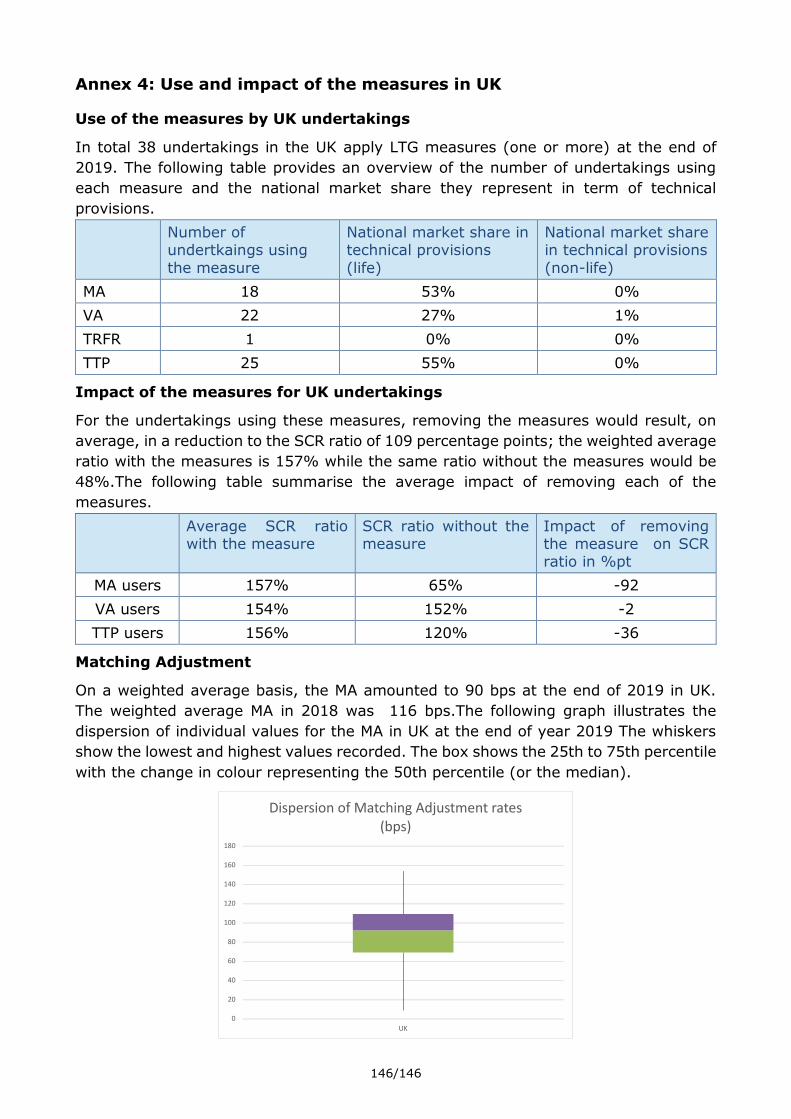
146/146
Annex 4: Use and impact of the measures in UK
Use of the measures by UK undertakings
In total 38 undertakings in the UK apply LTG measures (one or more) at the end of
2019. The following table provides an overview of the number of undertakings using
each measure and the national market share they represent in term of technical
provisions.
Number of undertkaings using
the measure
National market share in technical provisions
(life)
National market share in technical provisions
(non-life)
MA 18 53% 0%
VA 22 27% 1%
TRFR 1 0% 0%
TTP 25 55% 0%
Impact of the measures for UK undertakings
For the undertakings using these measures, removing the measures would result, on
average, in a reduction to the SCR ratio of 109 percentage points; the weighted average
ratio with the measures is 157% while the same ratio without the measures would be
48%.The following table summarise the average impact of removing each of the
measures.
Average SCR ratio with the measure
SCR ratio without the measure
Impact of removing the measure on SCR ratio in %pt
MA users 157% 65% -92
VA users 154% 152% -2
TTP users 156% 120% -36
Matching Adjustment
On a weighted average basis, the MA amounted to 90 bps at the end of 2019 in UK.
The weighted average MA in 2018 was 116 bps.The following graph illustrates the
dispersion of individual values for the MA in UK at the end of year 2019 The whiskers
show the lowest and highest values recorded. The box shows the 25th to 75th percentile
with the change in colour representing the 50th percentile (or the median).
0
20
40
60
80
100
120
140
160
180
UK
Dispersion of Matching Adjustment rates (bps)

Page 1/2
EIOPA
Westhafen Tower, Westhafenplatz 1
60327 Frankfurt – Germany
Tel. + 49 69-951119-20 [email protected] https://www.eiopa.europa.eu