Embed Size (px)
Citation preview
© Lloyd’s1
Solvency IICore validation workshop
9 & 10 May 2011

© Lloyd’s2
Agenda
Introduction
Calibration
The Probability Distribution Forecast
External models and data
P&L attribution
Table discussions and play back/Q&A
Next Steps and feedback
© Lloyd’s3
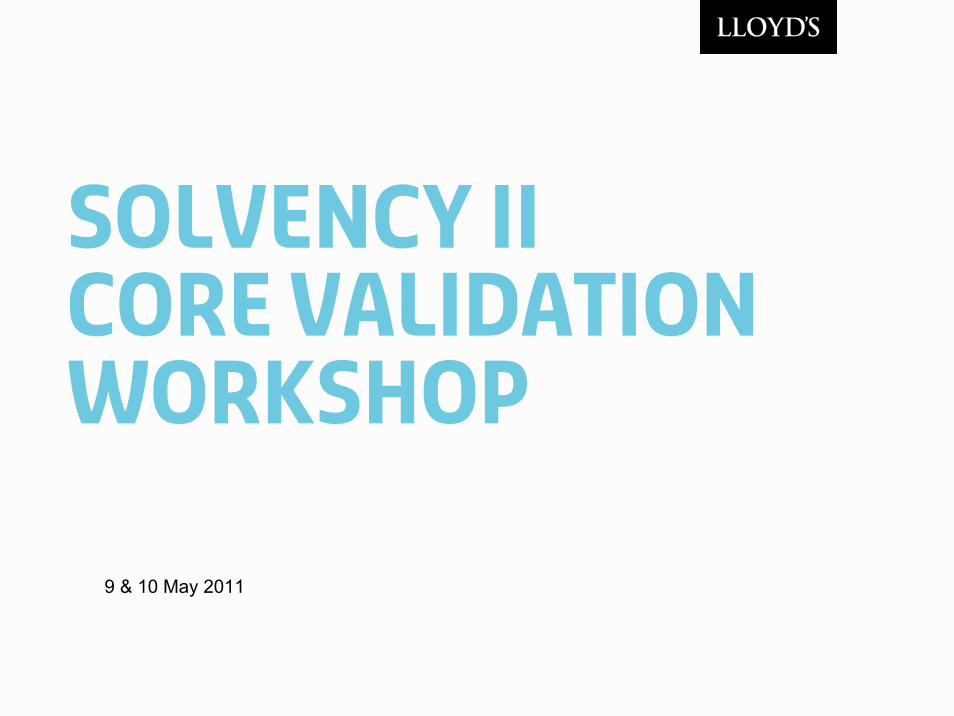
Progress to date on workstream
Core Validation I
• Assumptions & Expert Judgment
• Dependencies
• Model robustness
• Stress & Scenario testing
• Backtesting
Core Validation II
• Calibration
• Probability distribution forecast
• P&L attribution
• External models
Policies & Criteria
• Methodologies
• Validation policy
• Data directory & policy
• Risk mitigation
• Mgmnt actions
• Guarantees etc
Model Demonstrations
Model
Validation
► Core Validation I
► Core Validation II
Final Validation Report
OCT NOV DEC
Draft Validation Report► Additional Submissions
► Validation Policies & Criteria
Feb Mar APR May JUN JUL AUG SEP
You are here
© Lloyd’s4
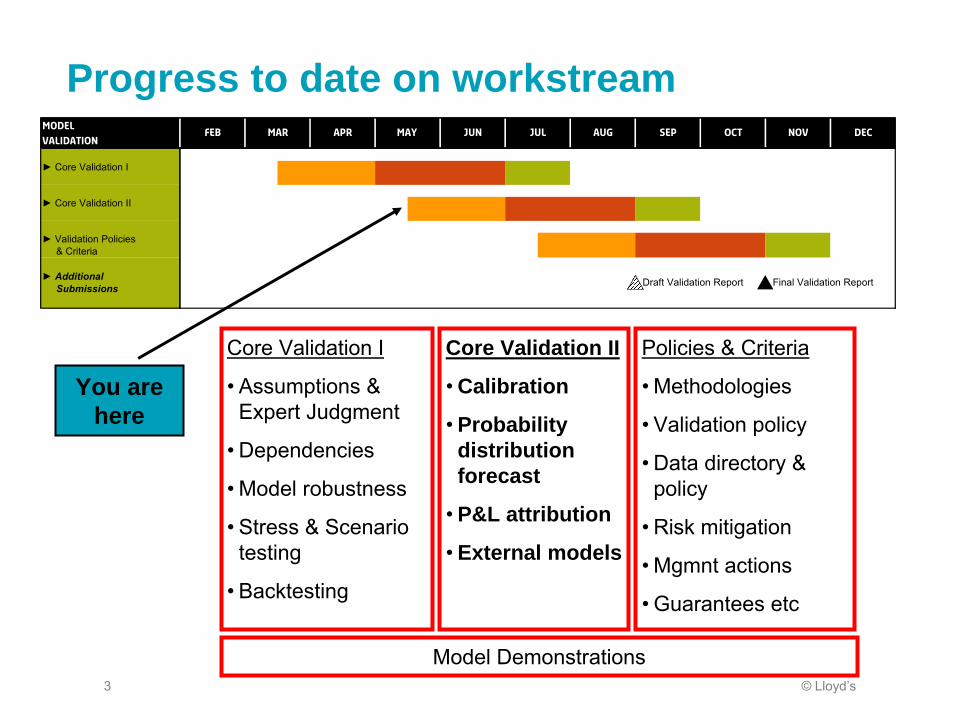
Today the focus is on model validation workstream …
Lloyds
First validation workshops 15 & 16 March
Evidence template and scoring expectations issued 31 March
Guidance on validation report issued 6 May
Agents
Scoring updates early March (as at Q4 2010) and 6 May (as at Q1 2011)
First iteration of evidence templates due 6 May
© Lloyd’s5
... but strong links with other areas
Particularly IMSCR workstream
SCR will need validation
model walkthroughs will inform and prioritise next steps for both workstreams
However, scope of validation is wider than just the SCR number
data, methods and assumptions also apply to TPs
governance and use test
documentation
systems and IT

© Lloyd’s6
calibration
© Lloyd’s77
Lloyd’s believes that the ultimate horizon is the most appropriate basis for setting member capital.
The one year SCR is nonetheless a critical number which must be validated.
Most approaches for deriving the SCR can fall into one of 2 categories:
1. “Actuary-in-a-box” methods which determine a distribution of one year risk directly from the data
2. “Recognition pattern” methods which first calculate ultimate risk and then allocate a portion of this to the next year
Calibration: background
© Lloyd’s88
Lloyd’s is not mandating either approach.
There are no validation loopholes on one year risk methodologies
CEIOPS 48/09 chapter 6 “Calibration Standards” applies specifically to methods which require rescaling from a different time horizon/ risk metric
Chapter 8 “Validation” and 5.3.2.1 “Adequate actuarial and statistical techniques” apply to all methods
In the following slides we will look at both approaches with
a simple example that illustrates both approaches
some examples of validation tools
Calibration: background

© Lloyd’s9
Calibration: simple illustration
Starting point: an increase in the estimate of ultimate claims shows up as an increase in liabilities on the balance sheet
31.12.2009 31.12.2010 (now)
31.12.2011 31.12.2012 31.12.2013 (ultimate)
Paid-to-date 20 50 ? ? ?
Outstanding 80 60 ? ? ?
Estimated Ultimate
100 110 ? ? ?
© Lloyd’s10
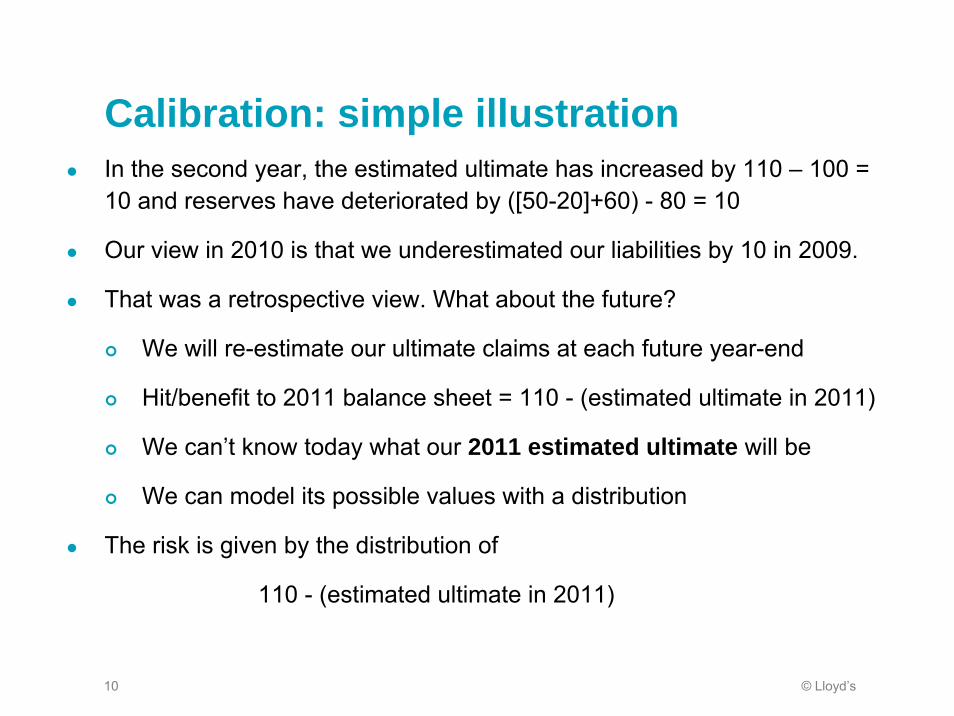
Calibration: simple illustrationIn the second year, the estimated ultimate has increased by 110 – 100 = 10 and reserves have deteriorated by ([50-20]+60) - 80 = 10
Our view in 2010 is that we underestimated our liabilities by 10 in 2009.
That was a retrospective view. What about the future?
We will re-estimate our ultimate claims at each future year-end
Hit/benefit to 2011 balance sheet = 110 - (estimated ultimate in 2011)
We can’t know today what our 2011 estimated ultimate will be
We can model its possible values with a distribution
The risk is given by the distribution of
110 - (estimated ultimate in 2011)

© Lloyd’s11
Calibration: simple illustrationMore generally, risk over a given time horizon is given by the distribution of the “claims development result” (see Merz and Wurthrich [2008])
CDR = (today’s ultimate) – (ultimate at end of horizon)
= (today’s reserve) – [(paid in risk horizon) + (reserve at end of horizon)]
For the ultimate horizon
Reserves are nil at the end of the horizon
The CDR is a cash-flow view comparing future paids with the reserve
For the one year horizon
Reserves are adjusted for paids and favourable/adverse development
The CDR is a balance sheet view comparing successive valuations of the liabilities
© Lloyd’s12
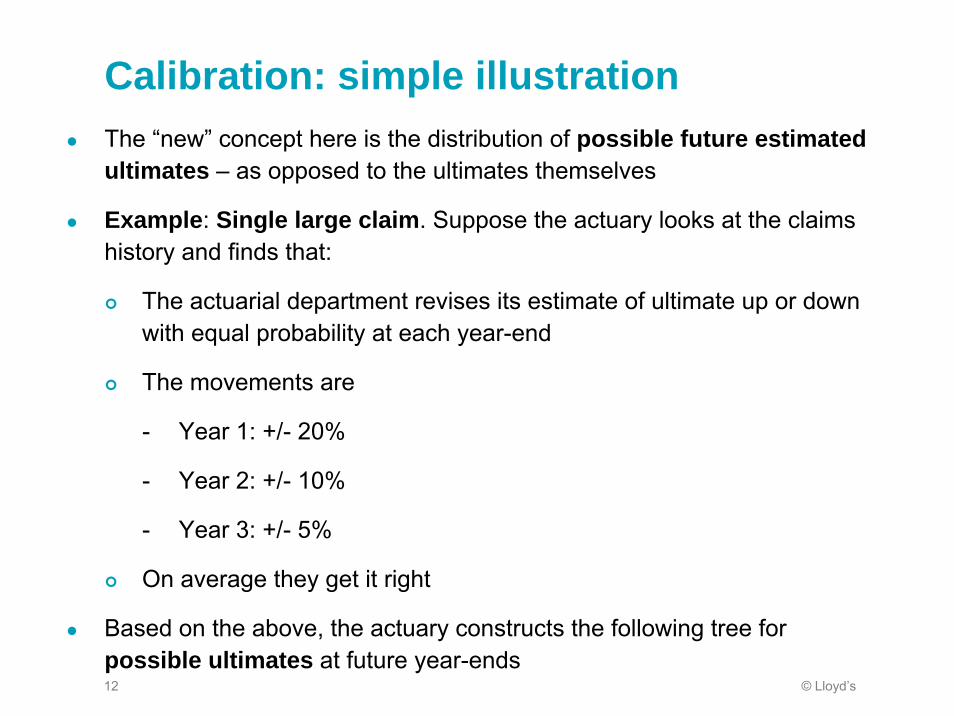
Calibration: simple illustrationThe “new” concept here is the distribution of possible future estimated ultimates – as opposed to the ultimates themselves
Example: Single large claim. Suppose the actuary looks at the claims history and finds that:
The actuarial department revises its estimate of ultimate up or down with equal probability at each year-end
The movements are
- Year 1: +/- 20%
- Year 2: +/- 10%
- Year 3: +/- 5%
On average they get it right
Based on the above, the actuary constructs the following tree for possible ultimates at future year-ends

© Lloyd’s13
Calibration: simple illustrationC1=153
B1=145
C2=138
C3=125A1=132 B2=119
C4=113
C5=102
110 B3=97
C6=92
C7=83
A2=88
B4=79 C8=75
Mean 110 110 110Var 484 610 642
YE 2010(now)
2011 2012 2013(ultimate)
Distribution in 2010 of possible future estimated ultimates

© Lloyd’s14
Calibration: simple illustrationThe ultimate horizon is based on our view today of what our possible “estimates” of ultimate could be in 2013
The 1/200 VaR for the ultimate risk horizon is 43
(Note the drawback of not having enough points in the distribution!)
Dist’n point F(CDR) CDR
C8 0.125 110 - 75 = 35
C7 0.250 27
C6 0.375 18
C5 0.500 8
C4 0.625 -3
C3 0.750 -15
C2 0.850 -28
C1 1.000 110 – 153 = -43
© Lloyd’s15
Calibration: simple illustration
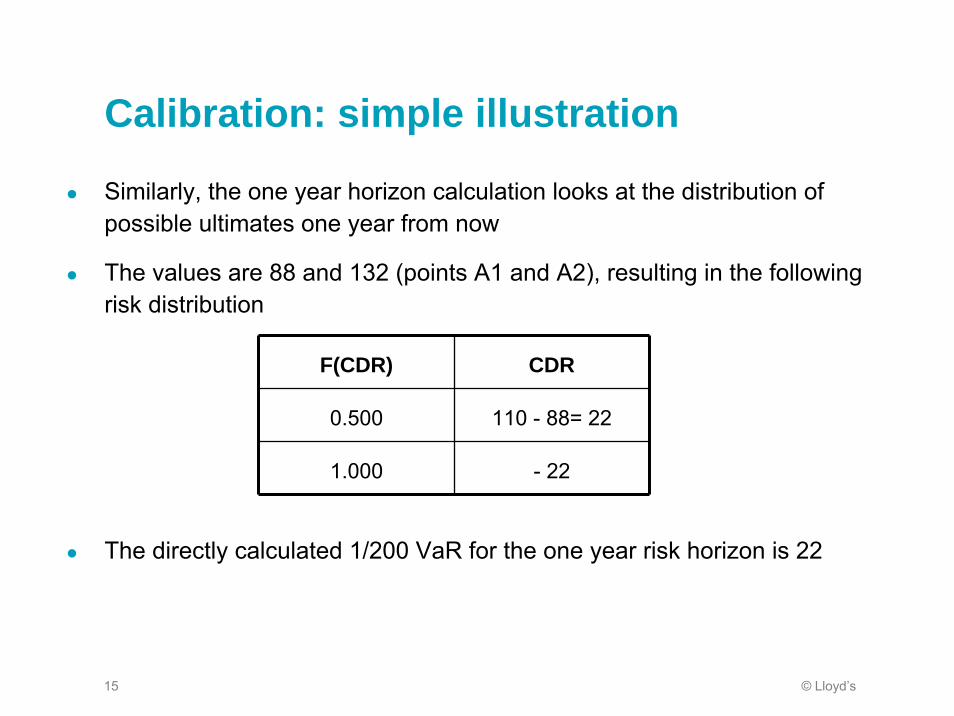
Similarly, the one year horizon calculation looks at the distribution of possible ultimates one year from now
The values are 88 and 132 (points A1 and A2), resulting in the following risk distribution
The directly calculated 1/200 VaR for the one year risk horizon is 22
F(CDR) CDR
0.500 110 - 88= 22
1.000 - 22
© Lloyd’s16
Calibration: simple illustration
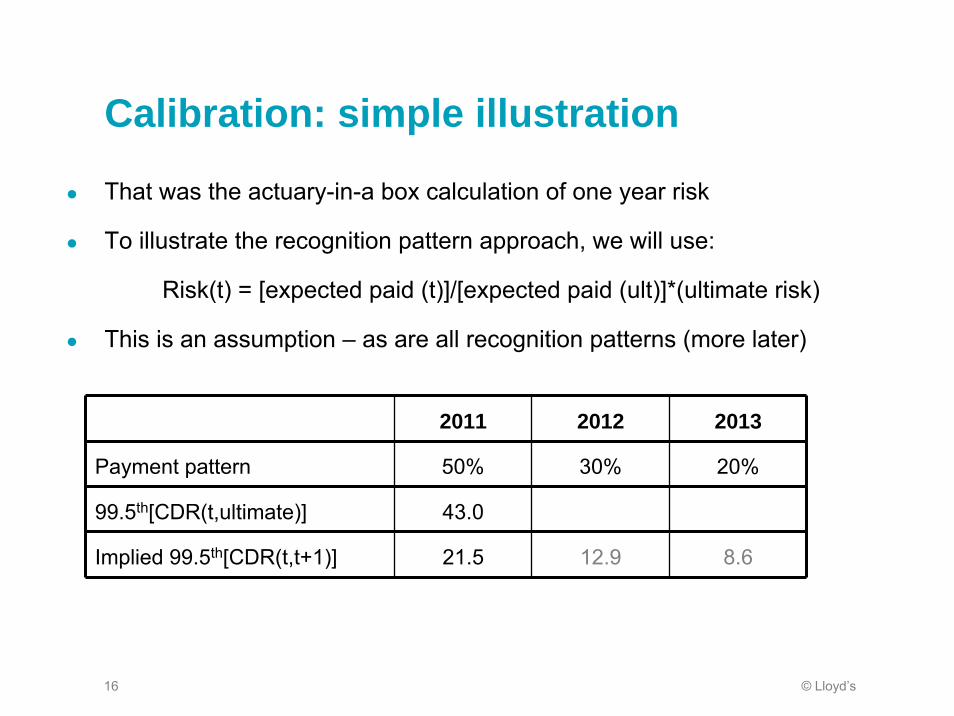
That was the actuary-in-a box calculation of one year risk
To illustrate the recognition pattern approach, we will use:
Risk(t) = [expected paid (t)]/[expected paid (ult)]*(ultimate risk)
This is an assumption – as are all recognition patterns (more later)
2011 2012 2013
Payment pattern 50% 30% 20%
99.5th[CDR(t,ultimate)] 43.0
Implied 99.5th[CDR(t,t+1)] 21.5 12.9 8.6
© Lloyd’s17
Calibration: simple illustration
That was a simplistic illustration of the actuary-in-a-box and recognition pattern approaches
The same basic concepts apply to real world data – e.g. a claims triangle
The following table lists some examples of real world one year risk methodologies
Next we will look at some validation examples that could apply to these methodologies

© Lloyd’s18
Calibration: some methodsMethod Advantages Limitations Examples
Actuary-in-a-box
Some fit distribution to one
year volatilities, which can
help with validation
May have other uses, e.g.
actual vs. expected
analyses
Can be complicated and
overly reliant on mechanical
rules
May be computationally
expensive
Merz & Wuthrich [2008]
Mack-type approach
Bootstrap based approach
in ResQ
Wacek [2007] “Path of
ultimate loss ratio
estimate”
Recognition pattern
Focus is on ultimate – the
familiar risk horizon for
actuaries
Avoids complicated
mathematics
Based on ultimate not 1
year volatilities
Validation may require
comparison with results
from AIB methods
QIS 5 simplification 3
(TP5.32-3)
White and Margetts [2010]
“Time-scaling”
Felisky and Wright [2009]
“Reduction factor”
ReMetrica component

© Lloyd’s19
Calibration: validationExample 1: Testing against experience
Compare historical change in ultimates over 12 month period as apercentage of reserves at beginning of period
The % errors will have an empirical distribution against which the one year calculation can be compared
This could be done at 12 mo, 24 mo, etc. by UWY or all years
Reference: Appendix in Risk Horizon and the Measurement of Economic Capital for General Insurers by Lowe et. al.
Ultimate ReserveUWY 36 mo 48 mo CDR
-2.636 mo % Error
2001 86.5 89.1 18.0 -14.4%Etc.
1.92007 93.1 91.2 23.6 8.1%
© Lloyd’s20
Calibration: validationExample 2: Stress and scenario testing
Describe extreme scenarios which would result in a significant change in next year’s estimated ultimate
- These may (should) have been developed as part of the validationfor the ultimate risk
- E.g. for reserving risk this could include adverse rulings on known claims and some big IBNR claims
- The closer the link to actual experience, the more convincing the test
How does the change in ultimate compare with the risk indicated by the recognition pattern or actuary in the box?
© Lloyd’s21
Calibration: validationExample 3: Comparison with alternatives
Alternative method (refer to earlier table)
Sense check against results from more detailed analysis on larger classes
- E.g. Long and short-tailed classes on which a actuary-in-a-box method or test against experience has been done
Sense check against ultimate analysis
- Key validation check: Should a recognition pattern allow for oneyear risk to be greater than ultimate?

© Lloyd’s22
Calibration: one year vs. ultimate riskNo in the true sense of risk – i.e. all possible outcomes.
But it could arise as a result of the risk metric – i.e. VaR 99.5%.
Extreme example: our earlier simple illustration re-worked for a binary event claim
One very large outcome with probability 1/400
All other outcomes = 0

© Lloyd’s23
Calibration: one year vs. ultimate riskC1= 400
B1=4
C2=0
C3=0A1=2 B2=0
C4=0
C5=0
1 B3=0
C6=0
C7=0
A2=0
B4=0 C8=0
Mean 1 1 1Var 1 3 399
YE 2010(now)
2011 2012 2013(ultimate)
Binary event
Distribution in 2010 of possible future expected ultimatesProbabilities at each node = 0.5 except at C1 and C2
Pr(C1|B1) = 1/100Pr(C1) = 1/400
Pr(C2|B1) = 99/100Pr(C1) = 99/400
Pr(all other C) = 1/8
1
© Lloyd’s24
Calibration: one year vs. ultimate riskThe one year horizon risk is 1 – 2 = -1.
The risk on the ultimate horizon is 1 – 400 = -399.
However using 99.5% VaR gives an ultimate risk of 1 – 0 = 1 (i.e. no downside risk).
So one year risk is greater according to 99.5% VaR.
© Lloyd’s25
Calibration: one year vs. ultimate riskRemember that possible ultimates for both horizons are estimated todaywith data available now.
For this reason the one year view must be consistent with the ultimate view – otherwise one would not reflect all the information available.
Don’t confuse the risk horizon with the valuation date.
The question of whether one year risk can exceed ultimate is contentious! You may have a different view.
Short answer for validation: have a clear justification for how your one year risk compares to ultimate.

© Lloyd’s26
Probability distribution forecast
© Lloyd’s2727
The key statistical quality issue is the “richness of the probability distribution forecast” for the SCR
A distribution for Basic Own Funds based on a limited number of data points will provide a less reliable SCR
Two ways this could occur:
Underlying component distributions (e.g. op risk, reserving risk) are based on a few key points, first two moments, etc.
An insufficient number of simulations for a stable SCR
No new validation techniques are required, but the Advice expects agents “to make extensive use of validation techniques (stress-testing, scenario analysis, etc.)” (5.45)
PD forecast: background

© Lloyd’s2828
Example 1. Reserve risk modelled with lognormal parameterised from mean and CoV
Ensure that all relevant information has been included – e.g. maximum deterioration on key claims
Sensitivity test for parameter uncertainty in mean and CoV
Impact of alternative distribution, particularly in the tail
Comparison with other classes for which more detailed analysis has been done
PD forecast: validation

© Lloyd’s2929
Example 2. Test of stability of model for which cat is the material fat tailed risk
Build a simple sub-model for gross cat risk only
Run different seeds at different numbers of simulations (specifically mentioned in (8.87) – (8.89))
Convergence in sub-model at given number of simulations is notproof of convergence of CK at that number of simulations
However lack of convergence implies lack of convergence of CK
Faster to test than running the full model (the brute force option)
Can also compare outputs with analytical calculation from ELT
Agent determines criteria for stability
PD forecast: validation

© Lloyd’s3030
PD forecast: validation
Test of model stability using 1 in 200 Year OEP
SimulationsCalculation (from ELT)
% Difference with calculation
Seed 10k 100k 10k 100k
0 456.8 459.3 457.5 -0.2% 0.4%
1 453.3 456.9 -0.9% -0.1%
…
8 497.7 455.0 8.8% -0.5%
9 436.1 460.6 -4.7% 0.7%
Mean 452.9 458.1 -1.0% 0.1%
Std dev 19.5 2.2 4.1% 0.5%
CoV 4.3% 0.5%
© Lloyd’s31
External models and Data

© Lloyd’s3232
EMD: Key themes from the guidance
The standard for validation is the same, whether a component of the internal model is developed in house or outsourced
“The use of a model or data from a third party shall not be considered justification for exemption from any of the requirements for the internal model set out in Articles 120 to 125” (Article 126, Solvency II Directive)
Agents must be able to clearly identify the places in the model where they have outsourced expertise
“…undertakings must be able to document and explain the role of any External Models or Data, and the extent to which they are used within the internal model” (DOC48/09 10.19)
Agents need a clear rationale for using external models
“Undertakings shall be able to explain the reasons for preferring external models or data to internal ones. They shall be able to list the alternatives considered and explain the decision […]” (DOC48/09 10.20)
© Lloyd’s3333
EMD: Key themes from the guidanceThere are a number of ways for agents to demonstrate ownership of external model and data
“…in-house knowledge of the EMD may be demonstrated by:
- Detailed understanding of the methodology […], capabilities, limitations and appropriateness for the SCR
- …full understanding of the effect and significance of proprietaryelements
- …detailed validation of EM output
- …documentation of the rationale behind judgmental over-rides
- Retention of in-house expertise” (DOC48/09 10.20)
The more material an external model is as a part of your internal model, the higher the bar will be
“…expectations of external models or data should be appropriate to their nature, scale and complexity. This recognises the principal of proportionality” (DOC48/09 10.25)
© Lloyd’s3434
EMD: Examples of evidenceThe requirements and detailed guidance notes on ‘External Models and Data’ lay out some of the ways in which the in-house knowledge and ownership of the external models can be demonstrated
We will give some high level examples on how this could be met for:
A bootstrapping module
ESG model output
Catastrophe models & data
These are just examples, and are not the required or complete list of methodologies

© Lloyd’s3535
Recap of requirement of in-house ownership (from DOC48/09 10.20): “In-house knowledge of the EMD may be demonstrated by:
1) Detailed knowledge of the methodological underpinnings and basic construction of External models and data, including an understanding of the models’ capabilities, limitations, and appropriateness for use in deriving the SCR
2) Demonstration of a full understanding of the effect and significance of the proprietary elements in the external models;
3) Performing detailed validation of external model output;
4) Documentation of the rationale behind any judgment-based overrides or any other adjustments made to external data sets orexternal model outputs; and
5) Retention of in-house expertise on the External models and data for as long as these are used to derive the SCR”
EMD: Examples of evidence
© Lloyd’s36
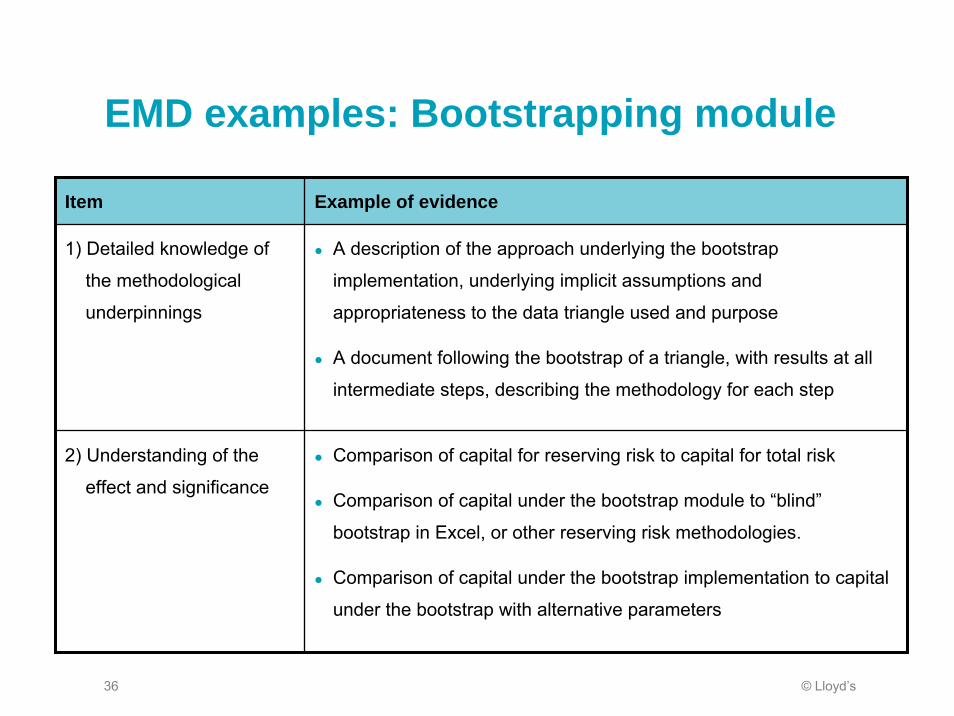
EMD examples: Bootstrapping module
Item Example of evidence
1) Detailed knowledge of
the methodological
underpinnings
A description of the approach underlying the bootstrap
implementation, underlying implicit assumptions and
appropriateness to the data triangle used and purpose
A document following the bootstrap of a triangle, with results at all
intermediate steps, describing the methodology for each step
2) Understanding of the
effect and significance
Comparison of capital for reserving risk to capital for total risk
Comparison of capital under the bootstrap module to “blind”
bootstrap in Excel, or other reserving risk methodologies.
Comparison of capital under the bootstrap implementation to capital
under the bootstrap with alternative parameters

© Lloyd’s37
EMD examples: Bootstrapping moduleItem Example of evidence
3) Performing detailed
validation of output
Sense checks on the more obvious or intuitive outputs such as
graphs of residuals, mean of distribution compared to best
estimate, sense checks on link ratios
For a single line of business comparing the results of the
bootstrap to those of a side bootstrap model built in Excel
4) Rationale behind any
judgment-based
overrides
Documentation of initial assumption, revised assumption, reason
for change, consistency of assumptions, and impact
5) Retention of in-house
expertise
Evidence of training in the module, and of general bootstrapping.
© Lloyd’s38
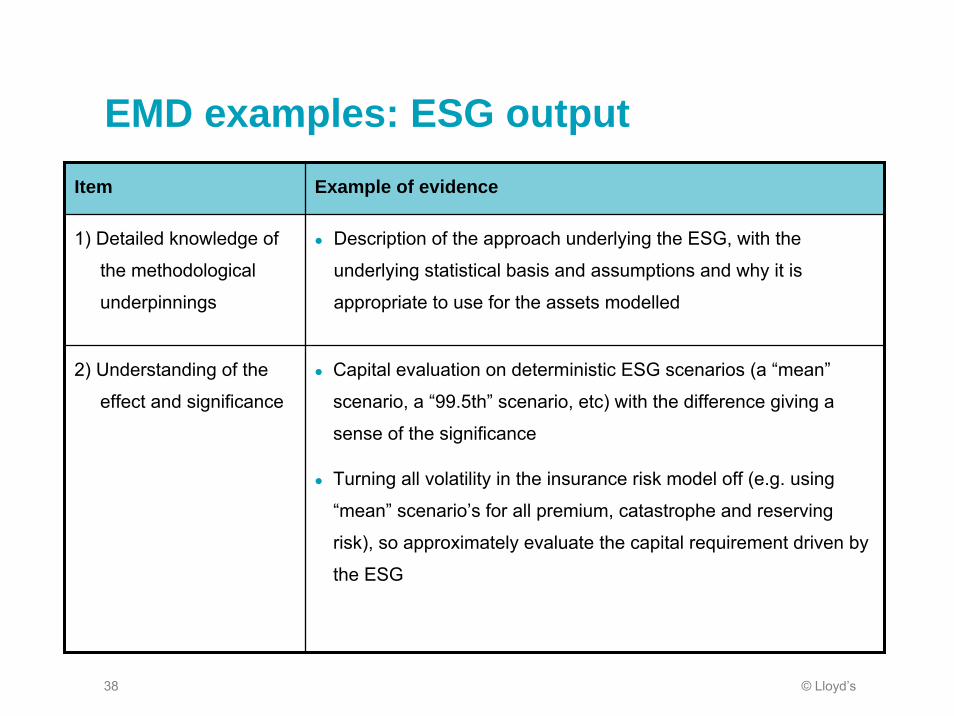
EMD examples: ESG outputItem Example of evidence
1) Detailed knowledge of
the methodological
underpinnings
Description of the approach underlying the ESG, with the
underlying statistical basis and assumptions and why it is
appropriate to use for the assets modelled
2) Understanding of the
effect and significance
Capital evaluation on deterministic ESG scenarios (a “mean”
scenario, a “99.5th” scenario, etc) with the difference giving a
sense of the significance
Turning all volatility in the insurance risk model off (e.g. using
“mean” scenario’s for all premium, catastrophe and reserving
risk), so approximately evaluate the capital requirement driven by
the ESG
© Lloyd’s39
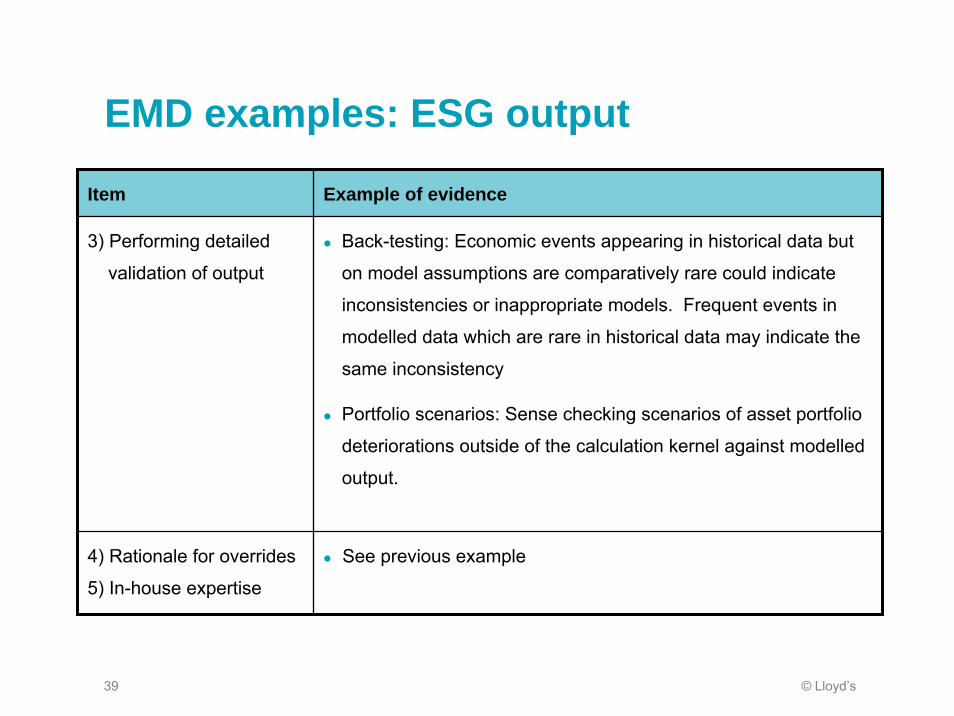
EMD examples: ESG output
Item Example of evidence
3) Performing detailed
validation of output
Back-testing: Economic events appearing in historical data but
on model assumptions are comparatively rare could indicate
inconsistencies or inappropriate models. Frequent events in
modelled data which are rare in historical data may indicate the
same inconsistency
Portfolio scenarios: Sense checking scenarios of asset portfolio
deteriorations outside of the calculation kernel against modelled
output.
4) Rationale for overrides
5) In-house expertise
See previous example
© Lloyd’s40
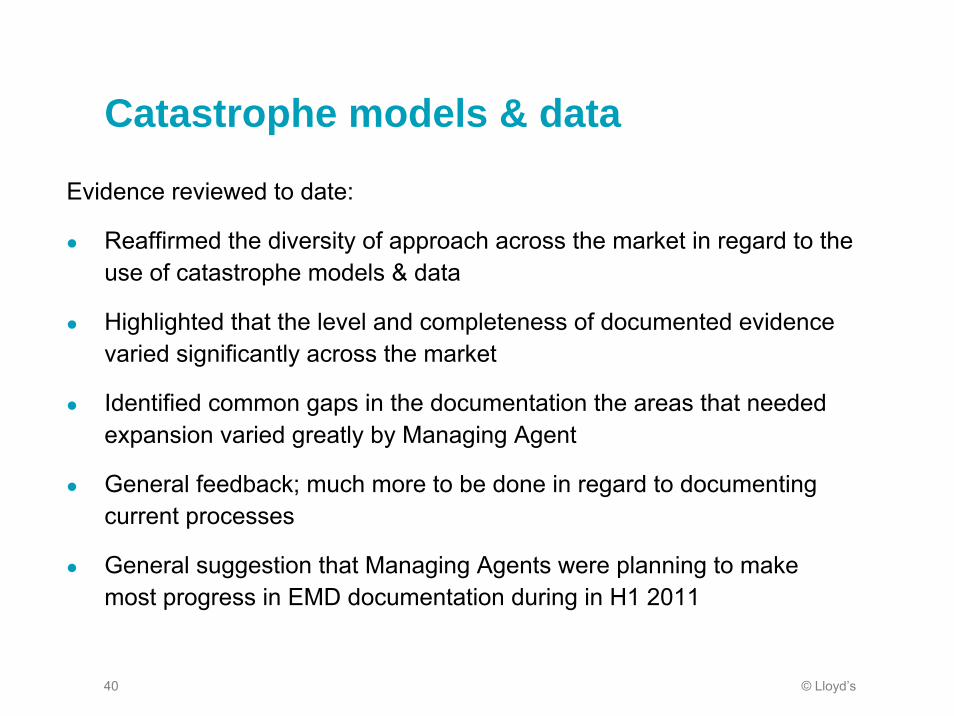
Catastrophe models & data
Evidence reviewed to date:
Reaffirmed the diversity of approach across the market in regard to the use of catastrophe models & data
Highlighted that the level and completeness of documented evidence varied significantly across the market
Identified common gaps in the documentation the areas that needed expansion varied greatly by Managing Agent
General feedback; much more to be done in regard to documenting current processes
General suggestion that Managing Agents were planning to make most progress in EMD documentation during in H1 2011

© Lloyd’s41
Catastrophe models & dataSection 6 of the Detailed Guidance Note issued for External Models & Data in March 2010 provides a list of examples relating to documenting validation procedures
The Lloyd’s Exposure Management team are available to:
provide input and assistance to the refinement of current Cat Models & Data documentation
Assist in identifying gaps between current documentation and section 6 guidance
This can take the form of:
Direct feedback to completed EMD questionnaires and evidence templates
Direct feedback following walkthrough meetings
Ongoing dialogue with Managing Agents

© Lloyd’s42
EMD examples: Cat models & data
Item Example of evidence
1) Detailed knowledge of
the methodological
underpinnings
Internal summaries of documentation / presentations covering
e.g. event generation, vulnerability, hazard and financial loss
modules
External education through seminars, conferences
Adjustments for known exclusions / limitations of model
Explanation / rationale for why the data or models are
appropriate for the classes of business
2) Understanding of the
effect and significance
of proprietary
elements
Sensitivity testing of outputs with and without various modelling
options
Model change management processes
Comparison with outputs from other vendor models
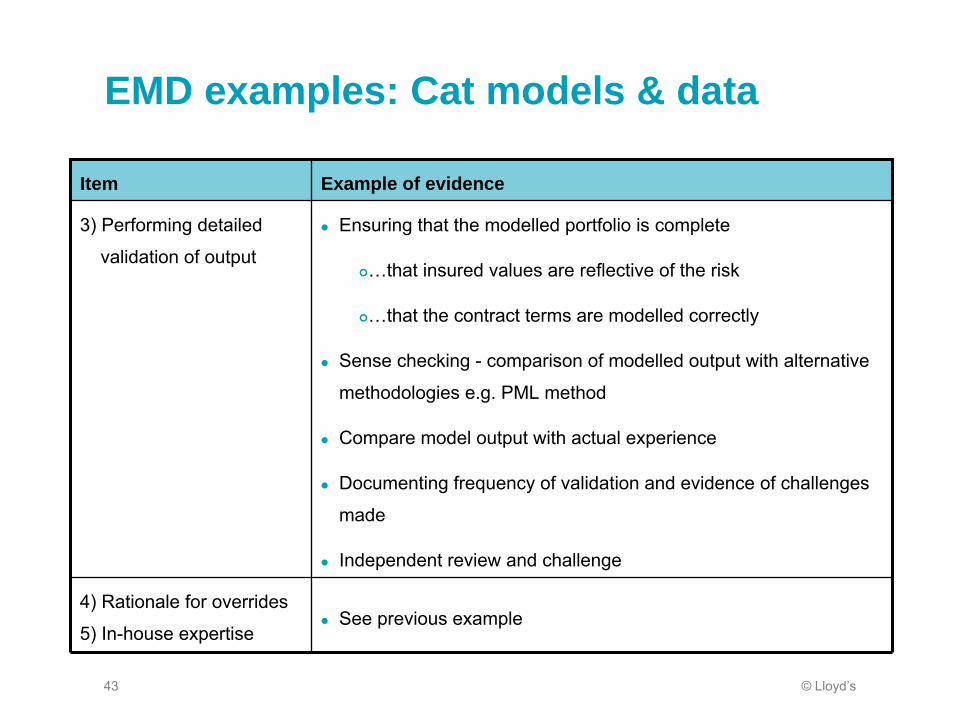
© Lloyd’s43
EMD examples: Cat models & data
Item Example of evidence
3) Performing detailed
validation of output
Ensuring that the modelled portfolio is complete
…that insured values are reflective of the risk
…that the contract terms are modelled correctly
Sense checking - comparison of modelled output with alternative
methodologies e.g. PML method
Compare model output with actual experience
Documenting frequency of validation and evidence of challenges
made
Independent review and challenge
4) Rationale for overrides
5) In-house expertiseSee previous example

© Lloyd’s44
Profit & loss attribution
© Lloyd’s45
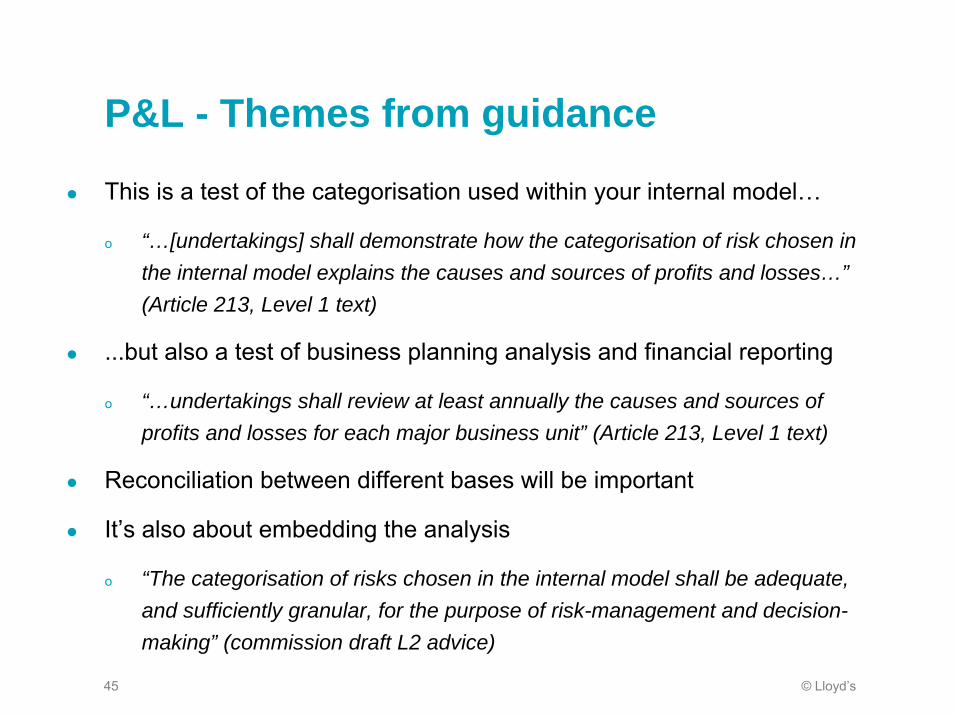
P&L - Themes from guidance
This is a test of the categorisation used within your internal model…
o “…[undertakings] shall demonstrate how the categorisation of risk chosen in the internal model explains the causes and sources of profits and losses…”(Article 213, Level 1 text)
...but also a test of business planning analysis and financial reporting
o “…undertakings shall review at least annually the causes and sources of profits and losses for each major business unit” (Article 213, Level 1 text)
Reconciliation between different bases will be important
It’s also about embedding the analysis
o “The categorisation of risks chosen in the internal model shall be adequate, and sufficiently granular, for the purpose of risk-management and decision-making” (commission draft L2 advice)

© Lloyd’s46
P&L Attribution
Economic Balance
Sheet @ t=0
Economic Balance
Sheet @ t=1
Financial Statement Balance
Sheet @ t=1
Financial Statement Balance
Sheet @ t=0Financial Statement P&L
“ECAP P&L”
Reconciliation Reconciliation
by BU
by Risk
P&L attribution focuses on the movement in the Economic Balance Sheet (red arrow in diagram)….
…so agents will need to construct a historical P&L on this economic basis
However, alternatives to this may be appropriate where they better fit an agent’s economic view
o E.g. if planning is on an alternative basis
o Agents should note that this may make the model’s “explanation” more challenging
Reconciliations between the economic (model) basis and the Financial Statement basis will be required
Source: EIPOA pre-consultation draft “Level 3 Guidelines on Profit & Loss Attribution”
What is profit / loss?

© Lloyd’s47
What do we need to attribute to?Lloyd’s is not mandating a specific set of classes to attribute to.o Agents will have to make their own decisions, and the selected grouping will vary by
agent…o …however, this must be sufficiently granular to meet the spirit of the test
Profit and loss should be attributed to “Major Business Units”.o On the underwriting side, Lloyd’s would expect this to correspond broadly to modelled lines
of business / groupso Other “units” to consider could include specific underwriters, geographical areas,
reinsurance treaties / collections of contracts, investment portfolios / investment managers
Profit and loss should further be attributed to “Risk Drivers”.o Materiality is the most important consideration hereo There is no unique definition of what “risk drivers” are – The risk driver structure in agents’
models are a sensible starting point…o …but this should be supplemented with common sense and analysis of drivers of variation
in past performanceo Continue to refine the allocation until there is only one material risk driver in each allocated
bucket

© Lloyd’s48
What do we need to do?There are three parts to identification for P&L attribution:o Identify the “causes and sources” of P&L in actual historical performance – include
potential material o Identify the drivers in the model & attribute P&L variability to themo Reconcile to show that the model can explain the causes and sources
Syndicate 999 has performed a detailed P&L attribution exercise on its Property Treaty line of businesso This is a major contributor to planned profit, and has therefore been defined as a major
“business unit” for syndicate 999o 2010 saw an economic basis loss of £52m, compared to a planned profit of £30mo This material variation arose from a variety of sources – the test now checks that these
reasons are appropriately reflected as drivers of P&L in the modelo The next step is to identify and explain these reasons at an appropriate level of
granularityo Note the P&L categorisation here is an example only – agents should use a
categorisation that works for their business and model
Step 1.
Identify
Step 3.
materiality
Step 2.
explain
Step 4.
justification
P&L Attribution
Key points
© Lloyd’s49
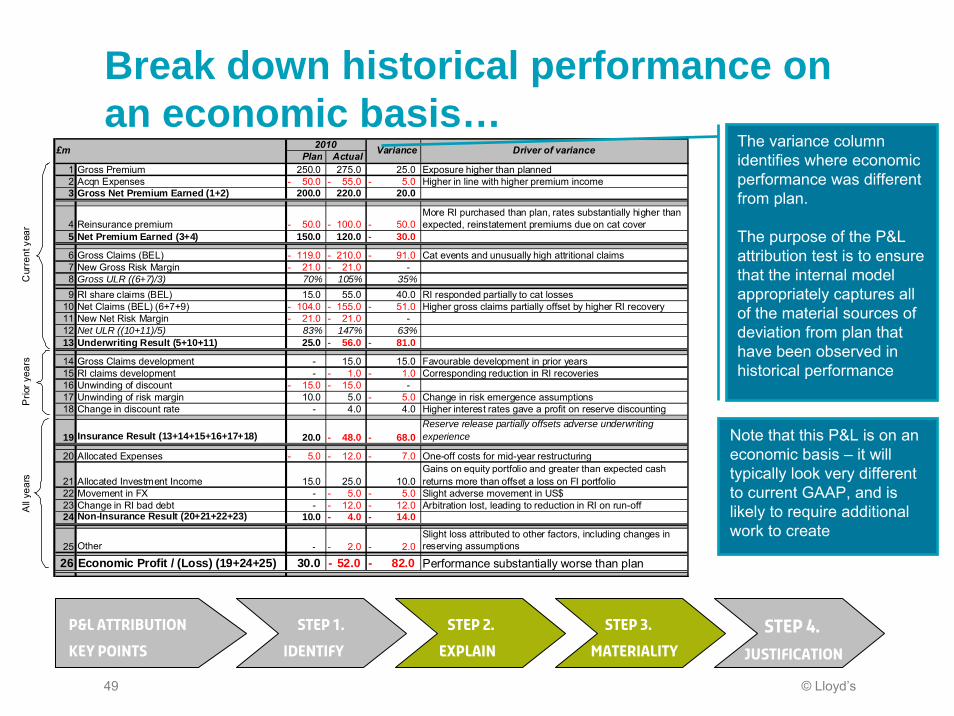
Break down historical performance on an economic basis…
Note that this P&L is on an economic basis – it will typically look very different to current GAAP, and is likely to require additional work to create
Step 1.
Identify
Step 3.
materiality
Step 2.
explain
Step 4.
justification
P&L Attribution
Key points
Plan Actual1 Gross Premium 250.0 275.0 25.0 Exposure higher than planned2 Acqn Expenses 50.0- 55.0- 5.0- Higher in line with higher premium income3 Gross Net Premium Earned (1+2) 200.0 220.0 20.0
4 Reinsurance premium 50.0- 100.0- 50.0- More RI purchased than plan, rates substantially higher than expected, reinstatement premiums due on cat cover
5 Net Premium Earned (3+4) 150.0 120.0 30.0-
6 Gross Claims (BEL) 119.0- 210.0- 91.0- Cat events and unusually high attritional claims7 New Gross Risk Margin 21.0- 21.0- - 8 Gross ULR ((6+7)/3) 70% 105% 35%9 RI share claims (BEL) 15.0 55.0 40.0 RI responded partially to cat losses
10 Net Claims (BEL) (6+7+9) 104.0- 155.0- 51.0- Higher gross claims partially offset by higher RI recovery11 New Net Risk Margin 21.0- 21.0- - 12 Net ULR ((10+11)/5) 83% 147% 63%13 Underwriting Result (5+10+11) 25.0 56.0- 81.0-
14 Gross Claims development - 15.0 15.0 Favourable development in prior years15 RI claims development - 1.0- 1.0- Corresponding reduction in RI recoveries16 Unwinding of discount 15.0- 15.0- - 17 Unwinding of risk margin 10.0 5.0 5.0- Change in risk emergence assumptions18 Change in discount rate - 4.0 4.0 Higher interest rates gave a profit on reserve discounting
19 Insurance Result (13+14+15+16+17+18) 20.0 48.0- 68.0- Reserve release partially offsets adverse underwriting experience
20 Allocated Expenses 5.0- 12.0- 7.0- One-off costs for mid-year restructuring
21 Allocated Investment Income 15.0 25.0 10.0 Gains on equity portfolio and greater than expected cash returns more than offset a loss on FI portfolio
22 Movement in FX - 5.0- 5.0- Slight adverse movement in US$23 Change in RI bad debt - 12.0- 12.0- Arbitration lost, leading to reduction in RI on run-off24 Non-Insurance Result (20+21+22+23) 10.0 4.0- 14.0-
25 Other - 2.0- 2.0- Slight loss attributed to other factors, including changes in reserving assumptions
26 Economic Profit / (Loss) (19+24+25) 30.0 52.0- 82.0- Performance substantially worse than plan
Driver of variance2010£m Variance
Cur
rent
yea
rP
rior y
ears
All
year
s
The variance column identifies where economic performance was different from plan.
The purpose of the P&L attribution test is to ensure that the internal model appropriately captures all of the material sources of deviation from plan that have been observed in historical performance

© Lloyd’s50
Identify the drivers in the corresponding model P&L…
2010Variance
1 Gross Premium 25.0 Modelled as fixed - equal to plan2 Acqn Expenses 5.0- Modelled as fixed % gross3 Gross Net Premium Earned (1+2) 20.0
4 Reinsurance premium 50.0- pModelled as a fixed component (equal to plan) plus reinstatements due on risk XL and Cat programmes
5 Net Premium Earned (3+4) 30.0-
6 Gross Claims (BEL) 91.0- Modelled stochastically as the sum of attritional, large and cat claim
7 New Gross Risk Margin - p Modelled as a fixed % of BEL8 Gross ULR ((6+7)/3) 35%
9 RI share claims (BEL) 40.0 Cat and large loss XL recoveries modelled directly from gross losses. QS recoveries modelled directly
10 Net Claims (BEL) (6+7+9) 51.0- Modelled as (Gross - RI)11 New Net Risk Margin - p Approximated as equal to gross12 Net ULR ((10+11)/5) 63%13 Underwriting Result (5+10+11) 81.0-
14 Gross Claims development 15.0 Reserve development modelled using a lognormal distribution with COV based on a bootstrapping exercise
15 RI claims development 1.0- p Uses net to gross ratio16 Unwinding of discount - Average payment patterns used to discount BEL at time 117 Unwinding of risk margin 5.0- Not modelled explicitly18 Change in discount rate 4.0 Discount rate from ESG used in explicit discounting
19 Insurance Result (13+14+15+16+17+18) 68.0-
20 Allocated Expenses 7.0- Underwriting expenses modelled as fixed21 Allocated Investment Income 10.0 Investment income modelled using a stochastic ESG22 Movement in FX 5.0- Modelled in 2 currencies23 Change in RI bad debt 12.0- Modelled stochastically as % recovery
24 Non-Insurance Result (20+21+22+23) 14.0-
25 Other 2.0- No other drivers modelled
26 Economic Profit / (Loss) (19+24+25) 82.0-
Modelling Approach£m Captured
Cur
rent
yea
rP
rior y
ears
All
year
s
This column describes whether the source of variation is adequately captured within the model, with “p” indicating that the variation is partially captured by the modelling approach
Step 1.
Identify
Step 3.
materiality
Step 2.
explain
Step 4.
justification
P&L Attribution
Key points
© Lloyd’s51
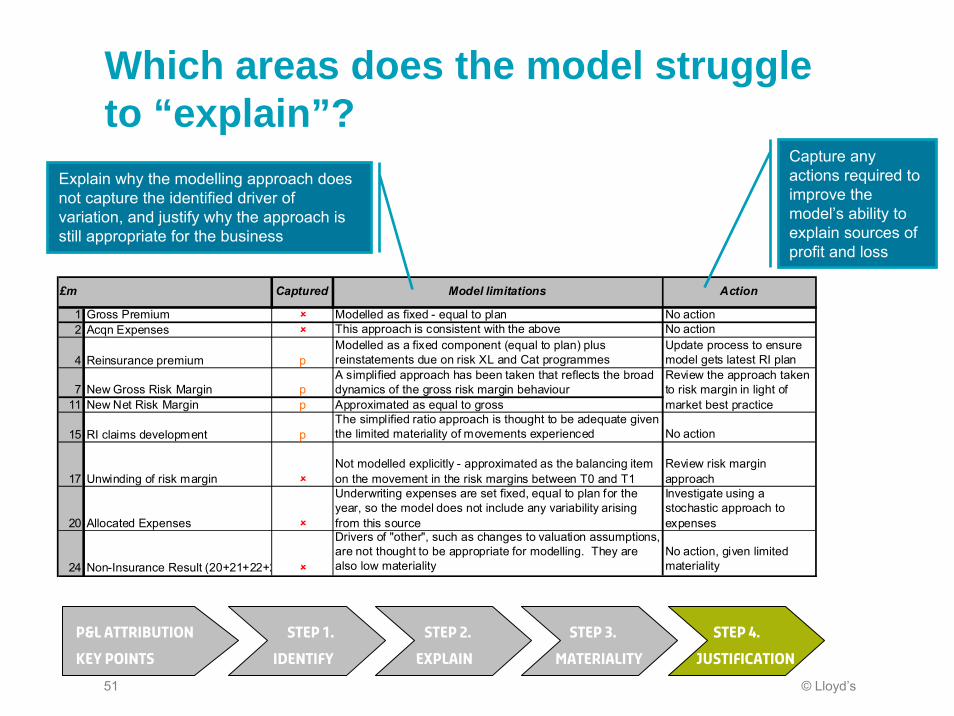
Which areas does the model struggle to “explain”?
Step 1.
Identify
Step 3.
materiality
Step 2.
explain
Step 4.
justification
P&L Attribution
Key points
1 Gross Premium Modelled as fixed - equal to plan No action2 Acqn Expenses This approach is consistent with the above No action
4 Reinsurance premium pModelled as a fixed component (equal to plan) plus reinstatements due on risk XL and Cat programmes
Update process to ensure model gets latest RI plan
7 New Gross Risk Margin pA simplified approach has been taken that reflects the broad dynamics of the gross risk margin behaviour
11 New Net Risk Margin p Approximated as equal to gross
15 RI claims development pThe simplified ratio approach is thought to be adequate given the limited materiality of movements experienced No action
17 Unwinding of risk marginNot modelled explicitly - approximated as the balancing item on the movement in the risk margins between T0 and T1
Review risk margin approach
20 Allocated Expenses
Underwriting expenses are set fixed, equal to plan for the year, so the model does not include any variability arising from this source
Investigate using a stochastic approach to expenses
24 Non-Insurance Result (20+21+22+2
Drivers of "other", such as changes to valuation assumptions, are not thought to be appropriate for modelling. They are also low materiality
No action, given limited materiality
Action
Review the approach taken to risk margin in light of market best practice
Model limitations£m Captured
Explain why the modelling approach does not capture the identified driver of variation, and justify why the approach is still appropriate for the business
Capture any actions required to improve the model’s ability to explain sources of profit and loss
© Lloyd’s52
Guidance also expects P&L Attribution to be applied within businesses
Lloyd’s will expect agents to be able to evidence that P&L attribution is embedded in their businesso It can’t just be a model compliance exercise
The analysis of historical performance could be used, for example, to provide insights for future strategy and risk management:o Evaluating the operation of controlso Updating the risk register / identifying new sources of risko Reviewing the risk strategyo Evaluating risk budgets / verifying that risk limits are effectiveo Identifying risk drivers that require further analysis / different
controlsLots of this will already be done within agent review and planning processes

© Lloyd’s53
P&L Attribution should be a key validation tool
Agents should ensure that P&L attribution analysis is used to support their model validation:
o Are all material risks covered?
o Are risk drivers granular enough to represent the business?
o What is the potential impact of non-modelled / qualitatively assessed risks?
o Was last year a realistic outcome within the model (a back-test with a single point of data)?
© Lloyd’s54
So, is P&L attribution the same as backtesting?
No – although the concepts are linked, they require separate analysis and come to distinct conclusions
Consider an example where a cat writer combines a number of EP curves within their model:
P&L attribution is a test that you have in your model all of the EP curves that you should have, i.e. is a completeness check for the number of EP curves against the risk drivers in your business
Backtesting compares the shape of each individual EP curve against the range of outcomes for the given risk driver over many years
P&L attribution is to ensure that your model overall has all the right moving parts…
…Backtesting is to ensure that any given moving part moves in theright way

© Lloyd’s55
TABLE Discussions
© Lloyd’s56
Suggested topics for discussion
Do you have other examples of how you are performing validation on any of these areas?
alternative approaches
What resources are you using to obtain independence in validation?
balance between internal vs external
what areas are you focusing on?

© Lloyd’s57
Round up and questions

© Lloyd’s58
Next steps
© Lloyd’s59
What happens next?Slides will be made available on lloyds.com after both workshops
Validation report guidance now available on website
Evidence templates and updated scores will be reviewed and questions raised with agents together with any request for supporting evidence
Initial model walkthroughs to be completed by end May
second tranche will begin mid June – booking to start soon
Next workshops on validation – 4 & 5 July
Other upcoming sessions:
Governance, Risk Management & Use – 17 & 18 May
IMSCR & TPs – 13 & 17 June
Finally, before you go, a request for feedback ...

© Lloyd’s60
How useful have you found today’s session?
A. Very useful and provided helpful
practical guidance and clarification
B. More detailed guidance and worked
examples would have been helpful
C. We have clear views on Lloyd’s
expectations for validation
D. Greater detail needed on format and
timing of Lloyd’s reviews
E. I’m too polite to say!
10 May results
9 May results
38%
A
38%
B
11%
C
11%
D
2%
E
19%
A
53%
B
6%
C
17%
D
4%
E

© Lloyd’s61
How have you found format of today’s workshop?
A. It was a good balance between
presentation and discussion
B. Would prefer less presentation and
more discussion
C. Would prefer less discussion and
more presentation
D. Other.
9 May results
10 May results
72%
A
2%
B
26%
C0%D
76%
A
14%
B
10%
C0%D
© Lloyd’s62
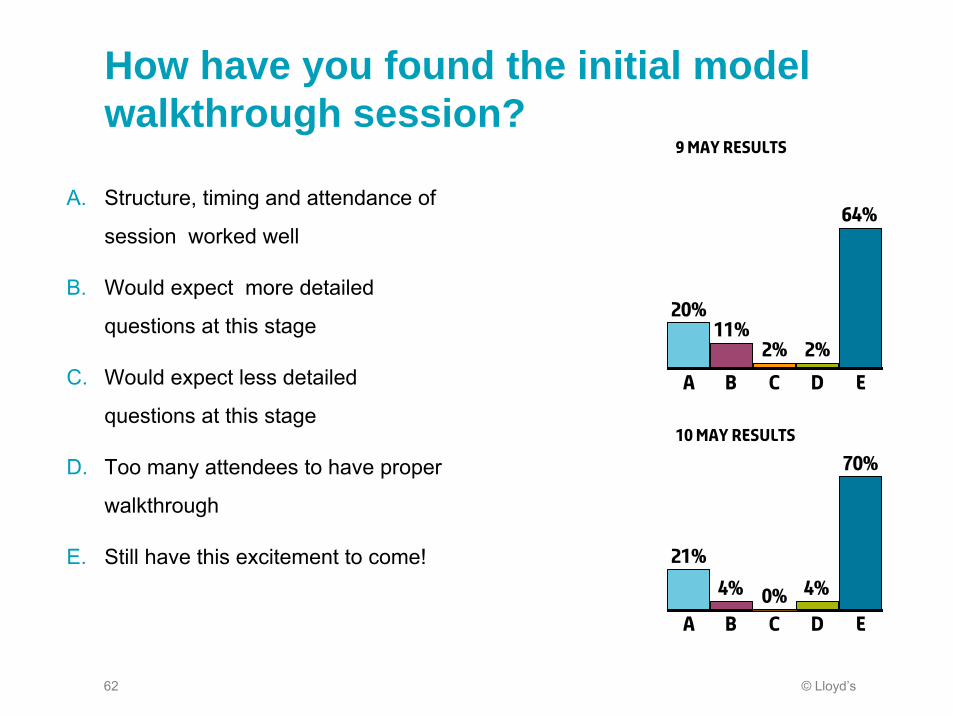
How have you found the initial model walkthrough session?
A. Structure, timing and attendance of
session worked well
B. Would expect more detailed
questions at this stage
C. Would expect less detailed
questions at this stage
D. Too many attendees to have proper
walkthrough
E. Still have this excitement to come!
9 May results
10 May results
21%
A
4%
B0%C
4%
D
70%
E
20%
A
11%
B
2%
C
2%
D
64%
E

© Lloyd’s63
Did you find model validation guidance useful?
A. Guidance is useful and provides
clarification on requirements
B. We have clear views on Lloyd’s
expectations for validation report
C. More detailed guidance was
expected
D. I haven’t had the chance to read it
yet
9 May results
10 May results
14%
A
4%
B
16%
C
65%
D
20%
A
4%
B
15%
C
61%
D

© Lloyd’s64