Embed Size (px)
Citation preview

1
SOLUTIONS TO THE UTILITY
INFORMATION PROBLEM
BY MIKE O’BOYLE
OCTOBER 2017
Prepared for 51st State perspectives on the 51st State doctrine on the "role of the utility”
INTRODUCTION
In our SEPA 51st State Concept Paper, An Adaptive Approach to Promote System Optimization,1
we articulated principles for rate design and market structure that would incent the utility and
provide price signals for distributed energy resource (DER) providers to optimize the system
around public policy goals and economic efficiency. Our approach was to ensure that regulation
itself allowed the utility and marketplace to adapt quickly and innovate to integrate new
technologies and policy goals like customer choice and clean energy. Throughout the paper, we
maintained that market structure decisions including the scope of the regulated utility monopoly
could be tailored to each state’s preferences. The scope of the monopoly is just one means to
an end to make utilities ownership-agnostic enablers of system optimization.
New technologies and power system goals demand a distribution system optimizer (DSO)
function that enables all DERs to participate on par with generation and other infrastructure in
serving customers. Whether that role should fall with existing electric distribution companies or
some other entity is unclear without more information about the optimal locations and types of
DER and how they interact dynamically with distribution infrastructure. Similarly, the boundaries
of utility ownership of DERs can’t be known without fixing underlying incentives to maximize
capital investment and devalue DERs. The difficulty untangling these functions suggests a major
role for distribution utilities, however. It’s also likely that multiple approaches are workable.
This paper focuses on pathways to reveal the information necessary to answer SEPA’s prompt
questions on the boundaries and functions of the utility monopoly. Both approaches examined
require integrated distribution planning – an analysis of DERs’ potential contribution to grid
services – to reveal latent value and flexibility on the distribution system. Having that
information and making it available to the optimizer or platform provider and third-party service
1 Available at https://sepapower.org/our-focus/51-state-initiative/phase-1/.

2
providers is a sine qua non for achieving distribution system optimization and defining the scope
of the utility’s natural monopoly functions.
The paper then examines parallel approaches. First, it explores an information-intensive
approach where utilities are asked by a DSO to reveal system needs and the DSO makes markets
for DERs and the monopoly infrastructure provider to compete. The information-intensive
approach is consistent with cost-of-service regulation (COSR), but it does not necessarily imply
COSR is the best approach. Its main downside is that it never addresses the utility’s capital bias,
maintaining the utility’s incentive to keep information from regulators. The second approach is
outcome-focused, retaining the DSO function with the distribution utility, but instead focusing
on compensating the utility for performance on key public policy goals and reducing capital bias.
This approach is more novel and holds tremendous promise, but there are risks pursuing a
relatively untested approach and with setting targets for performance with imperfect
information. These approaches are meant to sit on a spectrum, meaning neither is mutually
exclusive, and a combination of these approaches is likely needed.
THE SCOPE OF A NATURAL MONOPOLY
Electricity infrastructure can be roughly divided into four layers: generation, transmission,
distribution, and retail. To answer the questions posed by SEPA, it’s important to draw lines
where they are clear. However, each layer is currently being subjected to some form of
competition, and the scope of the monopoly is in flux in each area, making line drawing difficult
in this context. Because the results are mixed for competition elsewhere on the system, we can
equally conclude that there is no certainty for what competition would bring to the distribution
system.
For example, the bulk transmission system is subject to competition. At first glance, no potential
benefits seem to manifest from two overlapping systems of redundant infrastructure, given the
costs. But on the transmission system, competitive lines compete with utility lines that recover
their revenue through cost-based tariffs. While most transmission lines recover their costs
through regulated rates, merchant transmission lines take on the risk of investment and recover
their costs through negotiated rates. Several of these lines are able to create a viable business
model by building in valuable, congested areas.
Experience shows electricity generation is not a natural monopoly, though the jury is out on
whether restructuring, on its own, leads to lower prices or higher customer satisfaction. Even
before the proliferation of DERs, wholesale markets managed by independent system operators
(ISOs) have proven that competitive generation keeps the lights on while maintaining a similar
cost of service.2
2 For example, studies show that when PJM incorporated Midwest utilities, it immediately led to a boost in inter-regional trading, suggesting that the larger trading area allowed for more cost-effective transactions. Erin T. Mansur and Matthew W. White, “Market Organization and Efficiency in Electricity Markets,” 2012, 56.
3
Generation restructuring’s cousin, retail choice, has an even more opaque record of
performance. A recent exhaustive empirical study by Morey and Kirsch indicates that while
green choices and innovative rate designs have proliferated under retail choice, retail rates and
customer satisfaction remain largely unchanged when comparing states with retail choice to
those without.3 On the other hand, Texas has one of the most robust and unencumbered retail
competition markets, and electricity rates have fallen 15 percent since 2009 while U.S. rates
have increased 6 percent over the same time.4
The distribution system, the last miles of wires connecting substations customers, has been
historically the least subject to competition, but even that is changing. Pilots such as the
Brooklyn Queens Demand Management project indicate DERs can effectively replace or defer
not only generation, but distribution assets such as substation upgrades.5 New business models
for distributed energy resources as grid infrastructure indicate DERs are increasingly up to the
task,6 but their cost effectiveness in doing so will vary widely.
Given the breadth of issues at play and SEPA’s focus on the distribution system, this paper limits
the scope of discussion to the distribution monopoly. But an open admission underlies the
paper that without clear empirical data and more testing, we won’t know where the “natural
monopoly” boundaries lie. The complexity of subjecting generation and transmission to
competition indicates no clear answer exists even after almost two decades of experimentation.
Furthermore, there are likely multiple ways to skin the cat. We can take advantage of the
laboratory of democracy we have in the U.S. under more adaptive regulatory frameworks to
experiment and iterate in real-time to get it right. Finding states and utilities willing to generate
and test new models will be key to advancing the conversation.
That being said, two key unanswered questions underpin the rest of the paper:
1. What is the distribution utility’s role in owning, operating, and marketing distributed
energy resources like storage, efficiency, distributed generation, and demand response?7
2. Should the distribution system optimizer role be separated from ownership of
distribution assets and DERs?
3 Mathew Morey & Laurence Kirsch. Retail Choice in Electricity: What Have We Learned in 20 Years? Christensen Associates. Prepared for the Electric Markets Research Foundation. Feb. 2016.
4 U.S. Energy Information Administration Electricity Data Browser, accessed October 6, 2017.
5 See Walton, R. Straight Outta BQDM: Consolidated Edison looks to expand its non-wires approach. UtilityDive. July 19, 2017. http://www.utilitydive.com/news/straight-outta-bqdm-consolidated-edison-looks-to-expand-its-non-wires-appr/447433/.
6 See, e.g., SolarCity. A Pathway to the Distributed Grid. 2016. http://www.solarcity.com/sites/default/files/SolarCity_Distributed_Grid-021016.pdf.
7 The first issue is addressed in part with some case studies in Energy Innovation’s Addendum to our Phase 1 Concept Paper, Who should own and operate distributed energy resources? http://energyinnovation.org/wp-content/uploads/2017/09/20150824_APPSEPA_utility-ownershipDERs.pdf.

4
THE ROLE: A DISTRIBUTION SYSTEM OPTIMIZER
We know that demand-side resources are waiting to be unlocked to make electricity service
cleaner, cheaper, and more reliable – demand response, energy efficiency, storage, and
distributed solar each provide value to the system that exceeds the cost in different contexts.
But institutional factors, particularly utility business models and the regulation driving them,
stand in the way of unleashing these products to make the system cleaner, cheaper, and more
reliable. As such, defining and pursuing a role for utilities as distribution system optimizers is a
win for consumers, businesses, and the environment.
In the Adaptive Approach to Promote System Optimization, we articulated four principles of
market structure that promote the full and fair valuation of distributed energy resources:
1. Create a level playing field for competition between all resources, regardless of their type, technology, size, location, ownership and whether or how they’re regulated, allowing supply and demand resources to compete head-to-head.
2. Ensure the grid’s stability and health while incentivizing integration of cost-effective centralized and distributed resources. Allow infrastructure owners and grid operators to capture a fair portion of the value of optimizing new technologies to deliver an affordable, reliable, environmentally clean electricity system.
3. Foster innovation in energy services delivery by allowing procurement to adapt quickly to technological innovation. Allow any resource—single or aggregated—to compete to provide energy services (energy, capacity, and ancillary services).
4. Maximize the transparency of energy procurement and markets.
To make these principles real, the system needs a central coordinator that either procures
energy services on behalf of customers or creates a market for demand and supply-side
resources, while balancing and maintaining physical integrity of the distribution system in real
time. The DSO would call on available resources to meet system needs based on their costs and
physical constraints, while integrating public policy as well. The DSO would meet local demand
with a technology-agnostic, policy-mindful, reliable, low-cost combination of distributed
resources, like rooftop solar, storage, or price-responsive demand, compared against
transparent real-time prices from the bulk system and distribution and transmission
infrastructure. eah
It’s worth mentioning that this DSO role is possible without central control over the resources –
it could be enabled entirely by a platform provider that merely handles dispatch based on price
signals. This model would be closer to a transactive energy framework, enabled by what many
refer to as a distribution system platform provider. This model still accomplishes optimization,
but relies on individual agents to optimize their behavior around prices. Still, the platform would
require management, ensuring the resources that participate meet reliability standards and do
not unduly disrupt or manipulate the market.

5
Who owns what?
There are some benefits to having the same entity own the physical system and operate the
resources—it can streamline decision-making about where to expand or improve the distribution
network to dynamically accommodate cost-effective DERs and avoid unnecessary infrastructure
investments. Additionally, the brand and customer data utilities own can help identify and
connect customers to cost-effective DER providers, if utilities are properly motivated to partner
with these providers.
On the other hand, compensating the utility based on a rate of return on prudent capital
expenditures under cost-of-service regulation, while asking it to also create a neutral platform
for DERs that obviate utility infrastructure creates inherent conflicts of interest. These conflicts
are amplified when the utility can own and operate the DERs themselves. We see this playing out
at the wholesale level, even when generators have been separated from transmission owners
and grid operators, but wield significant influence over the RTOs. The generators have managed
to reward incumbency and resist accommodating changing resource mixes, state policies, and
technologies.8
In addition, disentangling the two functions is an immensely complex task, particularly in the
context of regulatory dockets. The orchestrator and build/operate functions currently reside
with distribution utilities in every state, but unlike the bulk system, distribution system
restructuring is complicated by at least five significant issues:
1. Potential value from the existing utility-customer interface and utility brand.
2. Lack of experience with non-wires alternatives, particularly how they interact dynamically
with options for managing outages and system configuration.
3. Presence of less sophisticated customers.
4. New public policy mandates, and;
5. Inexperience with price-based dispatch and system use charges on the distribution
system.
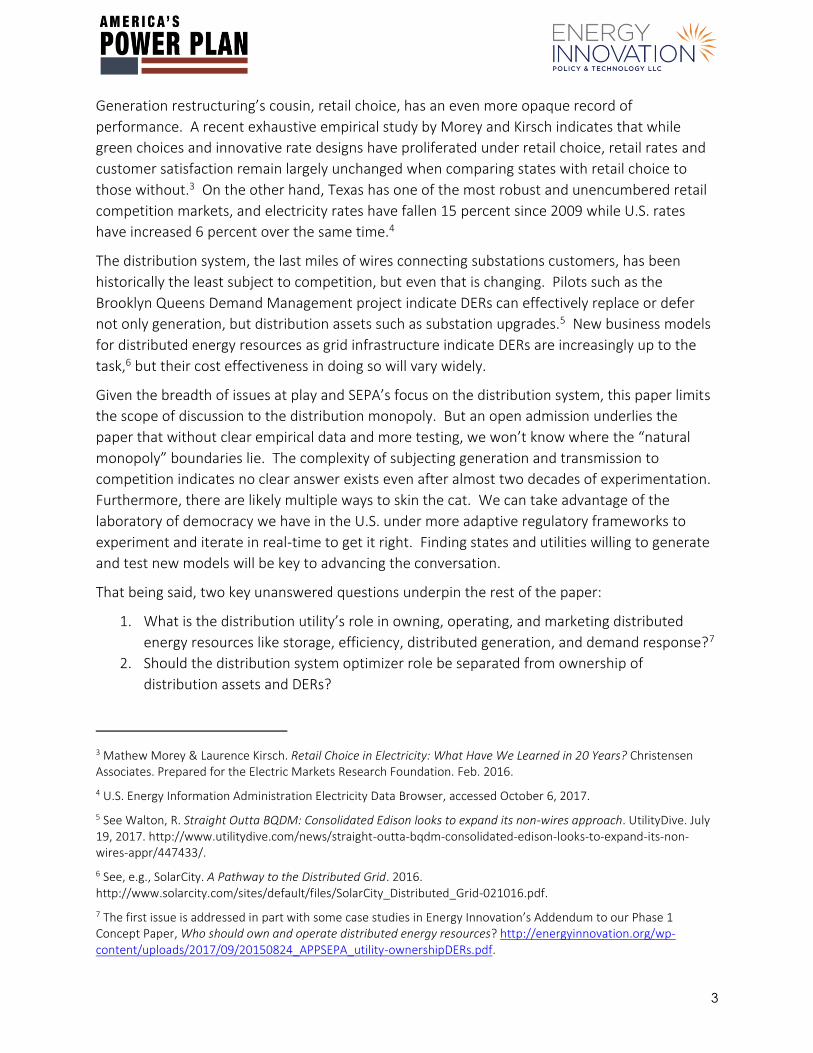
As an example of the complexity, New York’s Public Service Commission (NYPSC) created a
matrix of the functions shared by a company owning and operating distribution infrastructure,
and company coordinating resources on the distribution system. It is worth noting that the
multitude of areas where the utility and distribution system platform (DSP) functions overlap led
the NYPSC to retain the distribution utility to undertake both functions.
8 See, e.g., R. Orvis & E. Gimon. The state of wholesale power markets: What's wrong with proposed changes in Eastern RTOs? UtilityDive. June 20, 2017. http://www.utilitydive.com/news/the-state-of-wholesale-power-markets-whats-wrong-with-proposed-changes-in/445417/.
6
Source: DPS Staff Straw Proposal on Track One Issues, New York Public Service Commission, Case 14-M-0101, August
22, 2014.
The key question for utilities is how they make money as a DSO role emerges. The DSO
framework will shift the way that distribution utilities collect revenues and earn rates of return.
Rate base shrinkage from investments displaced by DERs will cut into long-term growth
prospects for incumbent utilities, but the provision of the platform provides new value to the
system, which ought to be shared between customers and the utility to motivate the animation
of DER markets. Providing these system benefits should likewise directly influence the
profitability of the DSO.
But more information is needed before we can outline a sensible framework distinguish whether
the utility should exclusively be the DSO and whether it should be able to own and operate DERs.
First, we need to know that the utility or DSO has sufficient data to identify non-wires
alternatives and the optimal mix of DERs to balance its system, particularly as the share of
variable renewables grows. Second, we need to either publicly expose this information and
7
create transparent markets to reveal the optimal mix of DERs, or we need to create incentives
for utilities to become optimizers. Today we are woefully short on answers.
THE INFORMATION PROBLEM
SEPA asks a crucial pair of questions: “Which other functions, if any, should the regulated utility
be allowed to provide under regulated, cost-of-service business models, in competition with so
called “non-regulated” third party providers?” and “Which functions, if any, should the
regulated, cost-of-service utility monopoly be prohibited in offering to utility consumers?” The
easy answer would be – whatever is in the best interest of customers and public policy. Problem
solved, right?
But the key problem that engenders such fierce debate over this topic is that utilities and third
parties still don’t know enough about how the distribution system might operate with millions of
connected devices, rapid technological change, evolving environmental imperatives, and two-
way power flows in order to maximize these goals. What’s more, distributed energy resource
management systems (DERMS) are in their infancy, and have yet to be synced up with the
transmission system at the T-D Interface. Without more information about the locational value
of DERs, how this might change dynamically, and the ability of DERs to provide infrastructure as a
service, the extent of the distribution grid’s natural monopoly will remain unknown.
Further complicating the information problem, traditional COSR rewards utilities that grow their
capital asset base and increase their sales volume. But distributed options for reducing costs,
improving customer service, and increasing reliability antagonize this business model.9 And so
any utility claim to the right answer that involves a modicum of utility ownership or prefers the
status quo to innovation is not only subject to an absolute lack of information, but a distrust of
their motivations by regulators and stakeholders. Combine this lack of information with the new
options for optimizing the power system that complicate prudency review, and COSR fails to
provide confidence in utility ratemaking.
Former California PUC Commissioner Mike Florio explained the information problem in a 2016
ruling in the Integrated Distributed Energy Resources docket:10
“One might ask: why provide the IOUs with any incentive at all? Why not just direct the
utilities to choose DERs whenever they are less costly than traditional distribution
investments? The problem is that, given the complexity of the distribution system, this
Commission is ill-equipped, at least at present, to determine with the necessary specificity
exactly when and where such DER deployment opportunities may exist. . . . Practically
9 See D. Aas & M. O’Boyle. You Get What You Pay For: Moving Toward Value in Utility Compensation, Part 2 – Regulatory Alternatives. America’s Power Plan. 2016. http://americaspowerplan.com/wp-content/uploads/2016/08/2016_Aas-OBoyle_Reg-Alternatives.pdf.
10 California Public Utilties Commission, Assigned Commisioner’s Ruling Introducing a Draft Regulatory Incentives Proposal for Discussion and Comment. R 14-10-003. April 4, 2016. http://docs.cpuc.ca.gov/PublishedDocs/Efile/G000/M159/K702/159702148.PDF.
8
speaking, command-and-control regulation faces major challenges in this context.
Instead, if our objectives are to be achieved, we should create the appropriate utility
incentives, such that the IOUs will affirmatively seek opportunities to deploy DERs in the
pursuit of their own shareholders’ interests.”
As such, defining a pathway to obtaining this information is a crucial first step toward achieving a
new definition of the natural monopoly. The next section focuses on pathways to obtaining
information about the optimal mix of DERs, as a foundation to deciding the market structure that
best achieves economic efficiency and public policy goals.
Know that the utility knows: Integrated distribution planning
Right now, distribution utilities don’t even know enough about their distribution systems to
properly value and plan around distributed energy resources. According to the SEPA and Black &
Veatch report:
“The growth of DERs is challenging many of the assumptions upon which traditional
distribution planning relies. DERs are creating two-way power flows on the distribution
system that legacy distribution equipment was not designed for. DERs are also
confounding conventional load forecast methodologies and complicating the modeling of
distribution feeders by introducing new kinds of generation sources or modifying load
profiles.”
Recent conversations among utility and industry stakeholders at the Utility Business Models
Pathways pod at Rocky Mountain Institute’s eLab Summit have confirmed this lack of system
visibility and understanding.
To obtain this information, distribution utilities should engage in integrated distribution planning
(IDP), a practice in which demand-side and distribution-level investments are considered in
conjunction with bulk-system resources to achieve an optimized, integrated system.11 This
includes understanding the potential contribution from DERs, by first conducting a general
assessment (and ideally a locational assessment) of a cost-effective portfolio of resources.
Of course, IDP is a large undertaking and doesn’t have to be all-or-nothing. Some pieces of
information are more relevant in less mature markets. More than Smart has created a “walk-
jog-run framework to IDP that lines up with market development, allowing utilities and
stakeholders to prioritize.12 In addition, SEPA released a summary of best practices.13
11 For a definition of IDP, see Electric Power Research Institute, The Integrated Grid, accessed January 26, 2016, http://integratedgrid.com/; SolarCity, “Integrated Distribution Planning,” 2015.
12 See “More Than Smart,” Greentech Leadership Group, August 2014. See also ICF International, Integrated Distribution Planning. Prepared for the Minnesota Public Utilities Commission. August 2016.
13 For examples and best practices, see Coleman, Amy et al., “Planning the Distributed Energy Future: Emerging Electric Utility Distribution Planning Practices for Distributed Energy Resources”, Smart Electric Power Alliance, 2016.

9
Once IDP is complete, it produces useful data to help align utility incentives and reveal market
information. Data about what efficiency, reliability, and environmental goals are possible
through better integration of demand-side resources provides a rational basis for regulators and
stakeholders to measure and set targets for utility performance. Locational value data indicates
what performance characteristics would be needed to rely on DERs as infrastructure-grade
service providers, laying the foundation for long-term contracts and real-time pricing, enabling
greater competition and price transparency on the distribution system. Smart customer-facing
rate design, DER procurement, and technology deployment can then be used to improve overall
environmental and economic performance, regardless of the market structure.
CREATING BUSINESS MODELS FOR THE DSO
Once the utility demonstrates its knowledge of where DERs can be most valuable, additional
work is required to ensure utility incentives align with system optimization. Two parallel paths
can lead to a DSO role – an information-intensive approach and an outcome-focused approach.
The information-intensive approach is compatible with COSR and separation of the optimization
& ownership functions. The outcome-focused approach represents a new regulatory compact
that seeks to shift the role of existing distribution utilities into drivers of low-cost, reliable service
that achieves public policy. These are ends of a spectrum, and some combination of both is
likely the best path forward.
Information-intensive approach
DERs provide a stack of benefits including transmission, generation and distribution capacity
deferral, as well as societal benefits and operational efficiencies including greater reliability. IDP
reveals these values, allowing a neutral DSO to define services and create markets for the
distribution utility, third-party providers, and customers to provide grid services. A well-
functioning distribution-level market would maximize net benefits to consumers by ensuring
regulators, stakeholders and system planners have adequate information to determine the
combination of centralized investment and DER deployment is in the public interest.
A data- or information-intensive approach demands utilities accumulate and process customer
usage data in conjunction with location-based assessments of infrastructure needs. This is no
small task for businesses built under the safe assumption traditional distribution infrastructure
investment was always the most economical solution to reliability concerns.
The California Public Utility Commission’s (CPUC) distributed resource planning (DRP)
proceeding14 demonstrates the heavy lifting required to acquire this information through an
information-intensive approach to utility planning and regulatory review, even without
disentangling the system operator role from the utility itself. In response to the CPUC’s 2016
See also Bode, Josh et al., “Addressing the Locational Valuation Challenge for Distributed Energy Resources,” Solar Electric Power Alliance in partnership with Nexant, September 2016.
14 http://www.cpuc.ca.gov/General.aspx?id=5071

10
DRP roadmap straw proposal, the state’s investor-owned utilities indicated they needed upward
of five years to accumulate data and complete demonstration projects to accurately compare
DER investments against distribution infrastructure investments, although some stakeholders
disputed this timeline.15
In its 2016 Distributed Energy Resources Action Plan,16 the CPUC gave a clear sense of the sheer
scope of the undertaking, which would last into 2020:
If the CPUC approves the utility proposals, which have since moved into the rate case phase,
demonstration projects and the multitude of parallel proceedings would occur in conjunction
with $5-6 billion in proposed grid modernization investment, approximately half of which is
driven by investments to collect and process locational data. While significant evidence suggests
some data could be acquired more cheaply from non-utility sources,17 the scale of investment
requested by utilities and the regulatory back-and-forth suggests significant financial and
regulatory costs to enabling, among other things, comparison of DERs and centralized
investment.
However, to move to a model that separates the distribution utility and DSO function, and
independent DSO (IDSO), even more will need to be done. Once sufficient information is known
about the most valuable locations for DER deployment, the IDSO will be tasked with developing
an algorithm to optimize procurement and dispatch of DERs within public policy constraints such
as reliability standards, low-income service, and environmental goals. This will be significantly
more complicated than security-constrained economic dispatch on the bulk system, with many
more connected devices behaving in new ways and responding to different signals.
Engaging in a comprehensive effort to reveal the locational and time-varying value of providing
energy, capacity, and other services at the distribution level will be necessary to enable DERs to
15 http://docs.cpuc.ca.gov/PublishedDocs/Efile/G000/M156/K128/156128642.PDF
16http://www.cpuc.ca.gov/uploadedFiles/CPUC_Public_Website/Content/About_Us/Organization/Commissioners/Michael_J._Picker/2016-09-26%20DER%20Action%20Plan%20FINAL3.pdf
17 http://www.solarcity.com/sites/default/files/SolarCity_Distributed_Grid-021016.pdf

11
efficiently compete against utility infrastructure. Though it is a significant lift, it creates a level
playing field that can enable significant efficiency within the constraints of public policy goals.
Outcome-focused approach
On the outcome-focused side of the spectrum, regulators can prioritize creating utility incentives
to pursue the most efficient system optimization solutions without relying so heavily on a line-
by-line review. Performance-based regulation ties utility shareholders’ returns on equity
investments to achieving outcomes.18, 19 If calibrated correctly, utilities’ primary avenue for
increasing the value of their company no longer lies in capital investment -- it lies in system
optimization.
In this scenario, the regulatory role shifts to defining system goals and calibrating incentives to
elicit desired utility behavior. This starts with defining outcomes for system optimization, figuring
out what combination of transparent metrics can track utility performance fairly, and defining
reasonable targets (e.g., peak demand reduction) for performance.20 This alone requires
significant regulatory resources.
But even goals, metrics, and targets may be insufficient. Focusing on outcomes can help
regulators and stakeholders overcome information asymmetry and hold utilities accountable,
but measurement alone does not correct inherent problems with COSR, namely that DER
investments, partnering with third-parties, and other non-wires alternatives antagonize utility
profit maximization. Utilities and other stakeholders eager to embrace a DER future where
utilities drive the transition can consider performance-based regulation (PBR).
PBR is an umbrella term that encompasses a variety of regulatory mechanisms to motivate
performance against a number of different outcomes.21 Tools to promote affordability and
reduce capital bias and the throughput incentive include multi-year rate plans, revenue caps,
price caps, and revenue decoupling. Other un-monetized goals for the power sector are
incorporated into the PBR framework as targeted financial incentives that offer combinations of
upsides and downsides based on performance in areas of concern like customer service,
environmental performance, or reliability.
18 For a list of resources on performance-based regulation, visit http://energyinnovation.org/resources/our-publications/going-deep-performance-based-regulation/.
19 See D. Littell et al. Next-Generation Performance-Based Regulation: Emphasizing Utility Performance to Unleash Power Sector Innovation. Regulatory Assistance Project & National Renewable Energy Laboratory. September 2017.
20 For a detailed outline of this approach and relevant case studies, see Whited et al., Utility Performance Incentive Mechanisms: A Handbook for Regulators, 2015. http://www.synapse-energy.com/sites/default/files/Utility%20Performance%20Incentive%20Mechanisms%2014-098_0.pdf.
21 These tools are described at length in D. Aas & M. O’Boyle, You Get What You Pay For: Moving Toward Value in Utility Regulation, Part 2 – Regulatory Alternatives. June 2016. http://americaspowerplan.com/wp-content/uploads/2016/08/2016_Aas-OBoyle_Reg-Alternatives.pdf.

12
Two key questions must be answered when comparing this outcome-focused approach to the
information-intensive approach: how much do we pay for these outcomes, and what design
elements can help ensure success and minimize risk?
Paying for performance
Evidence suggests utilities may be motivated to consider DER alternatives even with a relatively
small amount of revenue at stake. Recent research surveyed utility financial analysts to
determine that a 10 percent improvement (e.g. increasing from 10 percent to 11percent) of the
utility’s earned return on equity should be at stake in order to grab the attention of investors.22
As additional anecdotal evidence, the paper also cites FERC’s increase in ROE for transmission
that is 10-20 points above the average regulated ROE for distribution utilities, which has resulted
in a marked increase in transmission investment.23
In Beyond Carrots: A National Review of Performance Incentives for Energy Efficiency,24 the
American Council for an Energy Efficient Economy (ACEEE) conducts an exhaustive case study of
energy efficiency (EE) PIMs, and provides insights into the relationship between incentive
amounts and performance. ACEEE’s data suggest well-designed efficiency performance
incentives can be effective motivators even when they are in the range of 0.1-1 percent of total
revenue.
Other states have experimented with PBR, but those experiments are still in the early days,
making it hard to tell whether the performance incentives have been impactful. Still it is worth
noting that utilities in these states have been willing participants in shaping the scope of
incentives, and most utilities have been able to achieve regulatory performance targets and
increase their returns for shareholders:
State Incentive size & status
Illinois 50 basis point adjustment to return on rate-base.25 Downside-only incentives for reliability and customer service as part of the formula-based ratemaking enacted in 2013.
22 P. Kind & D. Lewin. Lower Spending Higher Returns. Dec. 2016.
23 It’s worth noting that while the transmission ROE adder was cited as successful at motivating additional transmission development, it was criticized by Synapse in its Performance-based Regulation Handbook for poor policy design, particularly on cost containment. See Whited et al., Utility Performance Incentive Mechanisms: A Handbook for Regulators, 2015. http://www.synapse-energy.com/sites/default/files/Utility%20Performance%20Incentive%20Mechanisms%2014-098_0.pdf.
24 http://aceee.org/sites/default/files/publications/researchreports/u1504.pdf
25 See Ameren Illinois Company Modernization Action Plan: Multi-Year Performance Metrics 2016 Annual Report & Commonwealth Edison Company’s Multi-Year Performance Metrics Annual Report for the Year Ending December 31, 2015. Accessed via https://www.icc.illinois.gov/electricity/utilityreporting/InfrastructureInvestmentPlans.aspx

13
Massachusetts Maximum penalties of 2.5 percent of utility revenue requirement.26 Fully implemented.
New York 90-110 basis points of upside-only incentives based on achievement of system efficiency, market animation, and customer service outcomes.27 Cost of non-wires alternatives may also be included into rate base. Some have been approved, while others are currently under consideration.
United Kingdom
250 basis points adjustment on return on equity using symmetrical incentives based on a series of performance metrics. A higher baseline ROE is available for companies that submit well-justified business plans. Additional incentives available for reducing expenses against a revenue cap (200 basis points symmetrical). 28
California Cost of DER alternative receives 4 percent rate of return. Pilot phase.
These revenue adjustments range from a high-end of 450 basis points of symmetrical incentives
(900 basis points at stake) in the United Kingdom down to a mere 50 basis point one-sided
adjustment to return on equity in Illinois. The three jurisdictions with performance records
(Massachusetts, Illinois, and the U.K.) indicate the performance incentives have had their
intended effects. Utilities in each of the jurisdictions have routinely met or exceeded their goals,
with some limited exceptions, and each plans to continue the PBR approach. Those companies
falling short were penalized, better simulating competitive pressure.
Potential pitfalls of performance-based regulation
However, none of the programs was designed perfectly, and each had some unintended
consequences undermining the claim that PBR aligns utility incentives with public policy goals.
Illinois’ Ameren and ComEd were able to meet most of their performance targets for 2013-2015,
but the relatively lax baselines cast doubt into to whether the targets have been effective
motivators.29 In another case, a baseline set with only one anomalous year of data made
26 See Order Adopting New Service Quality Guidelines, D.P.U. 12-120-D, December 18, 2015. http://web1.env.state.ma.us/DPU/FileRoomAPI/api/Attachments/Get/?path=12-120%2f12120D_Order_121815.pdf
27 See, e.g., Consolidated Edison Joint Settlement Proposal. Matter No. 16-00253/16-E-0060, Proceeding on Motion of the Commission as to the Rates, Charges, Rules and Regulations of Consolidated Edison Company of New York, Inc. for Electric Service. Filed September 19, 2016. Pp 77-81.
28 See generally: https://www.ofgem.gov.uk/sites/default/files/docs/2013/02/riioed1decoutputsincentives_0.pdf
29 See Ameren Illinois Company Modernization Action Plan: Multi-Year Performance Metrics 2016 Annual Report & Commonwealth Edison Company’s Multi-Year Performance Metrics Annual Report for the Year Ending December 31, 2015. Accessed via https://www.icc.illinois.gov/electricity/utilityreporting/InfrastructureInvestmentPlans.aspx.

14
compliance virtually impossible.30 Still, the compliance reports make it clear the PIMs have
helped to focus utility operations toward meeting these targets, particularly as they increase in
stringency over time.31
In the U.K., setting the right revenue cap was very challenging in a world of growing
uncertainties. Though the total expenditures (totex) revenue cap model creates clear incentives
to choose cheaper DER options over capital expenditures, utilities received large profits not
necessarily due to their own efficiency, but rather outside factors such as economic depression.
Thankfully, Ofgem designed the cap to share gains or losses between utilities and customers, but
still, over the last few years, it is possible the utilities earned more than efficient business
practices would have yielded alone under better-calibrated revenue caps.32
Experience so far suggests that revenue caps with totex and carefully calibrated outcome-based
performance incentives can drive innovation, stabilize or improve utility profitability, and focus
utility attention on the outcomes customers most want. For example, in the first performance
year of the U.K.’s PBR scheme, many distribution utilities beat forecasts for customer bills,
exceeded most of their performance targets, and achieved returns on equity averaging just over
nine percent – 300 basis points more than their estimated six percent cost of equity. Beyond
performance numbers, anecdotal evidence also suggests that utilities have shifted their focus
toward performance under PBR. There is no indication that Ofgem and other U.K. utilities will
move away from this regulatory structure after testing it over the last four years.
CONCLUSION
As DERs get cheaper, the conflict between COSR and potential contribution of demand-side
resources is becoming clearer, blurring previously established boundaries of the electric
distribution utility’s natural monopoly. But before we can make unequivocal claims as to how
that monopoly has shifted, we need more information. First, we must be sure that utilities
indeed possess the knowledge needed to optimize their distribution systems. IDP is an emerging
tool to obtain this information, laying the foundation for more fundamental changes to the utility
business model toward distribution system optimization.
As the DSO role becomes possible, the next question becomes how to regulate the DSO and
ensure it achieves its purpose. This question can be pursued simultaneously, and need not wait
for IDP to be complete. The first path is an information-intensive approach to transforming the
30 For example, the ComEd has missed its Service Reliability target by at least 3x in 2013-2015, and over 10x in 2013. Commonwealth Edison Company’s Multi-Year Performance Metrics Annual Report for the Year Ending December 31, 2015, at 14-15.
31 See the performance reports above.
32 Ofgem. Open letter on the RIIO-2 Framework. July 12, 2017. https://www.ofgem.gov.uk/system/files/docs/2017/07/open_letter_on_the_riio2_framework_12_july_final_version.pdf

15
utility business model, which creates regulation-driven processes for quantifying and sharing
distribution system needs with third parties, contracting with DERs as system resources, and
valuing un-monetized policy goals such as reduced pollution and reliability to interact with those
markets. This path is consistent with COSR, and is well suited to separating the DSO model from
the poles and wires monopoly.
The second path is outcome-focused. Under this model, the DSO is not regulated using cost-of-
service, but rather by adjusting its earnings based on performance against key outcomes. In
particular, the utility will be rewarded financially for choosing cheaper non-wires alternatives,
and will be encouraged to maximize public policy outcomes such as environmental performance,
customer service, and reliability. It is worth noting these two approaches are on a spectrum, and
are not mutually exclusive.
And so the answer to SEPA’s original questions about the scope of the natural monopoly
remains, “it depends.” Without undertaking IDP and adjusting utility regulation to accommodate
new business models, we cannot know that the utility is empowered as a distribution system
optimizer. Once a DSO role becomes fleshed out, and the optimal mix of DERs and a modernized
grid become knowable, the boundaries of the utility’s natural monopoly will become clearer. But
there will be more than one way to achieve the DSO. Utilities and stakeholders’ priority should
be testing DSO models and iterating, taking an adaptive approach to promote system
optimization.