Embed Size (px)
Citation preview
www.SandV.com6 SOUND & VIBRATION/NOVEMBER 2009
A washing machine has more potential noise sources compared to other large household appliances. This is due in part to the presence of complex dynamic assemblies and subsystems confined to fit within a tight design space. Due to varied governmental stan-dards worldwide, increased washing machine design complexity, and the need for faster product development cycle and time to market, it is essential to develop a more systematic methodology to address noise issues. This article focuses on a product-neutral, solutions-based approach to mitigate overall sound power level (as tested per IEC60704 guidelines) of a front-loaded washer-cum-dryer machine. A six-sigma based methodology has been used to identify root causes through a combination of sound pressure level (SPL) and vibration level tests in conjunction with statisti-cal energy analysis (SEA) modeling. A brief review of different materials (dampers/absorbers) to effectively mitigate noise levels is also presented.
Noise levels in household appliances are attracting attention from manufacturers because of increased legislation and discerning customers. Appliance manufacturers are favoring use of brushless direct-current (BLDC) motors for refrigerator and air-conditioner compressors as well as circulation fan applications because of higher efficiency, high power density, low weight and cost com-pared to AC induction motors or variable-speed drives. However, they are disadvantageous from a noise and vibration perspective. In an earlier work,1 a practical approach for identifying the source of excessive noise in the small-fan motor system for household refrigerators was outlined. Using a combination of finite-element modal analysis and experimental torsion excitation tests, the noise generated by the cogging torque of BLDC was characterized for making appropriate changes to designs. Numerical and modal test techniques have been frequently employed in concept phase for understanding the dynamic compatibility (to assess the resonance with other vibrating parts) between the frame structure and its holding elements.2 An attempt has also been made to employ a combination of finite-element and multibody dynamics (MBD) for determining the resonant vibration modes and transient structural response to capture dynamic behavior of the entire machine in its early design stage.3 This was then coupled with indirect boundary-element models for performing sound field analysis to study the effects of sound-absorbing cotton fleece mats of various thicknesses surrounding the washing machine.
In previous work,4 a hybrid approach – combining numerical techniques and experimental methods – was developed to address floor-pan vibration and the resulting radiated noise in an auto-motive vehicle. This methodology was successfully adapted for reducing the overall noise level in a standard top-loading washing machine.5 A combination of several different techniques, ranging from sound pressure level measurements to a combination of mobility tests and finite-element-based modal frequency response analysis was utilized to identify all potential noise and vibration sources in the washing machine and develop an optimized sound abatement solution package. Currently, front-load washing ma-chines are gaining popularity because of several unique benefits over top-loading machines. They are energy efficient (less water and detergent use; faster spin, resulting in quicker drying), have higher load capacity (absence of bulky agitator), improved clothes wear-tear (gentler tumble action vs. agitator beating action) and quieter (compared to conventional vertical-axis washers). Addi-tionally, in Europe and the Far-East, a combination washer-dryer
has been popular – with only one chamber for clothes (not stack-able washer/dryers). These combination washer-dryers are either vented or non-vented. While vented combination units expel air through a vent, non-vented units have a two-drum system. The hot air is forced into the outer drum, where a condensation process is used to cool the air and condense the water vapor out of it. The water is then flushed out the drain hose to the sink or plumbing lines. Therefore, the non-vented combination unit may be easily installed under a cabinet or a closet, or wherever water and elec-tricity connections are available.
This article details a six-sigma approach for identifying root cause and addressing high noise emissions from a front-load washer-cum-dryer (W/D) machine during normal operating con-ditions. The non-vented, front-load W/D combo unit is about 850 mm high ¥ 595 mm wide ¥ 590 mm deep and has three different operational modes – wash, spin and dry cycle. The primary objec-tives of this work are to: 1. Characterize the “noise” emission (source/level) of the com-
bination unit in all three operational modes as per IEC60704 standards.
2. Identify the root cause of the highest radiated noise level (from Step 1).
3. Test potential material/design options for addressing noise reduction initiatives.
4. Develop product-neutral solution portfolio options (perfor-mance/mass/cost).Details of the IEC 60704-based test methodology for quantifying
the noise contribution of a washing machine in all three opera-tional modes are described. A high-level overview of the six-sigma DMAIC (define, measure, analyze, improve, and control) process is provided. Using a combination of several different techniques, ranging from sound pressure measurements to acceleration based response and SEA approach, implementing these concepts for ef-fective noise mitigation is also illustrated. Based on a wide array of available material options, such as PU polyurethane foams (ab-sorbers), thermoplastic barriers and epoxy-based damper solutions, relative merits (in terms of performance/mass/cost) of different design solution options (either stand alone or in combination) is also discussed. This systematic approach not only assists in quickly identifying a root cause but also provides a framework for evaluating all solution options for sound abatement.
Theory and Experimental Set-UpExperimental evaluations were completed to measure the
overall sound power radiated from the washer-cum-dryer. These measurements were made according to the IEC 60704 standard for measuring airborne noise from household electrical appliances.6 To collect the sound pressure level measurements from only the washing machine, the test was performed inside a semi-anechoic room. Electrical power and water to the machine was piped into the room and control measures were taken to ensure that noise from the water flow was not influencing the test. Furthermore, measurements were collected to ensure that the source noise is at least 15 dB greater than the background noise. Since the main objective of the test was to compute the overall sound power level,
Solutions-Based Approach for Reducing Noise in Washing MachinesDev Barpanda and Jay M. Tudor, The Dow Chemical Company, Midland, Michigan
Based on a paper presented at IMAC XXVII, the 27th International Modal Analysis Conference, Orlando, FL, February, 2009.
NomenclatureLP Sound pressure level (dB re 20 μPa)LI Sound intensity (dB re 10-12 W/m2)LW Sound power level (dB re 10-12 W)K r0c0/400Si Area of each segment (m2)
www.SandV.com SOUND & VIBRATION/NOVEMBER 2009 7
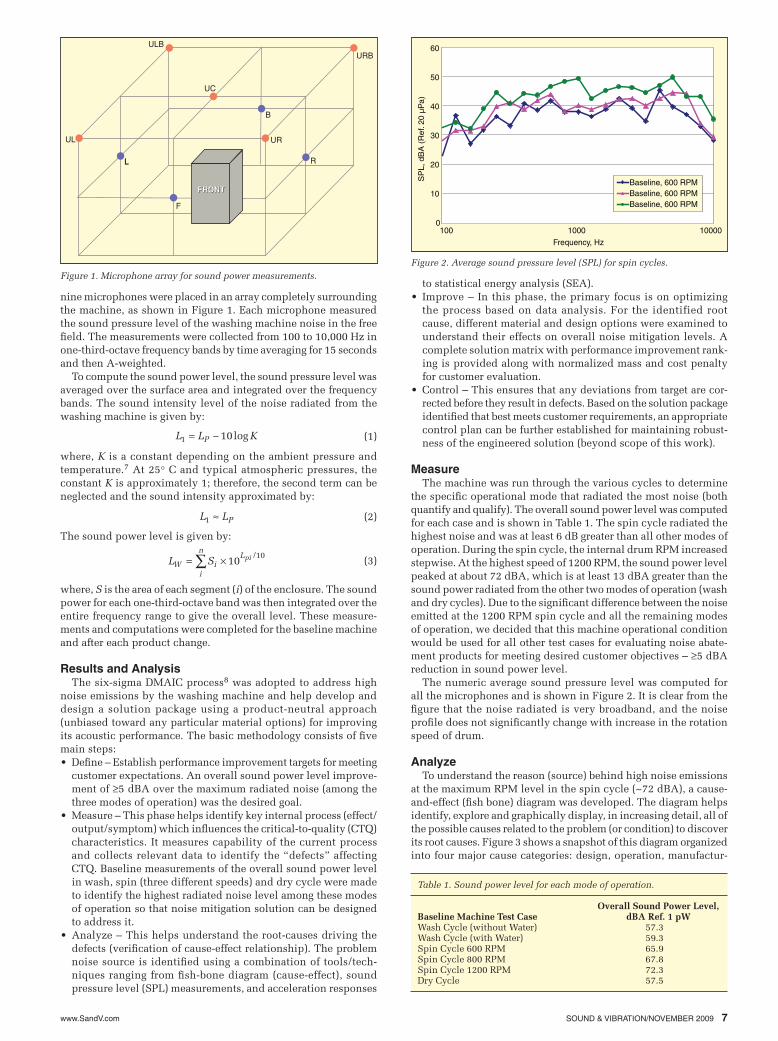
nine microphones were placed in an array completely surrounding the machine, as shown in Figure 1. Each microphone measured the sound pressure level of the washing machine noise in the free field. The measurements were collected from 100 to 10,000 Hz in one-third-octave frequency bands by time averaging for 15 seconds and then A-weighted.
To compute the sound power level, the sound pressure level was averaged over the surface area and integrated over the frequency bands. The sound intensity level of the noise radiated from the washing machine is given by:
where, K is a constant depending on the ambient pressure and temperature.7 At 25° C and typical atmospheric pressures, the constant K is approximately 1; therefore, the second term can be neglected and the sound intensity approximated by:
The sound power level is given by:
where, S is the area of each segment (i) of the enclosure. The sound power for each one-third-octave band was then integrated over the entire frequency range to give the overall level. These measure-ments and computations were completed for the baseline machine and after each product change.
Results and AnalysisThe six-sigma DMAIC process8 was adopted to address high
noise emissions by the washing machine and help develop and design a solution package using a product-neutral approach (unbiased toward any particular material options) for improving its acoustic performance. The basic methodology consists of five main steps:
Define – Establish performance improvement targets for meeting •customer expectations. An overall sound power level improve-ment of ≥5 dBA over the maximum radiated noise (among the three modes of operation) was the desired goal.Measure – This phase helps identify key internal process (effect/•output/symptom) which influences the critical-to-quality (CTQ) characteristics. It measures capability of the current process and collects relevant data to identify the “defects” affecting CTQ. Baseline measurements of the overall sound power level in wash, spin (three different speeds) and dry cycle were made to identify the highest radiated noise level among these modes of operation so that noise mitigation solution can be designed to address it.Analyze – This helps understand the root-causes driving the •defects (verification of cause-effect relationship). The problem noise source is identified using a combination of tools/tech-niques ranging from fish-bone diagram (cause-effect), sound pressure level (SPL) measurements, and acceleration responses
to statistical energy analysis (SEA).Improve – In this phase, the primary focus is on optimizing •the process based on data analysis. For the identified root cause, different material and design options were examined to understand their effects on overall noise mitigation levels. A complete solution matrix with performance improvement rank-ing is provided along with normalized mass and cost penalty for customer evaluation.Control – This ensures that any deviations from target are cor-•rected before they result in defects. Based on the solution package identified that best meets customer requirements, an appropriate control plan can be further established for maintaining robust-ness of the engineered solution (beyond scope of this work).
MeasureThe machine was run through the various cycles to determine
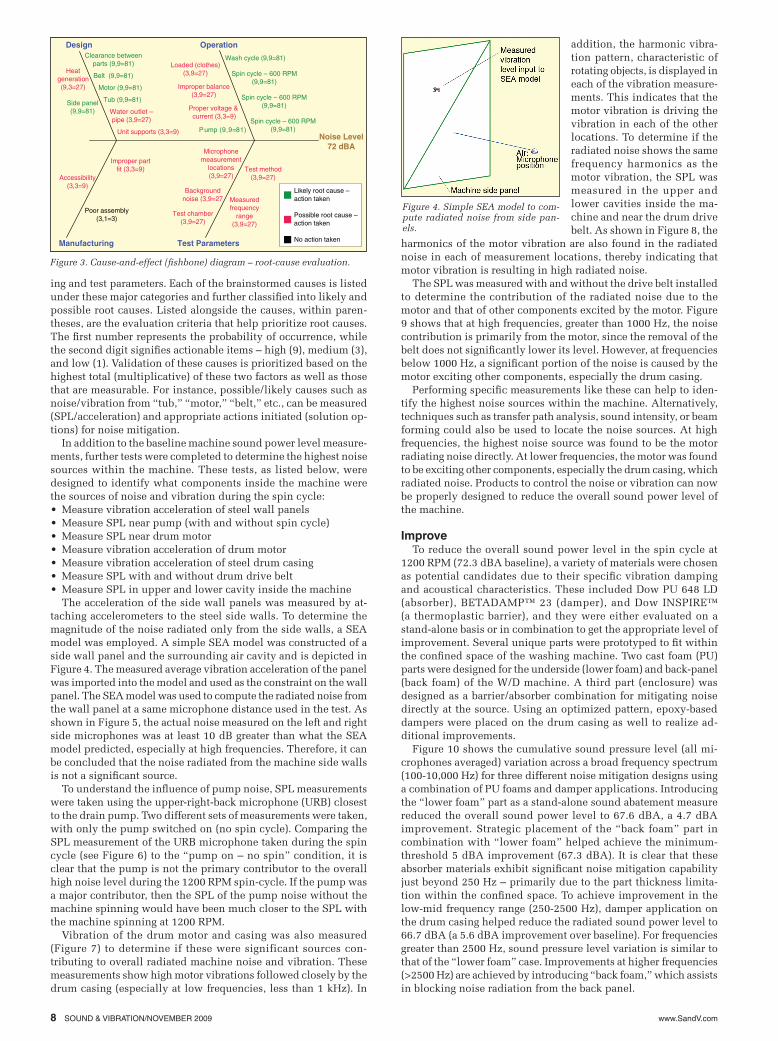
the specific operational mode that radiated the most noise (both quantify and qualify). The overall sound power level was computed for each case and is shown in Table 1. The spin cycle radiated the highest noise and was at least 6 dB greater than all other modes of operation. During the spin cycle, the internal drum RPM increased stepwise. At the highest speed of 1200 RPM, the sound power level peaked at about 72 dBA, which is at least 13 dBA greater than the sound power radiated from the other two modes of operation (wash and dry cycles). Due to the significant difference between the noise emitted at the 1200 RPM spin cycle and all the remaining modes of operation, we decided that this machine operational condition would be used for all other test cases for evaluating noise abate-ment products for meeting desired customer objectives – ≥5 dBA reduction in sound power level.
The numeric average sound pressure level was computed for all the microphones and is shown in Figure 2. It is clear from the figure that the noise radiated is very broadband, and the noise profile does not significantly change with increase in the rotation speed of drum.
AnalyzeTo understand the reason (source) behind high noise emissions
at the maximum RPM level in the spin cycle (~72 dBA), a cause-and-effect (fish bone) diagram was developed. The diagram helps identify, explore and graphically display, in increasing detail, all of the possible causes related to the problem (or condition) to discover its root causes. Figure 3 shows a snapshot of this diagram organized into four major cause categories: design, operation, manufactur-
1 10logPL L K= - (1)
(2)1 PL Lª
(3)/10
10 pin
LW i
i
L S= ¥Â
Figure 1. Microphone array for sound power measurements.
ULB
UC
URB
B
R
UR
L
UL
F
L
FRONTFRONT
Table 1. Sound power level for each mode of operation.
Overall Sound Power Level,Baseline Machine Test Case dBA Ref. 1 pWWash Cycle (without Water) 57.3Wash Cycle (with Water) 59.3Spin Cycle 600 RPM 65.9Spin Cycle 800 RPM 67.8Spin Cycle 1200 RPM 72.3Dry Cycle 57.5
Figure 2. Average sound pressure level (SPL) for spin cycles.
0
10
20
30
40
50
60
100 1000 10000
Frequency, Hz
SP
L, d
BA
(R
ef. 2
0 µP
a)
Baseline, 600 RPMBaseline, 600 RPMBaseline, 600 RPM
www.SandV.com8 SOUND & VIBRATION/NOVEMBER 2009
ing and test parameters. Each of the brainstormed causes is listed under these major categories and further classified into likely and possible root causes. Listed alongside the causes, within paren-theses, are the evaluation criteria that help prioritize root causes. The first number represents the probability of occurrence, while the second digit signifies actionable items – high (9), medium (3), and low (1). Validation of these causes is prioritized based on the highest total (multiplicative) of these two factors as well as those that are measurable. For instance, possible/likely causes such as noise/vibration from “tub,” “motor,” “belt,” etc., can be measured (SPL/acceleration) and appropriate actions initiated (solution op-tions) for noise mitigation.
In addition to the baseline machine sound power level measure-ments, further tests were completed to determine the highest noise sources within the machine. These tests, as listed below, were designed to identify what components inside the machine were the sources of noise and vibration during the spin cycle:
Measure vibration acceleration of steel wall panels•Measure SPL near pump (with and without spin cycle)•Measure SPL near drum motor•Measure vibration acceleration of drum motor•Measure vibration acceleration of steel drum casing•Measure SPL with and without drum drive belt•Measure SPL in upper and lower cavity inside the machine•The acceleration of the side wall panels was measured by at-
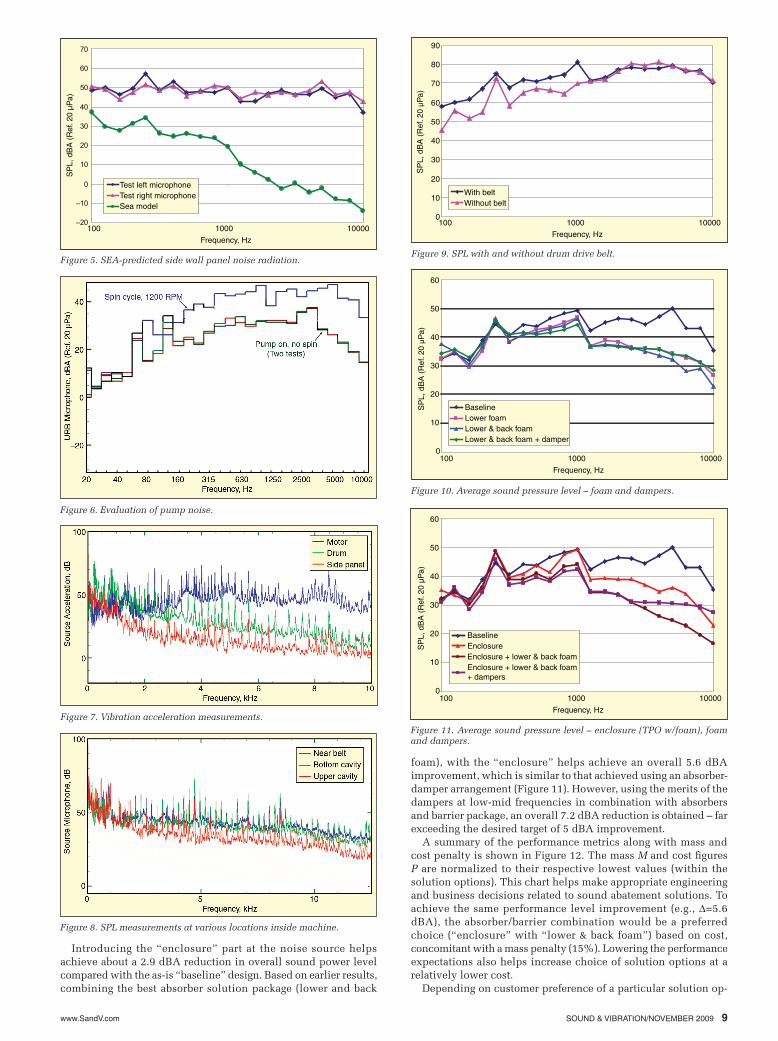
taching accelerometers to the steel side walls. To determine the magnitude of the noise radiated only from the side walls, a SEA model was employed. A simple SEA model was constructed of a side wall panel and the surrounding air cavity and is depicted in Figure 4. The measured average vibration acceleration of the panel was imported into the model and used as the constraint on the wall panel. The SEA model was used to compute the radiated noise from the wall panel at a same microphone distance used in the test. As shown in Figure 5, the actual noise measured on the left and right side microphones was at least 10 dB greater than what the SEA model predicted, especially at high frequencies. Therefore, it can be concluded that the noise radiated from the machine side walls is not a significant source.
To understand the influence of pump noise, SPL measurements were taken using the upper-right-back microphone (URB) closest to the drain pump. Two different sets of measurements were taken, with only the pump switched on (no spin cycle). Comparing the SPL measurement of the URB microphone taken during the spin cycle (see Figure 6) to the “pump on – no spin” condition, it is clear that the pump is not the primary contributor to the overall high noise level during the 1200 RPM spin-cycle. If the pump was a major contributor, then the SPL of the pump noise without the machine spinning would have been much closer to the SPL with the machine spinning at 1200 RPM.
Vibration of the drum motor and casing was also measured (Figure 7) to determine if these were significant sources con-tributing to overall radiated machine noise and vibration. These measurements show high motor vibrations followed closely by the drum casing (especially at low frequencies, less than 1 kHz). In
addition, the harmonic vibra-tion pattern, characteristic of rotating objects, is displayed in each of the vibration measure-ments. This indicates that the motor vibration is driving the vibration in each of the other locations. To determine if the radiated noise shows the same frequency harmonics as the motor vibration, the SPL was measured in the upper and lower cavities inside the ma-chine and near the drum drive belt. As shown in Figure 8, the
harmonics of the motor vibration are also found in the radiated noise in each of measurement locations, thereby indicating that motor vibration is resulting in high radiated noise.
The SPL was measured with and without the drive belt installed to determine the contribution of the radiated noise due to the motor and that of other components excited by the motor. Figure 9 shows that at high frequencies, greater than 1000 Hz, the noise contribution is primarily from the motor, since the removal of the belt does not significantly lower its level. However, at frequencies below 1000 Hz, a significant portion of the noise is caused by the motor exciting other components, especially the drum casing.
Performing specific measurements like these can help to iden-tify the highest noise sources within the machine. Alternatively, techniques such as transfer path analysis, sound intensity, or beam forming could also be used to locate the noise sources. At high frequencies, the highest noise source was found to be the motor radiating noise directly. At lower frequencies, the motor was found to be exciting other components, especially the drum casing, which radiated noise. Products to control the noise or vibration can now be properly designed to reduce the overall sound power level of the machine.
ImproveTo reduce the overall sound power level in the spin cycle at
1200 RPM (72.3 dBA baseline), a variety of materials were chosen as potential candidates due to their specific vibration damping and acoustical characteristics. These included Dow PU 648 LD (absorber), BETADAMP™ 23 (damper), and Dow INSPIRE™ (a thermoplastic barrier), and they were either evaluated on a stand-alone basis or in combination to get the appropriate level of improvement. Several unique parts were prototyped to fit within the confined space of the washing machine. Two cast foam (PU) parts were designed for the underside (lower foam) and back-panel (back foam) of the W/D machine. A third part (enclosure) was designed as a barrier/absorber combination for mitigating noise directly at the source. Using an optimized pattern, epoxy-based dampers were placed on the drum casing as well to realize ad-ditional improvements.
Figure 10 shows the cumulative sound pressure level (all mi-crophones averaged) variation across a broad frequency spectrum (100-10,000 Hz) for three different noise mitigation designs using a combination of PU foams and damper applications. Introducing the “lower foam” part as a stand-alone sound abatement measure reduced the overall sound power level to 67.6 dBA, a 4.7 dBA improvement. Strategic placement of the “back foam” part in combination with “lower foam” helped achieve the minimum-threshold 5 dBA improvement (67.3 dBA). It is clear that these absorber materials exhibit significant noise mitigation capability just beyond 250 Hz – primarily due to the part thickness limita-tion within the confined space. To achieve improvement in the low-mid frequency range (250-2500 Hz), damper application on the drum casing helped reduce the radiated sound power level to 66.7 dBA (a 5.6 dBA improvement over baseline). For frequencies greater than 2500 Hz, sound pressure level variation is similar to that of the “lower foam” case. Improvements at higher frequencies (>2500 Hz) are achieved by introducing “back foam,” which assists in blocking noise radiation from the back panel.
Figure 3. Cause-and-effect (fishbone) diagram – root-cause evaluation.
Operation
Belt (9,9=81)
Motor (9,9=81)
Tub (9,9=81)
Water outlet –pipe (3,9=27)
Wash cycle (9,9=81)
Spin cycle – 600 RPM(9,9=81)
Microphonemeasurement
locations(3,9=27)
Poor assembly(3,1=3)
Design
Unit supports (3,3=9)
Clearance betweenparts (9,9=81)
Heatgeneration(9,3=27)
Accessibility(3,3=9)
Loaded (clothes)(3,9=27)
Improper partfit (3,3=9)
Improper balance(3,9=27)
Proper voltage & current (3,3=9)
Side panel(9,9=81)
Pump (9,9=81)
Manufacturing Test Parameters
Spin cycle – 600 RPM(9,9=81)
Spin cycle – 600 RPM(9,9=81)
Backgroundnoise (3,9=27
Test chamber(3,9=27)
Test method(3,9=27)
Measuredfrequency
range(3,9=27)
Noise Level72 dBA
Likely root cause – action taken
Possible root cause –action taken
No action taken
Figure 4. Simple SEA model to com-pute radiated noise from side pan-els.
www.SandV.com SOUND & VIBRATION/NOVEMBER 2009 9
Figure 5. SEA-predicted side wall panel noise radiation.
SP
L, d
BA
(R
ef. 2
0 µP
a)
–20
–10
0
10
20
30
40
50
60
70
Test left microphoneTest right microphoneSea model
100 1000 10000
Frequency, Hz
Figure 6. Evaluation of pump noise.
Figure 7. Vibration acceleration measurements.
Figure 8. SPL measurements at various locations inside machine.
Figure 9. SPL with and without drum drive belt.
0
10
20
30
40
50
60
70
80
90
SP
L, d
BA
(R
ef. 2
0 µP
a)
With beltWithout belt
100 1000 10000
Frequency, Hz
Figure 10. Average sound pressure level – foam and dampers.
0
10
20
30
40
50
60
100 1000 10000
Frequency, Hz
SP
L, d
BA
(R
ef. 2
0 µP
a)
BaselineLower foamLower & back foamLower & back foam + damper
Figure 11. Average sound pressure level – enclosure (TPO w/foam), foam and dampers.
0
10
20
30
40
50
60
100 1000 10000
Frequency, Hz
SP
L, d
BA
(R
ef. 2
0 µP
a)
BaselineEnclosureEnclosure + lower & back foamEnclosure + lower & back foam+ dampers
Introducing the “enclosure” part at the noise source helps achieve about a 2.9 dBA reduction in overall sound power level compared with the as-is “baseline” design. Based on earlier results, combining the best absorber solution package (lower and back
foam), with the “enclosure” helps achieve an overall 5.6 dBA improvement, which is similar to that achieved using an absorber-damper arrangement (Figure 11). However, using the merits of the dampers at low-mid frequencies in combination with absorbers and barrier package, an overall 7.2 dBA reduction is obtained – far exceeding the desired target of 5 dBA improvement.
A summary of the performance metrics along with mass and cost penalty is shown in Figure 12. The mass M and cost figures P are normalized to their respective lowest values (within the solution options). This chart helps make appropriate engineering and business decisions related to sound abatement solutions. To achieve the same performance level improvement (e.g., D=5.6 dBA), the absorber/barrier combination would be a preferred choice (“enclosure” with “lower & back foam”) based on cost, concomitant with a mass penalty (15%). Lowering the performance expectations also helps increase choice of solution options at a relatively lower cost.
Depending on customer preference of a particular solution op-
www.SandV.com10 SOUND & VIBRATION/NOVEMBER 2009
Figure 12. Comparison of sound abatement solutions – performance, mass and cost.
Baseline Lower Lower Lower Enclosure Enclosure Enclosure Foam & Back & Back + Lower + Lower Foam Foam+ & Back & Back Dampers Foam Foam
63
64
65
66
67
68
69
70
71
72
73O
vera
ll S
ound
Pow
er L
evel
, dB
(R
ef. 1
pW
)Sound poweraccording toIEC 60704
Integrated from100 - 10,000 Hz
∆=4.7M=1.1P=2.6
∆=4.7M=1.1P=2.6
∆=5.0M=1.3P=3.0
∆=5.0M=1.3P=3.0
∆=5.6M=2.0P=4.8
∆=5.6M=2.0P=4.8
∆=2.9M=1.0P=1.0
∆=5.6M=2.3P=4.0
∆=7.2M=3.0P=5.8
tion, focused efforts can then be directed in the final phase (control) to ensure that improved performance is maintained over the long term (discussion of which is not within the scope of this work).
ConclusionsFor the front-loaded, nonvented, washer-cum-dryer machine, a
six-sigma based DMAIC approach was effectively implemented to discover the root cause of high noise emissions and develop poten-tial noise abatement solutions. Radiated noise was measured as per IEC guidelines to compare and rank sound power level emissions in all operational modes, with the 1200-RPM spin cycle identified as the worst performer.
Using a team-based philosophy, a fishbone diagram was success-fully developed to identify and prioritize all potential causes that merit investigation. Several different test techniques in combina-tion with SEA modeling were employed to successfully identify The author can be reached at: [email protected].
the primary noise contributor as the motor while eliminating all other possible causes. Based on available choices from a broad material portfolio of absorbers, barriers and dampers, a product-neutral approach was adopted to develop the most effective noise mitigation package.
Through a combination of these engineered solutions, noise level reductions of up to 7.2 dBA were achieved, far exceeding the performance target level of 5 dBA improvement. These product-neutral solution options assist in making judicious decisions based on a cost-benefit analysis. Although, the focus of this work was to address the noise path rather than source modification, DMAIC methodology can also be extended for possible motor design modi-fications. Techniques such as transfer-path analysis can be effectively employed to identify contributions from specific motor components (bearings, rotor, etc.) and help develop possible solutions.
References1. Kim, Y.-H., Yang, B.-S., and Kim, C.-J., “Noise Source Identification of
Small Fan-BLDC Motor System for Refrigerators,” International Journal of Rotating Machinery, Article ID 63214, Volume 2006, Hindawi Publishing Corp.
2. Sergio, A., Duarte, J., Relvas, C., Moreira, R., Freire, R., Ferreira, J.L, Si-moes, J.A., “The Design of Washing Machine Prototype,” Materials and Design, pp. 331-338, Volume 24, Elsevier Science Ltd, 2003.
3. LMS Virtual.Lab Acoustics, “Cleaning Out Noise Early in Design at Miele,” LMS Application Notes.
4. Siavoshani, S. J., Tudor, J. M., Barpanda, D., “Vehicle Body Optimization of Structural Noise and Vibration Using a Hybrid Techniques,” SAE Noise and Vibration, 2007-01-2372, May 15-17, St Charles, IL, Elsevier Science Ltd, 2003.
5. Barpanda, D., Tudor, J. M., and Siavoshani, S. J., “An Engineering Ap-proach to Noise Abatement in Washing Machines,” Paper Number 334, NOISE-CON, Oct 22-24, Reno, NV, 2007.
6. IEC 60704-2-10 Ed. 1.0 b:2004, Household and Similar Electrical Appli-ances – Test Code for the Determination of Airborne Acoustical Noise.
7. Beranek, L. and Ver, I., Noise and Vibration Control Engineering, Wiley Interscience, p. 83, 1992.
8. Dow Six-Sigma Green Belt Project Leader Curriculum, The Dow Chemical Company, 2005.


![EU Funding supporting nature-based solution projects in EU · NATURE-BASED SOLUTIONS Nature-Based Solutions (NBS) [the innovative approach] Nature-based solutions to societal challenges](https://img.pdfslide.us/doc/110x75/5ec64217195a893c9034edef/eu-funding-supporting-nature-based-solution-projects-in-eu-nature-based-solutions.jpg)