Embed Size (px)
Citation preview
l'erg,mon Acta metall, mater. Vol. 42, No. 6, pp. 1959-1972, 1994
Copyright © 1994 Elsevier Science Ltd 0956-7151(93)E0089-L Printed in Great Britain. All rights reserved
0956-7151/94 $7.00 + 0.00
SOLUTE-ATOM SEGREGATION AT (002) TWIST BOUNDARIES IN DILUTE Ni-Pt ALLOYS:
STRUCTURAL/CHEMICAL RELATIONS
D. UDLER and D. N. SEIDMAN Department of Materials Science and Engineering and Materials Research Center,
R. R. McCormick School of Engineering and Applied Science, Northwestern University, Evanston, IL 60208-3108, U.S.A.
(Received 13 October 1993)
Abstract--Monte Carlo simulations, utilizing embedded atom method (EAM) potentials, are used to investigate solute-atom segregation behavior at symmetrical (002) twist boundaries, at T = 850 K, in Pt-3 at.% Ni and Ni-3 at.% Pt alloys. The results show that, unlike the previously investigated Au-Pt system, the boundaries are enhanced in solute atoms on both sides of the phase diagram. For low-angle boundaries on the Pt-rich side the atomic sites enhanced in solute concentration are arranged in hourglass-like structures centered on the square grid of primary grain boundary dislocations. While for the same boundaries on the Ni-rich side the atomic sites enhanced in solute concentration are located in bipyramidal regions based on the square cells of the same grain boundary dislocations. Thus, the atomic sites that are enhanced on one side of the phase diagram are not affected on the other side and vice versa.
Rrsumr---Nous avons utilis~ les simulations Monte Carlo fi potentiels de la m&hode atome fi enchfiss6 (MEA) pour &udier les srgrrgations d'atomes, T = 850 K, fi joints de torsion (002) symmrtriques dans les alliages Pt-3 at.% Ni et Ni-3 at,% Pt. Les r&ultats montrent que, diff~remment du cas du syst~me Au-Pt, les joints de grains sont enrichis des deux crt~s du diagramme de phase. Pour les angles bas de joints de torsion du crt~ riche en Pt, les sites atomiques enrichis en dissous forment des structures sabliers centrres sur le r&eau quadrill6 des dislocations de joints primaires. Dans l'alliage Ni-3 at.% Pt, les sites atomiques enrichis en dissous forment des structures bipyramidales sur le rrseau quadrill6 des mSmes dislocations. Cela signifie que les sites enrichis en dissous d'un cots du diagramme de phase ne sont pas atteints de l'autre crt6 et vice versa.
1. INTRODUCTION
The phenomenon of solute-atom segregation at grain boundaries is generally recognized to be of great theoretical and practical importance [1-5]. In spite of, however, numerous experimental, theoretical and simulation studies our basic knowledge about it is still rather fragmentary. This is a result of the enormous complexity of the multi-dimensional phase space in which this phenomenon occurs. This phase space has 6 + C dimensions for a single-phase alloy, where C is the number of chemical components in the alloy. Besides the conventional state var iables-- tempera- ture, pressure and compos i t ion- - the five macroscopic geometrical degrees of freedom of a grain boundary are postulated to be thermodynamic state variables [6]. The three so-called microscopic degrees of free- dom, that is, the rigid body translation vector be- tween two grains, are assumed to be fully relaxed to minimize the Gibbs free energy of a bicrystal. In our previous papers we investigated solute-atom segre- gation at (002) symmetrical twist boundaries in dilute
tThere is also some evidence for the existence of a Pt3Ni phase [12].
1959
A u - P t alloys [7-9], and reported preliminary results for similar boundaries in dilute N i -P t alloys [10, 11].
In this paper we present an expanded account detailing the important features of solute-atom segre- gation in the Ni -P t system, focusing primarily on low-angle (002) symmetrical twist boundaries. The N i -P t system is of particular interest for several reasons:
1. It exhibits a clear tendency to ordering with two ordered phases (NiPt and Ni 3 Pt t ) in the bulk phase diagram; this is in sharp contrast to the A u - P t system which exhibits a misci- bility gap.
2. There is a considerable size misfit between the two elements in contradistinction to the elements Au and Pt; the room temperature values of the lattice parameters are 0.352 and 0.392 nm for Ni and Pt, respectively, while for Au it is 0.408 nm. The values of the fractional change of the lattice parameter (a) with the concentration of solute [Ea=a-I(da/dc)] for dilute alloys are -0 .085 and 0.132 for the Pt(Ni) and Ni(Pt) systems, while for the Au(Pt) and Pt(Au)
1960 UDLER and SEIDMAN: SOLUTE-ATOM SEGREGATION
systems they are -0 .044 and 0.0352 respect- ively [13]. The calculated values of the in- homogeneity factor [Eg=p- l (d#/dc)] for Pt(Ni) and Ni(Pt), where the shear moduli (p) are rather close, are clearly small---0.21 and -0 .21 . For Au(Pt) and Pt(Au), where the shear moduli differ by a factor of two1", the values of E~ are much larger-4).79 a n d - 0 . 7 3 respectively.
3. Oscillatory solute-atom segregation profiles are observed in Ni-Pt alloys near different free surfaces [15], and at a mixed ~ = 5 twist-tilt boundary [16]; similar behavior at an (002) twist boundary, with an expla- nation, is reported in the present paper.
All the simulations are performed at a temperature, T = 850 K, that is high enough to be reproduced experimentally (in terms of diffusion times) but low enough to observe substantial solute-atom segre- gation effects. The solute-atom concentrations on both sides of the phase diagram were chosen to lie in single-phase solid-solution regions. The solute-atom concentrations are high enough to give adequate statistics but the alloys can still be considered to be dilute.
The main questions of concern in this paper are:
• What is the structural dependence of so- lute-atom segregation?; that is, the dependence of the Gibbsian interfacial excess of solute on the twist angle of the boundaries.
• What is the detailed spatial arrangement of solute atoms at a grain boundary as a function of twist angle for low-angle boundaries?
• How is the solute-atom segregation behav- ior related to the thermodynamic properties of the alloy system?
2. COMPUTATIONAL PROCEDURES
The computational methodology employed is Monte Carlo simulation, which is well suited for atomistic simulations of equilibrium phenomena in solids [17, 18]. We utilize the fundamental algorithm of Metropolis et aL [19] as it provides a reasonably good convergence to equilibrium and efficient sampling of the equilibrium configurational space. The choice of the statistical ensemble was dictated by the necessity to simulate a grain boundary in a single-phase solid solution that is in equilibrium with a quasi-infinite reservoir of solute atoms in a bulk reference crystal. The most suitable approach for this situation is the so-called transmutational ensemble. It is essentially an offspring of the grand canonical ensemble, where the parameters held constant are temperature, the total number of atoms and the difference in the so-called excess chemical potentials
tThe shear moduli (,u) of Au, Pt and Ni (in units of 10 ~2 dyne/cm 2) are 0.281, 0.622, and 0.765 [14].
[20]. Atoms are, however, allowed to change their chemical identities, so that the atomic fraction of each component is variable. In addition, the volume of the simulation cell is allowed to relax, thereby maintain- ing constant pressure boundary conditions.
At each Monte Carlo step an atom is chosen at random. Then the following sequence of attempts is performed:
1. The chemical identity of an atom is changed; this step is for modifying the local composition of an alloy, and it is basic to the phenomenon of solute- atom segregation.
2. The displacement of an atom from its position by a random vector with a magnitude smaller than 0.01 nm; this step allows for relaxations on an atomic scale. Note well that steps 1 and 2 are made simul- taneously.
3. After, on the average, all the atoms in a bicrystal have undergone the above two attempts an overall volume relaxation is implemented that involves a change in one or more periodic lengths, and a corresponding rescaling of coordinates of all the atoms in the bicrystal by a small random quantity. This procedure changes the volume of the compu- tational cell to maintain the bicrystal at constant pressure.
4. A relative translation of the two grains in the plane of the interface by a random vector is at- tempted with the same time periodicity as step 3. It allows complete relaxation of all microscopic degrees of freedom of the boundary. No significant displace- ments from the coincident site lattice (CSL) structure were, however, observed for the low-angle bound- aries.
The decision, whether or not a certain attempt is accepted--that is, whether a transition should be made from an old state to a new one--is based on the value of Ap (the ratio of probabilities of the two states)
Ap =Pnew (I) Pold
where the probability p of accepting a change is given by
p = e x p [ - Eto t - #aNa - l tbNb)/kB T] (2)
where Etot is the total internal energy, Na and Nb are the number of atoms of type a and b, tq and #b are their chemical potentials, and kB T has its usual significance. The actual probability of occurrence is this probability divided by a partition function; the latter is not used because we need only Ap. If Ap/> 1 the attempt is accepted, while if Ap < 1 the new configuration is accepted with the probability Ap.
The total value of the internal energy Etot is calcu- lated using the embedded atom method (EAM) potentials that have been developed for six face- centered cubic elements (Ag, Au, Cu, Ni, Pd and Pt). The EAM potentials are empirical many-body
UDLER and SEIDMAN: SOLUTE-ATOM SEGREGATION 1961
continuous potentials that have been used extensively for studying different physical problems in materials science [4, 17, 20-28].
Prior to simulations for grain boundaries, similar simulations are run for a perfect single crystal (4000 atoms) to determine the value of A/~--the difference in the excess chemical potentials - - corre- sponding to the requisite value of solute-atom con- centration. The equilibrium lattice constants for given concentrations are also obtained from those runs (104 Monte Carlo steps per atom).
The computational cell represents a bicrystal with three-dimensional periodic boundary conditions. The two grains are rotated about an [001] direction to obtain a given twist angle; hence, only one of the five macroscopic geometric degrees of freedom is varied. Physically, there are two crystallographically identi- cal GBs separating the two grains. This arrangement is valuable because it eliminates the free surface, and improves the statistics by having two GBs in a given bicrystal. Also a sufficiently large separation is necess- ary between the two GBs to exclude the interaction of the stress fields of the two GBs in the middle of the bicrystal, where it is necessary to maintain the prop- erties of the bulk single crystal. We find empirically that commencing with 16 (002) planes between the two interfaces this condition is met for the lowest- angle boundary-- tha t is, the one having the longest range elastic stress fields--we investigated. Normally in our Monte Carlo simulations we use a compu- tational cell that is approximately (4 to 5) nm × (4 to 5) nm in the plane of the interface--this corresponds to between 200 to 300 atoms in one atomic plane--- and is about 6.3 nm in the direction normal to the (002) GB plane. Thus, the overall number of atoms in the system varies between 6400 and 9600. The first 2.5 × 10³ Monte Carlo steps per atom of each run were used for equilibration. The averaging was per- formed over the next 3 × 10³ or 104 Monte Carlo steps per atom, depending on the boundary. The time step for averaging was of the order of 10 Monte Carlo steps per atom to avoid temporal correlation effects.
Another important effect is the surface tension of a GB that acts in the plane of an interface to reduce its cross-sectional area. This effect causes stresses that cannot relax locally--due to the periodicity in the plane of the interface--so that the entire bicrystal has to accommodate these stresses. In our case the stresses are accommodated by means of a lattice expansion normal to the GB plane. The magnitude of the effect is approximately proportional to the frac- tion of the total system volume belonging to the GB phase; that is, essentially the inverse of the distance between the two grain boundaries in our bicrystals. The typical "thickness" of a GB is approximately one to two atomic planes. Thus in a normal polycrys- talline specimen this effect most likely does not exist; it may, however, exist in nanograined material. In a MC simulation this effect may be quite large if a
bicrystal is too small. A straightforward but compu- tationally inefficient solution is to increase the separ- ation between the GB planes. We employ an alternative solution, where the total area of the inter- face is held constant at a given equilibrium value; the latter is determined by the equilibrium value of the lattice parameter found from simulation runs for a single crystal. Thus, only the periodic length normal to the interface is allowed to relax. We have demon- strated that either employing much larger bicrystals-- 40 (002) planes between the grain boundaries--or fixing the cross-sectional dimensions of an interface yields the same quantitative results.
The bicrystal employed is one where the [001] direction is perpendicular to the plane of the (002) interface plane; the geometric interface lies between two (002) planes and it contains no atoms. All possible (002) twist boundaries lie in the angular range 0 = 0°-45 ° about the [001] direction; the point group for this interface is 4 mm. Of the five macro- scopic geometric degees of freedom only 0 is varied. The angular values studied correspond to the follow- ing CSL boundaries: 5 ° (E = 265), 10.4 ° (Z = 61), 16.3 ° (E =25), 22.6 ° (~z= 13), 28.1 ° ( E = 17), 33.9 ° (E=289) , 36.9 ° ( E = 5 ) , 41.1 ° ( E = 7 3 ) and 43.6 ° (E = 29). The choice of CSL boundaries is not restric- tive, because the boundaries cover the entire range of possible misorientations.
The atomic structures of the (002) grain boundaries have been extensively studied experimentally by X- ray diffraction techniques [29-32], geometrically by the packing of hard spheres [33], anisotropic elasticity theory [34], lattice statics [35-38], molecular dynam- ics [31, 39] and free-energy minimization [40-44] techniques.
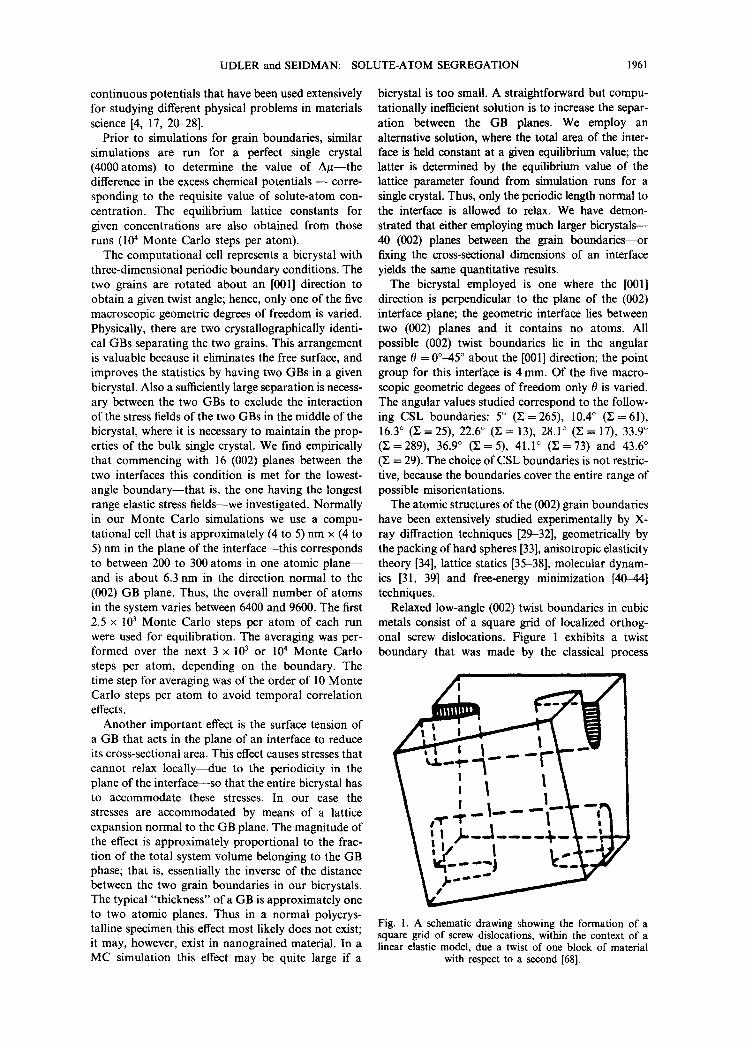
Relaxed low-angle (002) twist boundaries in cubic metals consist of a square grid of localized orthog- onal screw dislocations. Figure 1 exhibits a twist boundary that was made by the classical process
i ! , l I I I _ . . . . - .
. . ,p . . - I "=" ' " | # ' 9 " - - .
) . _ . 1 . . . . 4 - -
. . . . J , : -
Fig. 1. A schematic drawing showing the formation of a square grid of screw dislocations, within the context of a linear elastic model, due a twist of one block of material
with respect to a second [68].
1962 UDLER and SEIDMAN: SOLUTE-ATOM SEGREGATION
of cutting and slipping an elastic solid in such a manner as to produce two orthogonal sets of screw dislocations of opposite handedness. The resulting twist boundary is in a state of pure shear with no long range stress fields [45, 46]. This description appears to be an excellent one for twist boundaries in metals [47]. The screw dislocations are the so-called primary grain boundary dislocations (PGBDs) whose Burgers vectors (b) are ( a /2 ) ( l l0 ) - type (a is the lattice parameter) in the face-centered cubic lattice. The spacing of tbe grid is given by the Read-Shockley relation
Ibl a/v~2 d = 2 sin(0/2) - 2 sin(0/2)" (3)
The deviation from an exact CSL orientation pro- duces a grid of secondary grain boundary dislo- cations (SGBDs) with the spacing given by the same Read-Shockley relation, with 0 replaced by IA01; where A0 is the deviation angle measured from an exact CSL orientation [48]. The intersections of the PGBD lines form patches of the ]g = 5 structure. The localization of the misfit falls off with the distance from the interface, and the dislocation cores become broader and less pronounced. At sufficiently large angles (0 I> 22.6 °) the areas of the regions of "good" atomic fit become comparable to those of the inter- secting regions, and more complicated high-angle twist boundaries appear that can be described by a structural unit model [38, 49]. The atomic displace- ments within the square cells of the PGBDs are rotations around the elements of Bollmann's O-lattice.
For (002) twist boundaries only symmetrical struc- tures exist. A displacement, however, of the upper grain with respect to the lower grain--parallel to the plane of the interface--may lead to a change of the symmetry of the boundary. For twist boundaries crystallographically nonequivalent displacements of the two grains are limited to the cell bounded by the two shortest nonparallel displacement shift complete (DSC) vectors, b 1 and b2, in the boundary plane. It has been shown, by means of molecular statics at 0 K, for a ~ = 5 twist boundary in pure Ni or Cu [35] that the only displacements leading to stable structures are (1/2)b I or (1/2)b2and (1/2)[b I + bd; these structures are denoted type I and type II. Recently, a free-energy minimization study, in the local-harmonic approximation [40], revealed a phase transition from the CSL to type I structure in a ~ = 5 high-angle twist boundary in gold at about 315 K. In our previous papers [7, 8] Monte Carlo simulations were performed for the type I and type II as well as the CSL E = 5 high-angle bound- aries in a Pt-1 at.% Au alloy at 850 K. The type I structure reverted to the CSL structure and the type II structure remained metastable. There were, how- ever, no significant differences between the solute- atom segregation profiles of the type II and CSL structures.
3. SOLUTE-ATOM SEGREGATION BEHAVIOR
The Gibbsian interracial excess (F~olute) is the most general measure of solute-atom segregation--it ap- plies to any solid/solid interface. By definition an interfacial excess of any extensive quantity is defined as the excess of this quantity over the bulk value [50]. For GBs we define Fsolute in terms of dimensionless units of solute monolayers by
r~ojute = ~ (c~- c0) (4) i = 1
where np~ is the number of (002) planes in the bicrystal and c~ and Co are average solute-atom concentrations, in units of atomic fraction, in plane i and in the bulk of the bicrystal respectively.
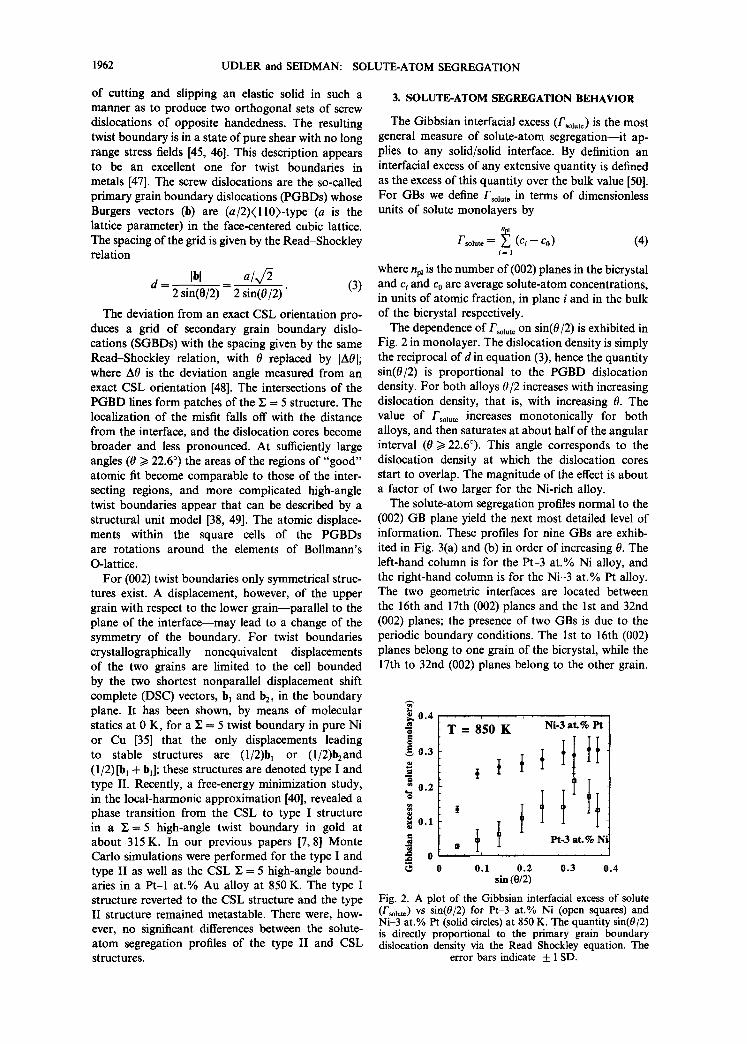
The dependence of Fso~ute on sin(0/2) is exhibited in Fig. 2 in monolayer. The dislocation density is simply the reciprocal of d in equation (3), hence the quantity sin(0/2) is proportional to the PGBD dislocation density. For both alloys 0/2 increases with increasing dislocation density, that is, with increasing 0. The value of Fso~t~ increases monotonically for both alloys, and then saturates at about half of the angular interval (0 1> 22.6°). This angle corresponds to the dislocation density at which the dislocation cores start to overlap. The magnitude of the effect is about a factor of two larger for the Ni-rich alloy.
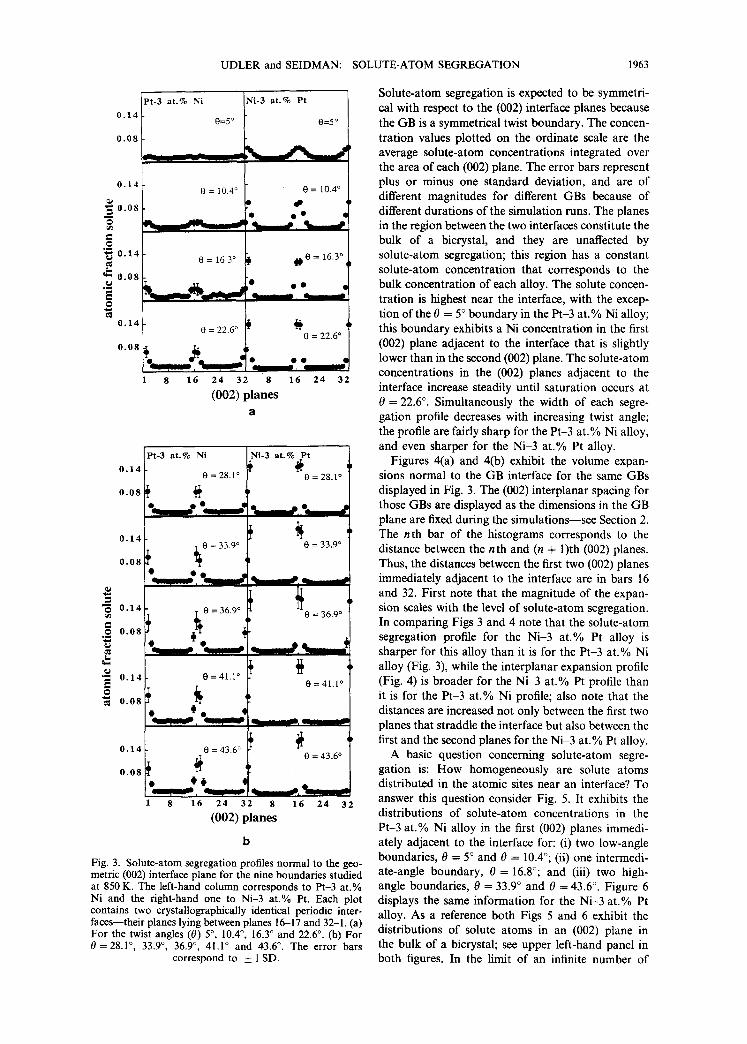
The solute-atom segregation profiles normal to the (002) GB plane yield the next most detailed level of information. These profiles for nine GBs are exhib- ited in Fig. 3(a) and (b) in order of increasing 0. The left-hand column is for the Pt-3 at.% Ni alloy, and the right-hand column is for the Ni-3 at.% Pt alloy. The two geometric interfaces are located between the 16th and 17th (002) planes and the 1st and 32nd (002) planes; the presence of two GBs is due to the periodic boundary conditions. The 1st to 16th (002) planes belong to one grain of the bicrystal, while the 17th to 32nd (002) planes belong to the other grain.
~, 0.4 _u | g 0.3
o ~ 0.2
~ 0.1
"~ 0
T = 8 5 0 K
i
0.1 0 .2 0 .3 sin (0/2)
Ni-3 at.% Pt
Pt.3 at. % N
0.4
Fig. 2. A plot of the Gibbsian interfacial excess of solute (Fsolute) vs sin(0/2) for Pt-3 at.% Ni (open squares) and Ni-3 at.% Pt (solid circles) at 850 K. The quantity sin(0/2) is directly proportional to the primary grain boundary dislocation density via the Read-Shockley equation. The
error bars indicate + 1 SD.
UDLER and SEIDMAN: SOLUTE-ATOM SEGREGATION 1963
0 . 1 4
0 . 0 8
0 . 1 4
' ~ 0 . 0 8
~ o.14
& o.o8 e~ . ~
P t - 3 a t . % Ni
0=5 °
N i - 3 a t . % P t
0= 5 o
0 = 10.4 ° D
i
0 = 16.3 °
,O
i
0.14 e = 22.6 ° [~
0.08~._ _ , ? ' ° "
1 8 1 6 2 4 3 2 8
(002) planes a
J i
0 = I 0 . 4 °
o • •
i
0110 = 16.3 °
o o •
0 = 22 .6 ~
QO • ii
1 6 2 4 3 2
P t - 3 a t . % Ni
0 . 1 4 0 = 28.1 °
0 . 0 8
i i
0 . 1 4
0 . 0 8 ~ ~ 0 = 33"9°
• _ _OO__ J a L r a
J
* ~ • 0 " 1 4 0 . 0 8 ~ 0 = 3 6 " 9 °
"~ 0 . 1 4 0 = 4 1 . 1 °
0.08 , e _ * . - - -qL
i i i
O. 1 4 0 = 43.6 °
0.0.
8 1 6 2 4 3 2 8
(002) planes
b
Ni-3 a t . % P t
0 = 28.1 °
J ~ J i
0 = 33 .9 °
0 = 36 .9 °
i l k ~]
0 = 4 1 . 1 °
0 = 43 .6 °
~.m@-
1 6 2 4 3 2
Fig. 3. Solute-atom segregation profiles normal to the geo- metric (002) interface plane for the nine boundaries studied at 850 K. The left-hand column corresponds to Pt-3 at.% Ni and the right-hand one to Ni-3 at.% Pt. Each plot contains two crystallographically identical periodic inter- faces--their planes lying between planes 16-17 and 32-1. (a) For the twist angles (0) 5 °, 10.4 °, 16.3 ° and 22.6 °. (b) For 0 =28.1 °, 33.9 °, 36.9 °, 41.1 ° and 43.6 °. The error bars
correspond to _+ 1 SD.
Solute-atom segregation is expected to be symmetri- cal with respect to the (002) interface planes because the GB is a symmetrical twist boundary. The concen- tration values plotted on the ordinate scale are the average solute-atom concentrations integrated over the area of each (002) plane. The error bars represent plus or minus one standard deviation, and are of different magnitudes for different GBs because of different durations of the simulation runs. The planes in the region between the two interfaces constitute the bulk of a bicrystal, and they are unaffected by solute-atom segregation; this region has a constant solute-atom concentration that corresponds to the bulk concentration of each alloy. The solute concen- tration is highest near the interface, with the excep- tion of the 0 = 5 ° boundary in the Pt-3 at.% Ni alloy; this boundary exhibits a Ni concentration in the first (002) plane adjacent to the interface that is slightly lower than in the second (002) plane. The solute-atom concentrations in the (002) planes adjacent to the interface increase steadily until saturation occurs at 0 = 22.6 °. Simultaneously the width of each segre- gation profile decreases with increasing twist angle; the profile are fairly sharp for the Pt-3 at.% Ni alloy, and even sharper for the Ni-3 at.% Pt alloy.
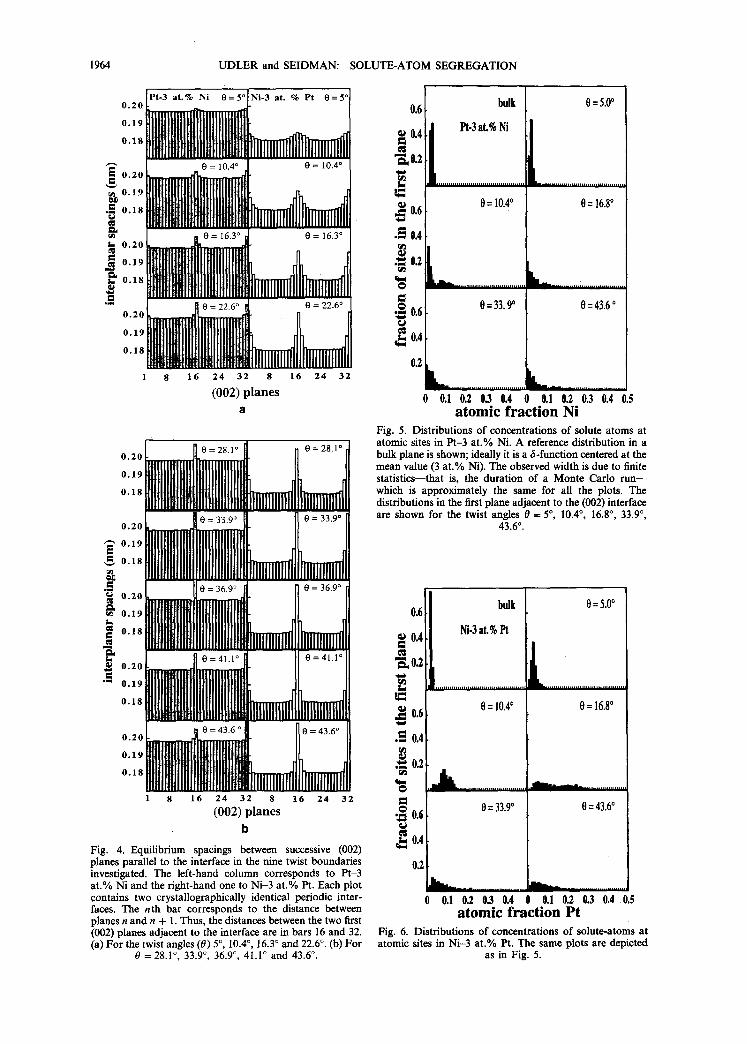
Figures 4(a) and 4(b) exhibit the volume expan- sions normal to the GB interface for the same GBs displayed in Fig. 3. The (002) interplanar spacing for those GBs are displayed as the dimensions in the GB plane are fixed during the simulations--see Section 2. The n th bar of the histograms corresponds to the distance between the nth and (n + 1)th (002) planes. Thus, the distances between the first two (002) planes immediately adjacent to the interface are in bars 16 and 32. First note that the magnitude of the expan- sion scales with the level of solute-atom segregation. In comparing Figs 3 and 4 note that the solute-atom segregation profile for the Ni-3 at.% Pt alloy is sharper for this alloy than it is for the Pt-3 at.% Ni alloy (Fig. 3), while the interplanar expansion profile (Fig. 4) is broader for the Ni-3 at.% Pt profile than it is for the Pt-3 at.% Ni profile; also note that the distances are increased not only between the first two planes that straddle the interface but also between the first and the second planes for the Ni-3 at.% Pt alloy.
A basic question concerning solute-atom segre- gation is: How homogeneously are solute atoms distributed in the atomic sites near an interface? To answer this question consider Fig. 5. It exhibits the distributions of solute-atom concentrations in the Pt-3 at.% Ni alloy in the first (002) planes immedi- ately adjacent to the interface for: (i) two low-angle boundaries, 0 = 5 ° and 0 = 10.4°; (ii) one intermedi- ate-angle boundary, 0 = 16.8°; and (iii) two high- angle boundaries, 0 = 33.9 ° and 0 = 43.6 °. Figure 6 displays the same information for the Ni-3 at.% Pt alloy. As a reference both Figs 5 and 6 exhibit the distributions of solute atoms in an (002) plane in the bulk of a bicrystal; see upper left-hand panel in both figures. In the limit of an infinite number of
1964 UDLER and SEIDMAN" SOLUTE-ATOM SEGREGATION
0 . 2 0
0 . 1 9
0.18
= . = . = ~ ° . 2 ° ~ 1 ~ I ~.~ 0 . 1 9
..~ 0.18 cO
gh 0 = 16.3 ° 0 2 0 ~
°:19H UlIUUUIII[[IlUt[I[L A i 0 . 1 8 ~R[HIHNl~ili[lUl!!!!t~H~llilO _~22 6olI n 0
°'19 ll[[[lll dh 0 8pjW, llh ltt ll ll
1 8 1 6 2 4 3 2 8 1 6 2 4 3 2
(002) p l a n e s
0 . 2 0
0 . 1 9
0 . 1 8
0.20
0.19 E
0.18
~ 0.20
~ 0.19
~ 0.18
~ 0.20 "" 0 . 1 9
0 . 1 8
0 . 2 0 = ' - = " °
o 1 9
0 . 1 8
1 8 16 24 32 8 16 24 32 (002) p l a n e s
b
Fig. 4. Equilibrium spacings between successive (002) planes parallel to the interface in the nine twist boundaries investigated. The left-hand column corresponds to Pt-3 at .% Ni and the right-hand one to Ni-3 at .% Pt. Each plot contains two crystallographically identical periodic inter- faces. The n th bar corresponds to the distance between planes n and n + 1. Thus, the distances between the two first (002) planes adjacent to the interface are in bars 16 and 32. (a) For the twist angles (0) 5 °, 10.4 °, 16.3 ° and 22.6 °. (b) For
0 =28A °, 33.9 °, 36.9 °, 41.1 ° and 43.6 °.
0.6
0.4
"~0.2 I,)
o.6
. - 0.4 rJ l
~ 0.2
o
0
~ L
0.6
0.4
0.2 ~ [ L
0 0.1
bulk
Pt.3 at.% Ni
0 = 10.40
0=33.90
0=5.0 0
h . . . . . . . . . . . .
0 = 16.80
k _
0 = 43.6 o
k 0.2 03 0.4 0 0.1 0.2 0.3 0.4 0.5
a t o m i c f r a c t i o n N i Fig. 5. Distributions of concentrations of solute atoms at atomic sites in Pt-3 at .% Ni. A reference distribution in a bulk plane is shown; ideally it is a 6-function centered at the mean value (3 at .% Ni). The observed width is due to finite statistics--that is, the duration of a Monte Carlo r u n - - which is approximately the same for all the plots. The distributions in the first plane adjacent to the (002) interface are shown for the twist angles 0 = 5 °, 10.4 °, 16.8 °, 33.9 °,
43.6 ° .
0.6
0.4 fll
,1= 11,6
.=, 0.4 r t l
~ 0.2 WI
o
o
k
0.6
0.4
0.2
0 0.1
bulk
Ni.3 at.% Pt
0 = 10.4 o
imlm
0 = 33.90
L
. a l . . . _
0 = 5.0 0
0 = 16.80
0 = 43.60
0.2 03 0.4 0 0.1 0.2 0.3 0.4 0.5 a t o m i c f r a c t i o n Pt
Fig. 6. Distributions of concentrations of solute-atoms at atomic sites in Ni-3 at .% Pt. The same plots are depicted
as in Fig. 5.
UDLER and SEIDMAN: SOLUTE-ATOM SEGREGATION 1965
Monte Carlo steps the distribution of solute-atom concentrations in the bulk of a bicrystal is a 6-func- tion centered at 0.03 at. fr. Ni or 0.03 at. fr. Pt; the finite width of each displayed distribution is due to a finite number of Monte Carlo steps. For both alloys the width of the distribution increases with increasing twist angle--with a pronounced bias towards higher concentrations--that eventually causes higher aver- age concentrations in those planes. The distributions are fairly uniform for high-angle boundaries, with a significant fraction of the sites having concentrations that are lower than in the bulk, and with a very long tail extending to high atomic fractions. The shapes of the distributions displayed are, however, somewhat different for the two alloys; in particular, the distri- butions are considerably broader for the Ni-3 at.% Pt alloy than for the Pt-3 at.% Ni al loy--compare Figs 5 and 6 in detail.
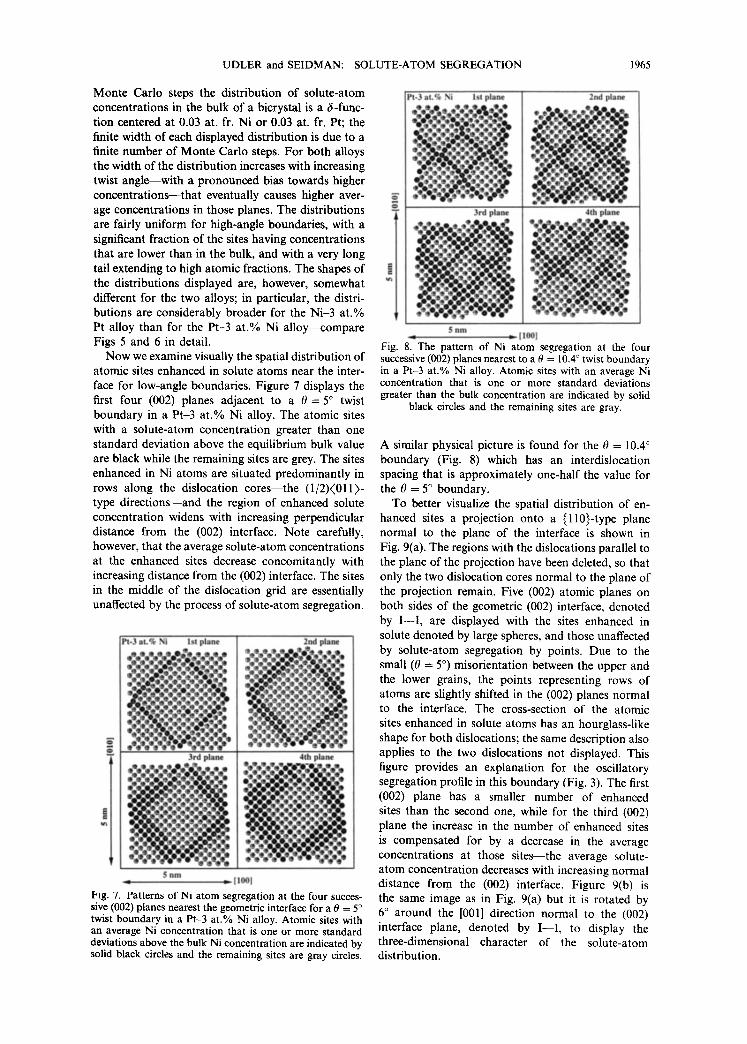
Now we examine visually the spatial distribution of atomic sites enhanced in solute atoms near the inter- face for low-angle boundaries. Figure 7 displays the first four (002) planes adjacent to a 0 = 5 ° twist boundary in a Pt-3 at.% Ni alloy. The atomic sites with a solute-atom concentration greater than one standard deviation above the equilibrium bulk value are black while the remaining sites are grey. The sites enhanced in Ni atoms are situated predominantly in rows along the dislocation cores--the (1/2)(011)- type directions--and the region of enhanced solute concentration widens with increasing perpendicular distance from the (002) interface. Note carefully, however, that the average solute-atom concentrations at the enhanced sites decrease concomitantly with increasing distance from the (002) interface. The sites in the middle of the dislocation grid are essentially unaffected by the process of solute-atom segregation.
Pt-3 a t . % Ni 1st plane
~ ~il, ~ ~ M ~ Ilk
3rd plane
4 1 0 U ID
2nd plane ,-. ® • ® % l m ~ _ o ~ . t ~=®
®:Q:OT.JI~Qd ~ m O--11 ®
O ® O Q
• O U t ~ O ~
;® ;*;®~,'ov*;®;®;,,;- 4th plane
S nm q m~ [100]
Fig. 7. Patterns of Ni atom segregation at the four succes- sive (002) planes nearest the geometric interface for a 0 = 5 ° twist boundary in a Pt-3 at.% Ni alloy. Atomic sites with an average Ni concentration that is one or more standard deviations above the bulk Ni concentration are indicated by solid black circles and the remaining sites are gray circles.
i
Pt -3 a t . % Ni 1st plane
@ "m 2nd plane
":m
5 nn l m [I00]
Fig. 8. The pattern of Ni atom segregation at the four succcssive (002) planes nearest to a 0 = 10.4 ° twist boundary in a Pt-3 at.% Ni alloy. Atomic sitcs with an averagc Ni concentration that is one or more standard deviations greater than the bulk concentration are indicated by solid
black circles and thc remaining sites are gray.
A similar physical picture is found for the 0 = 10.4 ° boundary (Fig. 8) which has an interdislocation spacing that is approximately one-half the value for the 0 = 5 ° boundary.
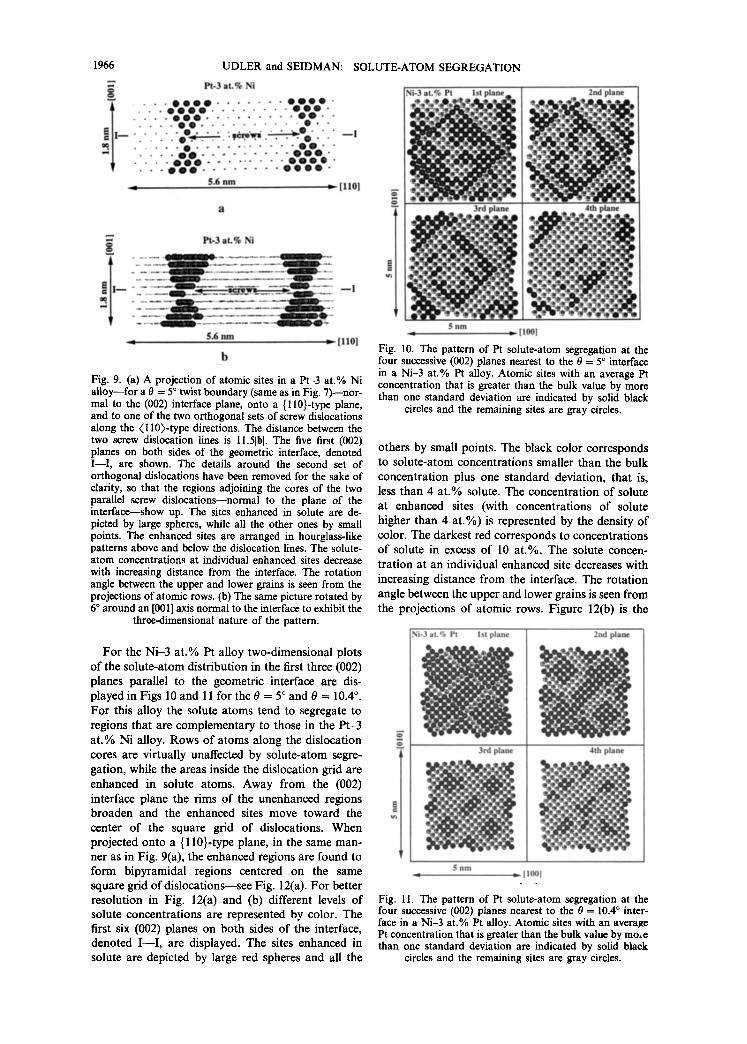
To better visualize the spatial distribution of en- hanced sites a projection onto a {ll0}-type plane normal to the plane of the interface is shown in Fig. 9(a). The regions with the dislocations parallel to the plane of the projection have been deleted, so that only the two dislocation cores normal to the plane of the projection remain. Five (002) atomic planes on both sides of the geometric (002) interface, denoted by I - - I , are displayed with the sites enhanced in solute denoted by large spheres, and those unaffected by solute-atom segregation by points. Due to the small (0 = 5 °) misorientation between the upper and the lower grains, the points representing rows of atoms are slightly shifted in the (002) planes normal to the interface. The cross-section of the atomic sites enhanced in solute atoms has an hourglass-like shape for both dislocations; the same description also applies to the two dislocations not displayed. This figure provides an explanation for the oscillatory segregation profile in this boundary (Fig. 3). The first (002) plane has a smaller number of enhanced sites than the second one, while for the third (002) plane the increase in the number of enhanced sites is compensated for by a decrease in the average concentrations at those sites--the average solute- atom concentration decreases with increasing normal distance from the (002) interface. Figure 9(b) is the same image as in Fig. 9(a) but it is rotated by 6 ° around the [001] direction normal to the (002) interface plane, denoted by I - - I , to display the three-dimensional character of the solute-atom distribution.
1 9 6 6 UDLER and SEIDMAN: SOLUTE-ATOM SEGREGATION
P t - 3 a t . % N i
l i m . . . . O 0 0 D . . . . . . . O e O 0 - - . - 0 0 0 0 . . . . . . . . 0 0 0 - . . . . 0 0 0 . . . . . . . . . O 0 - •
. . . . OO . . . . . . . . . . O - -
. . . . , ,%- - ' . ' - ' : . . . - i%%.
. . . . 0 0 0 . . . . . . . . . O O 0 0 " • - - 0 0 0 . . . . . . . . 0 0 0 0 -
5 . 6 n m t . [ l l O l
9 a
Pt-3 aL% Ni ~ ~ 1
. . . . . . . . . . . . . . . . . . . . . . . . . . . . . 5 n m D [ 1 0 0 ]
$ . 6 n m ~ [110]
b
Fig. 9. (a) A projection of atomic sites in a Pt-3 at.% Ni aUoy--for a 0 = 5 ° twist boundary (same as in Fig. 7)~nor- real to the (002) interface plane, onto a {ll0}-type plane, and to one of the two orthogonal sets of screw dislocations along the (110)-type directions. The distance between the two screw dislocation lines is l l.5[b[. The five first (002) planes on both sides of the geometric interface, denoted I--I , are shown. The details around the second set of orthogonal dislocations have been removed for the sake of clarity, so that the regions adjoining the cores of the two parallel screw dislocations--normal to the plane of the interface---show up. The sites enhanced in solute are de- picted by large spheres, while all the other ones by small points. The enhanced sites are arranged in hourglass-like patterns above and below the dislocation lines. The solute- atom concentrations at individual enhanced sites decrease with increasing distance from the interface. The rotation angle between the upper and lower grains is seen from the projections of atomic rows. (b) The same picture rotated by 6 ° around an [001] axis normal to the interface to exhibit the
three-dimensional nature of the pattern.
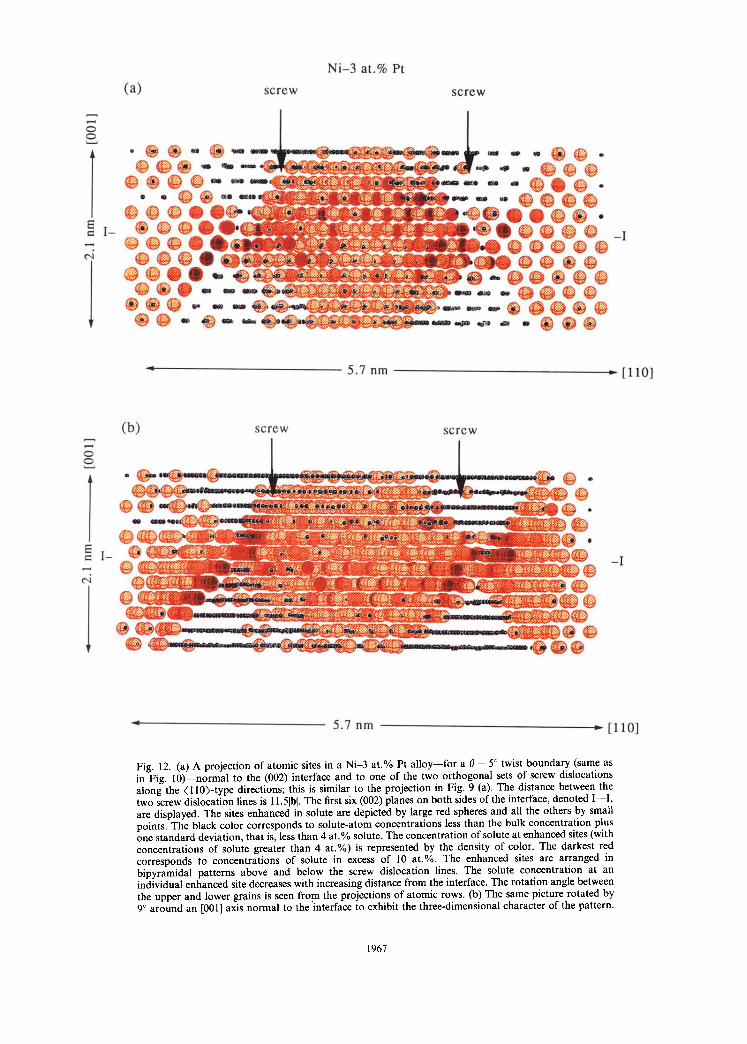
For the Ni -3 at .% Pt alloy two-dimensional plots o f the solute-atom distribution in the first three (002) planes parallel to the geometric interface are dis- played in Figs 10 and 11 for the 0 = 5 ° and 0 = 10•4 °. For this alloy the solute atoms tend to segregate to regions that are complementary to those in the Pt-3 a t .% Ni alloy. Rows of atoms along the dislocation cores are virtually unaffected by solute-atom segre- gation, while the areas inside the dislocation grid are enhanced in solute atoms. Away from the (002) interface plane the rims of the unenhanced regions broaden and the enhanced sites move toward the center of the square grid of dislocations. When projected onto a {110}-type plane, in the same man- ner as in Fig. 9(a), the enhanced regions are found to form bipyramidal regions centered on the same square grid of dislocat ions--see Fig. 12(a). For better resolution in Fig. 12(a) and (b) different levels of solute concentrations are represented by color. The first six (002) planes on both sides of the interface, denoted I - - I , are displayed. The sites enhanced in solute are depicted by large red spheres and all the
Fig. 10. The pattern of Pt solute-atom segregation at the four successive (002) planes nearest to the 0 = 5 ° interface in a Ni-3 at.% Pt alloy. Atomic sites with an average Pt concentration that is greater than the bulk value by more than one standard deviation are indicated by solid black
circles and the remaining sites are gray circles.
others by small points. The black color corresponds to solute-atom concentrations smaller than the bulk concentration plus one standard deviation, that is, less than 4 a t .% solute. The concentration of solute at enhanced sites (with concentrations of solute higher than 4 at .%) is represented by the density o f color• The darkest red corresponds to concentrations o f solute in excess of 10 at .%. The solute concen- tration at an individual enhanced site decreases with increasing distance from the interface• The rotation angle between the upper and lower grains is seen from the projections of atomic rows. Figure 12(b) is the
Ni-3 at.% Pt 1st plane
1111 3rd plane
2nd plane
1/i 4th plane
5 nm ~ [ 1 0 0 ]
Fig. I 1. The pattern of Pt solute-atom segregation at the four successive (002) planes nearest to the 0 = 10.4 ° inter- face in a Ni-3 at.% Pt alloy. Atomic sites with an average Pt concentration that is greater than the bulk value by mo,e than one standard deviation are indicated by solid black
circles and the remaining sites are gray circles.
o
E I -
t"q
N i - 3 at.% Pt
(a) sc r ew sc r ew
. ® ® D O - @ Q e 0 0
o ® @ D o - • . ~ O Q
® e ® D ® • O O G O @ -i
0 0 0 D ® @ ® 0 1 ® ®
0 0 0 I ® @ 0 0 1 O 0
® ® @ D ® @ ® @ ® A A . . . . . . ' - - " ~ ' " " W ® @
5.7 nm ~ [110]
E_
t',,I
I_
(b ) sc rew sc r ew
- I
5.7 nm =
Fig. 12. (a) A projection of atomic sites in a Ni-3 at .% Pt a l loy--for a 0 = 5 ° twist boundary (same as in Fig. 10)--normal to the (002) interface and to one of the two orthogonal sets of screw dislocations along the (110)- type directions; this is similar to the projection in Fig. 9 (a). The distance between the two screw dislocation lines is 11.51hi. The first six (002) planes on both sides of the interface, denoted I - - I , are displayed. The sites enhanced in solute are depicted by large red spheres and all the others by small points. The black color corresponds to solute-atom concentrations less than the bulk concentration plus one s tandard deviation, that is, less than 4 at .% solute. The concentration of solute at enhanced sites (with concentrations of solute greater than 4 a t . ° ) is represented by the density of color. The darkest red corresponds to concentrations of solute in excess of I0 at.Vo. The enhanced sites are arranged in bipyramidal patterns above and below the screw dislocation lines. The solute concentration at an individual enhanced site decreases with increasing distance from the interface. The rotation angle between the upper and lower grains is seen from the projections of atomic rows. (b) The same picture rotated by 9 ° around an [001] axis normal to the interface to exhibit the three-dimensional character of the pattern.
[1101
1967
1968 UDLER and SEIDMAN: SOLUTE-ATOM SEGREGATION
same picture as in Fig. 12(a) except that it is rotated by 9 ° around the [001] direction normal to the (002) interface plane to exhibit the three-dimensional char- acter of the solute-atom distribution.
4. DISCUSSION AND SUMMARY
A systematic investigation has been performed of the phenomenon of solute-atom segregation at (002) symmetrical twist boundaries in dilute single-phase solid-solution alloys on both sides of Ni-Pt phase diagram at 850 K. The following is a discussion and summary of the results presented in Section 3.
4.1. Chemistry of the alloy
The interfacial regions are enhanced in solute atoms on both sides of the Ni-Pt phase diagram. From the point-of-view of classical thermodynamics the Gibbsian interracial excess of solute is defined as
Fs°lute "~- -- ( ~ ) T , P (5)
where ~ is the interfacial free energy of a GB and/~ ' is the chemical potential of a solute atom. This expression is valid for any solid/solid interface. The sign of /'solute can be either positive or negative, depending on the fundamental thermodynamic prop- erties of the bulk solid-solution. A major challenge is to be able to infer at least the sign of FsoJute from the properties of the bulk phase diagram. One of the simplest suggestions is that the pure element with the lower surface free energy is enhanced at the interface. This implies that the sign of/'solute always changes on opposite sides of a phase diagram. This has been found to be true for simulations of solute-atom segregation at symmetrical twist (002) boundaries in the Au-Pt [9], Cu-Ni [25, 42] and Au-Pd [44] sys- tems. For all three alloy systems Au and Cu are enhanced on both sides of the phase diagrams re- spectively. For all three alloy systems the element with the lower melting point - - tha t is, the element with the lower surface tension segregates to grain boundaries. The present results introduce, however, a different trend with the sign of F~olute being positive for the solute species on both sides of the Ni-Pt phase diagram. Another example of similar behavior is the case of the Au-Cu system [51 and references therein].
We now attempt to interpret our observations for the Ni-Pt and Au-Pt systems. The real situation may, of course, be much more complicated than the simple model we are presenting. Within the framework of elasticity theory the interaction of a solute atom with
tThe shear moduli ~ ) of Au, Pt and Ni (in units of 10t2dyne/cm 2) are 0.281, 0.622, and 0.765 [14]. The values of E, for the Au(Pt), Pt(Au), Pt(Ni) and Ni(Pt) systems are 0.79, --0.72, 0.21, --0.21 respectively. The experimental values of E a for the Au(Pt), Pt(Au), Pt(Ni) and Ni(P0 systems are -0.044, 0.0352, -0.085, 0.13 respectively [13].
a twist boundary [52] arises from two effects. The size misfit effect is a p A V type of interaction, and it arises from local expansion s at screw dislocation cores and the resulting net compression is derived from nonlin- ear elasticity theory. The inhomogeneity effect is due to a difference of the elastic constants of the solute and solvent atoms and it comes from linear elasticity theory. Both effects are second order in the distance from a dislocation line. The size misfit effect par- ameter, Ea, is proportional to the fractional change of the lattice constant with concentration of the solute species and it is given by Ea = a-l(da/dc). The inhomogeneity effect parameter, Eu, is given by Eu = p- l (d# /dc) . Due to the size misfit effect over- sized atoms should be repelled from twist boundaries, while undersized ones should be attracted to them. Similarly, due to the inhomogeneity effect "harder" atoms should be repelled, and "softer" ones should be "attracted" [52]. In the Ni-Pt system, where the size misfit parameter is fairly large and the inhomogeneity factor is smallt, the larger Pt atoms should be repelled from the interface on the Ni-rich side of the phase diagram and the smaller Ni atoms should be attracted on the Pt-rich side. This is inconsistent with the simulations and, therefore, doesn't explain the results. Alternatively, the expla- nation in terms of the inhomogeneity effect seems to work for the Pt -Au system, where the size misfit parameter is small and the inhomogeneity factor is large; that is, the "softer" Au atoms tend to be attracted to the interface on both sides of the phase diagram. It is noted, however, that the exact relation between the magnitudes of the two elastic effects is determined by the value of an unknown dimension- less parameter [52].
The above discussion demonstrates that at present we cannot formulate a reasonably simple criterion to predict even the sign of the interfacial segregation! The connection between a bulk phase diagram of an alloy and interfacial phase diagrams for the same system is an intriguing and high priority area of research that can be resolved only on the basis of more detailed and accurate information, than we presently have available.
4.2. Structural features
One macroscopic geometric degree of f reedom-- the twist angle 0--was systematically varied for the (002) symmetrical twist boundaries investigated. We find (see Fig. 2) that /'solute steadily increases with increasing 0 until saturation occurs at about 22.6 ° on both sides of the phase diagram. The effect is, however, a factor of two larger on the Ni-rich side. The widths of the segregation profiles normal to the interface decrease systematically with increas- ing 0. This is indicative of an elastic interaction between a grain boundary and a solute a tom--a t least at low angles. The volume expansions at the GBs scale with the amount of solute-atom segregation.
UDLER and SEIDMAN: SOLUTE-ATOM SEGREGATION 1969
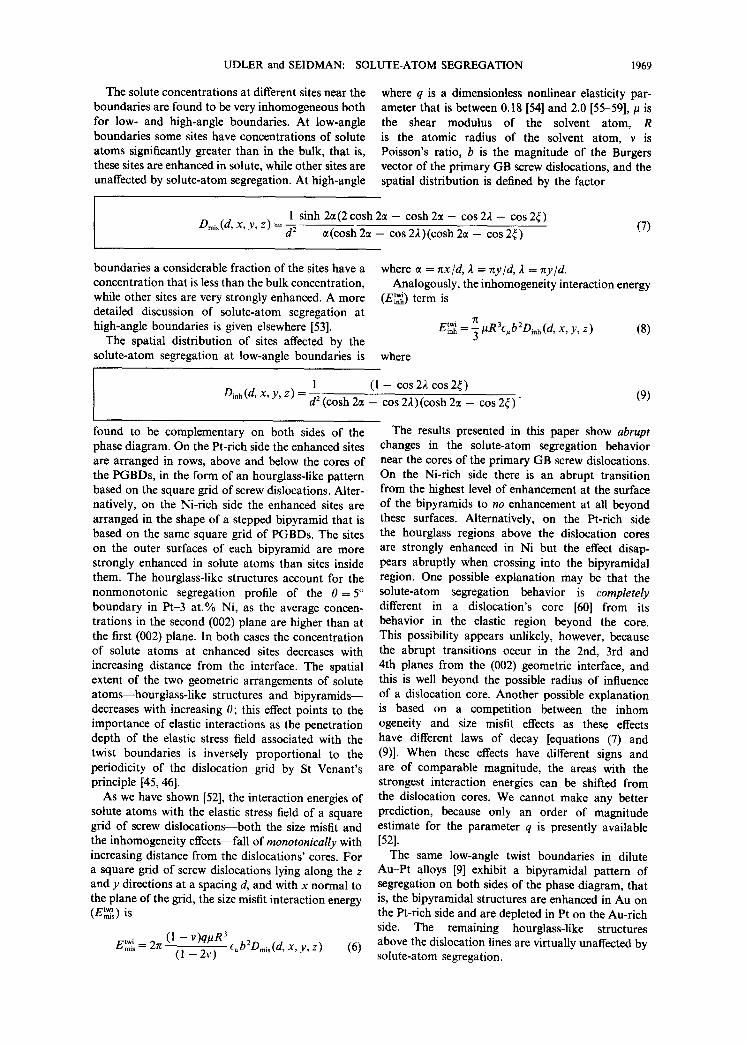
The solute concentrations at different sites near the boundaries are found to be very inhomogeneous both for low- and high-angle boundaries. At low-angle boundaries some sites have concentrations of solute atoms significantly greater than in the bulk, that is, these sites are enhanced in solute, while other sites are unaffected by solute-atom segregation. At high-angle
where q is a dimensionless nonlinear elasticity par- ameter that is between 0.18 [54] and 2.0 [55-59], p is the shear modulus of the solvent atom, R is the atomic radius of the solvent atom, v is Poisson's ratio, b is the magnitude of the Burgers vector of the primary GB screw dislocations, and the spatial distribution is defined by the factor
1 sinh 2ct(2 cosh 2~t - cosh 2~t - cos 22 - cos 2~) Dmi s (d, x, y, z) = d--- ~ ~ (cosh 2~ - cos 22)(cosh 2~t - cos 2¢) (7)
boundaries a considerable fraction of the sites have a concentration that is less than the bulk concentration, while other sites are very strongly enhanced. A more detailed discussion of solute-atom segregation at high-angle boundaries is given elsewhere [53].
The spatial distribution of sites affected by the solute-atom segregation at low-angle boundaries is
where 0t = nx /d, 2 = Try~d, 2 = ny /d. Analogously, the inhomogeneity interaction energy twi (Einh) term is
7[ E ~ = ~ ltR3eub2Oinh(d, x, y, z) (8)
where
1 (1 - cos 22 cos 2~) Di,h(d, x, y, z) = d~ (cosh 2ct - cos 22)(cosh 2~t - cos 2~)" (9)
found to be complementary on both sides of the phase diagram. On the Pt-rich side the enhanced sites are arranged in rows, above and below the cores of the PGBDs, in the form of an hourglass-like pattern based on the square grid of screw dislocations. Alter- natively, on the Ni-rich side the enhanced sites are arranged in the shape of a stepped bipyramid that is based on the same square grid of PGBDs. The sites on the outer surfaces of each bipyramid are more strongly enhanced in solute atoms than sites inside them. The hourglass-like structures account for the nonmonotonic segregation profile of the 0 = 5 ° boundary in Pt-3 at.% Ni, as the average concen- trations in the second (002) plane are higher than at the first (002) plane. In both cases the concentration of solute atoms at enhanced sites decreases with increasing distance from the interface. The spatial extent of the two geometric arrangements of solute atoms--hourglass-like structures and bipyramids-- decreases with increasing 0; this effect points to the importance of elastic interactions as the penetration depth of the elastic stress field associated with the twist boundaries is inversely proportional to the periodicity of the dislocation grid by St Venant's principle [45, 46].
As we have shown [52], the interaction energies of solute atoms with the elastic stress field of a square grid of screw dislocations--both the size misfit and the inhomogeneity effects--fall of monotonically with increasing distance from the dislocations' cores. For a square grid of screw dislocations lying along the z and y directions at a spacing d, and with x normal to the plane of the grid, the size misfit interaction energy
twi (E~s) is
E~m'~is = 27r (1 - v)qltR 3 (1 - 2v) E~b2Dmis(d, x, y, z) (6)
The results presented in this paper show abrupt changes in the solute-atom segregation behavior near the cores of the primary GB screw dislocations. On the Ni-rich side there is an abrupt transition from the highest level of enhancement at the surface of the bipyramids to no enhancement at all beyond these surfaces. Alternatively, on the Pt-rich side the hourglass regions above the dislocation cores are strongly enhanced in Ni but the effect disap- pears abruptly when crossing into the bipyramidal region. One possible explanation may be that the solute-atom segregation behavior is completely different in a dislocation's core [60] from its behavior in the elastic region beyond the core. This possibility appears unlikely, however, because the abrupt transitions occur in the 2nd, 3rd and 4th planes from the (002) geometric interface, and this is well beyond the possible radius of influence of a dislocation core. Another possible explanation is based on a competition between the inhom ogeneity and size misfit effects as these effects have different laws of decay [equations (7) and (9)]. When these effects have different signs and are of comparable magnitude, the areas with the strongest interaction energies can be shifted from the dislocation cores. We cannot make any better prediction, because only an order of magnitude estimate for the parameter q is presently available [52].
The same low-angle twist boundaries in dilute Au-Pt alloys [9] exhibit a bipyramidal pattern of segregation on both sides of the phase diagram, that is, the bipyramidal structures are enhanced in Au on the Pt-rich side and are depleted in Pt on the Au-rich side. The remaining hourglass-like structures above the dislocation lines are virtually unaffected by solute-atom segregation.
1970 UDLER and SEIDMAN: SOLUTE-ATOM SEGREGATION
A low-angle (002) symmetrical twist boundary, 0 = 10.4 °, in Ni-Cu alloys was studied via Monte Carlo simulations [25] and free energy minimization in the local-harmonic approximation [43]. The spatial distribution of enhanced sites is presented only for the case of a Ni-10 at.% Cu alloy, and it appears to have a bipyramidal pattern with the sites enhanced in Cu moving inward from the periphery of the interdislocation cell in the first (002) plane. There is, however, a significant difference between the results given in references [25] and [43] concerning the first (002) plane adjacent to the interface, where a patch of sites highly enhanced in solute-atoms appears for the Monte Carlo simulations [25] but not for the simulations employing the local-harmonic approxi- mation.
A low-angle, 0---7.6 °, boundary in Au-Ag and Au-Ni alloys was also studied by Monte Carlo simulations [61]. In both cases the species with the smaller atomic diameter--hence, Au and Ni atoms-- were found to be enhanced near the screw dislo- cations' cores. Since the distribution in average concentration of atomic sites was presented only for the first (002) plane adjacent to the geometric inter- face, it is difficult to infer a complete segregation pattern. From the available figures, however, an hourglass pattern appears to be observed, similar to that detected on the Pt-rich side of the Ni-Pt phase diagram.
Bipyramidal patterns of solute-atom segregation are also observed in Monte Carlo simulations of (001) semicoherent heterophase boundaries in binary Cu-Au [62] and ternary Cu-Ag-Au [63] alloys. The effect is larger in the latter case, where pyramids of a silver-rich phase form that penetrate deeply into the copper-rich phase. The bipyramids are based on the cells of a square grid of the geometrically necessary misfit dislocations.
A direct correlation between the local hydrostatic pressure and chemical composition was observed in Ag monolayers deposited on Cu substrates. A tight-binding molecular dynamics study [64,65] showed that the larger Ag atoms tend to occupy atomic sites in tension, while the smaller Cu atoms preferentially go to compressed sites forming a hexag- onal grid.
Recently [43], the effect of local stresses on solute- atom segregation at (002) boundaries was investi- gated for the Cu-5 at.% Ni alloy by the free-energy minimization technique in the local-harmonic ap- proximation. It was found that enhancement in Cu, which has a slightly larger lattice parameter, than Ni----e a = 0.0233 for Ni(Cu) [13]---correlates strongly with tensile stresses and is not affected by shear stresses. On the other hand, at a low-angle boundary in the same alloy [25, 43] substantial solute-atom segregation was observed in the 2nd and 3rd planes from the interface with a bipyramidal pattern. From the point of view of elasticity theory [52], there can be no tensile stresses there.
It follows from the above that the conventional wisdom [66, 67] about the atomic sites near the interface being essentially of two types--"good fit" ones where there is almost no distortion of the crystalline lattice and "bad fit" ones where distortions are large (in the cores of GB dislocations)--is in- adequate to describe the atomic-scale picture of so- lute-atom segregation. In our case some "bad fit" sites are strongly affected by solute-atom segregation, while others are not. Accurate calculations of local stresses at each site can be very helpful in understand- ing interfacial segregation phenomena [64, 65]. These results are to be presented elsewhere.
5. CONCLUSIONS
1. Monte Carlo simulations were perforned of solute-atom segregation at symmetrical (002) twist boundaries, as a function of the twist angle, for dilute single-phase alloys on both sides of the Ni-Pt phase diagram at 850 K.
2. The Monte Carlo simulations exhibit solute- atom enhancement at twist boundaries for both the Pt-3 at.% Ni and Ni-3 at.% Pt alloys. This result is in qualitative agreement with solute-atom segregation at free surfaces in the same alloy system (see discus- sion in [17] and references therein). The magnitude of the enhancement for the grain boundaries studied is approximately a factor of two greater on the Ni-rich side as measured by the Gibbsian interfacial excess of solute.
3. In both alloys the value of the Gibbsian inter- facial excess of solute increases with increasing 0 and it saturates at approximately one-half of the 45 ° interval, that is, at about the angle at which the cores of the primary grain boundary dislocations begin to overlap.
4. The widths of the solute-atom segregation profi- les normal to the (002) geometric interface narrow with increasing 0 from three to two planes on each side of an interface until saturation occurs. This is consistent with the fact that the penetration depth of the elastic stress fields associated with a twist bound- ary decrease with increasing 0. At the smallest value of 0 studied (5°), on the Pt-rich side of the phase diagram, an oscillatory segregation profile is ob- served that disappears with increasing 0. On the Ni-rich side oscillatory segregation profiles are not observed.
5. At low-angle boundaries on the Pt-rich side of the phase diagram solute atoms tend to segregate in hourglass-like patterns based on the square grid of primary grain boundary screw dislocations. For the same boundaries on the Ni-rich side a spatially- complementary type of segregation pattern is ob- served, with the regions enhanced in solute atoms forming a bipyramidal pattern that is centered on the same square grid of primary grain boundary screw dislocations.
UDLER and SEIDMAN: SOLUTE-ATOM SEGREGATION 1971
6. The height of the bipyramidal and hourglass reg ions- - tha t is, the number of (002) planes where solute-atom segregation is observed---decreases with increasing 0 from about five atomic planes each side of the interface to two atomic planes in the high-angle regime; in the latter regime the patches of perfect crystal become comparable to the areas of dislocation cores and their intersections. This is consistent with elasticity theory considerations [52].
7. A comparison with the previously studivd A u - P t system, where a reversal o f the sign of the Gibbsian interfacial excess of solute occurs when changing sides of the phase diagram, demonstrates that the bulk thermodynamics of an alloy as well as the structure of a grain boundary plays an important role in determining the detailed atomic-scale behavior of solute-atom segregation.
8. A comparison with other available simulation results on solute-atom segregation at grain bound- aries, heterophase boundaries and free surfaces suggests that hourglass and bipyramidal patterns of solute-atom segregation are quite common, and are related to the stress-field pattern associated with interfaces.
9. No significant differences with respect to solute- a tom segregation are observed between the so-called "special" high coincidence boundaries, as opposed to "general" boundaries. This contradicts common ex- pectations [67] that "special" boundaries, due to a higher degree of structural order, should have weaker solute-atom segregation. The "special" boundaries are known to possess peculiarities in interfacial ten- sions and kinetic properties, but equilibrium segre- gation is determined by the partial derivative of the interfacial free energy of an interface with respect to the chemical potential of solute atoms [equation (5)], and not the absolute value of the interfaciai free energy.
Acknowledgements--This research is supported by the NSF (grant No. DMR-9319074, Dr B. McDonald, grant officer). This work is also partially supported by grant number DMR920002N, and it utilizes the CRAY Y-MP and CRAY 2 systems at the National Center for Supercomputing Applications at the University of Illinois at Urbana-Cham- paign. This work made use of MRL Central facilities supported by the National Science Foundation, at the Materials Research Center of Northwestern University, under award No. DMR-9120521. We wish to thank Drs G. Martin and B. Legrand for stimulating discussions.
REFERENCES
1. M. P. Seah and E. D. Hondros, Proc. R. Soc. A 355, 191 (1975).
2. E. D. Hondros and M. P. Seah, in Physical Metallurgy (edited by R. W. Cahn and P. Haasen), p. 856. North Holland, Amsterdam (1983).
3. C. L. Briant, in Materials Interfaces: Atomic-level Structure and Properties (edited by D. Wolf and S. Yip), p. 463. Chapman & Hall, London (1992).
4. S. M. Foiles and D. N. Seidman, in Materials Inter- faces: Atomic-level Structure and Properties (edited by
D. Wolf and S. Yip), p. 497. Chapman & Hall, London (1992).
5. R. Kirchheim, in Materials Interfaces: Atomic-level Structure and Properties (edited by D. Wolf and S. Yip), p. 481. Chapman & Hall, London (1992).
6. J. W. Cahn, J. Physique (Paris)43, C6-192 (1982). 7. A. Seki, D. N. Seidman, Y. Oh and S. M. Foiles, Acta
metall, mater. 39, 3167 (1991). 8. A. Seki, D. N. Seidman, Y. Oh and S. M. Foiles, Acta
metall, mater 39, 3179 (1991). 9. D. Udler and D. N. Seidman, Physica status solidi (b)
172, 267 (1992). 10. D. Udler and D. N. Seidman, Mater. Res. Soc. Syrup.
278, 223 (1992). I 1. D. Udler and D. N. Seidman, Mater. Science Forum
126-128, 165 (1993). 12. C. E. Dahmani, M. S. Cadeville, J. M. Sanchez and J. L.
Moran-Lopez, Phys. Rev. Lett. 55, 1208 (1985). 13. H. W. King, J. Mater. Sci. 1, 79 (1966). 14. A. J. Moses, The Practicing Scientist's Handbook. Van
Nostrand, Holland (1987). 15. Y. Gauthier, Y. Joly, R. Baudoing and J. Lundgren,
Phys. Rev. B 31, 6216 (1985). 16. S. M. Kuo, A. Seki, Y. Oh and D. N. Seidman, Phys.
Rev. Lett. 65, 199 (1990). 17. S. M. Foiles, in Surface Segregation and Related
Phenomena (edited by P. A. Dowben and A. Miller), p. 79. CRC Press, Boca Raton, Florida (1990).
18. M. S. Daw, S. M. Foiles and M. I. Baskes, Mater. Sci. Rep. 9, 251 0993).
19. N. Metropolis, M. N. Rosenbluth, A. W. Rosenbluth, A. H. Teller and E. Teller, J. chem. Phys. 21, 1087 (1953).
20. M. S. Daw and M. I. Baskes, Phys. Rev. Lett. 50, 1285 (1983).
21. M. S. Daw and M. I. Baskes, Phys. Rev. B 29, 6443 (1984).
22. S. M. Foiles, Phys. Rev. B 32, 7685 (1985). 23. S. M. Foiles, M. I. Baskes and M. S. Daw, Phys. Rev.
B 33, 7983 (1986). 24. M. S. Daw, Phys. Rev. B 39, 7441 (1989). 25. S. M. Foiles, Phys. Rev. B 40, 11502 (1989). 26. P. D. Bristowe, I. Majid, C. Counterman, D. Wang
and R. W. Balluffi, Mater. Sci. Forum 126--128, 25 (1993).
27. S. M. Foiles and J. B. Adams, Phys. Rev. B 40, 5909 (1989).
28. H. Y. Wang, R. Najafabadi, D. J. Srolovitz and R. LeSar, Phil. Mag. A 65, 625 (1992).
29. M. R. Fitzsimmons and S. L. Sass, Acta metall. 36, 3103 (1988).
30. M. R. Fitzsimmons and S. L. Sass, Acta metall. 37, 1009 (1989).
31. I. Majid, P. D. Bristowe and R. W. Balluffi, Phys. Rev. B 40, 2779 (1989).
32. M. S. Taylor, I. Majid, P. D. Bristowe and R. W. Balluffi, Phys. Rev. B 40, 2772 (1989).
33. M. F. Ashby, F. Spaepen and S. Williams, Aeta metall. 26, 1647 (1978).
34. J. P. Hirth and B. Carnahan, Acta metall. 40, 1237 (1989).
35. P. D. Bristowe and A. G. Crocker, Phil. Mag. A 38, 487 (1978).
36. D. Wolf, Acta metall. 32, 735 (1984). 37. D. Wolf, Physica 131B, 53 (1985). 38. D. Schwartz, V. Vitek and P. D. Bristowe, Aeta metall.
36, 675 (1988). 39. G. A. Evangelakis and V. Pontikis, Europhys. Lett. 8,
599 (1989). 40. R. Najafabadi, D. J. Srolovitz and R. LeSar, J. Mater.
Res. 5, 2663 (1990). 41. R. Najafabadi, D. J. Srolovitz and R. LeSar, J. Mater.
Res. 6, 999 (1991).
1972 UDLER and SEIDMAN: SOLUTE-ATOM SEGREGATION
42. R. Najafabadi, D. J. Srolovitz, H. Y. Wang and R. LeSar, Acta metall, mater. 39, 3071 (1991).
43. H. Y. Wang, R. Najafabadi, D. J. Srolovitz and R. LeSar, Acta metall, mater. 41, 2553 (1993).
44. H. Y. Wang, R. Najafabadi, D. J. Srolovitz and R. LeSar, Interface Sci. 1, 31 (1993).
45. W. T. Read, Dislocations in Crystals. McGraw-Hill, New York (1953).
46. J. C. M. Li, in Electron Microscopy and Strength of Crystals (edited by G. Thomas and J. Washburn), p. 713. Wiley, New York (1963).
47. D. N. Seidman, in Materials Interfaces: Atomic-level Structure and Properties (edited by D. Wolf and S. Yip), p. 58. Chapman & Hall, London (1992).
48. T. Schober and R. W. Ballufli, Phil. Mag. 21, 109 (1970).
49. D. Schwartz, V. Vitek and A. P. Sutton, Phil. Mag. A 51, 499 (1985).
50. C. H. P. Lupis, Chemical Thermodynamics of Materials, Chap. 14. North-Holland, Amsterdam (1983).
51. B. S. Bokshteyn, L. M. Klinger, G. S. Nikolsky, V. Y. Fradkov and L. S. Shvindlerman, Phys. Metall. Metal- logr. 48, 75 (1981).
52. D. Udler and D. N. Seidman, Scripta metall. 26, 449 (1992).
53. D. Udler and D. N. Seidman. To be published.
54. H. Stehle and A. Seeger, Z. Phys. 146, 217 (1956); A. Seeger and P. Haasen, Phil. Mag. 3, 470 (1958).
55. R. L. Fleischer, Acta metall. 11, 203 (1961). 56. I. Saxl, Czech. ,L Phys. B14, 381 (1964). 57. B. Smola, Czech J. Phys. 1131, 447 (1981). 58. L. A. Gypen and Deruyterre, Scripta metall. 15, 815
(1981). 59. O. Boser, J. appl. Phys. 44, 1038 (1973). 60. H. Reiss, J. chem. Phys. 40, 1783 (1964). 61. C. A. Counterman, Ph.D. thesis, MIT, Cambridge,
Mass. (1991). 62. P. Bacher, P. Wynblatt and S. M. Foiles, Acta metall.
mater. 39, 2881 (1991). 63. J. P. Rogers III, P. Wynblatt, S. M. Foiles and M. I.
Baskes, Acta metall, mater. 38, 177 (1989). 64. G. Treglia, B. Legrand, J. Eugene, B. Aufray and F.
Cabane, Phys. Rev. B 44, 6842 (1991). 65. C. Mottet, G. Treglia and B. Legrand, Phys. Rev. B 46,
16018 (1992). 66. D. McLean, Grain Boundaries in Metals. Clarendon
Press, Oxford (1957). 67. R. W. Balluffi, in lnterfacial Segregation (edited by
W. C. Johnson and J. M. Blakely), p. 193. Am. Soc. Metals, Metals Park, Ohio (1979).
68. J. J. Gilman, Micromechanics of Flow in Crystals. McGraw-Hill New York (1969).


![UNCLASSIFIED IEIEEEEUEEI DEFORMATION CHARACTERISTICS ... · Internal oxidation [4] involves the formation of stable ox-ide particles in a dilute solid solution where the solute is](https://img.pdfslide.us/doc/110x75/5e94155ccc6e683f6174aa23/unclassified-ieieeeeueei-deformation-characteristics-internal-oxidation-4.jpg)