Embed Size (px)
Citation preview

1Department of Chemical & Environmental Engineering, Center for Environmental Research and Technology, University of California, Riverside,
BioEnergy Science Center, Riverside, CA
2Environmental Sciences Division and Chemical Sciences Division,
Oak Ridge National Laboratory,
BioEnergy Science Center, Oak Ridge, TN
3School of Chemistry and Biochemistry,
Georgia Institute of Technology,
BioEnergy Science Center, Atlanta, GA
October 25, 2011
Solubilization of lignin and hemicellulose during hydrothermal pretreatment
Heather L. McKenzie1, Nancy L. Engle2, Joshua F. Emory2, Marcus B.
Foston3, Arthur Ragauskas3, Bruce A. Tomkins2, Timothy
Tschaplinski2, Gary J. Van Berkel2, Charles E. Wyman1

2
Acknowledgments
ArborGen LLCBrookhaven National Laboratory
Verenium Corporation
Georgia Institute of TechnologyGeorgia Institute of TechnologyMascoma Corporation
National Renewable Energy Laboratory
Oak Ridge National LaboratoryOak Ridge National LaboratoryDartmouth College
Samuel Roberts Noble FoundationUniversity of Georgia
University of TennesseeWashington State University
North Carolina State UniversityVirginia Polytechnic Institute and State
UniversityCornell University
University of CaliforniaUniversity of California--RiversideRiversideUniversity of Minnesota
The BioEnergy Science Center is a U.S. Department of Energy Bioenergy
Research Center supported by the Office of Biological and Environmental
Research in the DOE Office of Science.

3
Outline
• Introduction and objectives
• Materials and methods
• Results and discussion
– Influence of flow rate
– Release of lignin and phenols from P. trichocarpaand isolated lignin
– Changes in molecular weight and composition of lignin
– Release of xylan and xylooligomers from P. trichocarpa and Birchwood xylan
• Summary

4
Introduction and objectives

5
Introduction
• Ethanol from cellulosic biomass is one option for renewable, low GHG emission transportation energy.
Overcome
natural recalcitrance
of biomass
Make enzymes.
Breakdown polymers
glucan and xylan to
sugars, glucose and
xylose.
Ferment all sugars
Process boundaries
Process heat,
electricity
Cellulosic
biomass
Pretreatment
Utilities Fuel ethanol
Exported
electricity
Lignin, etc
Ethanol recovery
Residue processing
Process effluents
Biological steps:Enzyme production
Hydrolysis
Fermentation
Cellulose (primarily glucan)
Hemicellulose (primarily xylan)
Lignin
H-lignin
G-lignin
S-lignin
Chemical structures from Fengel and
Wegener (1984).
Block diagram courtesy of Dr. Wyman.
• Release of hemicellulose and lignin during
pretreatment is poorly understood.

6
Objectives
• Perform hydrothermal flowthrough pretreatment in order to:
– compare the release of lignin and lignin derivatives from poplar and isolated lignin.
– compare the release of xylose and xylooligomers from poplar and birchwood xylan.
• These comparisons will provide indications of the role of lignin-carbohydrate interactions.

7
Materials and methods
8
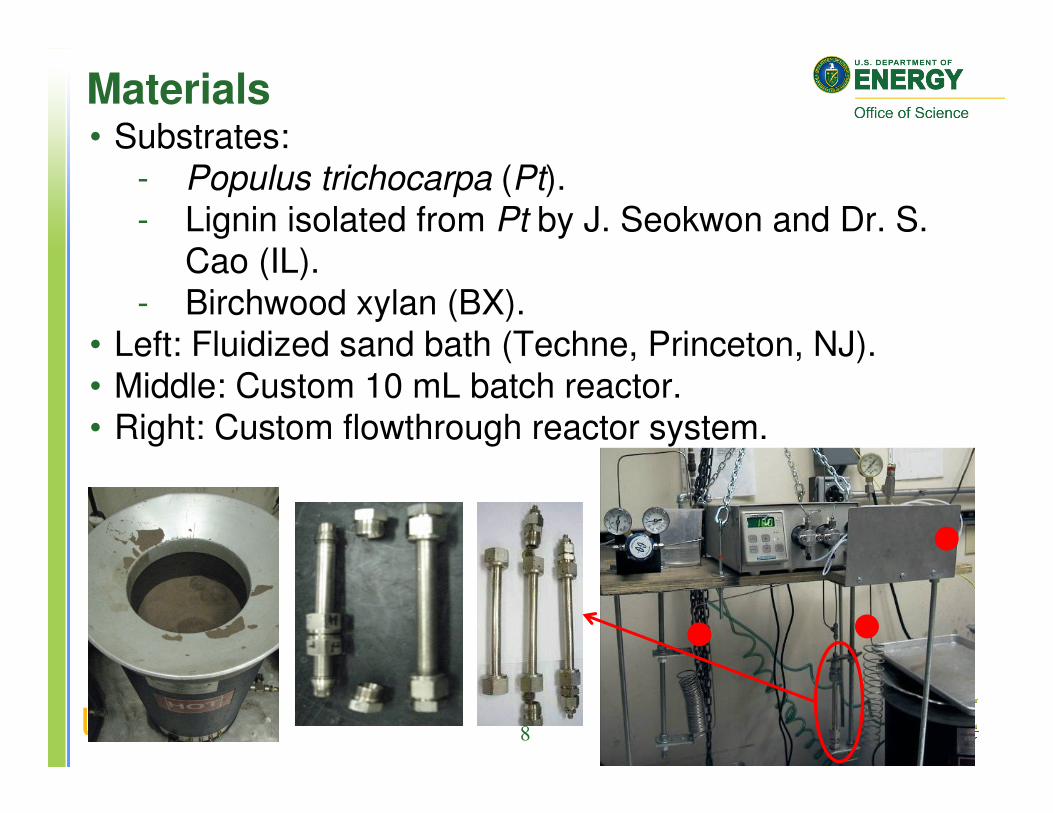
Materials• Substrates:
- Populus trichocarpa (Pt).- Lignin isolated from Pt by J. Seokwon and Dr. S.
Cao (IL).
- Birchwood xylan (BX).• Left: Fluidized sand bath (Techne, Princeton, NJ).
• Middle: Custom 10 mL batch reactor.• Right: Custom flowthrough reactor system.

9
Methods: Pretreatment
• Solids were loaded and sealed into reactor.
• Pretreatment was conducted with 180oC water at conditions summarized below.
• Liquid samples were collected continuously during run.
• Residual solids were collected by filtration and massed at the end of a run.
MaterialMass per
run (g)Flow rate (ml/min)
Temperature (oC)
Time(min)
Sampling Period (min)
Pt 1.00 20-25 180 0-10 2
BX 1.00 25 180 0-10 2
IL 0.71 0-20 180 12-192 3

10
Methods: Analytical procedures
Measurement Procedure Performed by
Sugar monomer and K-lignin content of
hydrolysate and the residual solids.
Strong acid hydrolysis with HPLC
H. McKenzie, UCR
Mn and Mw of ligninGel permeation
chromatography (GPC)Dr. Foston, GIT
Functional groups in lignin
Heteronuclear single quantum coherence (HSQC)
Dr. Foston, GIT
Phenols in liquid hydrolysate
Gas chromatography-mass spectrometry (GCMS)
N. Engle and Dr. Tschaplinski,
ORNL.
Xylooligomers in liquid hydrolysate
Ultra-high pressure liquid chromatography (UPLC)
Drs. Emory, Tomkins, and Van
Berkel, ORNL

11
Results and discussion

12
0 2 4 6 8 100
10
20
30
40
50
60
70
80
90
100Xylan Yield
25 mL/min
20 mL/min
Lignin Removal
20 mL/min
25 mL/min
Glucan Yield
25 mL/min
20 mL/min
Glu
can a
nd X
yla
n Y
ield
(w
t%)
Pretreatment Time (min)
0
10
20
30
40
50
60
70
80
90
100
Influence of flow rate
• Pt was pretreated at 180oC
for 10 minutes with water at 20 ml/min (triplicate) and 25 ml/min.
• Glucan and xylan yields and percent lignin removal
are plotted as a function of time.
• Reducing the flowrate from 25 ml/min to 20 ml/min did not affect final yields.

13
0
10
20
30
40
50
Pt
25
180
10
3.36F
ractio
n S
olu
bili
ze
d (
wt%
)
Material
Q(ml/min)
T(oC)
t(min)
IL
20
180
12
3.43
IL
20
180
192
4.64
IL
0
180
12
3.43
• More lignin is removed from
IL during flowthrough pretreatment than during batch pretreatment.
• This indicates that lignin fragments are removed from
the reactor before they can return to the solid phase.
• The flowthrough reactor improves understanding of
product evolution as a function of time.
Lignin removal from P. trichocarpa and Isolated lignin
IL
Batch180oC
12 min
IL
20 ml/min180oC
12 min

14
0
10
20
30
40
50
Pt
25
180
10
3.36
Fra
ctio
n S
olu
bili
zed
(w
t%)
Material
Q(ml/min)
T(oC)
t(min)
IL
20
180
12
3.43
IL
20
180
192
4.64
IL
0
180
12
3.43
Lignin removal from P. trichocarpa and Isolated lignin
• At approximately equal severity, more lignin is removed from Pt than from IL.
Pt
25 ml/min180oC
10 min
log(Ro)=3.46
IL20 ml/min
180oC
12 min
log(Ro)=3.43

15
• Greater release of monomers from Pt. • This may be due to extractives in raw Pt.
Release of phenols per gram of raw lignin
0 2 4 6 8 10 12
0.000
0.025
0.050
0.075
0.100
0.125
0.150
0.175
0.200
0.225
0.250
Cu
mu
lative
re
lea
se
of p
he
no
l m
eta
bo
lites
(g/g
ra
w lig
nin
)
Time (t, min)
sinapyl alcohol
hydroquinone
coniferyl alcohol
4-hydroxybenzoic acid
Total
mp/m
raw=0.067+0.018t
R2=0.97
0 2 4 6 8 10 12
0.000
0.025
0.050
0.075
0.100
0.125
0.150
0.175
0.200
0.225
0.250
vanillin
syringaldehyde
hydroquinone
sinapyl alcohol
coniferyl alcohol
4-hydroxybenzoic acid
Cu
mu
lative
re
lea
se
of p
he
no
l m
eta
bo
lite
s
(g/g
ra
w lig
nin
)
Time (t, min)
Total
mp/m
raw=0.016+0.012t
R2=0.94
GCMS performed by:
N. Engle and Dr. Tschaplinski, ORNL.
from P. trichocarpa from Isolated lignin

16
• IL’s rate of monomer production from per gram of raw
lignin is 2/3 of that of Pt.
Release of phenols per gram of raw lignin
0 2 4 6 8 10 12
0.000
0.025
0.050
0.075
0.100
0.125
0.150
0.175
0.200
0.225
0.250
Cu
mu
lative
re
lea
se
of p
he
no
l m
eta
bo
lites
(g/g
ra
w lig
nin
)
Time (t, min)
sinapyl alcohol
hydroquinone
coniferyl alcohol
4-hydroxybenzoic acid
Total
mp/m
raw=0.067+0.018t
R2=0.97
0 2 4 6 8 10 12
0.000
0.025
0.050
0.075
0.100
0.125
0.150
0.175
0.200
0.225
0.250
vanillin
syringaldehyde
hydroquinone
sinapyl alcohol
coniferyl alcohol
4-hydroxybenzoic acid
Cu
mu
lative
re
lea
se
of p
he
no
l m
eta
bo
lite
s
(g/g
ra
w lig
nin
)
Time (t, min)
Total
mp/m
raw=0.016+0.012t
R2=0.94
from P. trichocarpa from Isolated lignin
mp/mraw=0.067+0.018t mp/mraw=0.016+0.012t

17
P. Trichocarpa vs. Isolated lignin
• Given:
• greater lignin removal from Pt than IL,
• greater phenol production from Pt than IL, and
• greater rate of phenol production from Pt than IL,
• it seems that lignin-carbohydrate interactions promote the release of lignin.

18
0 1 2 3
0
1000
2000
3000
4000
5000
6000
7000
We
igh
t A
ve
rag
ed
Mo
lecu
lar
We
igh
t (M
w, g
/mo
l)
Q(ml/min)
T(oC)
t(min)
Raw 20
180
12
20
180
192
0
180
12
0 1 2 3
0
500
1000
1500
2000
2500
3000
Nu
mb
er
Ave
rag
ed
Mo
lecu
lar
We
igh
t (M
n, g
/mo
l)
RawQ(ml/min)
T(oC)
t(min)
20
180
12
20
180
192
0
180
12
• The decrease in Mn and Mw indicates that IL undergoes depolymerization reactions.
Average molecular weight of lignin
Weight averaged
molecular weight
Number averagedmolecular weight
Raw
FlowB
atc
h
Raw
Flow
Batc
h
GPC by Dr. Foston, GIT

19
Raw lignin- aliphatic region
Bonds in isolated lignin
B
β-5/α-O-4 phenyl-coumararan
Cspirodienone
(Samuel et al., 2010)
50
60
70
80
2.43.24.04.85.6
1H (ppm)
13C
(ppm
)
Methoxy
Bβ
Aα
Aγ
Bγ
Carbohydrates
AβCα
Bβ
Methoxy group
13C
(ppm
)1H(ppm)
HSQC by Dr. M. Foston,
GIT.
A
β-O-4 ether

20
Bonds in isolated lignin
20 ml/min
180oC
12 min
Batch
180oC
12 min
50
60
70
80
2.43.24.04.85.6
1H (ppm)
13C
(ppm
)
Methoxy
Aα
Aγ
Bγ
AβCα
Bβ
50
60
70
80
2.43.24.04.85.6
1H (ppm)1
3C
(ppm
)
Methoxy
Bβ
Aα
Aγ
Bγ
Carbohydrates
AβCα
Bβ
Raw
50
60
70
80
2.43.24.04.85.6
1H (ppm)
13C
(ppm
)
Methoxy
Aα
Aγ
Bγ
20 ml/min
180oC
192 min
50
60
70
80
2.43.24.04.85.6
1H (ppm)
13C
(ppm
)
Methoxy
Bβ
Aα
Aγ
Bγ
AβCα
Bβ

21
Lignin functional groups
Raw Lignin- Aromatic Region
GGuaiacyl unit
SSyringyl unit
S’Oxidized syringyl unit,
Cα=O
(Samuel et al., 2010)
100
120
110
140
130
7.08.0 6.0
1H (ppm)
13C
(ppm
)
PB2,6
G6
G5
G2
S2,6S’2,6
13C
(ppm
)1H(ppm)
OH
ORO
6 2
35P
PBp-Hydroxybenzoate
unit
HSQC by Dr. M. Foston,
GIT.

22
Lignin functional groups
Run 6
Batch
180oC
12 min
Run 4
20 ml/min
180oC
12 min
Run 5
20 ml/min
180oC
192 min
Raw100
120
110
140
130
7.08.0 6.0
1H (ppm)13C
(ppm
)
PB2,6
G6
G5
G2
S2,6S’2,6
100
120
110
140
130
7.08.0 6.0
1H (ppm)
13C
(ppm
)
PB2,6
G6
G5
G2
S2,6
S’2,6
100
120
110
140
130
7.08.0 6.01H (ppm)
13C
(ppm
)
PB2,6
G6
G5
G2
S2,6
100
120
110
140
130
7.08.0 6.0
1H (ppm)
13C
(ppm
)
PB2,6
G6
G5
G2
S2,6
S’2,6

23
100
120
110
140
130
7.08.0 6.0
1H (ppm)13C
(ppm
)
PB2,6
G6
G5
G2
S2,6S’2,6
100
120
110
140
130
7.08.0 6.0
1H (ppm)
13C
(ppm
)
PB2,6
G6
G5
G2
S2,6
S’2,6
0 1 2 3
0
500
1000
1500
2000
2500
3000
Nu
mb
er
Ave
rag
ed
Mo
lecu
lar
We
igh
t (M
n, g
/mol)
RawQ(ml/min)
T(oC)
t(min)
log(Ro)
20
180
12
3.43
20
180
192
4.64
0
180
12
3.43
Evidence of lignin reactions
20 ml/min
180oC
12 min
Raw
• Based on drop in functional group signal intensity, expect Mn and Mw
to decrease substantially.
• The molecular weight drops but not as much as expected from HSQC
spectra.

24
Evidence of lignin reactions
• The retention of molecular weight, poor solubility, and low signal to noise ratio in the spectra all suggest large polymers in pretreated lignin solids.
• These observations coupled with the low intensity of characteristic lignin bonds suggest formation of new,
unknown bonds in the solids.

25
0 2 4 6 8 100.0
0.2
0.4
0.6
0.8
1.0
Norm
aliz
ed m
ass o
f re
leased x
yla
n
(mx,
l/mx,
raw,
g/g
raw
xyla
n)
Pretreatment time (minutes)
Xylan released from
Birchwood xylan
Xylan released from
P. trichocarpa
Release of xylan from P. trichocarpa and Birchwood xylan
• Pt and BX were pretreated by flowing water at 25 ml/min at 180oC through the solids.
• After 10 minutes, 71% and 100% of the xylan from Ptand BX had been released to liquid phase, respectively.

26
Distribution of xylooligomers from P. trichocarpa and Birchwood xylan
HP 0-2 2-4 4-6 6-88-10HP 0-2 2-4 4-6 6-88-100
10
20
30
40
50
60
70
80
90
100
Dis
trib
utio
n o
f xylo
olig
om
ers
(w
t% x
ylo
se
)
Sampling period (minutes)
• Oligomers with DP<6 account for a larger fraction of the xylooligomers released from poplar than from xylan.
From poplar:
DP=1
DP=2
DP=3
DP=4
DP=5
DP=6
DP>7
From birchwood xylan:
DP=1
DP=2
DP=3
DP=4
DP=5
DP=6
DP>7
UPLC performed by:
Drs. Emory, Tomkins, and
Van Berkel, ORNL

27
P. Trichocarpa vs. Birchwood xylan
• Given:
• the reduction in xylan removal from Pt, and
• the high fraction of low DP oligomers in xylan released from Pt,
• it seems that the lignin-carbohydrate interactions limit the release of high DP xylooligomers.
• Consistent with the hypothesis that lignin-carbohydrate
bonds reduce xylooligomer solubility (Yang and Wyman, 2008).

28
Summary

29
Summary
• In order to better understand the release of xylan and lignin from biomass, P. trichocarpa, isolated lignin, and birchwood xylan were subjected to batch and
flowthrough pretreatment with water at 180oC.
• The liquid hydrolysate and residual solids were
analyzed with numerous techniques.

30
Summary, continued
• Comparison of lignin removal from Pt and IL:
–More lignin was removed from Pt.
–Greater phenol production from Pt.
–Greater rate of phenol production in Pt.
• Strong evidence of lignin reactions during pretreatment:
–Release of phenol monomers.
–Loss of characteristic bonds and functional groups.
–Retention of molecular weight.

31
Summary, continued
• Comparison of xylan removal from Pt and BX:
–Less xylan was removed from Pt.
–More xylooligomers with DP<6 were released from Pt.
• The substantial differences in lignin and xylan removal from the native biomass and model substrates suggest that lignin-carbohydrate interactions appear to enhance
lignin removal while limiting the release of xylan, especially large xylooligomers.

32
Thank you.Questions?