Embed Size (px)
Citation preview
POSIVA OY
Working Report 2000-17
Solubility of thorium in 0.1 M NaCI solution
..Jussi ..Jernstrom
Ulla Vuorinen
Martti Hakanen
March 2000
Mikonkatu 15 A, FIN-001 00 HELSINKI, FINLAND
Tel. +358-9-2280 30
Fax +358-9-2280 3719
TEKIJAORGANISAATIOT:
TILAAJA:
TILAUSNUMEROT:
Helsingin yliopisto Radiokemian laboratorio PL55 00014 Helsingin yliopisto
VTT Kemiantekniikka PL 1404 2044 VTT
Posiva Oy Mikonkatu 15 A 00 1 00 HELSINKI
9564/99/MVS (HYRL) 9622/99/MVS (VTT)
TILAAJAN ~ - ~1 ( _ 3. . 2--~") ~- Cru>-r + <h~s --YHDYSHENKILO: FK Margit Snellman Posiva Oy
TEKIJAORGANISAATIOIDEN YHDYSHENKIKILOT: FM Jussi Jernstrom
FM Ulla Vuorinen HY Radiokemian laboratorio VTT Kemiantekniikka
Tilauksiin liittyvat tutkimuksen tulokset on esitetty tyoraportissa SOLUBILITY OF THORIUM IN 0.1 M NaCl SOLUTION
TEKIJAT:
Jussi Jernstrom Tutkija
Ulla Vuorinen Erikoistutkija
Martti Hakanen Laboratori oinsinoori
HYV AKSYNYT:
·~ ' r . /---) /t ;/~_;; 1 {
~~/ ;:~.4 \J.;.C~~-J,__.&,.AC4·
Arto Muurinen Timo J aakko)a Ryhmapaallikko Professori VTT Kemiantekniikka HY Radiokemian laboratorio
Working Report 2000-17
Solubility of thorium in 0.1 M NaCI solution
..Jussi ..Jernstrom
University of Helsinki
Laboratory of Radiochemistry
Ulla Vuorinen
VTT Chemical Technology
Martti Hakanen
University of Helsinki
Laboratory of Radiochemistry
March 2000
Working Reports contain information on work in progress
or pending completion.
The conclusions and viewpoints presented in the report
are those of author{s} and do not necessarily
coincide with those of Posiva.
Solubility of thorium in 0.1 M NaCI solution
ABSTRACT
The estimations of solubility values of different radioactive elements for the Finnish safety assessment of spent fuel disposal indicated a need to determine solubility values for some essential elements, e.g. tetravalent actinides. Thorium, which exhibits mainly one oxidation state, +IV, in natural conditions, was chosen as the nuclide to start with.
The solubility studies were started in 0.1 M NaCl solution to test and to familiarize with the different methods needed in determining solubility values. Within the solubility study a steady state of solution was approached from both oversaturation and undersaturation. All the experiments were conducted in anoxic, carbonate free conditions. The development of crystallinity of the solubility limiting solid phases microcrystalline Th oxide (ThOiact)) was surveyed by x-ray diffraction patterns. Scanning electron microscope (SEM) and transmission electron microscope (TEM) were used to study the bulk solids and possibly formed thorium colloids separated by ultrafiltration.
At this stage of the work the solubility values of thorium obtained are between 1 o-11-
10-8 M, with carbonate concentration of 10-6-10-5 M. X-ray diffraction measurements showed the solids to be highly amorphous. The rate of development of crystallinity seemed to be more rapid in the oversaturation samples than in the undersaturation samples. Inspection of the ultrafiltration membranes with SEM gave no indication of the presence of thorium colloids. Same result was also gained from TEM investigations. Further development of the microscopic methods is needed.
Hydrogeochemical modelling (EQ3/6 code) was used to compute the solubility values of Th based on the solubility of microcrystalline Th02• The computed results gave Th concentration of about 2·1 o-9 M in the studied systems. The possible involvement of C02 in the experiments was also evaluated by computing using the measured dissolved inorganic carbon content in the samples.
Keywords: Th, Th02, solubility, modelling
Thoriumin liukoisuus 0.1 M NaCI - liuoksessa
TIIVISTELMA
Kaytetyn polttoaineen loppusijoituksen turvallisuusanalyysia varten tehdyn radioaktiivisten alkuaineiden liukoisuusarvion yhteydessa ilmeni tarve kokeellisten liukoisuusarvojen maarittamiseenjoillekin keskeisille alkuaineille ja erityisesti pelkistavia olosuhteita edustaville hapetusasteille, kuten hapetusasteella nelja oleville aktinideille. Paaasiallisesti luonnnon olosuhteissa vain +IV hapetusasteen omaava aktinidi thorium valittiin tyon alkuun.
Tyo aloitettiin kokein 0.1 M NaCl -liuoksella liukoisuustutkimuksessa tarvittavien erilaisten menetelmien testaamiseksi. Liukoisuustutkimuksessa liuoksen ja kiintean faasin tasapainotila pyrittiin saavuttamaan ylikyllastys- ja alikyllastyskokein. Kiintean faasin kiteytymisen kehittymista seurattiin rontgendiffraktion avulla. Tyo tehtiin hapettomissa ja karbonaattivapaissa olosuhteissa. Pyyhkaisyelektronimikroskoopin (SEM) ja transmissioelektronimikroskoopin (TEM) avulla tutkittiin kiinteita faaseja ja pyrittiin loytamaan mahdollisia muodostuneita thoriumin kolloideja.
Tyon tassa vaiheessa saavutetut thoriumin liukoisuusarvot ovat olleet 1 o-11-1 o-s M, karbonaattikonsentraation ollessa 1 o-6-1 o-5 M. Rontgendiffraktiomittaukset osoittivat kiintean faasin olevan rakenteeltaan hyvin amorfisen. Kiteytyminen nayttaa olevan nopeampaa ylikyllastyspuolen naytteilla verrattuna alikyllastyspuolen naytteisiin. Ultrasuodatusmembraanien tarkastelu SEM:in avulla ei toistaiseksi ole osoittanut Th -kolloidien muodostumista. Myoskaan TEM:in avulla ei havaittu kolloidista thoriumia.
Thoriumin liukoisuutta arvioitiin myos mallilaskennalla (EQ3/6) olettamalla liukoisuutta rajoittavaksi kiinteaksi faasiksi mikrokiteinen Th02• Lasketut liukoisuudet vastaten kokeellisia mittauksia olivat luokkaa 2 ·1 o-9 M. Mitatun liuenneen epaorgaanisen kokonaishiilen maaraa kaytettiin mallilaskennassa arvioimaan hiilidioksidin mahdollista osuutta koesysteemeissa.
A vainsanat: Th, Th02, liukoisuus, mallinnus
1
TABLE OF CONTENTS
Abstract
Tiivistelma
1 INTRODUCTION .................................................................................................. 2.
1.1 Background ................................................................................................. 2.
1.2 Solubility studies ......................................................................................... 2.
1.3 Solubility of thorium .................................................................................... 4.
2 EXPERIMENTAL METHODS ............................................................................... 5.
2. 1 pH measurements ...................................................................................... 6.
2.2 Phase separation ........................................................................................ 6.
2.3 Oversaturation samples .............................................................................. 6.
2.4 Undersaturation samples ............................................................................ 6
2. 5 Determining the solution concentration ........................................................ 7
2.6 Solid phase ................................................................................................. 8.
2.6.1 X-ray diffraction studies ................................................................... 8
2.6.2 Electron microscope studies ........................................................... B
3 RESULTS ............................................................................................................ 9 ..
3.1 Equilibration conditions ................................................................................ 9.
3.2 Solubility of thorium ................................................................................... 1 0
3.3 The development of crystallinity of Th02 (am) .......................................... J2
4 HYDROGEOCHEMICAL MODELLING ............................................................... 16
4.1 C02-free system ........................................................................................ 16
4.2 C02 equilibrated system ............................................................................ 1.8
5 CONCLUSIONS AND DISCUSSION ................................................................. 21
6 REFERENCES ................................................................................................... 23
APPENDIX 1: Preparation of microcrystalline Th02 ................................................... 25
APPENDIX 2: Some data on oversaturation experiments. ......................................... 26
APPENDIX 3: Some data on undersaturation experiments ....................................... 27
APPENDIX 4: X-ray diffraction spectra of synthetic Th solids. ................................... 28
2
1 INTRODUCTION
1.1 Background
The assessment of solubility values for TILA-99 (Vuorinen et al. 1998, Ollila & Ahonen 1998) was based on reviews of literature values, hydrogeochemical modelling and experimentally measured values. The work revealed that especially actinide solubilities in anoxic reducing groundwater conditions are not well known and that there are inexplicable discrepancies in values obtained by different researchers leaving room for speculation. As an upper limit for a dissolved component in the source term for radionuclide migration is established by solubility it was felt important to experimentally determine the solubility of some elements in the Finnish groundwater conditions. The local groundwater conditions can vary in pH, salinity and carbonate content, which all are important when solubility is concerned. The speciation of a radionuclide is essential when solubility but also sorption and migration of a radionuclide in the geological environment are considered. Knowledge of the solubility values will also provide guidance in choosing the maximum starting concentrations for radionuclide sorption experiments.
The solubility studies were decided to start with thorium, which has a stable +IV oxidation state in natural conditions both in solids and solutions. It can also act as a model for other tetravalent actinide elements and the results can be compared with those obtained for e.g. U(IV). Both experimental work and modelling are included in the solubility studies.
Before starting solubility measurements in the Finnish reference groundwaters 0.1 M NaCl solution was used as the starting medium. One aspect for this was to get familiar with the techniques and experimental procedures in solubility studies of sparingly soluble elements in controlled systems.
As mentioned above also hydrogeochemical modelling can be used in estimating element solubilities. In this work the same code EQ3/6 (Wolery 1992) and the same databases as used in evaluating solubility values of radionuclides for TILA-99 were used in model calculations. The modelling results of solubility and speciation are discussed and compared with the experimental results.
1.2 Solubility studies
A complete solubility study gives information on the solubility limiting solid phase and its chemical composition, the concentrations of solution components as well as the identity and electrical charge of the species in the solution phase. In order to fulfill thermodynamical meaningfulness a solubility study should satisfy four criteria (Nitsche 1991):
(1) attainment of solution equilibrium conditions, (2) determination of accurate solution concentrations, (3) attainment and identification of a well-defined solid phase,
3
( 4) knowledge of the speciation/oxidation state of the soluble species at equilibrium
Solution equilibrium, or steady state, is usually approached by two ways, oversaturation and undersaturation. In both cases the concentration of the studied substance is measured as a function of time. Oversaturation consists of adding an excess amount of the studied element in soluble form to the aqueous solution in question, and then monitoring the precipitation of insoluble material until a steady state is reached. An approach from undersaturation requires first preparation of the well-characterized solid obtained in oversaturation measurements and then dissolving the solid in the aqueous solution until a steady state is reached. When both saturation methods provide equal concentrations of the studied substance as a function of time, it can be stated that equilibrium in the solution has been established.
Kinetic processes control the speed of equilibration in solubility experiments and thus the steady state may be controlled by more amorphous metastable solids and the solution composition may still be changing due to slow kinetics controlling the formation of the thermodynamically most stable solid. During the time of equilibration the portion of the most crystalline solid becomes more dominant and the solubility values decrease. If slow kinetics are involved reaching equilibrium with the thermodynamically most stable solid may require several years. Despite of this constraint time-limited solubility experiments are valuable in supplying information by providing good estimates on the upper limit of radionuclide concentrations in the studied systems (Nitsche et al. 1994).
There are some essential aspects to consider when performing solubility studies (Nitsche et al. 1994): Phase separation
The separation should be as effective as possible to make reliable solubility values possible. Sorption on filter membranes, container walls or colloidal particles, or uneffective separation cause the solubility values easily to be too low or high. When filtering is used, the procedures and membranes for which quantitative throughput of the soluble species can be guaranteed are a prerequisite. This means that no active sorption sites should be available or the sites should be irreversibly blocked. As adsorption depends on the pH and species in the solution, blocking of the sorption sites should be ascertained for each solution separately e.g. by monitoring consecutive filtrates until no more sorption is evidenced.
The possible presence of colloidal species in the studied system may require additional handling of the solutions.
Solid phase The state of the solid phase affects solubility strongly. Crystalline solids have lower solubility compared to amorphous ones of identical chemical composition. In order to get thermodynamically meaningful solubility results unambiguous characterization of the solid is necessary.
Temperature, pH and ionic strength Solubilities are highly sensitive to pH and temperature changes thus close control of these parameters is necessary during all phases of the experiment. The original
4
ionic strength in a solution may increase even by a factor of five (Nitsche et al. 1994) especially in long-term solubility tests aiming at maintaining stable solution conditions (e.g. pH). The radionuclide-containing stock solutions are often strongly acidic and thus adding of the radionuclide may already change the ionic strength of the original solution and, furthermore, it may increase from having to adjust the pH.
Microprecipitation Undesired microprecipitation may occur when strong base is added in a system already containing the radionuclide. In order to avoid this one should prior to adding the radionuclide solution (acidic) add the amount of base to the original solution needed to neutralise the effect on pH.
1.3 Solubility of thorium
Thorium in the tetravalent oxidation state forms fairly insoluble crystalline or hydrous oxides which can maintain low aqueous concentrations in natural waters and waste repository environments. Two important ligands in groundwater system are hydroxide and carbonate. At low pH values hydrous thorium(IV) oxides are quite soluble, but at pH values higher than 3-4 solubilities decrease significantly. Ryan & Rai (1987) found the solubility values of amorphous Th02 to decrease steeply from 1 o-3 -1 o-2 M to 1 o-9
-
10-8 M between pH 3.6 and pH 4.7.
The solubility of crystalline thorium oxide, ThOi c), is extremely low, Baes & Mesmer (1986) report the calculated minimum value above pH 6 to be 10-9
·6 M. ThOic) is also
known to equilibrate very slowly with the aqueous phase. Thus, in this work it was regarded reasonable to use amorphous hydrous Th(IV) oxide, which is the primary solid phase precipitated under oversaturation conditions, and which equilibrates more rapidly with the aqueous phase .
There is disagreement between different researchers of the role of carbonates in affecting the solubility of thorium. However, a study by Osthols et al. (1994) show that increasing carbonate concentration rises the rate of solution equilibria and increases the solubility of Th(IV).The solubility values in the absence of carbonates are very low at high pH values, and often below the detection limits of the measuring techniques used. Other complexing agents, such as Cl- ions, affect solubility properties according to Felmy et al. (1991), who found solubility values of hydrous Th(IV) oxide in chloride media to be higher when compared to those of Ryan & Rai (1987), who had a pure Th(IV)- H20 system. The solubility values obtained by Felmy et al. (1991) increased with increasing chloride concentration ([Cl-] = from 0.6 M up to 3 M). As the most electronegative element fluoride interacts strongly with aqueous Th4
+ ions forming a series of aqueous complexes. In contrast to chloride, fluoride affects the solubility properties of Th(IV) precipitates in three ways. According to Felmy et al. (1993) when
[F-] ~ 0.01 M Th solubility values stay quite constant, whereas with increasing [F-] up to 0.5 M Th solubilities decrease dramatically, and at concentrations of [F-] > 0.5 M Thsolubilities are about 1 o-8
·5 M.
5
2 EXPERIMENTAL METHODS
All work except centrifugation and drying of the solid phase was performed in anoxic conditions in a glove box equipped with gas circulation instrumentation. The atmosphere in the glove box was ultra pure nitrogen gas (grade 5.0) and the oxygen content of the atmosphere was followed by an oxygen concentration meter. While the circulation ofN2 gas is on the oxygen content stays below 10 ppm. When no work is in progress in the glove box the nitrogen circulation is turned off and the oxygen content rises up to about 1 00 ppm. This makes it necessary to keep all sample and liquid containing containers well sealed. The glove box is not equipped with a C02-
concentration meter, but the content of dissolved C02 in the solutions was evaluated by alkalinity titrations and/or measuring the concentration of dissolved inorganic carbon (DIC).
The water used in the experiments was reagent grade Millipore MilliQ® ion exchanged water, which was flushed with nitrogen gas (grade 5.0) for at least 30 minutes before taken into the glove box. This should ensure that the water is carbonate free. Purging with N2 was done to all solutions, which were prepared outside the glove box, e.g., NaCl solution.
The effect of temperature on solubility is essential. The temperature of the laboratory where the experiments were done is kept fairly steady by an air conditioner. It was
between +20.5 - +23 °C.
At the end of each experimental period the concentration of inorganic carbon in the ultrafiltered aqueous phase was determined by two ways. Immediately after filtration a small sample of the solution was titrated in the glove-box with 0.001 M HCl using the principles shown in Clesceri et al. (1989). From the titration data the equivalent point, and thus the accurate concentration of carbonate species was determined according to
Gran (1950). Using 50 ~L increments of 0.001 M HCl solution and assuming that the first increment drops the pH of the 20 mL sample solution over the equivalent point, the concentration limit of carbonate species to be determined by the procedure is approximately 0.03 mg C/dm3 (0.25·10-5 M of C). Another, and the primary way of determining the inorganic carbon concentration of the filtrate was to analyze DIC. For this analysis a required amount of sample was sent to Fortum Power and Heat Oy in a tightly closed polypropylene bottle. The detection limit of the analysis was 0.02 mg C/dm3 (0.17·10-5 M of C).
In this study the steady state was approached from both oversaturation and undersaturation. The work was started by preparing the samples for oversaturation studies.
6
2.1 pH measurements
The pH was measured with a Radiometer type PHM 83 Autocal pH meter equipped with a Radiometer pHC 2401 combination electrode. The measuring procedure followed the instructions written in ASTM D 1293-95 standard. Calibration of the measuring device was done with commercial calibration solutions (Merck) of pH 4.00, pH 7.00 and pH 10.00.
2.2 Phase separation
Three parallel samples were used. The pH of each sample was measured and the solid phase separated by centrifuging at 8 150 g (rmaJ for 30 minutes. With the first samples studied the aqueous phase was separated from the solid and additionally ultrafiltered with Amicon XM50 (50 000 MWCO (Molecular Weigth Cut-Off)) in order to later study the material on the ultrafilter membranes with SEM for traces of possible colloidal Th particles. However, centrifuging was not effective enough for separating the phases so that only particles of colloidal size would be caught on the ultrafilter membrane. This shortcoming was solved in later samplings by performing prefiltration with 0.45 J.tm pore size membrane (Millipore HA). Another problem considering phase separation and SEM studies was crystallization of chlorides, mainly NaCl, on the membrane. Washing the membrane with water after the filtration however also effectively dissolved the crystallized salt. To determine if any dissolution of solid thorium had taken place, the Th concentration of the water used for dissolving the salt was determined. The result is shown in Figure 3-1.
2.3 Oversaturation samples
The required amount of p.a. grade Th(N03) 4 5H20 (Fluka, 89150) was weighed outside the glove box and after taken into the box the chemical was left to equilibrate with the box atmosphere for at least 24 hours. The solid was then dissolved in 0.1 M NaCl so that the obtained Th concentration was 0.047 M. After a short stirring the pH of the Th/NaCl solution was measured giving a value of 2.71. For each oversaturation sample 35 ml of the Th/NaCI solution was taken into a 50 ml polypropylene centrifuge tube (Sorvall). The pH of the solution was adjusted to over 13 by p.a. grade, carbonate free 19.1 M (50 mass-%) NaOH (Merck) resulting in precipitation of a white solid. Three samples were left as blank samples without adding NaOH. All the prepared samples were then left in the glove box to equilibrate under continuous agitation (end-over-end shaker).
2.4 Undersaturation samples
The hydrous Th(IV) oxide for this study was prepared according to Osthols et al. ( 1994) by dissolving Th(N03) 4 5H20 (Fluka, 89150) in deionized, carbonate free Millipore MilliQ® water. The pH of the resulting solution was measured and was about 2.5. Then,
7
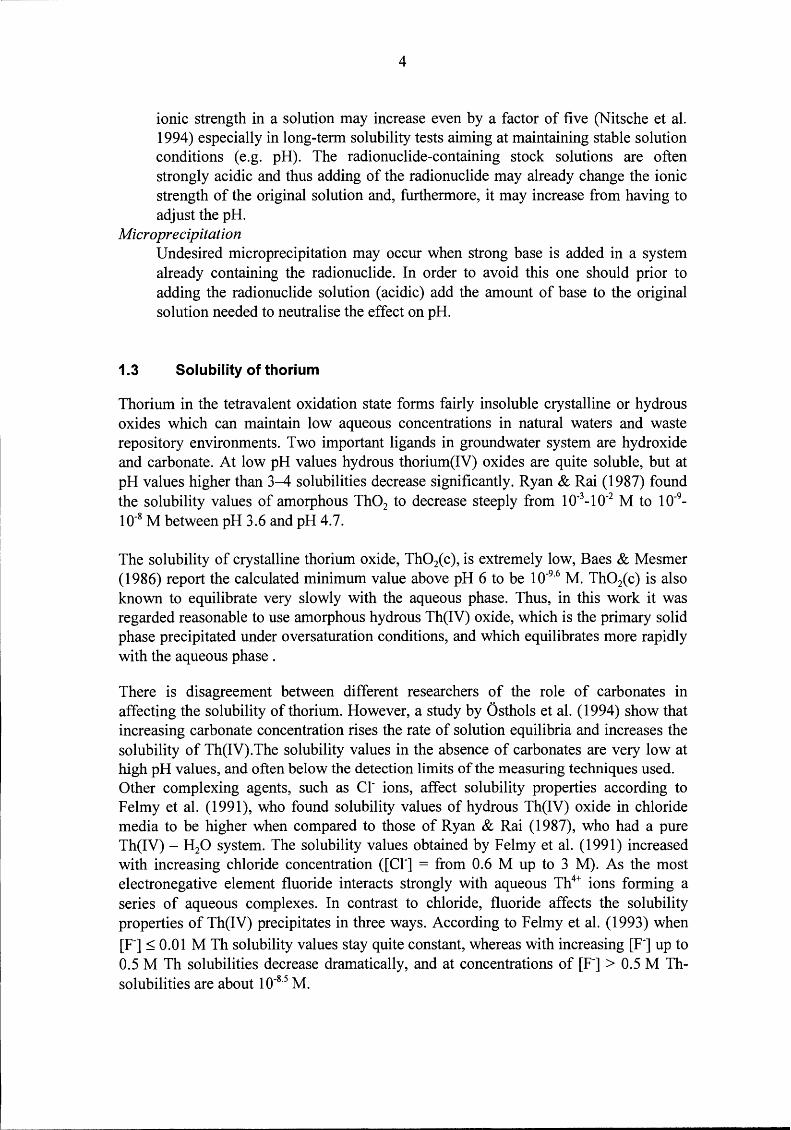
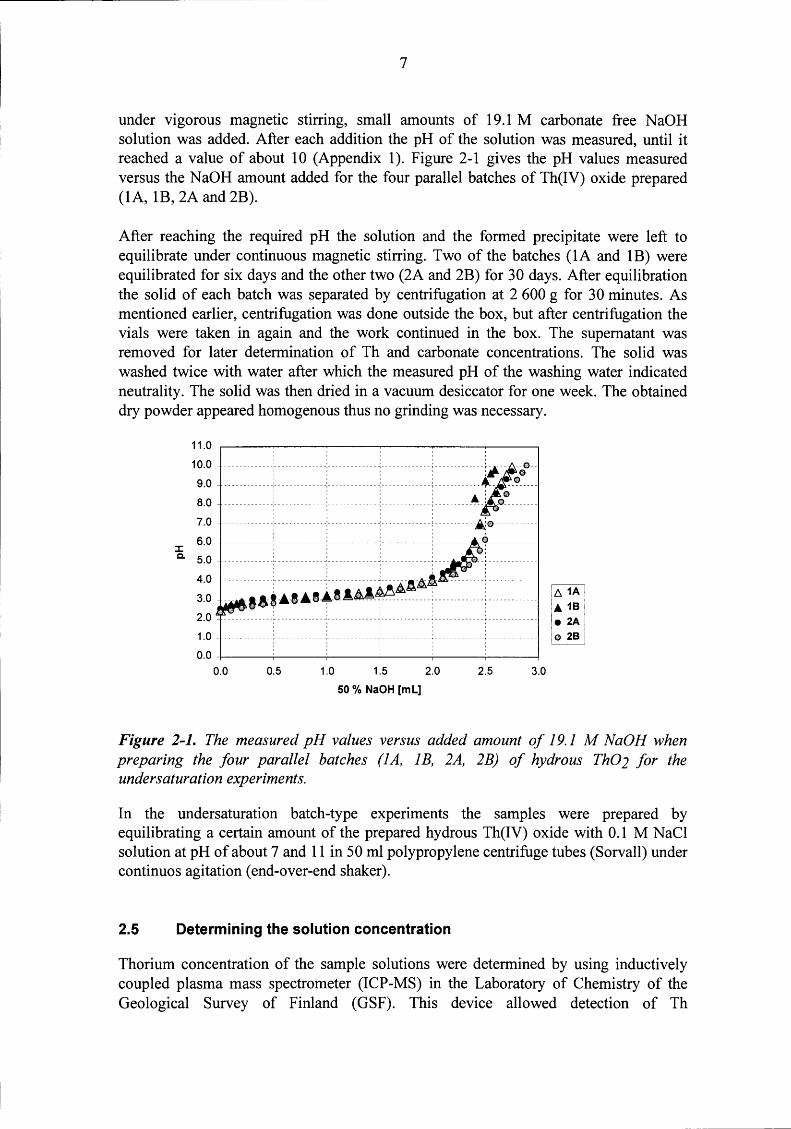
under vigorous magnetic stirring, small amounts of 19.1 M carbonate free NaOH solution was added. After each addition the pH of the solution was measured, until it reached a value of about 10 (Appendix 1). Figure 2-1 gives the pH values measured versus the NaOH amount added for the four parallel batches of Th(IV) oxide prepared (lA, lB, 2A and 2B).
After reaching the required pH the solution and the formed precipitate were left to equilibrate under continuous magnetic stirring. Two of the batches (lA and lB) were equilibrated for six days and the other two (2A and 2B) for 30 days. After equilibration the solid of each batch was separated by centrifugation at 2 600 g for 30 minutes. As mentioned earlier, centrifugation was done outside the box, but after centrifugation the vials were taken in again and the work continued in the box. The supematant was removed for later determination of Th and carbonate concentrations. The solid was washed twice with water after which the measured pH of the washing water indicated neutrality. The solid was then dried in a vacuum desiccator for one week. The obtained dry powder appeared homogenous thus no grinding was necessary.
11.0 I I I I
I I I I
10.0
9.0
8.0 · · · ·· ······•···········•• i••·······•••r•••················ ·· · · .•rtt· .. l'
-------------:--- -- : -:--- :--- -----~-: _() ________ _ I I I I
' ' ' 7.0 -------------i--------------i--------------i-------------i----------.~0}
I I I I I
6.0 J: c. 5.0
4.0
3.0
E E :_!·•·•-•~F2T••••······· : . ' .... ~.~.~£&.2.: : ta ~-A-lA •-t-1_.1.~--- :-------------;------------- r---------
2.0 ' ' ' - ----------o--------------·--------------·-------------1"----------' ' ' ' ' ' 1.0 ' ' ----------,--------------o--------------,-------------T-------------r------------0 ' '
' ' ' ' ' 0.0 -t-----.-------.-------.-----------,-------,--~
0.0 0.5 1.0 1.5 2.0 2.5 3.0
50 % NaOH [m L]
Figure 2-1. The measured pH values versus added amount of 19.1 M NaOH when preparing the four parallel batches (lA, 1 B, 2A, 2B) of hydrous Th02 for the undersaturation experiments.
In the undersaturation batch-type experiments the samples were prepared by equilibrating a certain amount of the prepared hydrous Th(IV) oxide with 0.1 M NaCl solution at pH of about 7 and 11 in 50 ml polypropylene centrifuge tubes (Sorvall) under continues agitation (end-over-end shaker).
2.5 Determining the solution concentration
Thorium concentration of the sample solutions were determined by using inductively coupled plasma mass spectrometer (ICP-MS) in the Laboratory of Chemistry of the Geological Survey of Finland (GSF). This device allowed detection of Th
-----------------------------
8
concentrations down to 8.6·10-11, which can be improved down to 1.7·10-11 M by using
tenoyltrifluoroacetone (TTA) extraction. The sample solutions for ICP-MS determination were acidified with concentrated HN03• Because of the ICP-MS system was sensitive to disturbing effect of chloride ions the solutions needed to be diluted for the analysis. The dilution technique used was improved during the work, this is shown in Figures 3-1 and 3-2 as a decrease in the detection limit. Sample dilution was done by GSF.
2.6 Solid phase
2.6.1 X-ray diffraction studies
The development of crystallinity of the microcrystalline Th(IV) oxide was followed by x-ray diffraction analysis. The device used was Broker D8 Advanced powder diffractometer. The radiation source emits Cu Ka -rays, the measuring voltage is 40 kV, and the measuring current 50 mA. The samples were placed on silicon plates.
Reference spectra of commercial synthetic ThOic) (Fluka, 89170) and Th(N03) 4 5H20 (Fluka, 89150) were measured (Appendix 4) before measuring the spectra for the solid phases obtained in the experiments.
2.6.2 Electron microscope studies
Zeiss DSM 962 scanning electron microscope was used for studying the solid phases and possible colloidal thorium particles on the ultrafiltration membranes. A small piece of the membrane being studied was attached to a metal plate with tape and then coated with a thin layer of platinum. Platinum was used in order to achieve better resolution in the scanning procedure. With backscattering electron detector and x-ray detector (EDS) of the microscope it was possible to study and identify particles on the surfaces of the membrane.
Jeol 1200 EX transmission electron microscope was also used in finding thorium colloids. Small aliquots taken from solutions before and after ultrafiltration were dried on a sample base, a coal coated lattice grid of the microscope. With high resolution of TEM it was tried to find any traces of thorium particles and determine their structure.
The microscopic methods are under development.
-------------------------------
9
3 RESULTS
3.1 Equilibration conditions
The carbonate concentrations of the samples equilibrated in alkalic conditions (pH>9) were at the level of 1 o-s M. The concentration values were at the level of 1 o-6 M in the samples of near neutral pH conditions. Slight decreases were observed in the pH values during the equilibration time (Tables 3-1 and 3-2). However, in the undersaturation experiments (Table 3-2) the general decrease in pH of the equilibrated starting solution values of 7 and 11 to a lower level is a consequence of the addition of the solid to a solution without buffering capacity. In the sampling procedure the sample solutions of the three parallel samples were combined after the pH values had been measured and the solid phase separated by centrifugation. This was a prerequisite for obtaining enough sample for all analysis (alkalinity, DIC and Th).
Table 3-1. Oversaturation samples: measured pH values for three parallel samples and the soluble inorganic carbon content by dissolved inorganic carbon (DIC) method and by titrating with 0. 001 M HCl.
Equilibration time Parallel samples Ctot by (d) pH values DIC (M) titration (M)
10 13.20 13.24 13.20 5.33E-05 -22 13.12 13.14 13.18 5.50E-05 -30 13.04 13.01 12.99 5.83E-05 2.61E-05 70 12.91 12.93 12.94 5.41E-05 1.14E-05
Table 3-2. Undersaturation samples: measured pH values for three parallel samples and the soluble inorganic carbon content by dissolved inorganic carbon (DIC) method and by titrating with 0. 001 M HCI.
UNDERSATURATION pH7
Equilibration time Parallel samples CtotbY (d) pH values DIC (M) titration (M) 10 6.70 6.80 6.75 5.00E-06 -32 6.48 6.61 6.34 8.33E-06 -70 6.61 6.62 6.53 4.16E-06 -
UNDERSATURATION pHll
Equilibration time Parallel samples Ctot by (d) pH values DIC (M) titration (M) 10 9.97 9.85 10.01 1.67E-05 1.66E-05 32 9.63 9.87 9.86 2.08E-05 5.89E-05 71 9.52 9.65 9.73 4.16E-06 5.03E-05
~------------------------- --
10
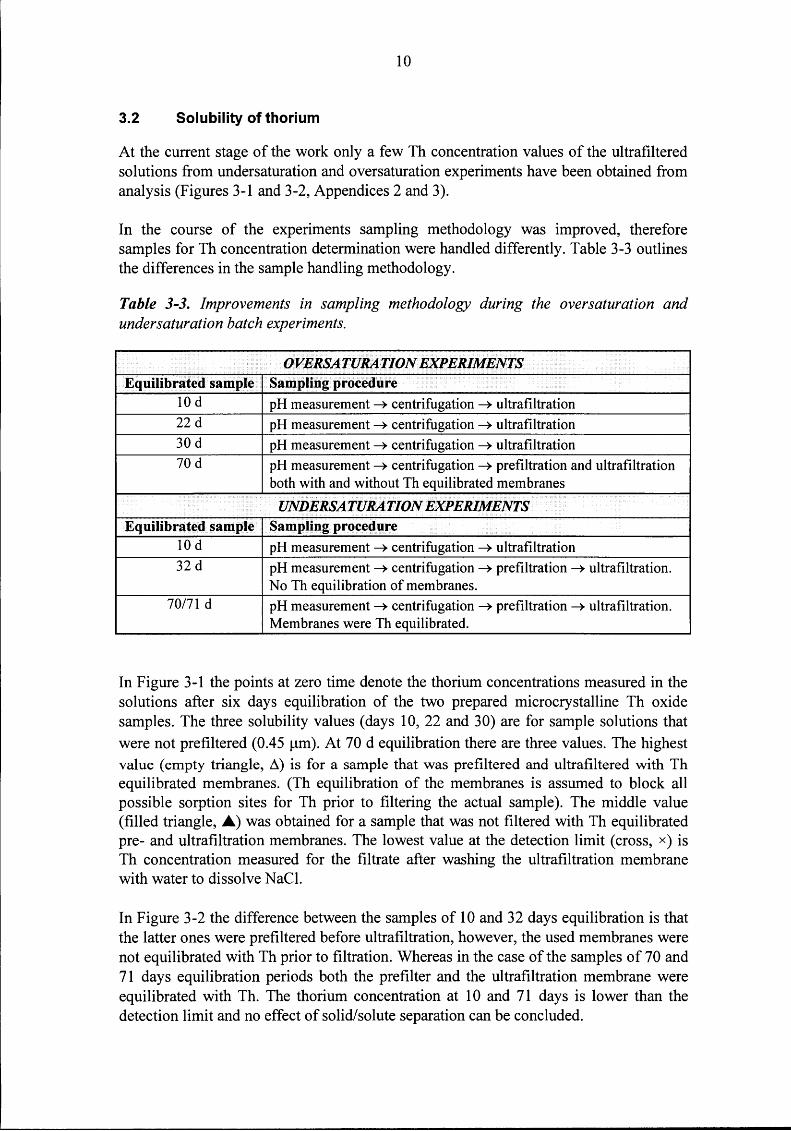
3.2 Solubility of thorium
At the current stage of the work only a few Th concentration values of the ultrafiltered solutions from undersaturation and oversaturation experiments have been obtained from analysis (Figures 3-1 and 3-2, Appendices 2 and 3).
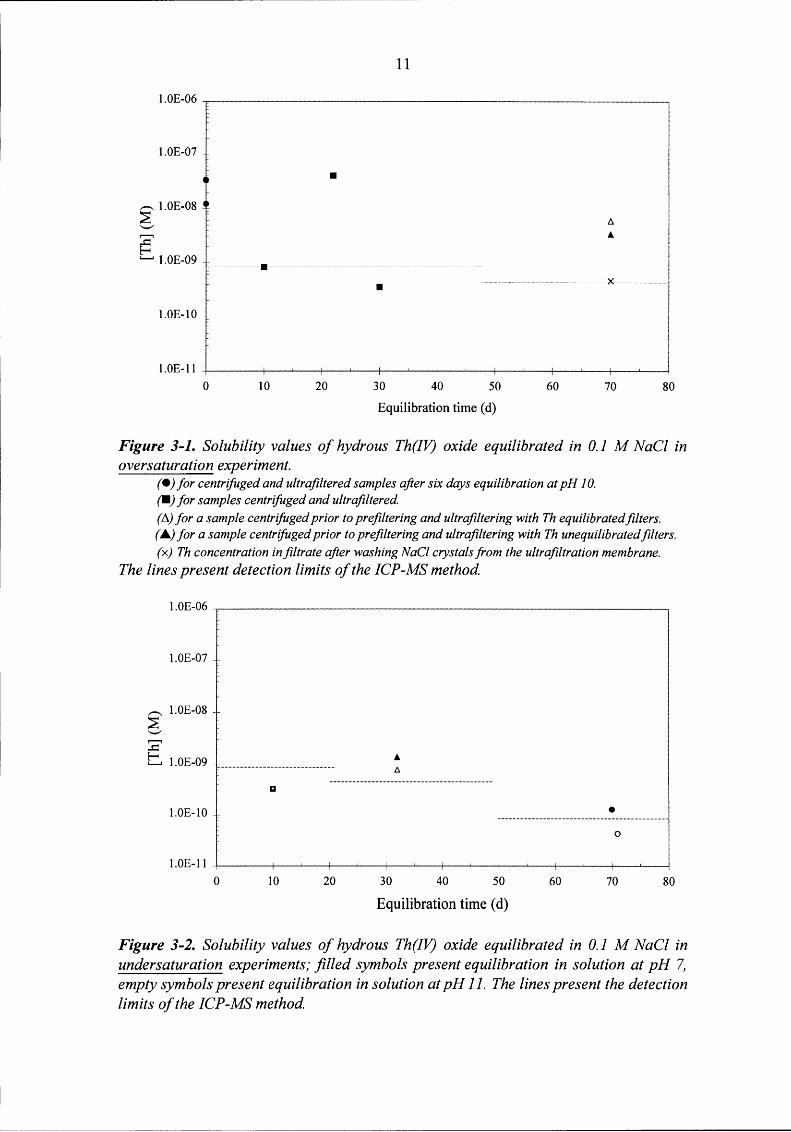
In the course of the experiments sampling methodology was improved, therefore samples forTh concentration determination were handled differently. Table 3-3 outlines the differences in the sample handling methodology.
Table 3-3. Improvements in sampling methodology during the oversaturation and undersaturation batch experiments.
OVERSATURATION EXPERIMENTS Equilibrated sample Sampling procedure
10 d pH measurement ~ centrifugation ~ ultrafiltration 22 d pH measurement ~ centrifugation ~ ultrafiltration 30 d pH measurement ~ centrifugation ~ ultrafiltration 70 d pH measurement ~ centrifugation ~ prefiltration and ultrafiltration
both with and without Th equilibrated membranes
UNDERSATURATION EXPERIMENTS Equilibrated sample Sampling procedure
10 d pH measurement ~ centrifugation ~ ultrafiltration 32 d pH measurement ~ centrifugation ~ prefiltration ~ ultrafiltration.
No Th equilibration of membranes. 70/71 d pH measurement ~ centrifugation ~ prefiltration ~ ultrafiltration.
Membranes were Th equilibrated.
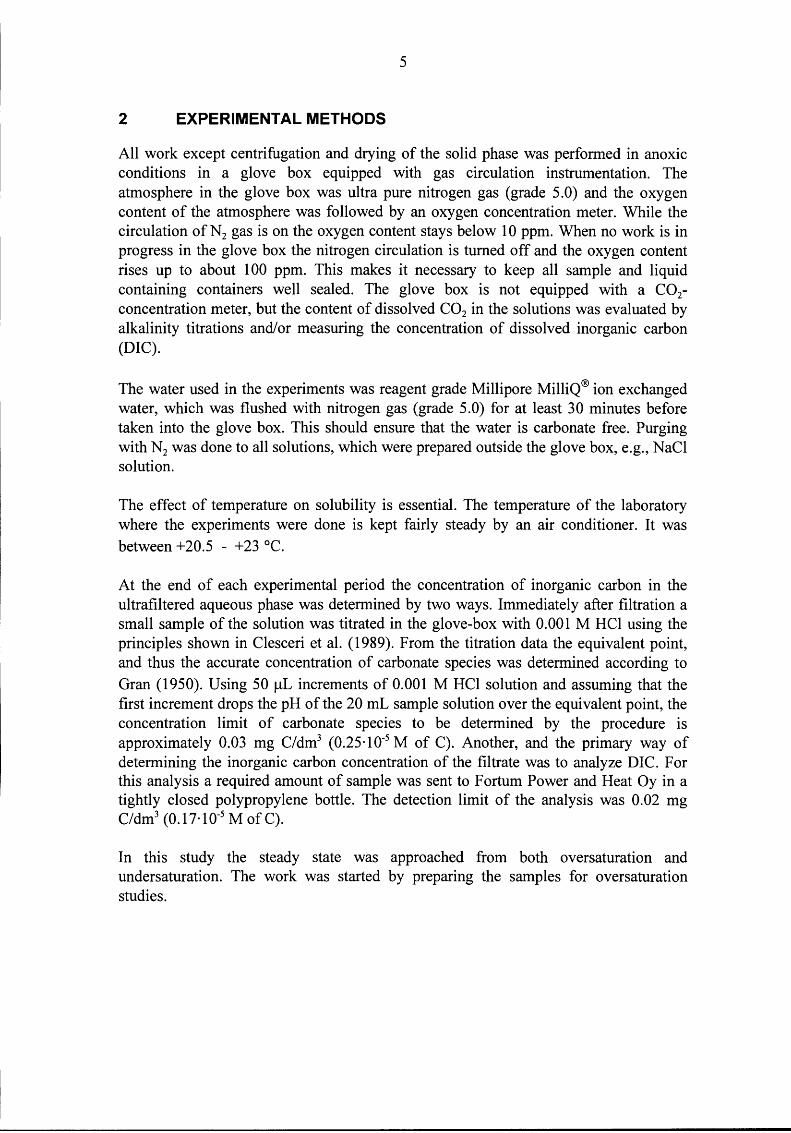
In Figure 3-1 the points at zero time denote the thorium concentrations measured in the solutions after six days equilibration of the two prepared microcrystalline Th oxide samples. The three solubility values (days 10, 22 and 30) are for sample solutions that were not prefiltered (0.45 J.tm). At 70 d equilibration there are three values. The highest value (empty triangle, ~) is for a sample that was prefiltered and ultrafiltered with Th equilibrated membranes. (Th equilibration of the membranes is assumed to block all possible sorption sites for Th prior to filtering the actual sample). The middle value (filled triangle, .._)was obtained for a sample that was not filtered with Th equilibrated pre- and ultrafiltration membranes. The lowest value at the detection limit (cross, x) is Th concentration measured for the filtrate after washing the ultrafiltration membrane with water to dissolve NaCl.
In Figure 3-2 the difference between the samples of 10 and 32 days equilibration is that the latter ones were prefiltered before ultrafiltration, however, the used membranes were not equilibrated with Th prior to filtration. Whereas in the case of the samples of 70 and 71 days equilibration periods both the prefilter and the ultrafiltration membrane were equilibrated with Th. The thorium concentration at 10 and 71 days is lower than the detection limit and no effect of solid/solute separation can be concluded.
11
1.0E-06 -.----------------------------___,
l.OE-07
• ,-_ l.OE-08 ::E ..._,
~ 1...-...l 1.0E-09
.................•
• X
l.OE-10
l.OE-11 -t-----'--+-.....1.--+-----'---t---'---l----'---+---'----t---l---+--....__---4
0 10 20 30 40 50 60 70 80
Equilibration time (d)
Figure 3-1. Solubility values of hydrous Th(IV) oxide equilibrated in 0.1 M NaCl in oversaturation experiment.
(•) for centrifuged and ultrafiltered samples after six days equilibration at pH 10. r-J for samples centrifuged and ultrafiltered
( 11) for a sample centrifuged prior to prefiltering and ultrafiltering with Th equilibrated filters. (A.) for a sample centrifuged prior to prefiltering and ultrafiltering with Th unequilibrated filters.
(x) Th concentration infiltrate after washing NaCl crystals from the ultrafiltration membrane.
The lines present detection limits of the ICP-MS method.
l.OE-06 -.--------------------------------.
l.OE-07 -
,_ l.OE-08 ::E ..._, ,......, ...c::: [: l.OE-09
a
l.OE-10 • 0
l.OE-11 -t-----J.--t---'----t---'--+----'--+---'---1--__._--+-_....__-+--'-----l
0 10 20 30 40 50 60 70 80
Equilibration time (d)
Figure 3-2. Solubility values of hydrous Th(JV) oxide equilibrated in 0.1 M NaCl in under saturation experiments; filled symbols present equilibration in solution at pH 7, empty symbols present equilibration in solution at pH 11. The lines present the detection limits of the ICP-MS method.
12
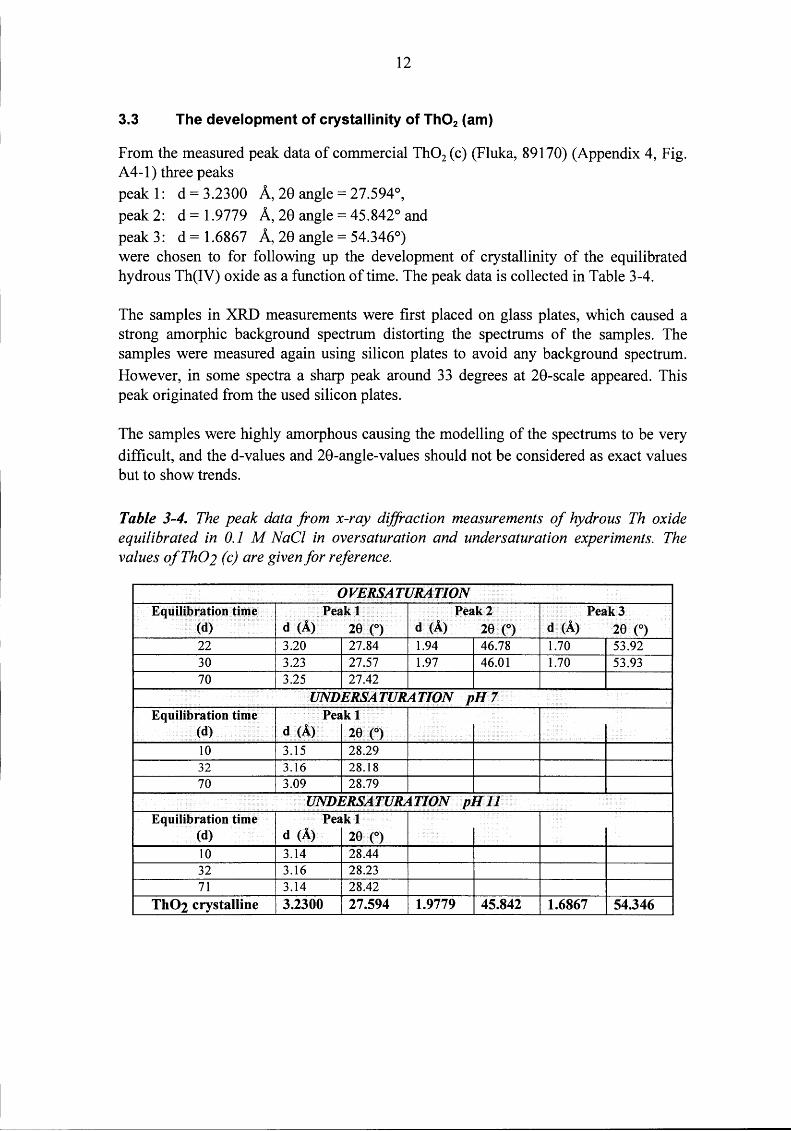
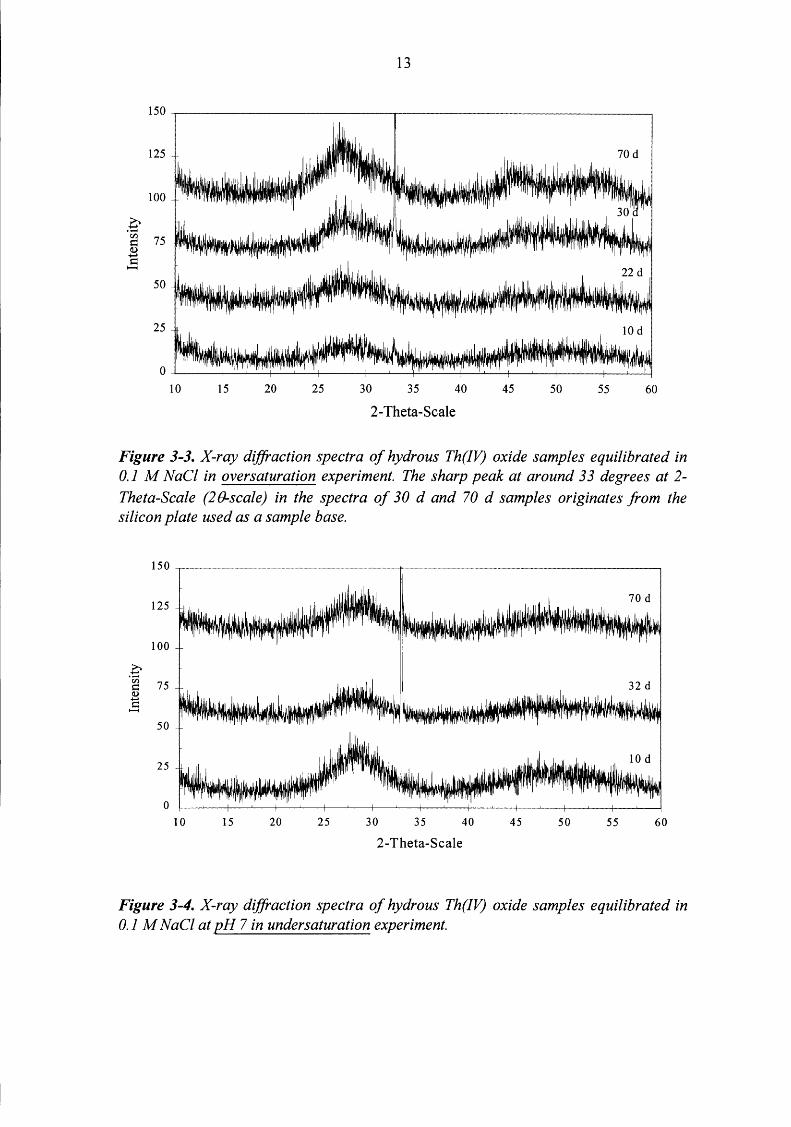
3.3 The development of crystallinity of Th02 (am)
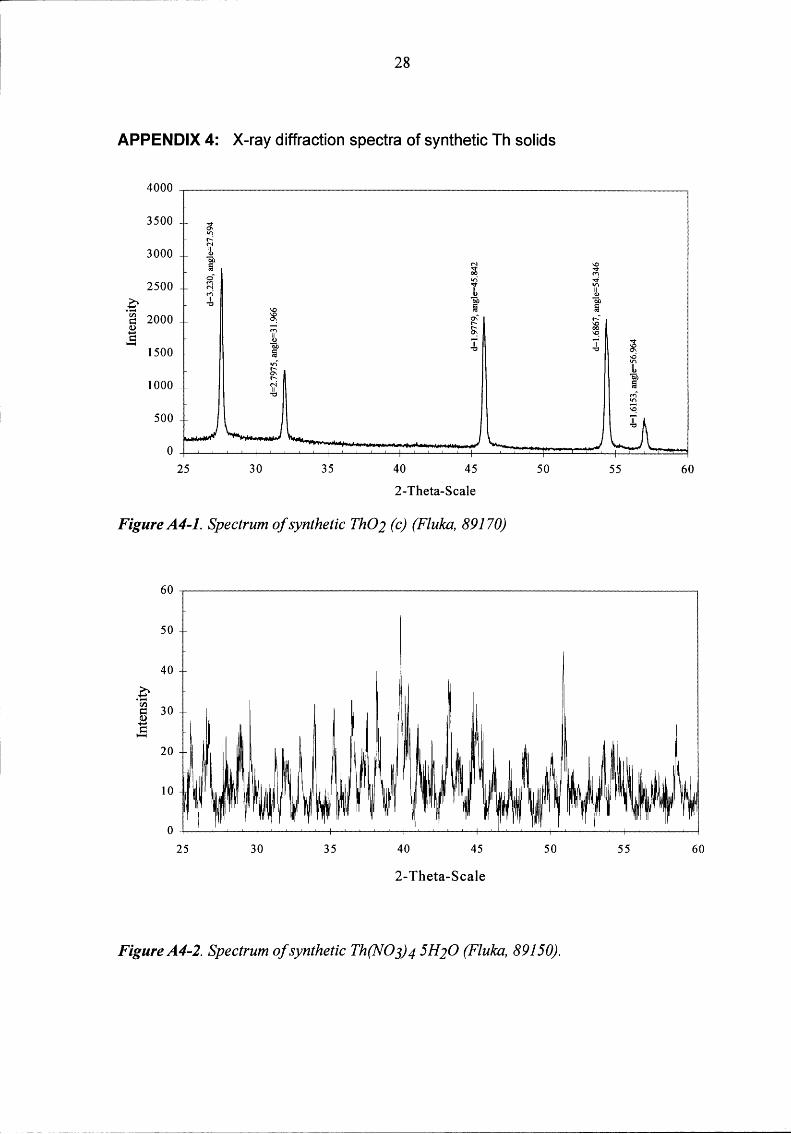
From the measured peak data of commercial Th02 (c) (Fluka, 89170) (Appendix 4, Fig. A 4-1) three peaks peak 1: d = 3.2300 A, 28 angle= 27.594°, peak 2: d = 1.9779 A, 28 angle= 45.842° and peak 3: d = 1.6867 A, 28 angle = 54.346°) were chosen to for following up the development of crystallinity of the equilibrated hydrous Th(IV) oxide as a function of time. The peak data is collected in Table 3-4.
The samples in XRD measurements were first placed on glass plates, which caused a strong amorphic background spectrum distorting the spectrums of the samples. The samples were measured again using silicon plates to avoid any background spectrum. However, in some spectra a sharp peak around 33 degrees at 28-scale appeared. This peak originated from the used silicon plates.
The samples were highly amorphous causing the modelling of the spectrums to be very difficult, and the d-values and 28-angle-values should not be considered as exact values but to show trends.
Table 3-4. The peak data from x-ray diffraction measurements of hydrous Th oxide equilibrated in 0.1 M NaCl in oversaturation and undersaturation experiments. The values ofTh02 (c) are given for reference.
OVERSATURATION Equilibration time Peak 1 Peak2 Peak3
(d) d (A) 29 e> d (A) 29 e> d (A) 29 e> 22 3.20 27.84 1.94 46.78 1.70 53.92 30 3.23 27.57 1.97 46.01 1.70 53.93 70 3.25 27.42
UNDERSATURATION pH7 Equilibration time Peakl
(d) d (A) 29 e> 10 3.15 28.29 32 3.16 28.18 70 3.09 28.79
UNDERSATURATION pHll Equilibration time Peakl
(d) d (A) 29 e> 10 3.14 28.44 32 3.16 28.23 71 3.14 28.42
Th02 crystalline 3.2300 27.594 1.9779 45.842 1.6867 54.346
13
150
125
100
c ·;;; 75 ~
(!) -+-' ~ -
50
25
0 10 15 20 25 30 35 40 45 50 55 60
2-Theta-Scale
Figure 3-3. X-ray diffraction spectra of hydrous Th(IV) oxide samples equilibrated in 0.1 M NaCl in oversaturation experiment. The sharp peak at around 33 degrees at 2-Theta-Scale (28-scale) in the spectra of 30 d and 70 d samples originates from the silicon plate used as a sample base.
150
125
100
c 'V)
75 = Q) +-' = -
50
25
0 10 15 20 25 30 35 40 45 50 55 60
2-Theta-Scale
Figure 3-4. X-ray diffraction spectra of hydrous Th(IV) oxide samples equilibrated in 0.1 M NaCl at pH 7 in undersaturation experiment.
14
150
125
100
.£ tl)
75 c Q)
!1 50
25
0 10 15 20 25 30 35 40 45 50 55 60
2-Theta-Scale
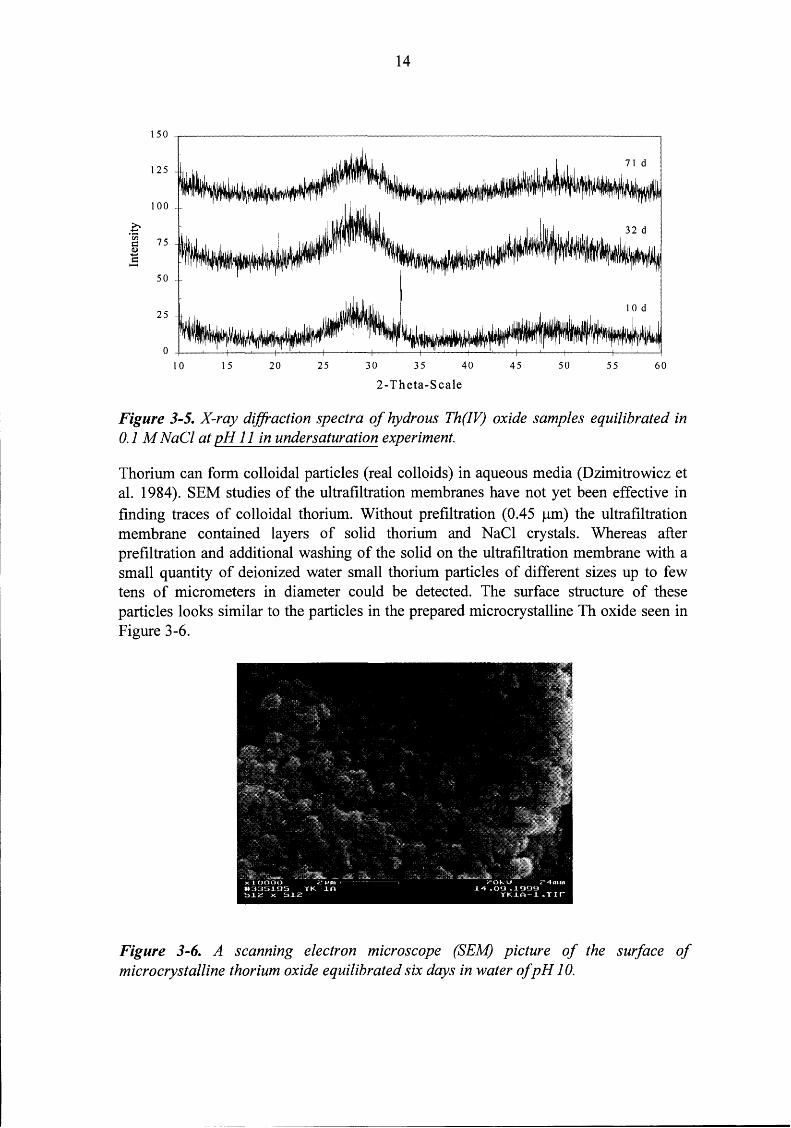
Figure 3-5. X-ray diffraction spectra of hydrous Th(IV) oxide samples equilibrated in 0.1 M NaCl at pH 11 in undersaturation experiment.
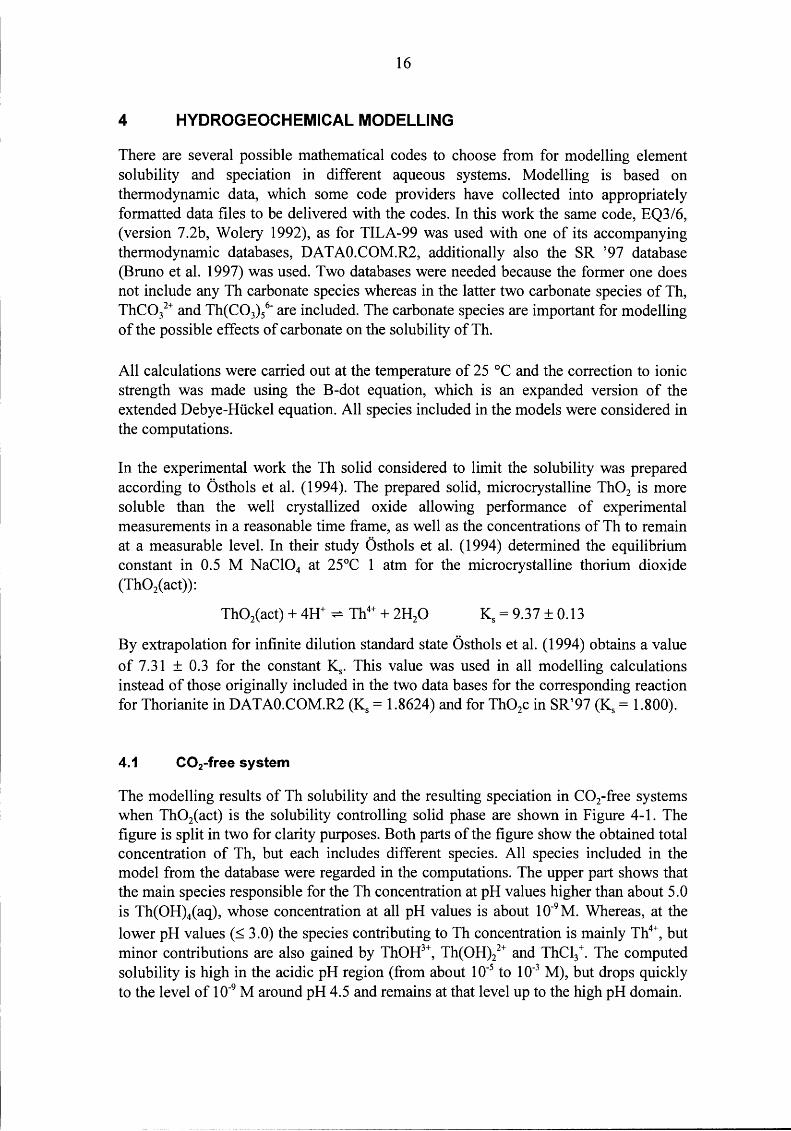
Thorium can form colloidal particles (real colloids) in aqueous media (Dzimitrowicz et al. 1984). SEM studies of the ultrafiltration membranes have not yet been effective in finding traces of colloidal thorium. Without prefiltration (0.45 J.!m) the ultrafiltration membrane contained layers of solid thorium and NaCl crystals. Whereas after prefiltration and additional washing of the solid on the ultrafiltration membrane with a small quantity of deionized water small thorium particles of different sizes up to few tens of micrometers in diameter could be detected. The surface structure of these particles looks similar to the particles in the prepared microcrystalline Th oxide seen in Figure 3-6.
Figure 3-6. A scanning electron microscope (SEM) picture of the surface of microcrystalline thorium oxide equilibrated six days in water of pH 10.

15
Transmission electron microscope (TEM) was also used as an effort for tracing colloidal particles of thorium. The only particles that were observed, however, were NaCl crystals, and no evidence of thorium was found.
16
4 HYDROGEOCHEMICAL MODELLING
There are several possible mathematical codes to choose from for modelling element solubility and speciation in different aqueous systems. Modelling is based on thermodynamic data, which some code providers have collected into appropriately formatted data files to be delivered with the codes. In this work the same code, EQ3/6, (version 7.2b, Wolery 1992), as for TILA-99 was used with one of its accompanying thermodynamic databases, DATAO.COM.R2, additionally also the SR '97 database (Bruno et al. 1997) was used. Two databases were needed because the former one does not include any Th carbonate species whereas in the latter two carbonate species of Th, ThCO/+ and Th(C03) 5
6- are included. The carbonate species are important for modelling
of the possible effects of carbonate on the solubility of Th.
All calculations were carried out at the temperature of 25 oc and the correction to ionic strength was made using the B-dot equation, which is an expanded version of the extended Debye-Hiickel equation. All species included in the models were considered in the computations.
In the experimental work the Th solid considered to limit the solubility was prepared according to Osthols et al. (1994). The prepared solid, microcrystalline Th02 is more soluble than the well crystallized oxide allowing performance of experimental measurements in a reasonable time frame, as well as the concentrations of Th to remain at a measurable level. In their study Osthols et al. (1994) determined the equilibrium constant in 0.5 M NaC104 at 25°C 1 atm for the microcrystalline thorium dioxide (ThOiact)):
By extrapolation for infinite dilution standard state Osthols et al. (1994) obtains a value of 7.31 ± 0.3 for the constant K5• This value was used in all modelling calculations instead of those originally included in the two data bases for the corresponding reaction for Thorianite in DATAO.COM.R2 (Ks = 1.8624) and for Th02c in SR'97 (Ks = 1.800).
4.1 C02-free system
The modelling results of Th solubility and the resulting speciation in C02- free systems when ThOiact) is the solubility controlling solid phase are shown in Figure 4-1. The figure is split in two for clarity purposes. Both parts of the figure show the obtained total concentration of Th, but each includes different species. All species included in the model from the database were regarded in the computations. The upper part shows that the main species responsible for the Th concentration at pH values higher than about 5.0 is Th(OH)iaq), whose concentration at all pH values is about 10-9 M. Whereas, at the lower pH values (~ 3 .0) the species contributing to Th concentration is mainly Th4
\ but minor contributions are also gained by ThOH3+, Th(OH)/+ and ThCl/. The computed solubility is high in the acidic pH region (from about 1 o-s to 1 o-3 M), but drops quickly to the level of 10-9 M around pH 4.5 and remains at that level up to the high pH domain.
17
1.0E-01
1.0E-02
1.0E-03
1.0E-04
1.0E-05 c; 1.0E-06 ~ 0 1.0E-07 .§. .c 1.0E-08 1-
1.0E-09 -a-rh tot
1.0E-10 --*-Th(4+)
1.0E-11 -+-Th0H(3+)
1.0E-12 --1:c- Th(OH)2(2+)
~ Th(OH)4(aq) 1.0E-13
2.0 3.0 4.0 5.0 6.0 7.0 8.0 9.0 10.0 11.0
1.0E-01
1.0E-02
1.0E-03
1.0E-04
1.0E-05 c; 1.0E-06 ~ 0 1.0E-07 .§. .c 1.0E-08 -a-rh tot 1- -+-Th(OH)3(+)
1.0E-09 -+-Th4(0H)8(8+) 1.0E-10 -+-Th2(0H)2(6+)
1.0E-11 ~ThCI(3+)
1.0E-12 -ThCI3(+)
----&-- ThCI2(2+) 1.0E-13
2.0 3.0 4.0 5.0 6.0 7.0 8.0 9.0 10.0 11.0
pH
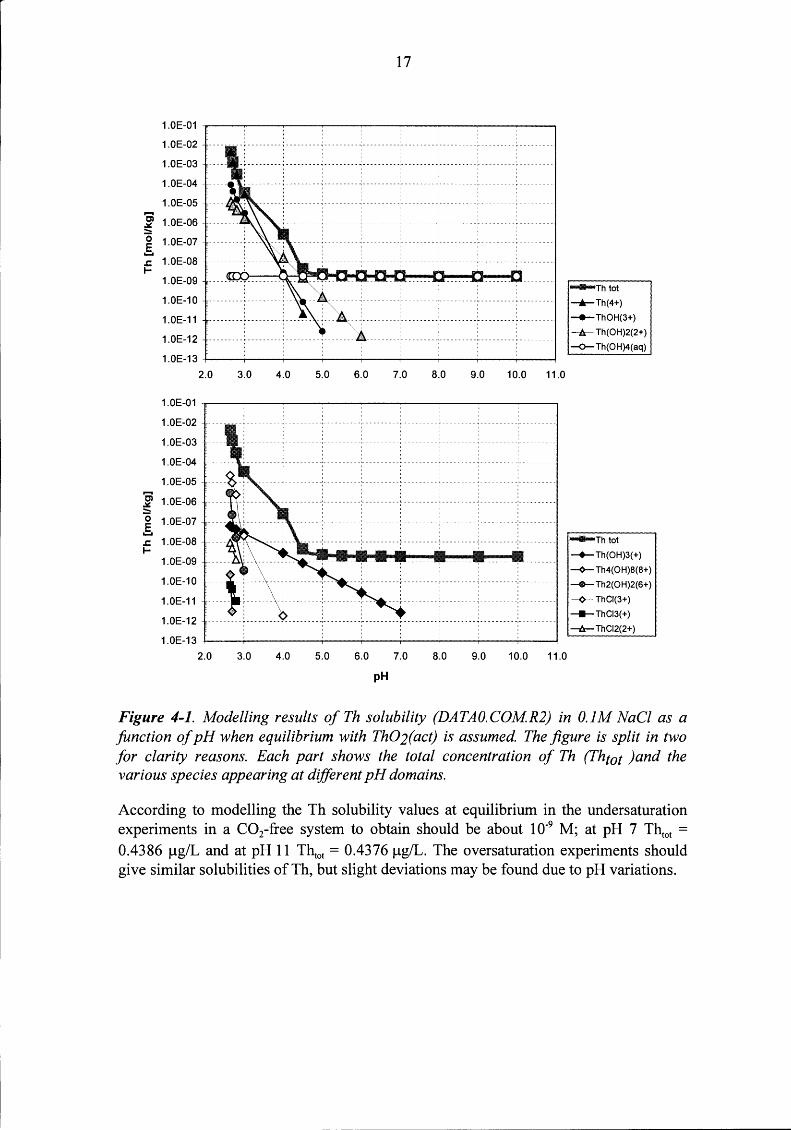
Figure 4-1. Modelling results of Th solubility (DATAO.COMR2) in O.JM NaCl as a function of pH when equilibrium with Th02(act) is assumed. The figure is split in two for clarity reasons. Each part shows the total concentration of Th (Thtot )and the various species appearing at different pH domains.
According to modelling the Th solubility values at equilibrium in the undersaturation experiments in a C02-free system to obtain should be about 10-9 M; at pH 7 T~ot =
0.4386 1-ig/L and at pH 11 T~ot = 0.4376 1-ig/L. The oversaturation experiments should give similar solubilities of Th, but slight deviations may be found due to pH variations.
18
4.2 C02 equilibrated system
The SR '97 database was used to model Th solubility and speciation in a 0.1 M NaCl system at different pH values at equilibrium with various partial pressures of C02, thus the computed system represents an open one and not a closed system. In order to be able to model the closed systems used in the experiments more detailed data should be available, inter alia the C02 content of the gas phase with which the solutions were equilibrated when closing the experiment vessels. However, also computed results on open systems can be used when evaluating some results obtained. In the database two Th carbonate species are included, ThCO/+ and Th(C03) 5
6- (in comparison, for U(IV)
only one, U(C03) 56-, is included). The considered solubility limiting phase was
ThOiact).
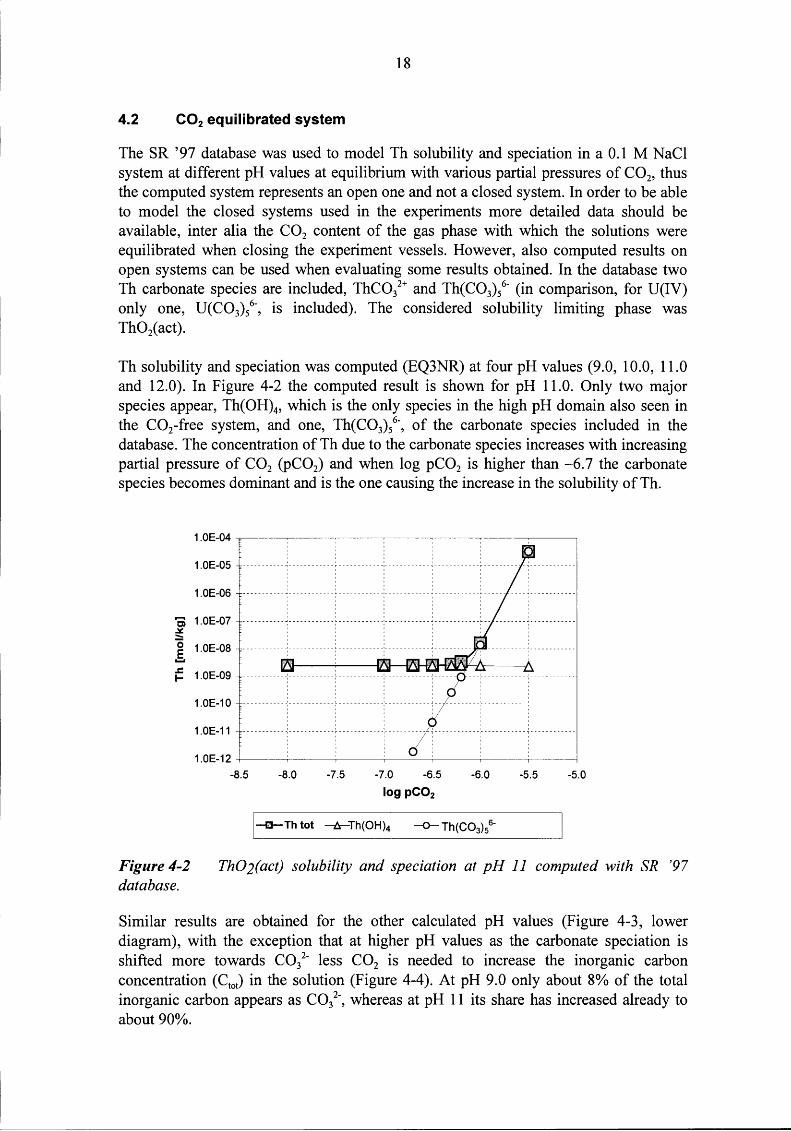
Th solubility and speciation was computed (EQ3NR) at four pH values (9.0, 10.0, 11.0 and 12.0). In Figure 4-2 the computed result is shown for pH 11.0. Only two major species appear, Th(OH)4, which is the only species in the high pH domain also seen in the C02-free system, and one, Th(C03)/-, of the carbonate species included in the database. The concentration of Th due to the carbonate species increases with increasing partial pressure of C02 (pC02) and when log pC02 is higher than -6.7 the carbonate species becomes dominant and is the one causing the increase in the solubility of Th.
c; ~ 0 .§. .c 1-
Figure4-2 database.
1.0E-04
1.0E-05
1.0E-06
1.0E-07
1.0E-08
1.0E-09
1.0E-10
1.0E-11
1.0E-12
-8.5 -8.0 -7.5 -7.0 -6.5 -6.0 -5.5 -5.0
log pC02
Th02(act) solubility and speciation at pH 11 computed with SR '97
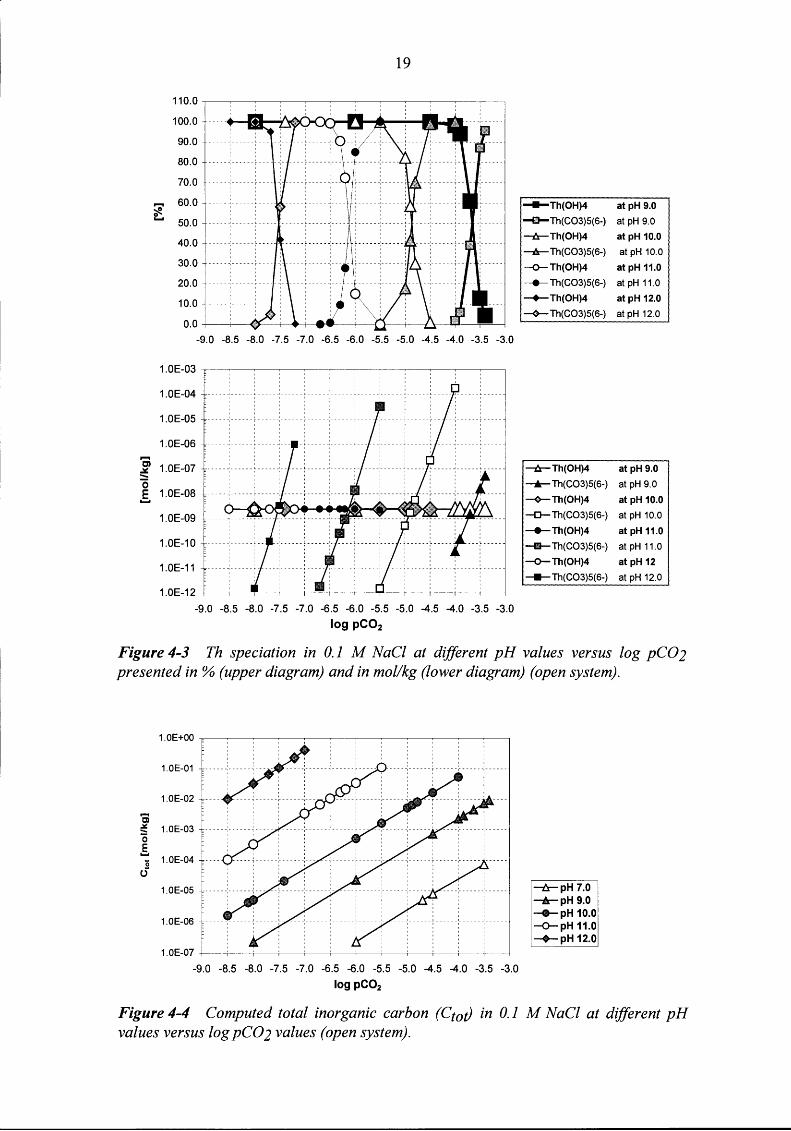
Similar results are obtained for the other calculated pH values (Figure 4-3, lower diagram), with the exception that at higher pH values as the carbonate speciation is shifted more towards C03
2- less C02 is needed to increase the inorganic carbon
concentration (C101) in the solution (Figure 4-4). At pH 9.0 only about 8% of the total inorganic carbon appears as C03
2-, whereas at pH 11 its share has increased already to
about 90%.
c; .lll:: -0 .§.
19
110.0 -.----~-~~-~~-~~-~-~~-~--.
100.0 +--------
90.0 +-----J ______ c
80.0 +----- -:----- c---+-:-1- -- _, _____ -:---1- --~-- ----:-----~~--I--:------
70.0 +-----,-------,-
40.0 +------:-----'-
30.0 +-----,-------,-
20.0 +-----·-------;-
10.0
0. 0 +---+-~Ci>----------+______..-+---_..,_____---+-----{ >----------+--__________, \--------"'1"--
-9.0 -8.5 -8.0 -7.5 -7.0 -6.5 -6.0 -5.5 -5.0 -4.5 -4.0 -3.5 -3.0
1.0E-06
1.0E-07
1.0E-08
1.0E-09
1.0E-10
1.0E-12 +-------t---"1"'----------t------t-----=---t------t-____.,~----j-----t----t---t---------------i
-9.0 -8.5 -8.0 -7.5 -7.0 -6.5 -6.0 -5.5 -5.0 -4.5 -4.0 -3.5 -3.0
log pC02
....... Th(OH)4 at pH 9.0
-fll-Th(C03)5(6-) at pH 9.0
-/r-Th(OH)4 at pH 10.0
-/r-Th(C03)5(6-) at pH 10.0
----o- Th(OH)4 at pH 11.0
--e- Th(C03)5(6-) at pH 11.0
~Th(OH)4 at pH 12.0
---<>- Th(C03)5(6-) at pH 12.0
-/r-Th(OH)4 at pH 9.0
__...._ Th(C03)5(6-) at pH 9.0
---<>- Th(OH)4 at pH 10.0
-o-Th(C03)5(6-) at pH 10.0
--+--Th(OH)4 at pH 11.0
- Th(C03)5(6-) at pH 11.0
-o-Th(OH)4 at pH 12
- Th(C03)5(6-) at pH 12.0
Figure 4-3 Th speciation in 0.1 M NaCl at different pH values versus log pC02 presented in % (upper diagram) and in mol/kg (lower diagram) (open system).
1.0E-01
1.0E-02
c; :!!: 1.0E-03 0 .§. B 1.0E-04
()
1.0E-05
1.0E-07 +---+---+-----r--+--+-----+--+-----+---+-----r--+-----------1
-9.0 -8.5 -8.0 -7.5 -7.0 -6.5 -6.0 -5.5 -5.0 -4.5 -4.0 -3.5 -3.0
log pC02
~pH7.0
-ir-pH 9.0 -e-pH10.0 -o-pH 11.0 -+-pH 12.0
Figure 4-4 Computed total inorganic carbon (CtotJ in 0.1 M NaCl at different pH values versus log pC02 values (open system).
20
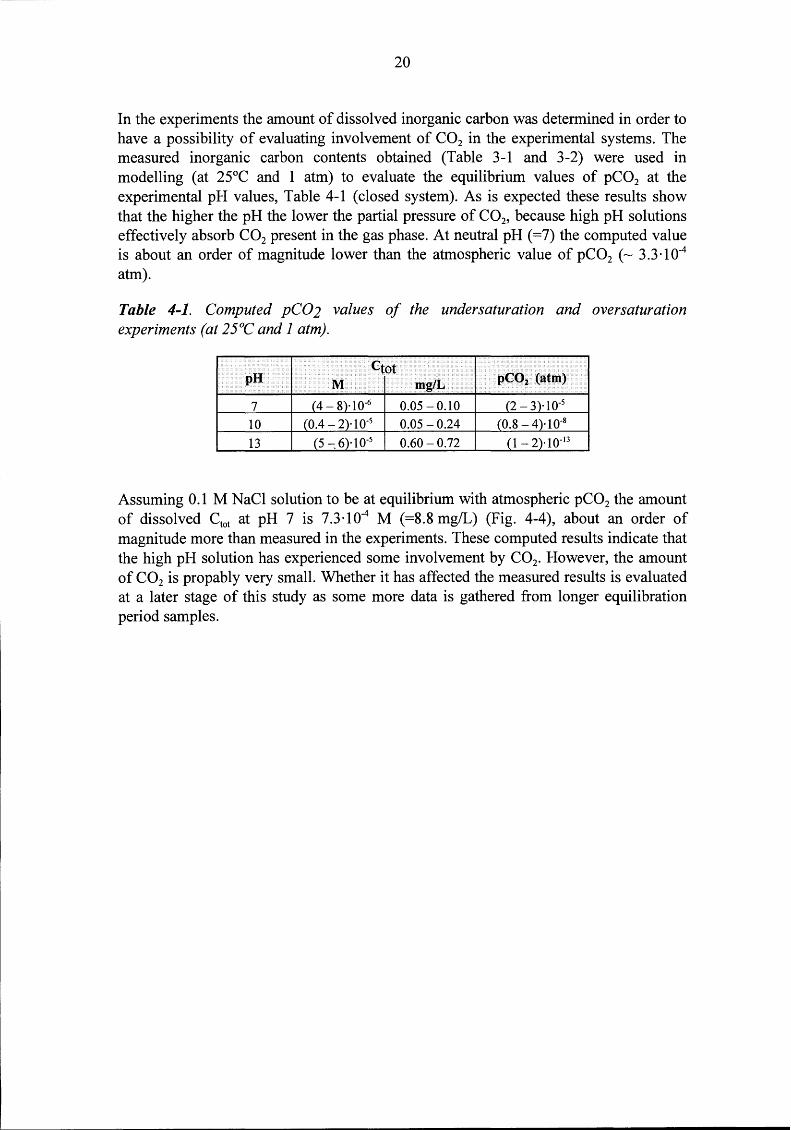
In the experiments the amount of dissolved inorganic carbon was determined in order to have a possibility of evaluating involvement of C02 in the experimental systems. The measured inorganic carbon contents obtained (Table 3-1 and 3-2) were used in modelling (at 25°C and 1 atm) to evaluate the equilibrium values of pC02 at the experimental pH values, Table 4-1 (closed system). As is expected these results show that the higher the pH the lower the partial pressure of C02, because high pH solutions effectively absorb C02 present in the gas phase. At neutral pH (=7) the computed value is about an order of magnitude lower than the atmospheric value of pC02 ('"" 3.3 ·1 o-4
atm).
Table 4-1. Computed pC02 values of the undersaturation and oversaturation experiments (at 25°C and 1 atm).
pH Ctot
pC01 (atm) M mg/L
7 (4- 8)- 10-6 0.05-0.10 (2- 3)-10-5
10 (0.4- 2)-1o-s 0.05-0.24 co.8- 4)-1 o-s
13 (5-: 6}10-5 0.60-0.72 (1- 2} 1o-n
Assuming 0.1 M NaCl solution to be at equilibrium with atmospheric pC02 the amount of dissolved Ctot at pH 7 is 7.3·10-4 M (=8.8mg/L) (Fig. 4-4), about an order of magnitude more than measured in the experiments. These computed results indicate that the high pH solution has experienced some involvement by C02• However, the amount of C02 is propably very small. Whether it has affected the measured results is evaluated at a later stage of this study as some more data is gathered from longer equilibration period samples.
21
5 CONCLUSIONS AND DISCUSSION
This ongoing study of determining solubility values of thorium by oversaturation and undersaturation experiments has proven to be challenging. Improvement in sampling procedures has been made in order to determine possible adsorbtion of thorium on filtering systems or in search of finding possible colloidal Th.
The solubility values obtained so far are generally at the same level compared to the results of other published studies of Ryan & Rai 1987, F elmy et al. 1991, and Neck & Kim 1999. Vuorinen et al. (1998) give the value of 4·10-8 M as a recommended solubility value forTh in reducing near- and far-field. The solubilities obtained in this study vary between 1 o-11-1 o-8 M in both oversaturation and undersaturation experiments. The small difference in the two values of 70 d results in the oversaturation experiment might be an evidence of adsorption of Th onto filters, but the difference being minimal no conclusion of adsorption could at this stage be made. However, possible adsorption of thorium onto membranes will be studied in future studies by filtering small aliquots of the samples and measuring if there is any change in Th concentration.
The concentration of thorium was measured with ICP-MS. The detection limit was improved during the work, as can be seen from Figures 3-1 and 3-2. Improvement was gained by changing dilution methods with the sample solutions as chloride ions caused interference in the ICP-MS. Further improvement of the detection limit of Th analysis will be tried by solvent extraction method with thenoyltrifluoroacetone (TT A) for separating Th from the chloride matrix (Bertrand & Choppin 1982, Felmy et al. 1991). This is necessary taking into account the future experiments with reference groundwaters, which are chloride rich.
The pH values of the samples decreased during equilibration (Table 3-1 and 3-2). Felmy et al. (1991) explain such a change in the hydrogen ion concentration by the possible exchange between Na+ and H+ ions according to reaction
They found a peak indicating minor quantities of formed solid Na2 Th03 in their x-ray diffraction spectrum ( d-value = 4.54 A). Within this work, however, even after a long measurement of a sample with a good resolution no traces of peaks indicating presence ofNa2Th03 (s) were detected. On the other hand this could result from the lower sodium concentration of the equilibration solution compared to that of F elmy et al. ( 1991) who observed such a peak from samples equilibrated in 3 M NaCl. Another explanation for the slight decrease in pH may be due to small amounts of C02 dissolved in the experimental systems during the equilibration periods. Further evaluation of the pH behaviour is included in future studies.
The x-ray diffraction measurements clearly showed that the precipitates formed are amorphous. Following the growth of one to three humps which are compared to the corresponding peaks of crystalline Th02 (Appendix 4, Fig. A4-1 ), is one way of following the amorphous solid developing to a more crystalline solid. From Figures 3.3-
22
3.5 the shape of the spectra of oversaturation samples seem to develop more clearly and rapidly compared to the spectra of undersaturation samples. This can also be seen from the d-value and 29-angle parameters in Table 3-3. Whether this means that the rate of crystallization is somehow faster in highly alkalic conditions is difficult to say. The sharp peak around 3 3 degrees in the 28-scale in some spectra is an interference caused by the silicon plates used in x-ray diffraction measurements.
Scanning electron microscope studies in finding colloidal Th particles on ultrafiltration membranes was difficult because of the lack of resolution of the SEM. Scanning geometry when dealing with membranes is not ideal for high resolution determination. Knopp et al. (1999) have determined the average size of thorium colloids to be 15±5 nm in diameter in 0.1 M HN03 solution of [Th] = 1x1o-s M at the pH values between pH 1 and pH 10. They used a laser-induced breakdown detection (LIBD) method. In future studies ultracentrifugation will be tried in tracing Th colloids from ultrafiltrates and the possible solid obtained will be examined with TEM.
Some considerations can be given at this stage of the comparison between the experimental results and the modelled ones. The computed solubility values forTh in a C02-free system indicate that at pH values higher than about 5.5 the solubility stays constantly at the level of2·10-9 M. These values and the measured Th values obtained in the oversaturation experiments for the 70-day equilibration period (Appendix 2, Table A2-2) are within the same order of magnitude. Whereas, the measured values for the shorter equilibration periods are somewhat scattered, either about an order of magnitude lower (10 and 30 d) or higher (22 d). Further evaluation and discussions are presented in a future report after finishing the ongoing studies.
Aknow/edgements
X-ray diffraction measurements were made by Antti Niskanen from Laboratory of Inorganic Chemistry in Department of Chemistry of University of Helsinki. With electron microscope studies valuable knowledge of Jyrki Juhanoja from the Department of Electron Microscopy of University of Helsinki was used.
23
6 REFERENCES
Baes, C. F Jr. & Mesmer, R. E. (1986) The hydrolysis of cations. Malabar, Florida, USA: Krieger Publishing Company, 489 p.
Bertrand, P. A. & Choppin, G. R. (1982) Separation of actinides in different oxidation states by solvent extraction. Radiochimica Acta 31, pp. 135-137.
Bruno, J, Cera, E., de Pablo, J, Duro, L., Jordana, S. & Savage, D. (1997). Determination of radionuclide solubility limits to be used in SR'97 Uncertainties associated to calculated solubilities. Stockholm, Sweden: Swedish Nuclear Fuel Waste Management Co. SKB TR 97-33, 176 p.
Clesceri, L. S., Greenberg, A. E. & Trussel, R. R. (1989) Standard methods of the examination of water and wastewater. 17th ed., Washington, USA: American Public Health Association. pp. 2-30-2-38 and 4-13-4-20.
Dzimitrowicz, D. J, Wiseman, P. J & Cherns, D. (1984) An electron microscope study
of hydrous thorium dioxide Th02 x nH20. Journal of Colloid and Interface Science 103, pp. 170-177.
Felmy, R. A., Rai, D. & Mason, M J (1991) The solubility of hydrous thorium(IV) oxide in chloride media: development of aqueous ion-interaction model. Radiochimica Acta 55, pp. 177-185.
Felmy, R. A., Rai, D. & Mason, M J (1993) Solid phase precipitates and anionic aqueous thorium fluoride complexes in the Na- NH4 - Th- F- H20 system to high concentration. Radiochimica Acta 62, pp. 133-139.
Gran, G. (1950) Determination of the equivalent point in potentiometric titrations. Acta Chemica Scandinavica 4, pp. 559-577.
Knopp, R., Bundschuh, T, Kim, J 1 & Neck, V (1999) Application of laser-induced breakdown detection method for the quantification of Th(IV)-colloid formation. In: Proceedings of the seventh international conference on the chemistry and migration behaviour of actinides and fission products in the geosphere. Lake Tahoe, Nevada/California, USA. September 26- October 1, 1999, 158 p.
Neck, V & Kim, J 1 (1999) Solubility and hydrolysis of tetravalent actinides. Karlsruhe, Germany: Forschungszentrum Karlsruhe GmbH. Wissenschaftliche Berichte, FZKA-6350, 37 p.
Nitsche, H (1991) Solubility studies of transuranium elements for nuclear waste disposal: principles and overview. Radiochimica Acta 52/53, pp. 3-8.
24
Nitsche, H, Roberts K, Prussin, T, Muller, A., Becraft, K, Keeney, D., Carpenter, S.A. & Gatti, R. C. (1994). Measured Solubilities and Speciations from Oversaturation Experiments ofNeptunium, Plutonium, and Americium in UE-25p#1 Well Water from the Yucca Mountain Region, Milestone Report 3329-WBS1.2.3.4.1.3.1, LA-12563-MS, UC-802.
Ollila, K. & Ahonen, L. (1998). Solubilities of uranium for TILA-99. Helsinki, Finland: Posiva Oy, POSIVA-98-13, 57 p.
Osthols, E., Bruno, J. & Grenthe, 1 (1994) On the influence of carbonate on mineral dissolution: Ill. The solubility of microcrystalline Th02 in C02 - H20 media. Geochimica et Cosmochimica Acta 58, No. 2, pp. 613-623.
Ryan, J. L. & RaiD. (1987) Thorium(IV) hydrous oxide solubility. Inorganic Chemistry 26, pp. 4140-4142.
Wolery TJ., (1992). EQ3/6, A Software Package for Geochemical Modeling of Aqueous Systems (Version 7.0). Livermore, CA, USA: Lawrence Livermore National Laboratory. UCRL-MA-110662 PT I-IV (PT I, September 14, 1992 66 p.; PT 11 December 17, 1992 89 p.; PT Ill, September 14, 1992 246 p.; PT IV, October 9, 1992, 338 p.)
Vuorinen, U., Kulmala, S., Hakanen, M, Ahonen, L. & Carlsson, T (1998) Solubility database for TILA-99. Helsinki, Finland: Posiva Oy, POSIVA-98-14, 117 p.
25
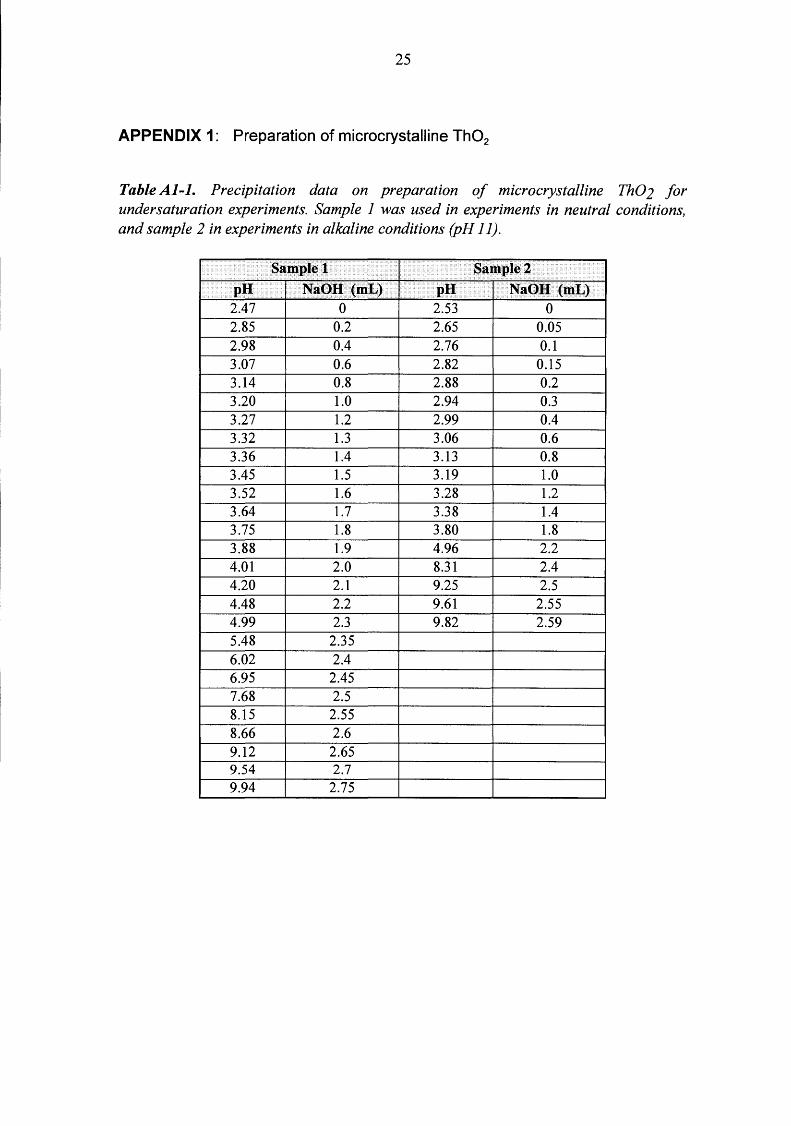
APPENDIX 1: Preparation of microcrystalline Th02
Table Al-l. Precipitation data on preparation of microcrystalline Th02 for undersaturation experiments. Sample 1 was used in experiments in neutral conditions, and sample 2 in experiments in alkaline conditions (pH 11).
SampleJ Sample2 pH NaOH (mL) pH NaOH (mL)
2.47 0 2.53 0 2.85 0.2 2.65 0.05 2.98 0.4 2.76 0.1 3.07 0.6 2.82 0.15 3.14 0.8 2.88 0.2 3.20 1.0 2.94 0.3 3.27 1.2 2.99 0.4 3.32 1.3 3.06 0.6 3.36 1.4 3.13 0.8 3.45 1.5 3.19 1.0 3.52 1.6 3.28 1.2 3.64 1.7 3.38 1.4 3.75 1.8 3.80 1.8 3.88 1.9 4.96 2.2 4.01 2.0 8.31 2.4 4.20 2.1 9.25 2.5 4.48 2.2 9.61 2.55 4.99 2.3 9.82 2.59 5.48 2.35 6.02 2.4 6.95 2.45 7.68 2.5 8.15 2.55 8.66 2.6 9.12 2.65 9.54 2.7 9.94 2.75
26
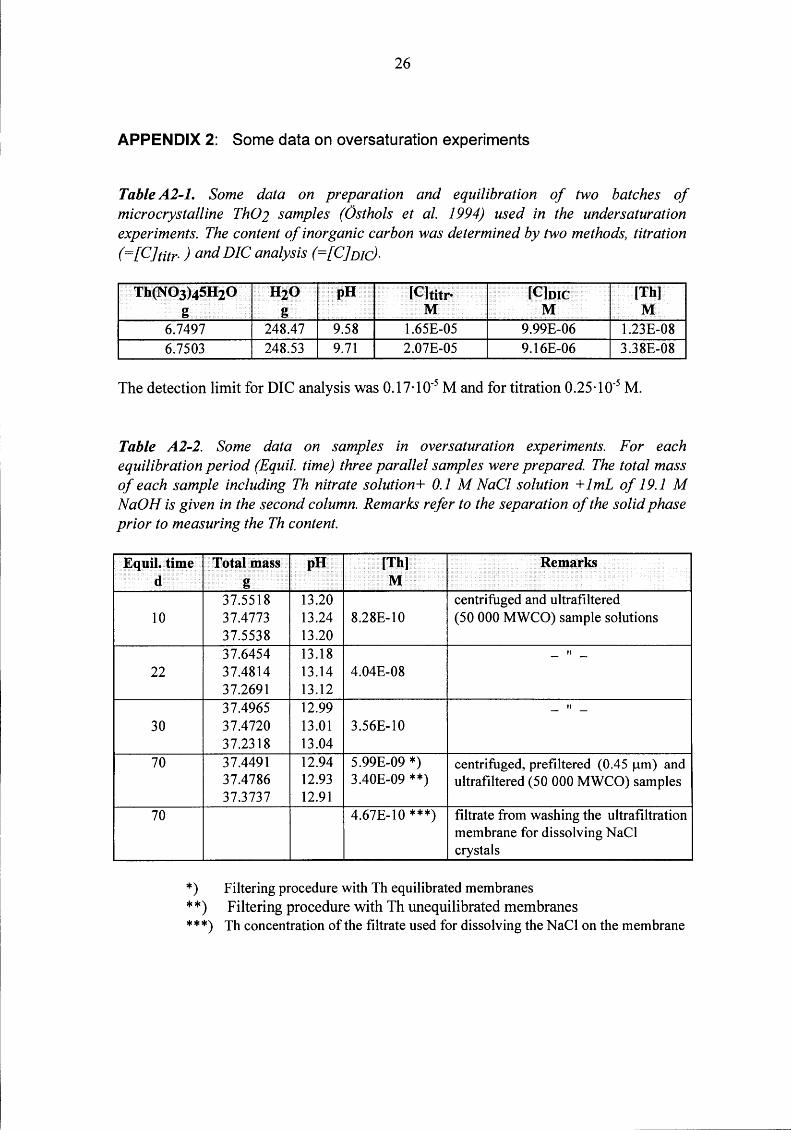
APPENDIX 2: Some data on oversaturation experiments
Table A2-1. Some data on preparation and equilibration of two batches of microcrystalline ThO 2 samples (Osthols et al. 1994) used in the under saturation experiments. The content of inorganic carbon was determined by two methods, titration (=[Cltitr·) and DIC analysis (=[C]nic).
Th(N03)45H20 H20 pH [C1titr· [C]niC [Th] g g M M M
6.7497 248.47 9.58 1.65E-05 9.99E-06 1.23E-08 6.7503 248.53 9.71 2.07E-05 9.16E-06 3.38E-08
The detection limit for DIC analysis was 0.17·10-5 M and for titration 0.25·10-5 M.
Table A2-2. Some data on samples in oversaturation experiments. For each equilibration period (Equil. time) three parallel samples were prepared. The total mass of each sample including Th nitrate solution+ 0.1 M NaCl solution + 1 mL of 19.1 M NaOH is given in the second column. Remarks refer to the separation of the solid phase prior to measuring the Th content.
Equil.time Total mass pH (Th] Remarks d g M
37.5518 13.20 centrifuged and ultrafiltered 10 37.4773 13.24 8.28E-10 (50 000 MWCO) sample solutions
37.5538 13.20 37.6454 13.18 - " -
22 37.4814 13.14 4.04E-08 37.2691 13.12 37.4965 12.99 - " -
30 37.4720 13.01 3.56E-10 37.2318 13.04
70 37.4491 12.94 5.99E-09 *) centrifuged, prefiltered (0.45 J.Lm) and 37.4786 12.93 3.40E-09 **) ultrafiltered (50 000 MWCO) samples 37.3737 12.91
70 4.67E-10 ***) filtrate from washing the ultrafiltration membrane for dissolving NaCl crystals
*) Filtering procedure with Th equilibrated membranes **) Filtering procedure with Th unequilibrated membranes ***) Th concentration of the filtrate used for dissolving the NaCl on the membrane
27
APPENDIX 3: Some data on undersaturation experiments
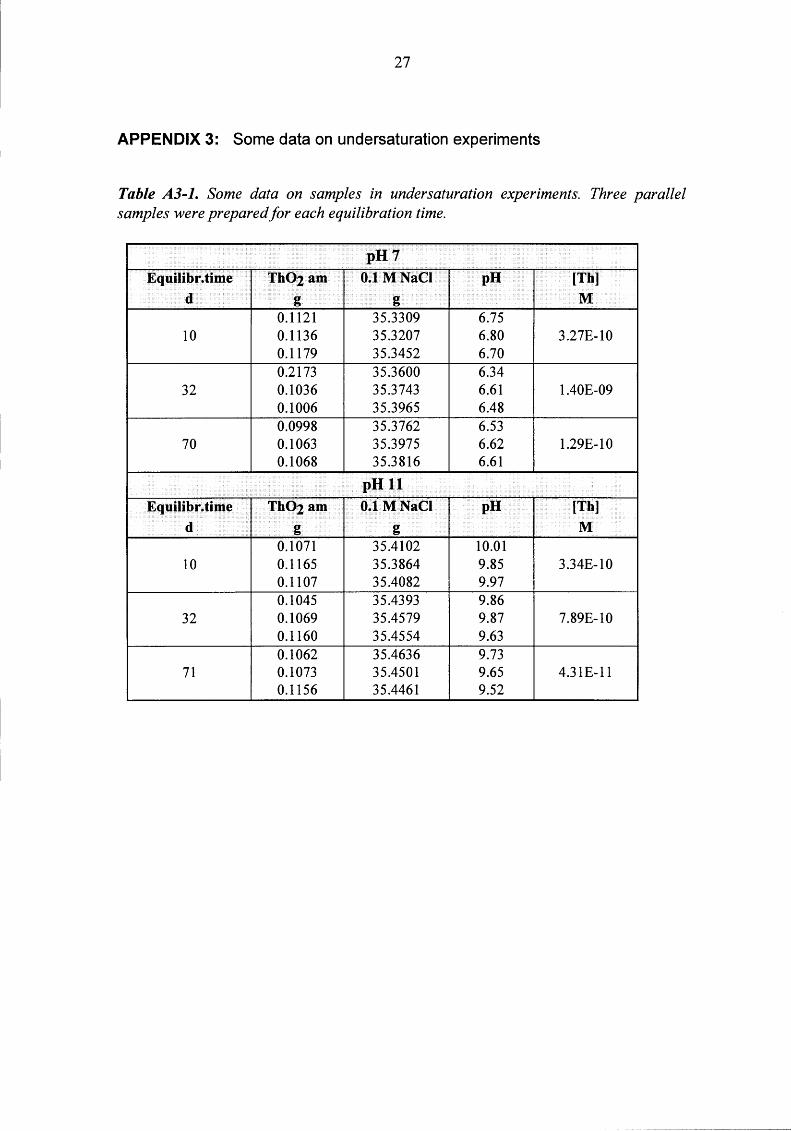
Table A3-1. Some data on samples in undersaturation experiments. Three parallel samples were prepared for each equilibration time.
pH7 Equilibr.time ThOzalll 0.1 MNaCI pH [Th]
d g g M 0.1121 35.3309 6.75
10 0.1136 35.3207 6.80 3.27E-10 0.1179 35.3452 6.70 0.2173 35.3600 6.34
32 0.1036 35.3743 6.61 1.40E-09 0.1006 35.3965 6.48 0.0998 35.3762 6.53
70 0.1063 35.3975 6.62 1.29E-10 0.1068 35.3816 6.61
pHll Equilibr.time Th02am 0.1 MNaCI pH [Th]
d g g M 0.1071 35.4102 10.01
10 0.1165 35.3864 9.85 3.34E-10 0.1107 35.4082 9.97 0.1045 35.4393 9.86
32 0.1069 35.4579 9.87 7.89E-10 0.1160 35.4554 9.63 0.1062 35.4636 9.73
71 0.1073 35.4501 9.65 4.31E-11 0.1156 35.4461 9.52
28
APPENDIX 4: X-ray diffraction spectra of synthetic Th solids
4000
3500 ""'" 0\ V\ r-..: N
2500
~ bb
N 1.0 la ""'" ""'" o· 00 ..... .,; ..,r ..... 1 V\ N
~ ...-i
3000
.£ .!b bb bb 1.0 la la
~ 2000 (1)
E -~ o--· r--"
r-- 1.0 ;;:; r-- 00
~ ~ ~
bb 4 i ~ la -o ;c) 1500 .,., V\
r-- ~ 0\ bb r--N la .!b ...-1
1000 V\
~
~\..._ 1~ .)\....., lJL_ .J
500
0
25 30 35 40 45 50 55 60
2-Theta-Scale
FigureA4-1. Spectrum of synthetic Th02 (c) (Fluka, 89170)
60
50
40
.c ..... I'll
30 ~ Q)
15 - 20
10
0
25 30 35 40 45 50 55 60
2-Theta-Scale
FigureA4-2. Spectrum of synthetic Th(N03)4 5H20 (Fluka, 89150).