Embed Size (px)
Citation preview
Solubility limits in the Waste-EBS and
Host Rock
OPERA-PU-NRG742

Radioactive substances and ionizing radiation are used in medicine, industry, agriculture, research, education and electricity production. This generates radioactive waste. In the Netherlands, this waste is collected, treated and stored by COVRA (Centrale Organisatie Voor Radioactief Afval). After interim storage for a period of at least 100 years radioactive waste is intended for disposal. There is a world-wide scientific and technical consensus that geological disposal represents the safest long-term option for radioactive waste. Geological disposal is emplacement of radioactive waste in deep underground formations. The goal of geological disposal is long-term isolation of radioactive waste from our living environment in order to avoid exposure of future generations to ionising radiation from the waste. OPERA (OnderzoeksProgramma Eindberging Radioactief Afval) is the Dutch research programme on geological disposal of radioactive waste. Within OPERA, researchers of different organisations in different areas of expertise will cooperate on the initial, conditional Safety Cases for the host rocks Boom Clay and Zechstein rock salt. As the radioactive waste disposal process in the Netherlands is at an early, conceptual phase and the previous research programme has ended more than a decade ago, in OPERA a first preliminary or initial safety case will be developed to structure the research necessary for the eventual development of a repository in the Netherlands. The safety case is conditional since only the long-term safety of a generic repository will be assessed. OPERA is financed by the Dutch Ministry of Economic Affairs and the public limited liability company Electriciteits-Produktiemaatschappij Zuid-Nederland (EPZ) and coordinated by COVRA. Further details on OPERA and its outcomes can be accessed at www.covra.nl. This report concerns a study conducted in the framework of OPERA. The conclusions and viewpoints presented in the report are those of the author(s). COVRA may draw modified conclusions, based on additional literature sources and expert opinions. A .pdf version of this document can be downloaded from www.covra.nl. OPERA-PU-NRG742 Title: Solubility limits in the Waste-EBS and Host Rock Authors: T.J. Schröder, J.C.L. Meeussen, E.Rosca-Bocancea (NRG) Date of publication: 14 September 2017 Keywords: solubility, safety assessment, geochemical modelling, Boom Clay
DRAFT
Table of content Table of content .........................................................................................1 Summary ..................................................................................................1 Samenvatting .............................................................................................1 1. Introduction .........................................................................................3
1.1. Background ....................................................................................3 1.2. Objectives ......................................................................................3 1.3. Realization .....................................................................................4 1.4. Explanation contents .........................................................................4
2. General concepts ...................................................................................5 2.1. Mineral solubility ..............................................................................5 2.2. Elemental solubility ..........................................................................6
3. Selection of radionuclides of relevance .........................................................9 3.1. Evaluation of soluble radionuclide concentrations .......................................9 3.2. Evaluation of relevance for the long-term safety ...................................... 14
4. Derivation of solubility limits ................................................................... 17 4.1. Solubility in the Waste-EBS compartment ............................................... 17
4.1.1. Aim ...................................................................................... 17 4.1.2. Procedure ............................................................................... 17 4.1.3. Results .................................................................................. 17 4.1.4. Conclusions ............................................................................. 21
4.2. Solubility in the Host Rock compartment ............................................... 22 4.2.1. Uranium ................................................................................. 22 4.2.2. Neptunium .............................................................................. 23
5. Proposed set of solubility limits for the OPERA PA .......................................... 25 References .............................................................................................. 27 Appendix A: Calculated solubility in Waste-EBS and Host Rock ................................. 31 References Appendix .................................................................................. 37

DRAFT
OPERA-PU-NRG742 DRAFT Page 1 of 39
Summary In this report, solubility limits for radionuclides in the Waste-EBS and Host Rock compartment are derived for the purpose of performance assessment calculations (PA). First, it is established for which elements a solubility limit is of relevance, subsequently for this set of elements solubility limits are derived, and finally the resulting values are compared with the limits as applied in the Belgian research programme.
Samenvatting In dit rapport zijn oplosbaarheidslimieten voor radionucliden in de Waste-EBS en Host Rock compartimenten afgeleid, ten behoefde van het doorvoeren van een zogenaamde ‘performance assessment' (PA). Hiervoor is als eerste uitgezocht, voor welke radionucliden een oplosbaarheidslimit van belang zou kunnen zijn. Voor deze radionucliden zijn vervolgens oplosbaarheidslimiten afgeleid. De berekende waarden zijn tenslotte vergeleken met de oplosbaarheidslimieten die in het Belgische onderzoeksprogramma toegepast worden.

OPERA-PU-NRG742 DRAFT Page 2 of 39
OPERA-PU-NRG742 DRAFT Page 3 of 39
1. Introduction
1.1. Background
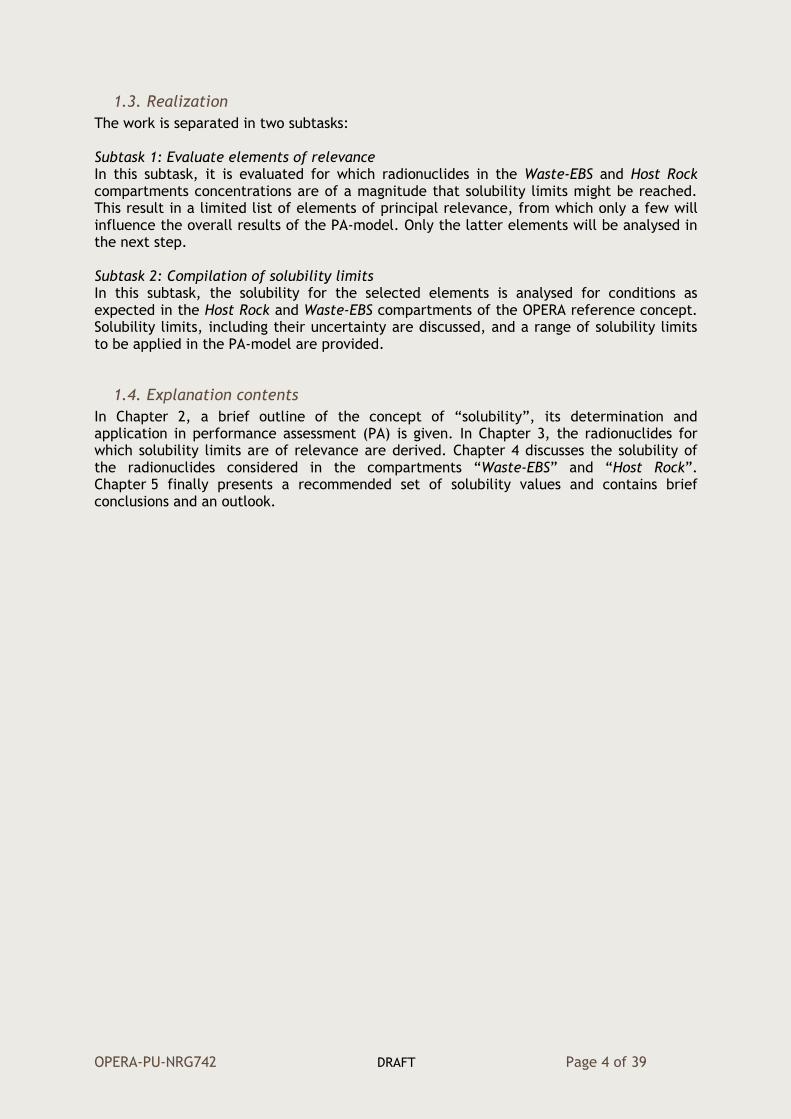
The five-year research programme for the geological disposal of radioactive waste – OPERA- started on 7 July 2011 with an open invitation for research proposals. In these proposals, research was proposed for the tasks described in the OPERA Research Plan [1]. In the OPERA research programme, all safety relevant aspects of a given generic reference disposal concept for radioactive waste [2] are evaluated and assessed in order to evaluate the long-term safety of such a facility [1]. The programme follows in general terms the methodology known as 'Safety Case' [3, 4, 5]. The central part of the Safety Case is formed by safety assessment calculations that will be performed in order to investigate potential risks of a disposal concept. In case of the OPERA Safety Case for a disposal concept in Boom Clay, the slow migration of radionuclides is expected to play a relevant role in the long-term safety of such a disposal concept. On April 21st, 2017 an OPERA OSCG-meeting was held, and the preliminary outcomes of the PA calculations of the NES case ‘N1-DV’ were presented by NRG. The outcomes and its implication for communicating the results in a public OSC-report were discussed by the OSCG, which resulted in a more detailed definition of the assessment strategy. Some adaptation of the applied PA-approach and further refinement of model components were suggested. A list of actions was agreed, from which this report addresses Task 2, “Solubility limits in the Waste-EBS and Host Rock”.
1.2. Objectives
The solid-solution partitioning of elements can be influenced by precipitation or mineral formation. Within the assessment strategy as discussed at the OSCG meeting, considerations are to establish solubility limits for a wider range of radionuclides both for the Host Rock and for the Waste-EBS compartment, in order to define a best estimate of the barrier’s performance. In the preliminary calculations discussed with the OSCG only one solubility limit in the PA-model was applied: for uranium in the Waste-EBS compartment. The uncertainties related to the solubility of radionuclides in an anaerobic, complex natural medium as Boom Clay and in the degrading cementitious matrix of the EBS are large. This makes the use of solubility limits in a PA-model, although technical simple to implement, disputable. The objective of this action is therefore to provide solubility limits of radionuclides in the Host Rock and Waste-EBS compartments for the Normal evolution scenario (NES) in case these are assessed to be relevant, i.e. in case concentrations in the compartments are in the order of magnitude that solubility limits apply, and application of solubility limits will relevantly affect the overall safety of the disposal system. This avoids unnecessary work and allows focussing on (few) relevant radionuclides. Besides, it also helps to avoid unnecessary discussions about the selected parameter values that have no beneficial influence on safety.
OPERA-PU-NRG742 DRAFT Page 4 of 39
1.3. Realization
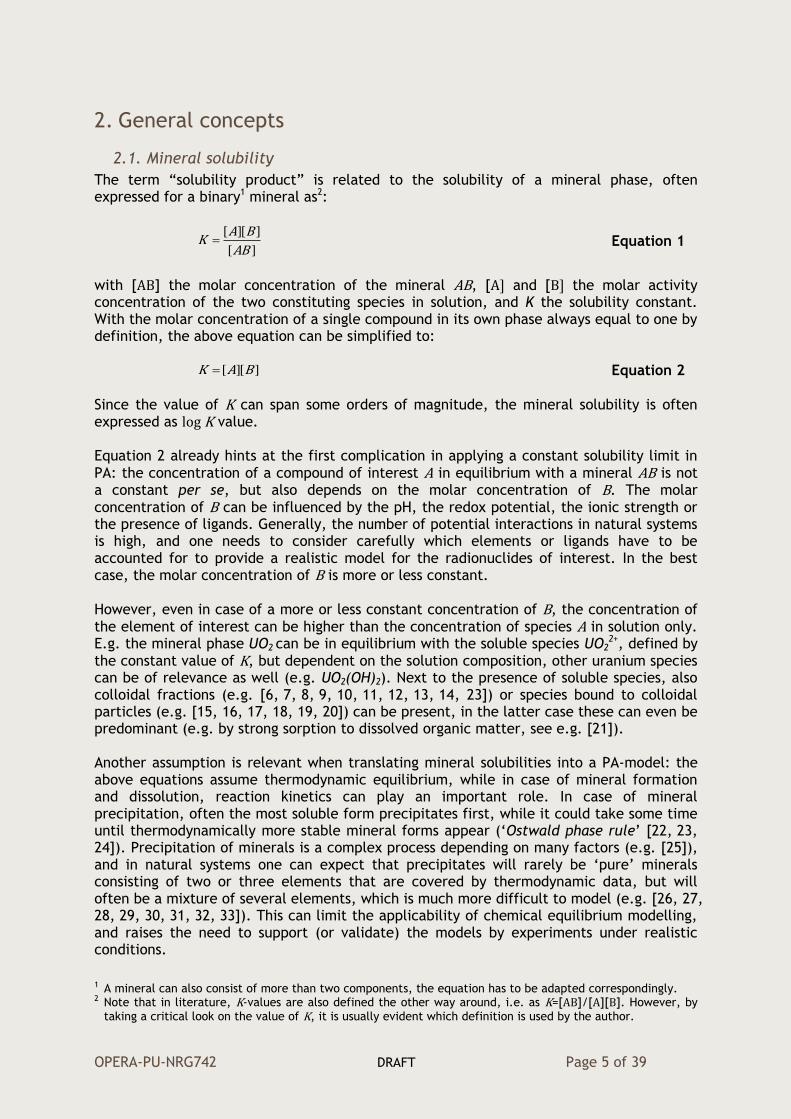
The work is separated in two subtasks: Subtask 1: Evaluate elements of relevance In this subtask, it is evaluated for which radionuclides in the Waste-EBS and Host Rock compartments concentrations are of a magnitude that solubility limits might be reached. This result in a limited list of elements of principal relevance, from which only a few will influence the overall results of the PA-model. Only the latter elements will be analysed in the next step. Subtask 2: Compilation of solubility limits In this subtask, the solubility for the selected elements is analysed for conditions as expected in the Host Rock and Waste-EBS compartments of the OPERA reference concept. Solubility limits, including their uncertainty are discussed, and a range of solubility limits to be applied in the PA-model are provided.
1.4. Explanation contents
In Chapter 2, a brief outline of the concept of “solubility”, its determination and application in performance assessment (PA) is given. In Chapter 3, the radionuclides for which solubility limits are of relevance are derived. Chapter 4 discusses the solubility of the radionuclides considered in the compartments “Waste-EBS” and “Host Rock”. Chapter 5 finally presents a recommended set of solubility values and contains brief conclusions and an outlook.
OPERA-PU-NRG742 DRAFT Page 5 of 39
2. General concepts
2.1. Mineral solubility
The term “solubility product” is related to the solubility of a mineral phase, often expressed for a binary1 mineral as2:
][
]][[
AB
BAK Equation 1
with [AB] the molar concentration of the mineral AB, [A] and [B] the molar activity concentration of the two constituting species in solution, and K the solubility constant. With the molar concentration of a single compound in its own phase always equal to one by definition, the above equation can be simplified to:
]][[ BAK Equation 2 Since the value of K can span some orders of magnitude, the mineral solubility is often expressed as log K value. Equation 2 already hints at the first complication in applying a constant solubility limit in PA: the concentration of a compound of interest A in equilibrium with a mineral AB is not a constant per se, but also depends on the molar concentration of B. The molar concentration of B can be influenced by the pH, the redox potential, the ionic strength or the presence of ligands. Generally, the number of potential interactions in natural systems is high, and one needs to consider carefully which elements or ligands have to be accounted for to provide a realistic model for the radionuclides of interest. In the best case, the molar concentration of B is more or less constant. However, even in case of a more or less constant concentration of B, the concentration of the element of interest can be higher than the concentration of species A in solution only. E.g. the mineral phase UO2 can be in equilibrium with the soluble species UO2
2+, defined by the constant value of K, but dependent on the solution composition, other uranium species can be of relevance as well (e.g. UO2(OH)2). Next to the presence of soluble species, also colloidal fractions (e.g. [6, 7, 8, 9, 10, 11, 12, 13, 14, 23]) or species bound to colloidal particles (e.g. [15, 16, 17, 18, 19, 20]) can be present, in the latter case these can even be predominant (e.g. by strong sorption to dissolved organic matter, see e.g. [21]). Another assumption is relevant when translating mineral solubilities into a PA-model: the above equations assume thermodynamic equilibrium, while in case of mineral formation and dissolution, reaction kinetics can play an important role. In case of mineral precipitation, often the most soluble form precipitates first, while it could take some time until thermodynamically more stable mineral forms appear (‘Ostwald phase rule’ [22, 23, 24]). Precipitation of minerals is a complex process depending on many factors (e.g. [25]), and in natural systems one can expect that precipitates will rarely be ‘pure’ minerals consisting of two or three elements that are covered by thermodynamic data, but will often be a mixture of several elements, which is much more difficult to model (e.g. [26, 27, 28, 29, 30, 31, 32, 33]). This can limit the applicability of chemical equilibrium modelling, and raises the need to support (or validate) the models by experiments under realistic conditions.
1 A mineral can also consist of more than two components, the equation has to be adapted correspondingly. 2 Note that in literature, K-values are also defined the other way around, i.e. as K=[AB]/[A][B]. However, by
taking a critical look on the value of K, it is usually evident which definition is used by the author.

OPERA-PU-NRG742 DRAFT Page 6 of 39
Altogether, the above limits the ability to model the solubility of a mineral by speciation calculation [34, 22, 35], even while much effort is taken in radioactive waste management and elsewhere to compile consistent, critical databases that address thousands of species interactions (e.g. [34, 36, 37]) for this type of calculations. For complex mixtures as present in a natural system, model predictions should be envisaged with care: in an expert judgement exercise as part of the PAMINA project [38], experts were asked to calculate the solubility of Ra, Sn, Se, U and Pu for a disposal situation. Despite the use of comparable databases and programmes, varying results were found, and for the 90%-confidence intervals, ranges from three up to seven (!) orders of magnitude were given. The complexity of the processes described above makes also the measurement of mineral solubilities in a complex, natural media cumbersome and difficult to interpret: to take an undisturbed sample in the deep subsurface can be quite challenging with respect to the oxidation state and its high internal gas pressure. Only a few techniques exist that may allow to directly measure species concentrations or activities in a complex medium (e.g. [39, 40]), and for natural, unaltered samples, species concentrations might be too low to use such techniques. Additional complexity comes from the redox-sensitivity of the mineral speciation of a large number of elements of interest, as example here serves the extensive research on the complex reduction/oxidation behaviour of the otherwise poorly adsorbing 79Se which is performed as part of the Belgian research programme (e.g. [41, 42, 43, 44]). In conclusion, within the limited scope of this study it is impossible to critically evaluate the rich literature on mineral solubility and derive values for it. Geochemical modelling may provide some insights into the principal behaviour of an element, but is often not capable to evaluate elemental solubilities in complex media quantitatively. Any approach chosen might also contain some degree of subjectivity, therefore a more modest approach is followed here, aiming at elaborating solubility only for elements which relevantly affect the dose rate.
2.2. Elemental solubility
Based on the consideration in the previous section, we define here the term “solubility” or “solubility limit” in a more practical way, with an eye on the implementation of this value in a PA-model. The solubility of a radionuclide defines its concentration in the soluble phase, i.e. the sum of all free soluble species and colloidal radionuclides, i.e. the amount sorbed to colloidal phases, e.g. dissolved organic matter, or present as e.g. Eigencolloid. The solubility limit then defines the highest assumed concentration in solution that may appear in case sufficient total amounts are present. With respect to the solubility ranges [ 45 ] or concentration limits [46 ] provided by SCK∙CEN, it should be noted that these define solubility limits without colloidal fractions bound to dissolved organic carbon (DOC). This needs to be accounted for when comparing expert ranges for solubility (see Chapter 5). In this document the solubility limit is denoted with the letter “S”, in order to avoid confusion with the solubility constant related to the solubility product of a mineral in the previous section, denoted by “K”. The solubility limit S is, like the solid-solution partitioning factor Kd, a conditional value, i.e. its validity is limited to the system for which it is derived. This is different to the solubility product K, which in principle is a constant related to a mineral solubility, which should be valid in any system where the given mineral is present.

OPERA-PU-NRG742 DRAFT Page 7 of 39
The conditional nature of the solubility limit S makes it necessary to evaluate carefully if the solubility values obtained by SCK∙CEN for Boom Clay in Mol are also applicable for the variety of conditions expected in the Dutch case. The next three chapters therefore discusses for a set of relevant radionuclides recommended solubility limits for Boom Clay in the Netherlands, based on the values used by SCK∙CEN.

OPERA-PU-NRG742 DRAFT Page 8 of 39
OPERA-PU-NRG742 DRAFT Page 9 of 39
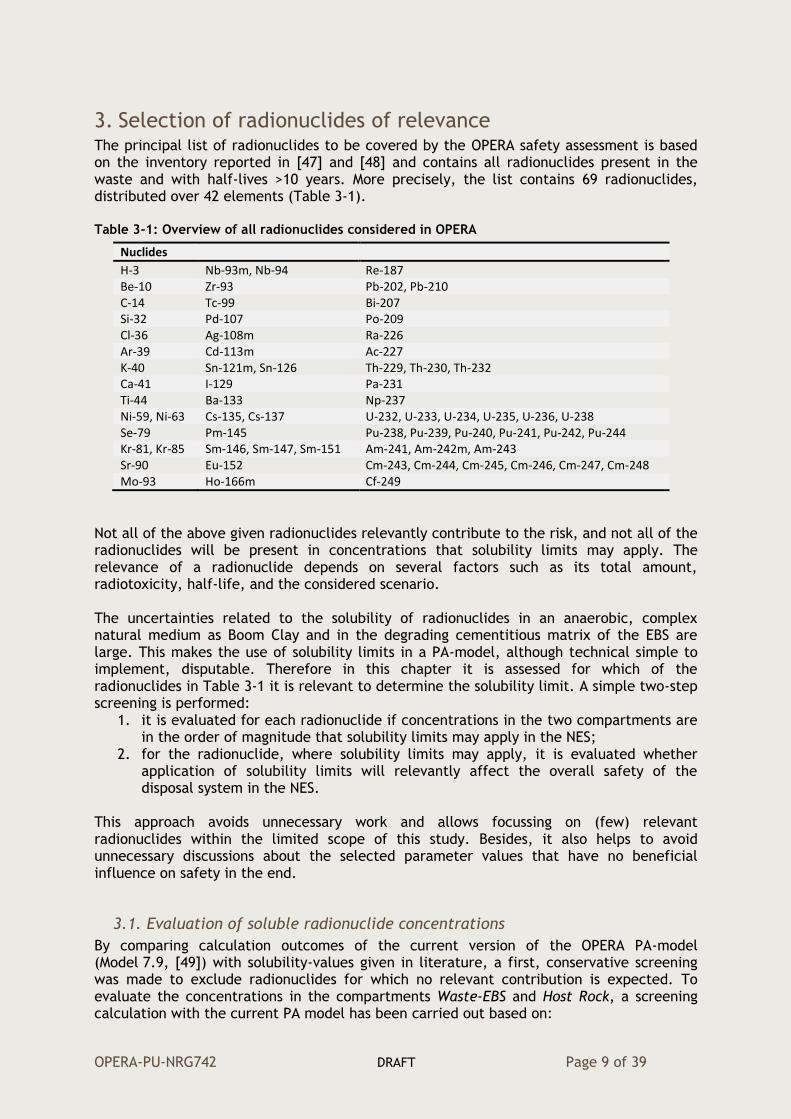
3. Selection of radionuclides of relevance The principal list of radionuclides to be covered by the OPERA safety assessment is based on the inventory reported in [47] and [48] and contains all radionuclides present in the waste and with half-lives >10 years. More precisely, the list contains 69 radionuclides, distributed over 42 elements (Table 3-1). Table 3-1: Overview of all radionuclides considered in OPERA
Nuclides
H-3 Nb-93m, Nb-94 Re-187 Be-10 Zr-93 Pb-202, Pb-210 C-14 Tc-99 Bi-207 Si-32 Pd-107 Po-209 Cl-36 Ag-108m Ra-226 Ar-39 Cd-113m Ac-227 K-40 Sn-121m, Sn-126 Th-229, Th-230, Th-232 Ca-41 I-129 Pa-231 Ti-44 Ba-133 Np-237 Ni-59, Ni-63 Cs-135, Cs-137 U-232, U-233, U-234, U-235, U-236, U-238 Se-79 Pm-145 Pu-238, Pu-239, Pu-240, Pu-241, Pu-242, Pu-244 Kr-81, Kr-85 Sm-146, Sm-147, Sm-151 Am-241, Am-242m, Am-243 Sr-90 Eu-152 Cm-243, Cm-244, Cm-245, Cm-246, Cm-247, Cm-248 Mo-93 Ho-166m Cf-249
Not all of the above given radionuclides relevantly contribute to the risk, and not all of the radionuclides will be present in concentrations that solubility limits may apply. The relevance of a radionuclide depends on several factors such as its total amount, radiotoxicity, half-life, and the considered scenario. The uncertainties related to the solubility of radionuclides in an anaerobic, complex natural medium as Boom Clay and in the degrading cementitious matrix of the EBS are large. This makes the use of solubility limits in a PA-model, although technical simple to implement, disputable. Therefore in this chapter it is assessed for which of the radionuclides in Table 3-1 it is relevant to determine the solubility limit. A simple two-step screening is performed:
1. it is evaluated for each radionuclide if concentrations in the two compartments are in the order of magnitude that solubility limits may apply in the NES;
2. for the radionuclide, where solubility limits may apply, it is evaluated whether application of solubility limits will relevantly affect the overall safety of the disposal system in the NES.
This approach avoids unnecessary work and allows focussing on (few) relevant radionuclides within the limited scope of this study. Besides, it also helps to avoid unnecessary discussions about the selected parameter values that have no beneficial influence on safety in the end.
3.1. Evaluation of soluble radionuclide concentrations
By comparing calculation outcomes of the current version of the OPERA PA-model (Model 7.9, [49]) with solubility-values given in literature, a first, conservative screening was made to exclude radionuclides for which no relevant contribution is expected. To evaluate the concentrations in the compartments Waste-EBS and Host Rock, a screening calculation with the current PA model has been carried out based on:
OPERA-PU-NRG742 DRAFT Page 10 of 39
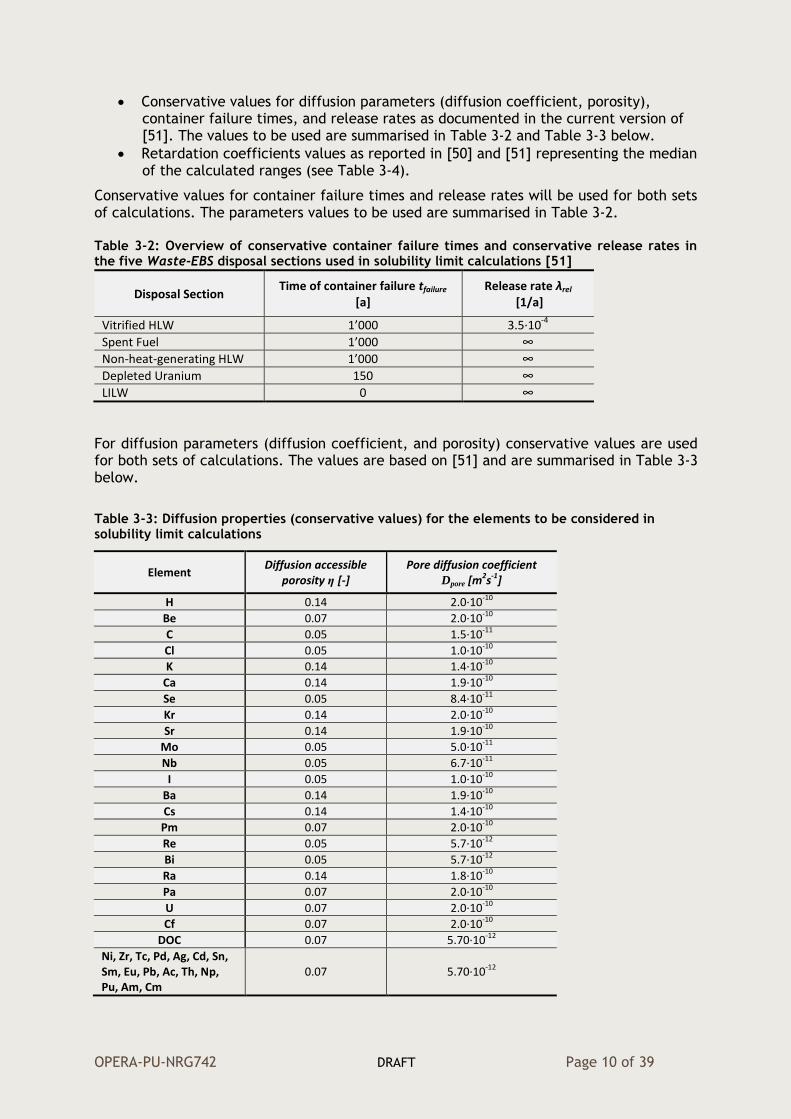
Conservative values for diffusion parameters (diffusion coefficient, porosity), container failure times, and release rates as documented in the current version of [51]. The values to be used are summarised in Table 3-2 and Table 3-3 below.
Retardation coefficients values as reported in [50] and [51] representing the median of the calculated ranges (see Table 3-4).
Conservative values for container failure times and release rates will be used for both sets of calculations. The parameters values to be used are summarised in Table 3-2. Table 3-2: Overview of conservative container failure times and conservative release rates in the five Waste-EBS disposal sections used in solubility limit calculations [51]
Disposal Section Time of container failure tfailure
[a] Release rate λrel
[1/a]
Vitrified HLW 1’000 3.5∙10-4
Spent Fuel 1’000 ∞
Non-heat-generating HLW 1’000 ∞
Depleted Uranium 150 ∞
LILW 0 ∞
For diffusion parameters (diffusion coefficient, and porosity) conservative values are used for both sets of calculations. The values are based on [51] and are summarised in Table 3-3 below.
Table 3-3: Diffusion properties (conservative values) for the elements to be considered in solubility limit calculations
Element Diffusion accessible
porosity η [-] Pore diffusion coefficient
Dpore [m2s-1]
H 0.14 2.0∙10-10
Be 0.07 2.0∙10-10
C 0.05 1.5∙10-11
Cl 0.05 1.0∙10-10
K 0.14 1.4∙10-10
Ca 0.14 1.9∙10-10
Se 0.05 8.4∙10-11
Kr 0.14 2.0∙10-10
Sr 0.14 1.9∙10-10
Mo 0.05 5.0∙10-11
Nb 0.05 6.7∙10-11
I 0.05 1.0∙10-10
Ba 0.14 1.9∙10-10
Cs 0.14 1.4∙10-10
Pm 0.07 2.0∙10-10
Re 0.05 5.7∙10-12
Bi 0.05 5.7∙10-12
Ra 0.14 1.8∙10-10
Pa 0.07 2.0∙10-10
U 0.07 2.0∙10-10
Cf 0.07 2.0∙10-10
DOC 0.07 5.70∙10-12
Ni, Zr, Tc, Pd, Ag, Cd, Sn, Sm, Eu, Pb, Ac, Th, Np, Pu, Am, Cm
0.07 5.70∙10-12
OPERA-PU-NRG742 DRAFT Page 11 of 39
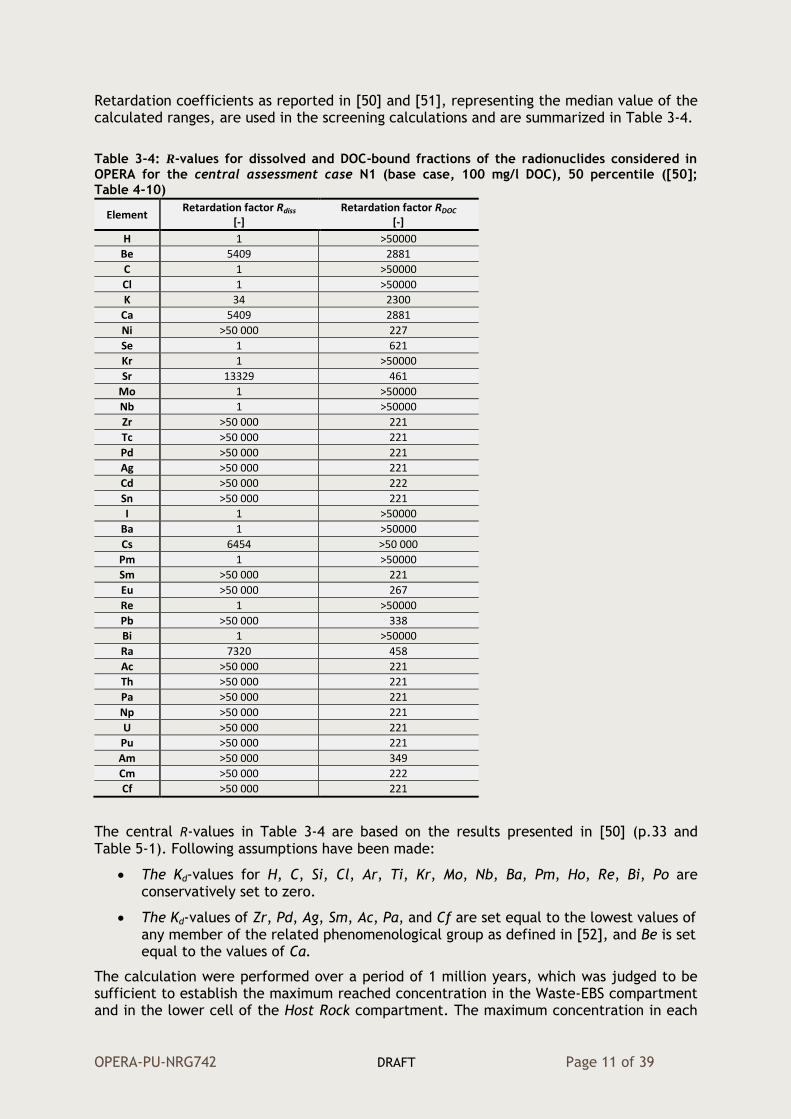
Retardation coefficients as reported in [50] and [51], representing the median value of the calculated ranges, are used in the screening calculations and are summarized in Table 3-4.
Table 3-4: R-values for dissolved and DOC-bound fractions of the radionuclides considered in OPERA for the central assessment case N1 (base case, 100 mg/l DOC), 50 percentile ([50]; Table 4-10)
Element Retardation factor Rdiss
[-] Retardation factor RDOC
[-]
H 1 >50000
Be 5409 2881
C 1 >50000
Cl 1 >50000
K 34 2300
Ca 5409 2881
Ni >50 000 227
Se 1 621
Kr 1 >50000
Sr 13329 461
Mo 1 >50000
Nb 1 >50000
Zr >50 000 221
Tc >50 000 221
Pd >50 000 221
Ag >50 000 221
Cd >50 000 222
Sn >50 000 221
I 1 >50000
Ba 1 >50000
Cs 6454 >50 000
Pm 1 >50000
Sm >50 000 221
Eu >50 000 267
Re 1 >50000
Pb >50 000 338
Bi 1 >50000
Ra 7320 458
Ac >50 000 221
Th >50 000 221
Pa >50 000 221
Np >50 000 221
U >50 000 221
Pu >50 000 221
Am >50 000 349
Cm >50 000 222
Cf >50 000 221
The central R-values in Table 3-4 are based on the results presented in [50] (p.33 and Table 5-1). Following assumptions have been made:
The Kd-values for H, C, Si, Cl, Ar, Ti, Kr, Mo, Nb, Ba, Pm, Ho, Re, Bi, Po are conservatively set to zero.
The Kd-values of Zr, Pd, Ag, Sm, Ac, Pa, and Cf are set equal to the lowest values of any member of the related phenomenological group as defined in [52], and Be is set equal to the values of Ca.
The calculation were performed over a period of 1 million years, which was judged to be sufficient to establish the maximum reached concentration in the Waste-EBS compartment and in the lower cell of the Host Rock compartment. The maximum concentration in each
OPERA-PU-NRG742 DRAFT Page 12 of 39
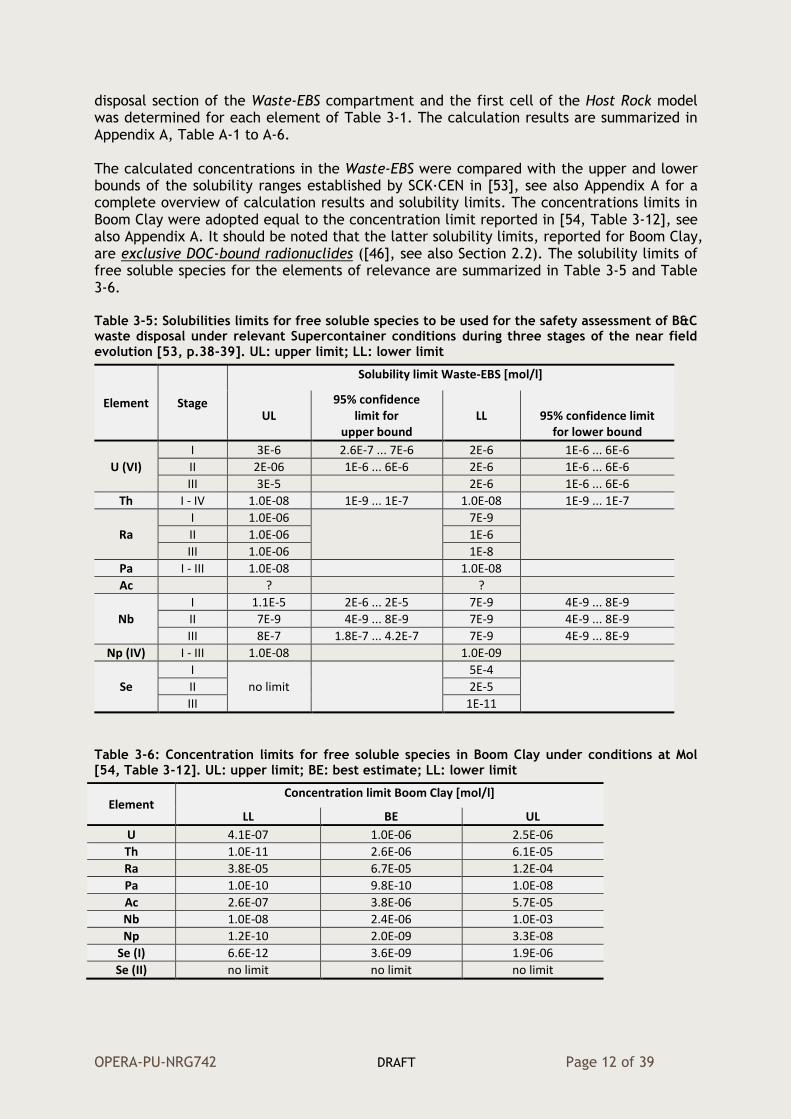
disposal section of the Waste-EBS compartment and the first cell of the Host Rock model was determined for each element of Table 3-1. The calculation results are summarized in Appendix A, Table A-1 to A-6. The calculated concentrations in the Waste-EBS were compared with the upper and lower bounds of the solubility ranges established by SCK∙CEN in [53], see also Appendix A for a complete overview of calculation results and solubility limits. The concentrations limits in Boom Clay were adopted equal to the concentration limit reported in [54, Table 3-12], see also Appendix A. It should be noted that the latter solubility limits, reported for Boom Clay, are exclusive DOC-bound radionuclides ([46], see also Section 2.2). The solubility limits of free soluble species for the elements of relevance are summarized in Table 3-5 and Table 3-6. Table 3-5: Solubilities limits for free soluble species to be used for the safety assessment of B&C waste disposal under relevant Supercontainer conditions during three stages of the near field evolution [53, p.38-39]. UL: upper limit; LL: lower limit
Element Stage
Solubility limit Waste-EBS [mol/l]
UL 95% confidence
limit for upper bound
LL 95% confidence limit for lower bound
U (VI)
I 3E-6 2.6E-7 ... 7E-6 2E-6 1E-6 ... 6E-6
II 2E-06 1E-6 ... 6E-6 2E-6 1E-6 ... 6E-6
III 3E-5 2E-6 1E-6 ... 6E-6
Th I - IV 1.0E-08 1E-9 ... 1E-7 1.0E-08 1E-9 ... 1E-7
Ra
I 1.0E-06
7E-9
II 1.0E-06 1E-6
III 1.0E-06 1E-8
Pa I - III 1.0E-08 1.0E-08
Ac ? ?
Nb
I 1.1E-5 2E-6 ... 2E-5 7E-9 4E-9 ... 8E-9
II 7E-9 4E-9 ... 8E-9 7E-9 4E-9 ... 8E-9
III 8E-7 1.8E-7 ... 4.2E-7 7E-9 4E-9 ... 8E-9
Np (IV) I - III 1.0E-08 1.0E-09
Se
I
no limit
5E-4
II 2E-5
III 1E-11
Table 3-6: Concentration limits for free soluble species in Boom Clay under conditions at Mol [54, Table 3-12]. UL: upper limit; BE: best estimate; LL: lower limit
Element Concentration limit Boom Clay [mol/l]
LL BE UL
U 4.1E-07 1.0E-06 2.5E-06
Th 1.0E-11 2.6E-06 6.1E-05
Ra 3.8E-05 6.7E-05 1.2E-04
Pa 1.0E-10 9.8E-10 1.0E-08
Ac 2.6E-07 3.8E-06 5.7E-05
Nb 1.0E-08 2.4E-06 1.0E-03
Np 1.2E-10 2.0E-09 3.3E-08
Se (I) 6.6E-12 3.6E-09 1.9E-06
Se (II) no limit no limit no limit
OPERA-PU-NRG742 DRAFT Page 13 of 39
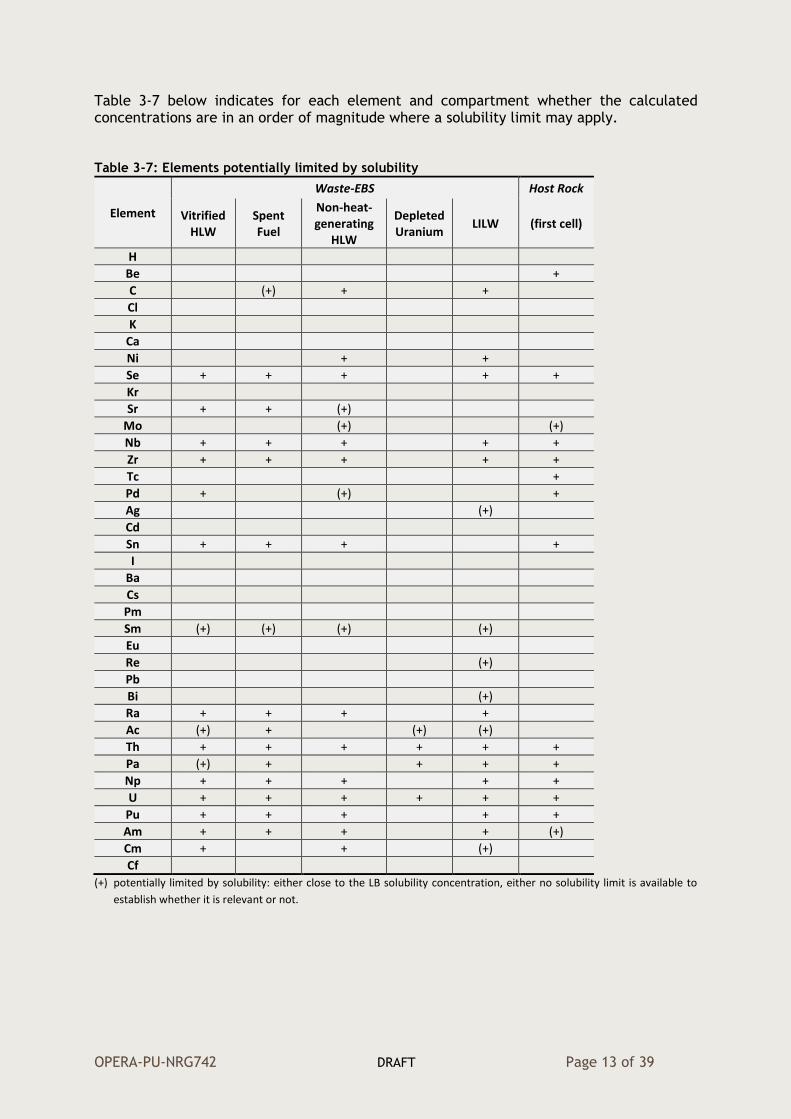
Table 3-7 below indicates for each element and compartment whether the calculated concentrations are in an order of magnitude where a solubility limit may apply.
Table 3-7: Elements potentially limited by solubility
Element
Waste-EBS Host Rock
Vitrified HLW
Spent Fuel
Non-heat-generating
HLW
Depleted Uranium
LILW (first cell)
H
Be +
C (+) + +
Cl
K
Ca
Ni + +
Se + + + + +
Kr
Sr + + (+)
Mo (+) (+)
Nb + + + + +
Zr + + + + +
Tc +
Pd + (+) +
Ag (+)
Cd
Sn + + + +
I
Ba
Cs
Pm
Sm (+) (+) (+) (+)
Eu
Re (+)
Pb
Bi (+)
Ra + + + +
Ac (+) + (+) (+)
Th + + + + + +
Pa (+) + + + +
Np + + + + +
U + + + + + +
Pu + + + + +
Am + + + + (+)
Cm + + (+)
Cf
(+) potentially limited by solubility: either close to the LB solubility concentration, either no solubility limit is available to
establish whether it is relevant or not.

OPERA-PU-NRG742 DRAFT Page 14 of 39
3.2. Evaluation of relevance for the long-term safety
The contribution of radionuclides to the dose rate were established by the use of PA-model 7.9 [49], but with less conservative parameterization for the radionuclide migration [51] than for the derivation of the solubilities. The reason is that if the calculations were carried out with the median Kd-values for Boom Clay, the second peak will not be reached in the simulated period of 10 million years and it would be necessary to repeat the calculation for a much longer simulation period. Figure 3-1 shows the dose rate calculated for the NES-case N1 (PA-model version 7.9) and the most relevant contributing radionuclides.
Figure 3-1: Dose rate in the biosphere. Calculations are performed with PA-model 7.9, with parameter values adapted as described in the text.
Figure 3-2 below shows the outcome of the same calculation, now expressed as relative contribution of a radionuclide to the overall dose rate. The element with relevant contribution to the dose rate and with maximum concentrations in Waste-EBS and the bottom cell of the Boom Clay which exceed their lower solubility limit are summarised in Table 3-8 below. The consideration of the solubility limits for these elements in the PA-model will lead to a less conservative estimation of contaminant transport.
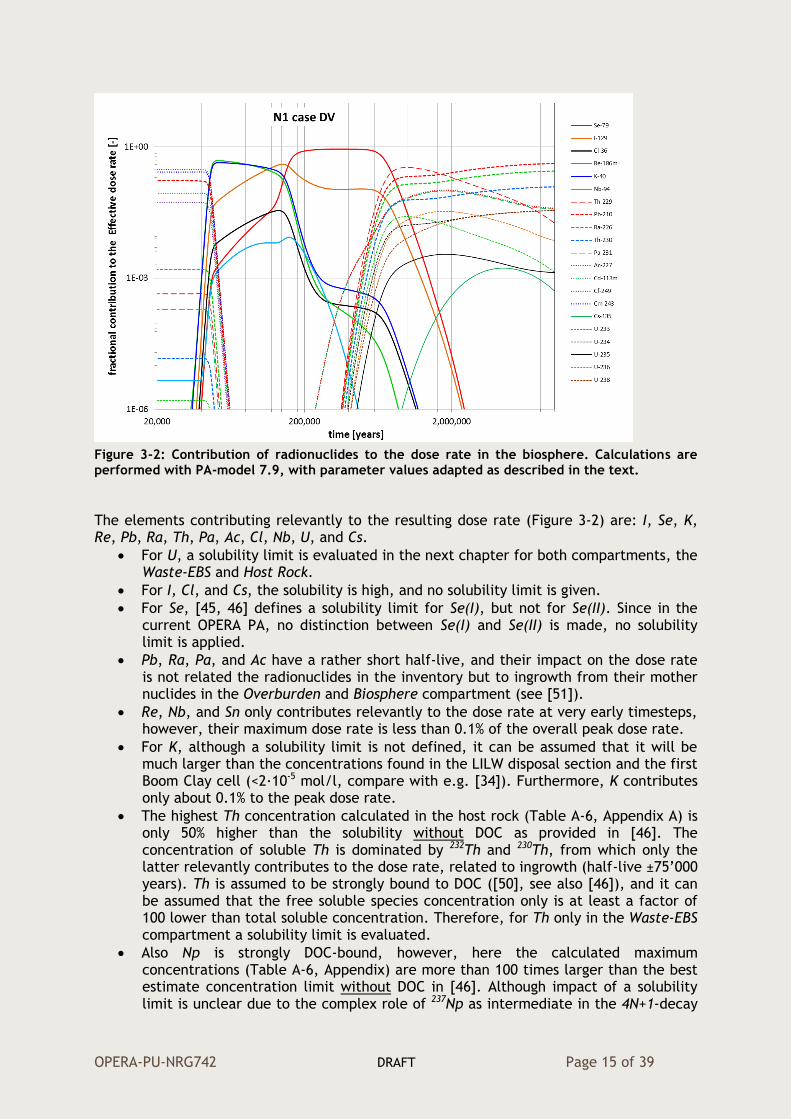
OPERA-PU-NRG742 DRAFT Page 15 of 39
Figure 3-2: Contribution of radionuclides to the dose rate in the biosphere. Calculations are performed with PA-model 7.9, with parameter values adapted as described in the text.
The elements contributing relevantly to the resulting dose rate (Figure 3-2) are: I, Se, K, Re, Pb, Ra, Th, Pa, Ac, Cl, Nb, U, and Cs.
For U, a solubility limit is evaluated in the next chapter for both compartments, the Waste-EBS and Host Rock.
For I, Cl, and Cs, the solubility is high, and no solubility limit is given.
For Se, [45, 46] defines a solubility limit for Se(I), but not for Se(II). Since in the current OPERA PA, no distinction between Se(I) and Se(II) is made, no solubility limit is applied.
Pb, Ra, Pa, and Ac have a rather short half-live, and their impact on the dose rate is not related the radionuclides in the inventory but to ingrowth from their mother nuclides in the Overburden and Biosphere compartment (see [51]).
Re, Nb, and Sn only contributes relevantly to the dose rate at very early timesteps, however, their maximum dose rate is less than 0.1% of the overall peak dose rate.
For K, although a solubility limit is not defined, it can be assumed that it will be much larger than the concentrations found in the LILW disposal section and the first Boom Clay cell (<2∙10-5 mol/l, compare with e.g. [34]). Furthermore, K contributes only about 0.1% to the peak dose rate.
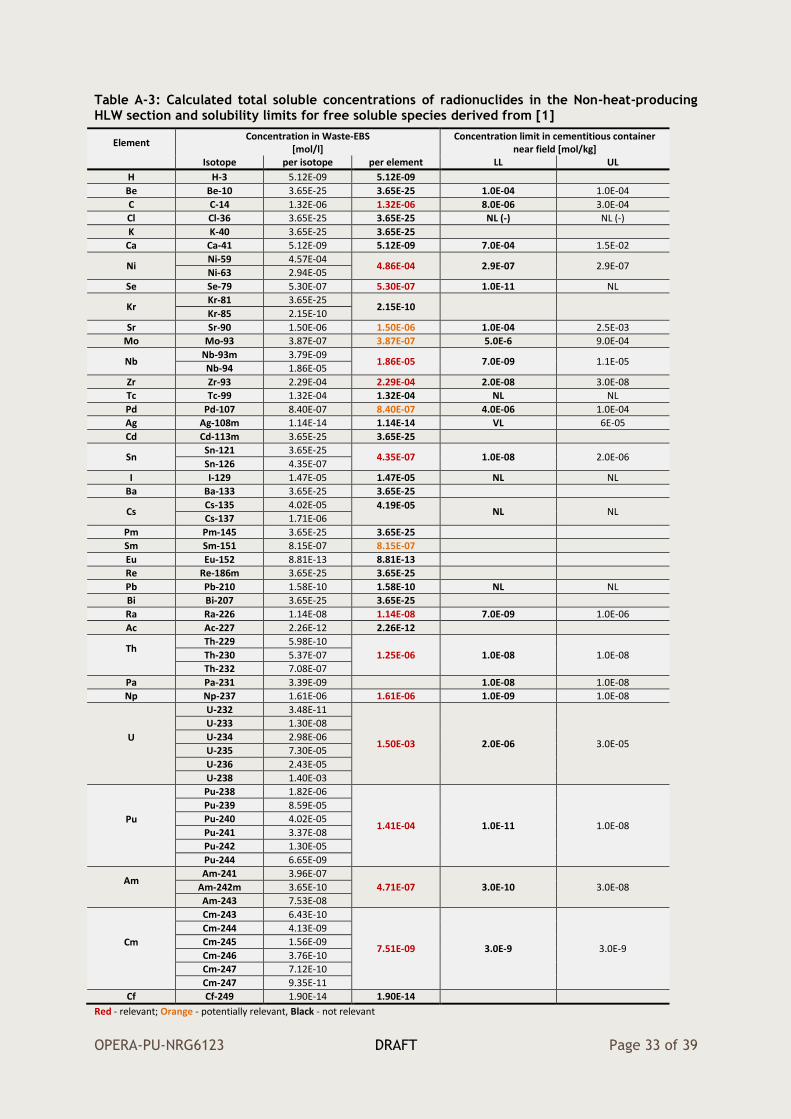
The highest Th concentration calculated in the host rock (Table A-6, Appendix A) is only 50% higher than the solubility without DOC as provided in [46]. The concentration of soluble Th is dominated by 232Th and 230Th, from which only the latter relevantly contributes to the dose rate, related to ingrowth (half-live ±75’000 years). Th is assumed to be strongly bound to DOC ([50], see also [46]), and it can be assumed that the free soluble species concentration only is at least a factor of 100 lower than total soluble concentration. Therefore, for Th only in the Waste-EBS compartment a solubility limit is evaluated.
Also Np is strongly DOC-bound, however, here the calculated maximum concentrations (Table A-6, Appendix) are more than 100 times larger than the best estimate concentration limit without DOC in [46]. Although impact of a solubility limit is unclear due to the complex role of 237Np as intermediate in the 4N+1-decay
OPERA-PU-NRG742 DRAFT Page 16 of 39
chain [51], a solubility limit is assessed in the next chapter for both compartments, the Waste-EBS and Host Rock.
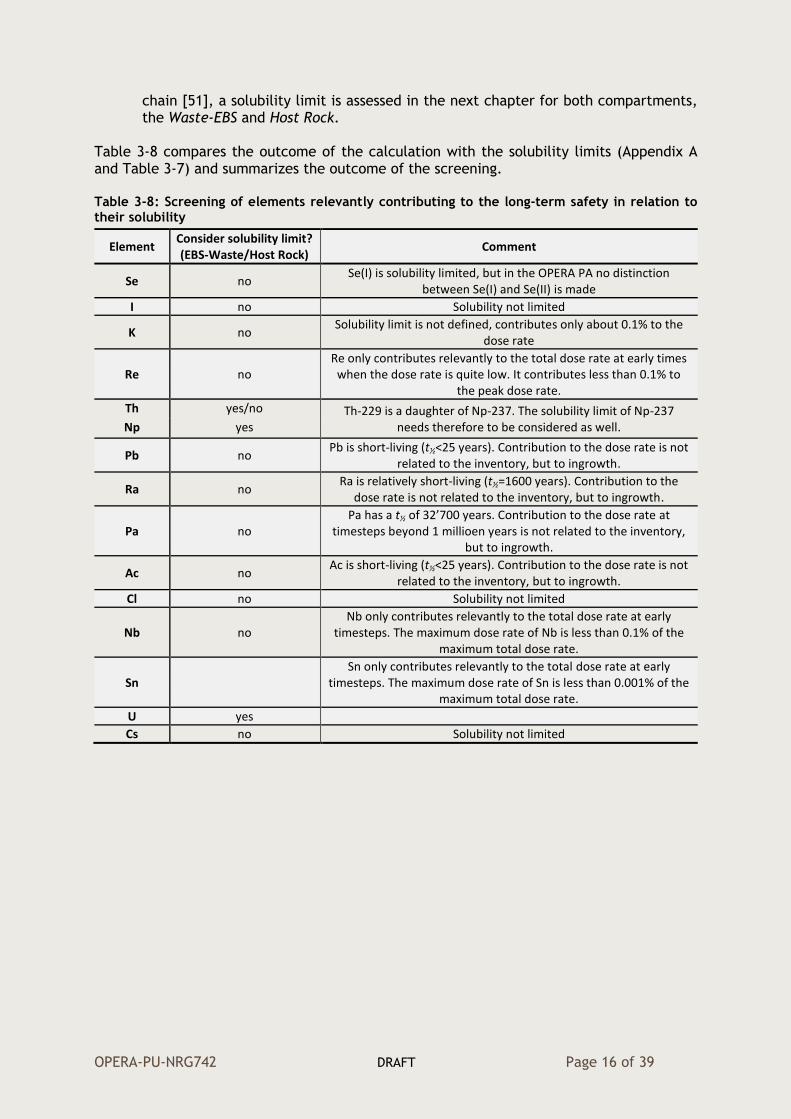
Table 3-8 compares the outcome of the calculation with the solubility limits (Appendix A and Table 3-7) and summarizes the outcome of the screening. Table 3-8: Screening of elements relevantly contributing to the long-term safety in relation to their solubility
Element Consider solubility limit? (EBS-Waste/Host Rock)
Comment
Se no Se(I) is solubility limited, but in the OPERA PA no distinction
between Se(I) and Se(II) is made
I no Solubility not limited
K no Solubility limit is not defined, contributes only about 0.1% to the
dose rate
Re no Re only contributes relevantly to the total dose rate at early times
when the dose rate is quite low. It contributes less than 0.1% to the peak dose rate.
Th yes/no Th-229 is a daughter of Np-237. The solubility limit of Np-237 needs therefore to be considered as well. Np yes
Pb no Pb is short-living (t½<25 years). Contribution to the dose rate is not
related to the inventory, but to ingrowth.
Ra no Ra is relatively short-living (t½=1600 years). Contribution to the
dose rate is not related to the inventory, but to ingrowth.
Pa no Pa has a t½ of 32’700 years. Contribution to the dose rate at
timesteps beyond 1 millioen years is not related to the inventory, but to ingrowth.
Ac no Ac is short-living (t½<25 years). Contribution to the dose rate is not
related to the inventory, but to ingrowth.
Cl no Solubility not limited
Nb no Nb only contributes relevantly to the total dose rate at early
timesteps. The maximum dose rate of Nb is less than 0.1% of the maximum total dose rate.
Sn Sn only contributes relevantly to the total dose rate at early
timesteps. The maximum dose rate of Sn is less than 0.001% of the maximum total dose rate.
U yes
Cs no Solubility not limited
OPERA-PU-NRG742 DRAFT Page 17 of 39
4. Derivation of solubility limits
4.1. Solubility in the Waste-EBS compartment
4.1.1. Aim
The aim of this part of the work is to calculate the estimated maximum solubility S for Uranium in the projected EBS system, and in particular in a depleted uranium – cement mixture. The equilibrium calculations take into account expected local geochemical conditions with respect to DOC (dissolved organic carbon) concentrations, redox condition, pH, and CO2 concentrations. It is assumed that DOC will over time diffuse into the EBS and pore water concentrations in the EBS will therefore eventually approach Boom Clay pore water concentrations. DOC concentrations in the EBS pore water were estimated to be 400 mg/l, which agrees with the highest range given for Belgian Boom Clay pore water conditions ([2]; p.59).
4.1.2. Procedure
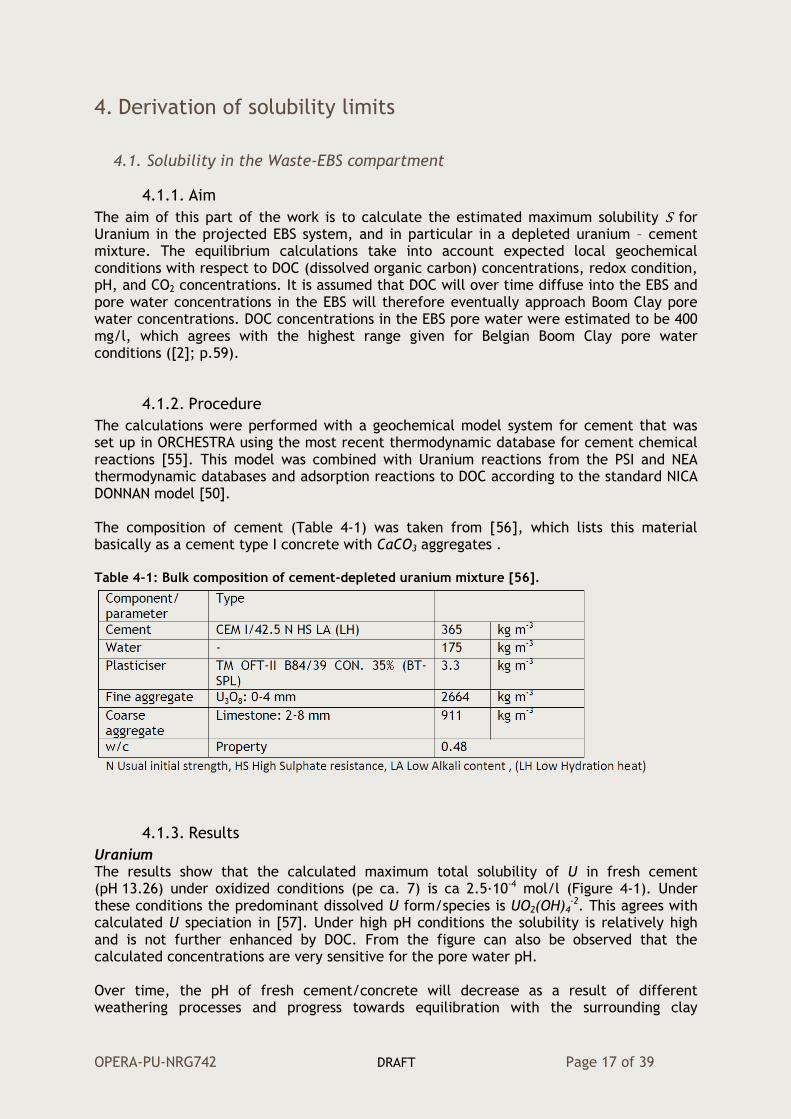
The calculations were performed with a geochemical model system for cement that was set up in ORCHESTRA using the most recent thermodynamic database for cement chemical reactions [55]. This model was combined with Uranium reactions from the PSI and NEA thermodynamic databases and adsorption reactions to DOC according to the standard NICA DONNAN model [50]. The composition of cement (Table 4-1) was taken from [56], which lists this material basically as a cement type I concrete with CaCO3 aggregates . Table 4-1: Bulk composition of cement-depleted uranium mixture [56].
4.1.3. Results
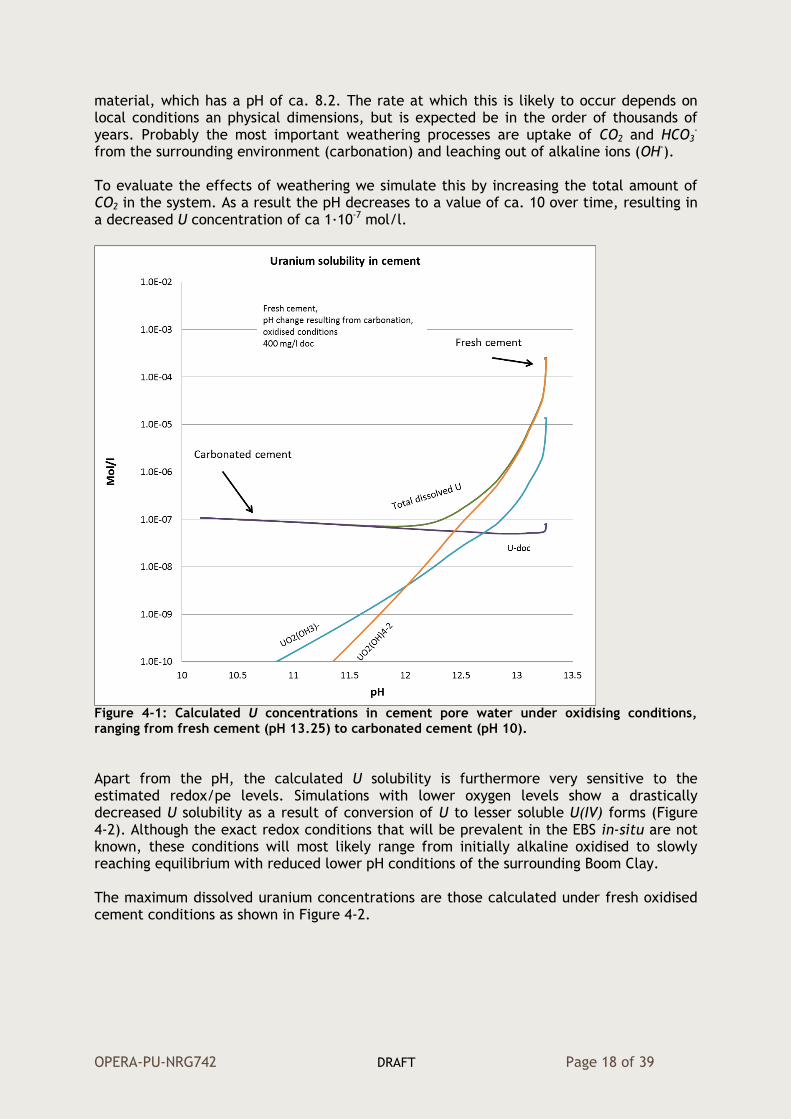
Uranium The results show that the calculated maximum total solubility of U in fresh cement (pH 13.26) under oxidized conditions (pe ca. 7) is ca 2.5∙10-4 mol/l (Figure 4-1). Under these conditions the predominant dissolved U form/species is UO2(OH)4
-2. This agrees with calculated U speciation in [57]. Under high pH conditions the solubility is relatively high and is not further enhanced by DOC. From the figure can also be observed that the calculated concentrations are very sensitive for the pore water pH. Over time, the pH of fresh cement/concrete will decrease as a result of different weathering processes and progress towards equilibration with the surrounding clay
OPERA-PU-NRG742 DRAFT Page 18 of 39
material, which has a pH of ca. 8.2. The rate at which this is likely to occur depends on local conditions an physical dimensions, but is expected be in the order of thousands of years. Probably the most important weathering processes are uptake of CO2 and HCO3
- from the surrounding environment (carbonation) and leaching out of alkaline ions (OH-). To evaluate the effects of weathering we simulate this by increasing the total amount of CO2 in the system. As a result the pH decreases to a value of ca. 10 over time, resulting in a decreased U concentration of ca 1∙10-7 mol/l.
Figure 4-1: Calculated U concentrations in cement pore water under oxidising conditions, ranging from fresh cement (pH 13.25) to carbonated cement (pH 10).
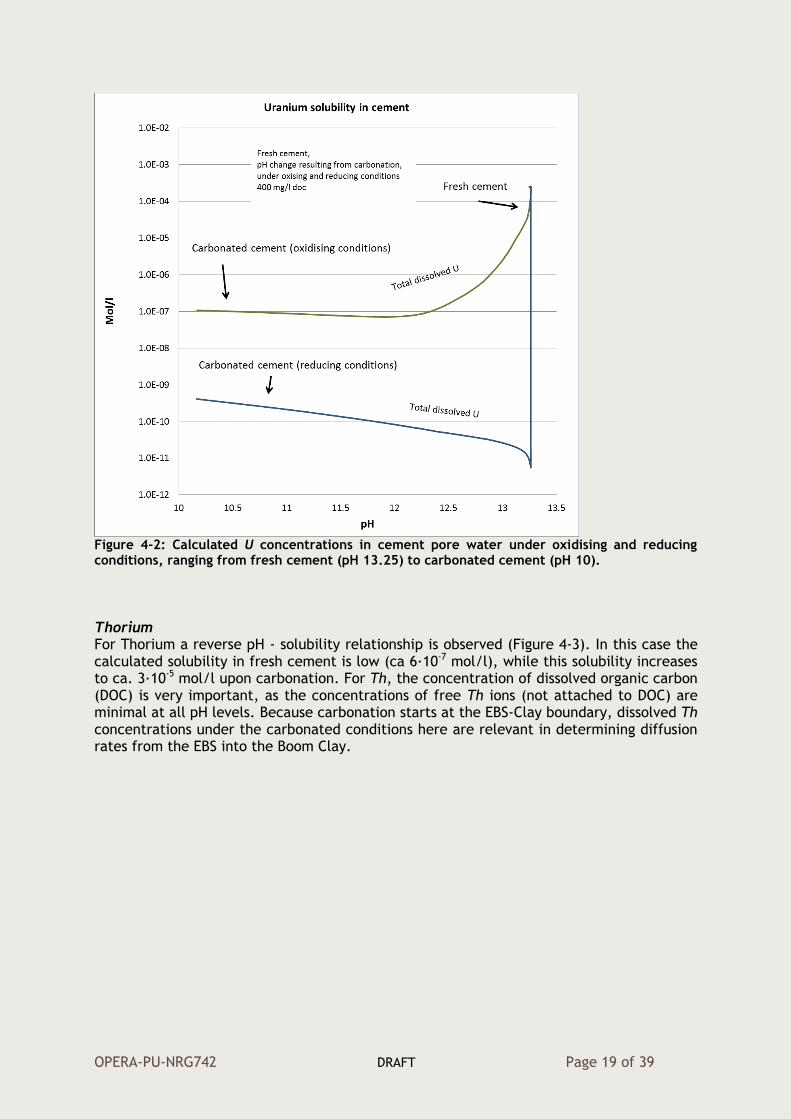
Apart from the pH, the calculated U solubility is furthermore very sensitive to the estimated redox/pe levels. Simulations with lower oxygen levels show a drastically decreased U solubility as a result of conversion of U to lesser soluble U(IV) forms (Figure 4-2). Although the exact redox conditions that will be prevalent in the EBS in-situ are not known, these conditions will most likely range from initially alkaline oxidised to slowly reaching equilibrium with reduced lower pH conditions of the surrounding Boom Clay. The maximum dissolved uranium concentrations are those calculated under fresh oxidised cement conditions as shown in Figure 4-2.
OPERA-PU-NRG742 DRAFT Page 19 of 39
Figure 4-2: Calculated U concentrations in cement pore water under oxidising and reducing conditions, ranging from fresh cement (pH 13.25) to carbonated cement (pH 10).
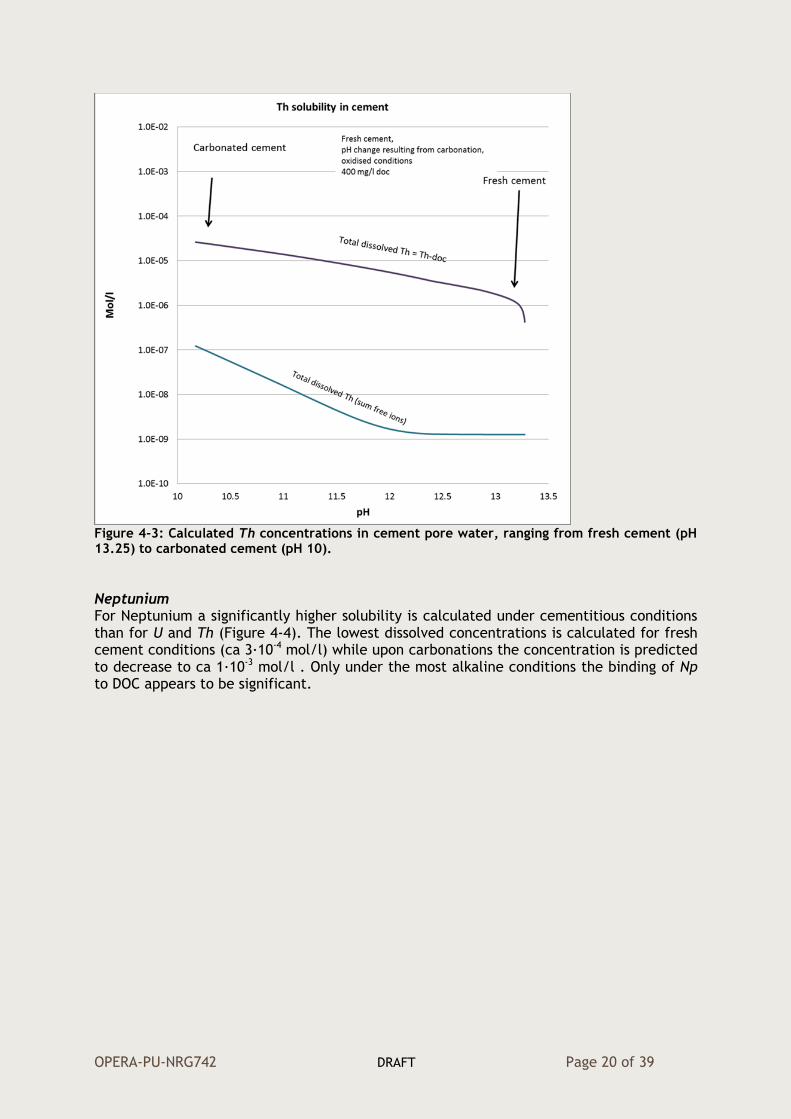
Thorium For Thorium a reverse pH - solubility relationship is observed (Figure 4-3). In this case the calculated solubility in fresh cement is low (ca 6∙10-7 mol/l), while this solubility increases to ca. 3∙10-5 mol/l upon carbonation. For Th, the concentration of dissolved organic carbon (DOC) is very important, as the concentrations of free Th ions (not attached to DOC) are minimal at all pH levels. Because carbonation starts at the EBS-Clay boundary, dissolved Th concentrations under the carbonated conditions here are relevant in determining diffusion rates from the EBS into the Boom Clay.
OPERA-PU-NRG742 DRAFT Page 20 of 39
Figure 4-3: Calculated Th concentrations in cement pore water, ranging from fresh cement (pH 13.25) to carbonated cement (pH 10).
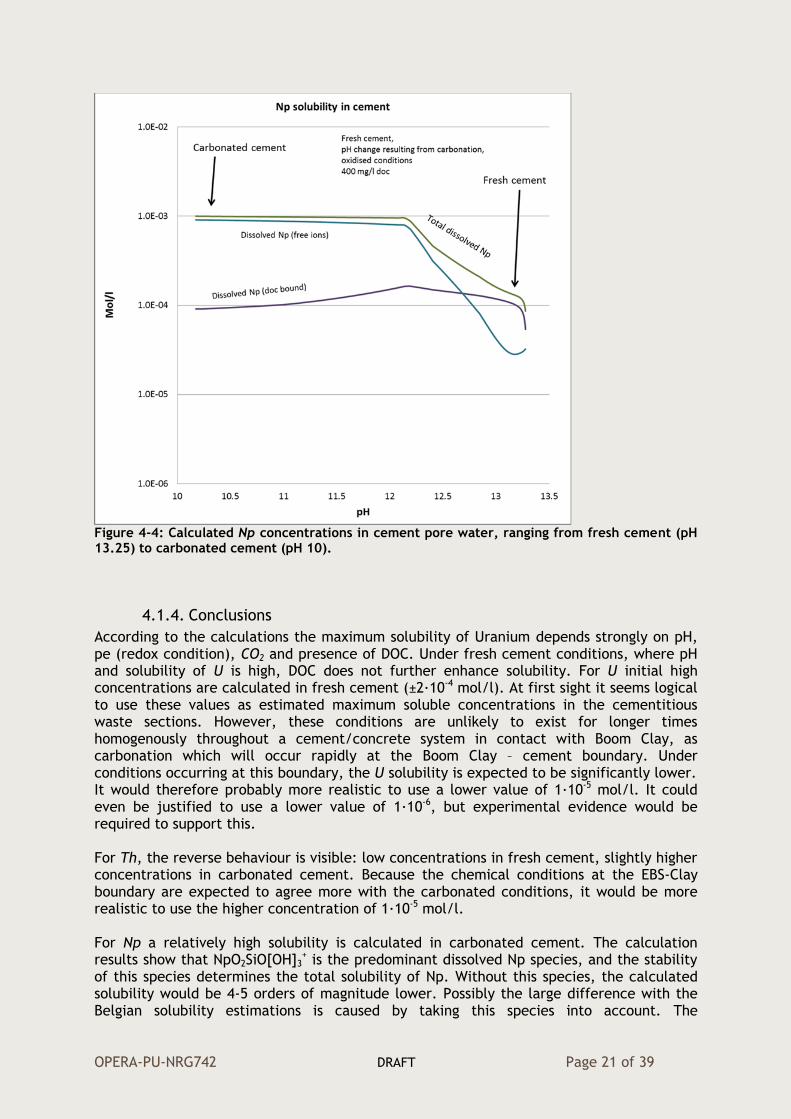
Neptunium For Neptunium a significantly higher solubility is calculated under cementitious conditions than for U and Th (Figure 4-4). The lowest dissolved concentrations is calculated for fresh cement conditions (ca 3∙10-4 mol/l) while upon carbonations the concentration is predicted to decrease to ca 1∙10-3 mol/l . Only under the most alkaline conditions the binding of Np to DOC appears to be significant.
OPERA-PU-NRG742 DRAFT Page 21 of 39
Figure 4-4: Calculated Np concentrations in cement pore water, ranging from fresh cement (pH 13.25) to carbonated cement (pH 10).
4.1.4. Conclusions
According to the calculations the maximum solubility of Uranium depends strongly on pH, pe (redox condition), CO2 and presence of DOC. Under fresh cement conditions, where pH and solubility of U is high, DOC does not further enhance solubility. For U initial high concentrations are calculated in fresh cement (±2∙10-4 mol/l). At first sight it seems logical to use these values as estimated maximum soluble concentrations in the cementitious waste sections. However, these conditions are unlikely to exist for longer times homogenously throughout a cement/concrete system in contact with Boom Clay, as carbonation which will occur rapidly at the Boom Clay – cement boundary. Under conditions occurring at this boundary, the U solubility is expected to be significantly lower. It would therefore probably more realistic to use a lower value of 1∙10-5 mol/l. It could even be justified to use a lower value of 1∙10-6, but experimental evidence would be required to support this. For Th, the reverse behaviour is visible: low concentrations in fresh cement, slightly higher concentrations in carbonated cement. Because the chemical conditions at the EBS-Clay boundary are expected to agree more with the carbonated conditions, it would be more realistic to use the higher concentration of 1∙10-5 mol/l. For Np a relatively high solubility is calculated in carbonated cement. The calculation results show that NpO2SiO[OH]3
+ is the predominant dissolved Np species, and the stability of this species determines the total solubility of Np. Without this species, the calculated solubility would be 4-5 orders of magnitude lower. Possibly the large difference with the Belgian solubility estimations is caused by taking this species into account. The

OPERA-PU-NRG742 DRAFT Page 22 of 39
concentration expected to be present at the EBS–Clay Boundary is likely to agree more with the carbonated cement conditions, therefore a the estimated Np solubility here would be 1∙10-3 Mol/l.
4.2. Solubility in the Host Rock compartment
In the screening in Chapter 3, two radionuclides were judged to relevantly affect the dose rate and to have soluble concentrations in Boom Clay comparable to the solubility limit for free soluble species as established in [54]: U and Np. These are discussed element-wise in the next two sections.
4.2.1. Uranium
In ([54], Table 3-12), for U concentration limits without DOC are given, ranging from 4.1∙10-7 to 2.5∙10-6 mol/l, with a best estimate of 1.0∙10-6 mol/l. It must be assumed that under Boom Clay conditions U is present as (more soluble) U(VI) [46]. Although in the given redox range, mixed valence uranium oxides (i.e. U4O8 and U3O8) might lower the solubility in geochemical model calculations, it is argued that these species should not be used since they lead to erroneous results underestimating the real solubility [ 58 ]. The soluble chemistry under the conditions in Mol is strongly influenced by carbonate species [45]. This is consistent with calculations performed in [50] for a variety of conditions expected in the Netherlands: the results show that the DOC-bound fractions can cover a large range, mainly dependent of the amounts of UO2(CO3)3
4- formed in solution. Figure 4-5 depicts the cumulative distribution of the ratio between DOC-bound U and free soluble U, as calculated with the model approach described in [50]. The median value is 625, and 10- and 90-percentiles are respectively 1.0 and 4∙10-5. The higher values should be used with care, here it is not unlikely that the model overestimate the affinity of U for binding to organic matter. Assuming safely that at most only 99% of the overall soluble U is bound to DOC, the best estimate given in [54] can be converted to a best estimate overall solubility S equivalent to 1.0∙10-4 mol/l. Applying the best estimate of the ratio between DOC-bound and free soluble U leads to larger central value of the overall solubility S of 6.3∙10-4 mol/l.
Figure 4-5: Cumulative distribution of the ratio DOC-bound Uranium / free soluble Uranium

OPERA-PU-NRG742 DRAFT Page 23 of 39
The further geochemical analysis is not straightforward. The geochemical model described in [50] assumes equilibrium with amorphous U02, equivalent to [45]. This results in comparable small concentrations of non-carbonated Uranium-species (median value: 9∙10-11 mol/l), with soluble concentrations varying due to the assumed variation of the redox potential by about 4 pe units. However, due to the high affinity of uranyl for carbonate, almost all carbonate will be complexed with Uranium, resulting in solubilities in the order of magnitude of the assumed bicarbonate concentration, and higher than the DOC-bound fractions. E.g. assuming a fixed bicarbonate concentration of 900 mg/l, results in a median overall solubility of 8∙10-4 mol/l (10- and 90-percentiles: 9∙10-5 and 2∙10-3 mol/l, respectively). Within the limited scope of this study, the relevance of this result is difficult to confirm, therefore a best estimate of the overall solubility of 1.0∙10-4 mol/l is suggested to be used in the OPERA PA, equivalent to the best estimate given in [54], and assuming 99% of the overall soluble U to be bound to DOC. However, large uncertainties with respect to this value need to be noted.
4.2.2. Neptunium
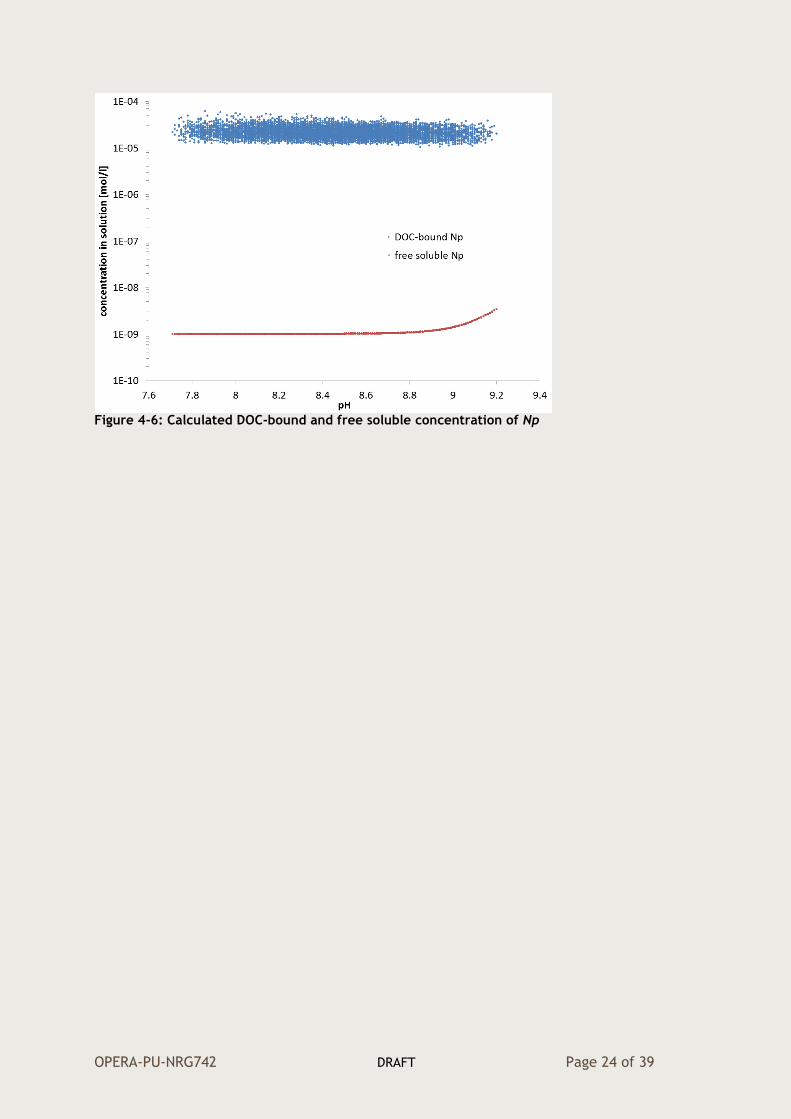
In ([54], Table 3-12), for Np concentration limits for free soluble species (i.e. without DOC) are given, ranging from 1.2∙10-10 to 3.3∙10-8 mol/l, with a best estimate of 2.0∙10-9 mol/l based on equilibrium with NpO2(am,hdy) [45]. In [50] and [54], Np is assumed to be strongly bound to DOC. Figure 4-6 shows the calculated DOC-bound and free soluble species concentration of Np, by using the geochemical model described in [50] for the base case (100 mg/l DOC). Here, equilibrium with amorphous NpO2 is assumed, equivalent to [45]. The calculated free soluble species concentration is very comparable to the values reported in [45]: at a pH of 8.5, as assumed to be present in Boom Clay in Mol, the soluble species concentration is close to 1∙10-9 mol/l, and within the pH-range considered in the Netherlands, this value increases to about 3.5∙10-9 mol/l. However, the DOC-bound concentration dominates the overall solubility, with 2.1∙10-5 mol/l as best estimate value, and a 10- to 90-percentile range of 1.5∙10-5 - 3.0∙10-5 mol/l. Thus, consequently, these three values are recommended respectively as best estimate, lower and upper limit for the overall solubility S for the base case, assuming 100 mg/l DOC. For other DOC cases [51], this values can be linearly scaled, i.e. 5 times lower for the low DOC case (20 mg/l DOC), and two times higher for high DOC case (200 mg/l DOC).
OPERA-PU-NRG742 DRAFT Page 24 of 39
Figure 4-6: Calculated DOC-bound and free soluble concentration of Np
OPERA-PU-NRG742 DRAFT Page 25 of 39
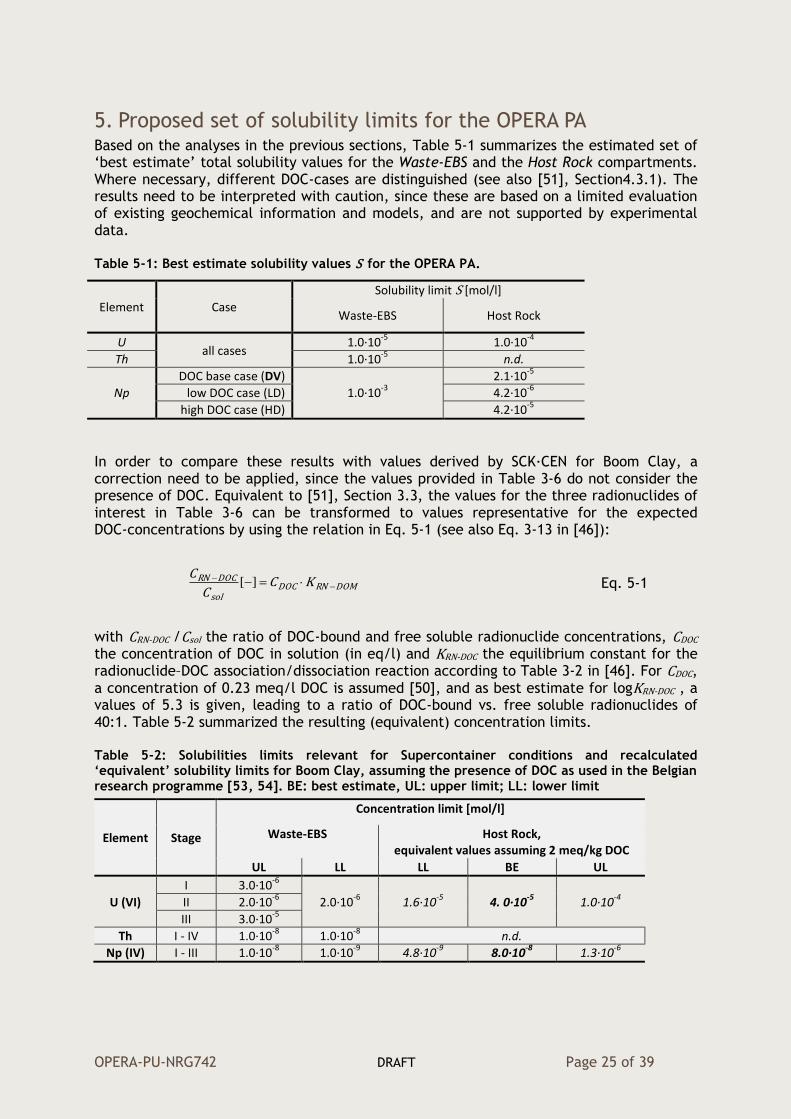
5. Proposed set of solubility limits for the OPERA PA Based on the analyses in the previous sections, Table 5-1 summarizes the estimated set of ‘best estimate’ total solubility values for the Waste-EBS and the Host Rock compartments. Where necessary, different DOC-cases are distinguished (see also [51], Section4.3.1). The results need to be interpreted with caution, since these are based on a limited evaluation of existing geochemical information and models, and are not supported by experimental data. Table 5-1: Best estimate solubility values S for the OPERA PA.
Element Case
Solubility limit S [mol/l]
Waste-EBS Host Rock
U all cases
1.0∙10-5
1.0∙10-4
Th 1.0∙10-5
n.d.
Np
DOC base case (DV)
1.0∙10-3
2.1∙10-5
low DOC case (LD) 4.2∙10-6
high DOC case (HD) 4.2∙10-5
In order to compare these results with values derived by SCK∙CEN for Boom Clay, a correction need to be applied, since the values provided in Table 3-6 do not consider the presence of DOC. Equivalent to [51], Section 3.3, the values for the three radionuclides of interest in Table 3-6 can be transformed to values representative for the expected DOC-concentrations by using the relation in Eq. 5-1 (see also Eq. 3-13 in [46]):
DOMRNDOCsol
DOCRN KCC
C
][ Eq. 5-1
with CRN-DOC /Csol the ratio of DOC-bound and free soluble radionuclide concentrations, CDOC the concentration of DOC in solution (in eq/l) and KRN-DOC the equilibrium constant for the radionuclide–DOC association/dissociation reaction according to Table 3-2 in [46]. For CDOC, a concentration of 0.23 meq/l DOC is assumed [50], and as best estimate for logKRN-DOC , a values of 5.3 is given, leading to a ratio of DOC-bound vs. free soluble radionuclides of 40:1. Table 5-2 summarized the resulting (equivalent) concentration limits. Table 5-2: Solubilities limits relevant for Supercontainer conditions and recalculated ‘equivalent’ solubility limits for Boom Clay, assuming the presence of DOC as used in the Belgian research programme [53, 54]. BE: best estimate, UL: upper limit; LL: lower limit
Element Stage
Concentration limit [mol/l]
Waste-EBS Host Rock, equivalent values assuming 2 meq/kg DOC
UL LL LL BE UL
U (VI)
I 3.0∙10-6
2.0∙10-6
1.6∙10-5
4. 0∙10-5
1.0∙10-4
II 2.0∙10-6
III 3.0∙10-5
Th I - IV 1.0∙10-8
1.0∙10-8
n.d.
Np (IV) I - III 1.0∙10-8
1.0∙10-9
4.8∙10-9
8.0∙10-8
1.3∙10-6
OPERA-PU-NRG742 DRAFT Page 26 of 39
The proposed concentration limit for Uranium in Waste-EBS is about three times larger than the upper limit given for the Belgian case in stage III, accounting for the uncertainty with respect to the pH values that could be expected in depleted uranium.
The proposed concentration limit for Uranium in the Host Rock is 2.5 times as large as the (recalculated) best estimate given for the Belgian case, and equivalent to the upper limit value. Here, the higher pH-range assumed for the Dutch case leads to more conservative values due to the formation of relevant amounts of uranyl carbonate. However, a rather high uncertainty is noted that cannot be resolved by geochemical modelling only.
The proposed concentration limit for Thorium in Waste-EBS is about three orders of magnitude larger than the upper limit given for the Belgian case, accounting for the presence of DOC in the Waste-EBS compartment on the long term.
The proposed concentration limit for Neptunium in Waste-EBS is about five orders of magnitude larger than the upper limit given for the Belgian case.
The proposed concentration limit for Neptunium in the Host Rock for the base case is about three times larger than the (recalculated) best estimate given for the Belgian case. Based on the geochemical modelling as performed in RANMIG [21], a higher affinity to DOC binding is assumed, compared to the (generic) factor of 40 as applied by SCK∙CEN. This lead to more conservative values.
With respect to the differences in solubility between the Waste-EBS and Host Rock compartment, it is obvious that the lowest solubility values will define the overall system behaviour, i.e. for U and Th the solubility in the Waste-EBS, and for Np the solubility in the host rock.
OPERA-PU-NRG742 DRAFT Page 27 of 39
References [1] Verhoef, E and TJ Schröder, OPERA Research plan, OPERA-PG-COV004, COVRA N.V.,
2011, 1-48. [2] Verhoef, E, E Neeft, JB Grupa, A Poley, OPERA. Outline of a disposal concept in
clay, OPERA report OPERA-PG-COV008, COVRA N.V., First update November 2014, 1-20.
[3] Nuclear Energy Agency (NEA), Confidence in the Long-term Safety of Deep Geological Repositories. Its Development and Communication, OECD, Paris, 1999, 1-80.
[4] Nuclear Energy Agency (NEA), Stepwise Approach to Decision Making for Long-term Radioactive Waste Management. Experience, Issues and Guiding Principles, NEA report No. 4429 - ISBN 92-64-02077-2OECD, Paris, 2004, 1-72.
[5] Grupa, JB, P Davis, Report on the OPERA Safety Case structure, OPERA report OPERA-PU-NRG008, January 2014, 1-24.
[6] Atkins, P.W. Physical chemistry. 5th edition. W.H. Freeman and Company, New York, 1994.
[7] Luther III, GW, DT Rickard, S Theberge, A Olroyd, 1996, Determination of metal (bi)sulfide stability constants of Mn2+, Fe2+, Co2+, Ni2+, Cu2+, and Zn2+ by voltametric methods, Environ. Sci. Technol. 30, p. 671–679.
[8] Rozan, TF, ME Lassmann, DP Ridge, GW Luther II, 2000, Evidence for iron, copper and zinc complexation as multinuclear sulphide clusters in oxic rivers, Nature 406, p.879-882.
[9] Vandenborre, J, A Abdelouas, B Grambow, 2008, Discrepancies in Thorium oxide solubility values: a new experimental approach to improve understanding of oxide surface at solid/solution interface, Radiochim. Acta 96, p.551-520.
[10] Walther, C, From Hydrolysis to the Formation of Colloids - Polymerization of Tetravalent Actinide Ions, Forschungszentrum Karlsruhe, Institut für Nukleare Entsorgung. Wissenschaftliche Berichte FZKA 7442, Karlruhe, 2008.
[11] Buesseler, KO, DI Kaplan, M Dai, S Pike, 2009, Source-Dependent and Source-Independent Controls on Plutonium Oxidation State and Colloid Associations in Groundwater, Environ. Sci. Technol. 43, p.1322–1328.
[12] Schäfer T, H Geckeis, M Bouby, T. Fanghänel, 2004, U, Th, Eu and colloid mobility in a granite fracture under near-natural flow conditions, Radiochim. Acta. 92, p.731-736.
[13] Breyneart, E, Formation, Stability and Application of Eigencolloids Technetium and Chromium. PhD-thesis KU Leuven, May 2008.
[14] Vercouter, T, F Casanova, A Calvo, B Amekraz, C Moulin, Influence of silicate ions on Eu(III) aqueous speciation, In: Buckau, G, L Duro, B Kienzler, V Montoya, A Delos (eds.), 4th Annual Workshop Proceedings of the Integrated Project “Fundamental Processes of Radionuclide Migration” (6th EC FP IP FUNMIG), Forschungzentrum Karlsruhe GmbH, Karlsruhe, 2009, p.263-270.
[15] Weng, LP, E Fest, J Fillius, EJM Temminghoff, WH van Riemsdijk, 2002, Transport of humic and fulvic acids in relation to metal mobility in a copper-contaminated acid sandy soil, Environ. Sci. Technol. 36, p.1699-1704.
[16] Temminghoff, EJM., SEATM van der Zee, FAM de Haan, 1998, Effects of dissolved organic matter on the mobility of copper in a contaminated sandy soil, European J. Soil Sci. 49, p.617-628.
[17] Janssen, RPT, WJGM Peijnenburg, L Posthuma, MAGT van den Hoop, 1997, Equilibrium partitioning of heavy metals in Dutch field soils. I. Relationship between metal partitioning coefficients and soil characteristics, Environ. Toxicol. Chem. 16, p.2470-2478.
OPERA-PU-NRG742 DRAFT Page 28 of 39
[18] Citeau, L, I Lamy, F van Oort, F Elsass, 2003, Colloidal facilitated transfer of
metals in soils under different land use, Colloids Surf. A: Physicochem. Eng. Aspects. 217, p.11-19.
[19] Franchi, A, CR O’Melia, 2003, Effects of Natural Organic Matter and Solution Chemistry on the Deposition and Reentrainment of Colloids in Porous Media, Environ. Sci. Technol. 37, p.1122-1129.
[20] Missana, T, U Alonso, M Garciá-Gutiérrez, M Mingarro, 2008, Role of bentonite colloids on europium and plutonium migration in a granite fracture, Appl. Geochem. 23, p.1484–1497.
[21] Schröder, TJ, JCL Meeussen, Final report on radionuclide sorption in Boom Clay, OPERA report OPERA-PU-NRG6123, 2017.
[22] Appelo, CAJ, D Postma, Geochemistry, Groundwater and Pollution, Balkema, Rotterdam, The Netherlands, 1994, 1-536.
[23] Stumm, W, JJ Morgan, Aquatic Chemistry, 3rd ed., John Wiley&Sons, New York, 1996.
[24] Luther III, GW, DT Rickard, S Theberge, A Olroyd, 1996, Determination of metal (bi)sulfide stability constants of Mn2+, Fe2+, Co2+, Ni2+, Cu2+, and Zn2+ by voltametric methods. Environ. Sci. Technol. 30, p.671–679.
[25] Vandenborre, J, A Abdelouas, B Grambow, 2008, Discrepanties in Thorium oxide solubility values: a new experimental approach to improve understanding of oxide surface at solid/solution interface, Radiochim. Acta 96, p.515-520.
[26] Grauer, R, 1997, Solubility Limitations. An “Old Timer’s” View, In: Grenthe, I. en I. Puigdomenech (ed.): Modelling in aquatic chemistry. OECD Publications, ISBN 92-64-15569-4, p.131-152.
[27] Berner, U, 1998, Geochemical Modelling of Repository Systems: Limitations of the Thermodynamic Approach, Radiochim. Acta 82, p.423-428.
[28] Ganor, J, AC Lasaga, 1998, Simple mechanistic models for inhibition of a dissolution reaction, Geochim. Cosmochim. Acta 62, p.1295–1306.
[29] Temmam, M, J Paquette, H Vali, 2000, Mn and Zn incorporation into calcite as a function of chloride aqueous concentration, Geochim. Cosmochim. Acta 64. p.2417-2430.
[30] Astilleros, JM, CM Pina, L Fernández-Díaz, A Putnis, 2002, Molecular-scale surface processes during the growth of calcite in the presence of manganese, Geochim. Cosmochim. Acta 66. p.3177–3189.
[31] Heberling, F, MA Denecke, D Bosbach, 2008, Neptunium(V) Coprecipitation with Calcite, Environ. Sci. Technol. 42, p.471–476.
[32] Lützenkirchen, J, F Huber, Interaction of uranyl with quartz - influence of dissolved silica, In: Buckau, G, L Duro, B Kienzler, V Montoya, A Delos (eds.), 4th Annual Workshop Proceedings of the Integrated Project “Fundamental Processes of Radionuclide Migration” (6th EC FP IP FUNMIG), Forschungzentrum Karlsruhe GmbH, Karlsruhe, 2009, p.297-303.
[33] Vercouter, T, B Amekraz, C Moulin, Silicate complexation of trivalent lanthanides and actinides. In: Buckau, G, L Duro, B Kienzler, V Montoya, A Delos (eds.), 4th Annual Workshop Proceedings of the Integrated Project “Fundamental Processes of Radionuclide Migration” (6th EC FP IP FUNMIG), Forschungzentrum Karlsruhe GmbH, Karlsruhe, 2009, p.367-374.
[34] Lindsay, WL, Equilibria in Soils, John Wiley & Sons, New York, 1979. [35] Parkhurst, DL, CAJ Appelo, User’s Guide to PHREEQC (Version 2). US Geol. Surv.
Water-Resour. Invest. Rep. 99-4259, 1999. [36] Allison, JD, DS Brown, KJ Novo-Gradac, MINTEQA2/PRODEFA2, A Geochemical
Assessment Model for Environmental Systems: Version 3.0 User’s Manual. US EPA, Athens, Georgia, 1991.

OPERA-PU-NRG742 DRAFT Page 29 of 39
[37] Nuclear Energy Agency (NEA), Chemical Thermodynamics Series Volume 1-13a,
OECD/Elsevier, 1992 - 2013. [38] Bolado, R, L Duro, JL Cormenzana, MA Cuñado, M Grivé, DG Bennett, PAMINA
Expert judgement review and exercise (estimation of the solubility limit distributions for five elements in the near field in a repository in granite), PAMINA Milestone report M2.2A.12, September 2009.
[39] Temminghoff, E.J.M., A.C.C. Plette, R. van Eck en W.H. van Riemsdijk. 2000. Determination of the chemical speciation of trace metals in aqueous systems by the Wageningen Donnan Membrane Technique. Anal. Chim. acta, 417, p.149-157
[40] Nolan, A.L., M.J. McLaughlin en S.D. Mason. 2003. Chemical Speciation of Zn, Cd, Cu, and Pb in Pore Waters of Agricultural and Contaminated Soils Using Donnan Dialysis. Environ. Sci. Technol. 37, p.90-98
[41] De Cannière, P, A Maes, S Williams, Ch Bruggeman, T Beauwens, N Maes, M Cowper, Behaviour of Selenium in Boom Clay, SCK∙CEN report ER-120, 2010, 1-328.
[42] Bruggeman, C., A. Maes, J. Vancluysen en P. Vandemussele. 2005. Selenite reduction in Boom clay: Effect of FeS2, clay minerals and dissolved organic matter. Environ. Poll. 137, p.209-221.
[43] Bruggeman C, N Maes, B Christiansen, S Stipp, E Breynaert, A Maes, S Regenspurg, ME Malström, X Liu, B Grambow, Th Schäfer, 2012, Redox-active phases and radionuclide equilibrium valence state in subsurface environments – new insights from 6th EC FP IP FUNMIG, Appl. Geochem. 27(2), p.404-413.
[44] Kang M, F Chen, S Wu, Y Yang, C Bruggeman, L Charlet, 2011, Effect of pH on Aqueous Se(IV) Reduction by Pyrite, Environ. Sci. Technol. 45(7), p. 2704-2710.
[45] Salah, S, L Wang, Speciation and solubility calculations for waste relevant radionuclides in Boom Clay. First Full Draft, SCK·CEN report ER-198, Mol, Belgium, 2014.
[46] Bruggeman, C, N Maes, Radionuclide migration and retention in Boom Clay, SCK·CEN report ER-345, Mol, Belgium: March 2017
[47] Hart, J, Determination of the inventory, Part A: Radionuclides, OPERA report OPERA-PU-NRG1112A, June 2015, 1-59.
[48] Verhoef, EV, EAC Neeft, G Deissmann, A Filby, RB Wiegers, DA Kers, Waste families in OPERA, OPERA report OPERA-PG-COV023, March 2016, 1-18.
[49] Hart, J, JCL Meeussen, E Rosca-Bocancea, TJ Schröder, Preliminary PA calculation results: Normal Evolution Scenario (NES) - Central Assessment Case - (N1-DV vA1), OPERA report OPERA-R-NRG7331, 23 February 2017.
[50] Schröder TJ, JCL Meeussen, Final report on radionuclide sorption in Boom Clay, OPERA report OPERA-PU-NRG6123, February 2017.
[51] Schröder TJ, J Hart, JCL Meeussen, Report on model parameterization - Normal evolution scenario, OPERA-PU-NRG7251-NES, 8 February 2017.
[52] Schröder TJ, JCL Meeussen, JJ Dijkstra, C Bruggeman, N Maes, Report on model representation of radionuclide sorption in Boom Clay, OPERA report OPERA-PU-NRG6121, January 2017.
[53] Wang L, Solubility of radionuclides in Supercontainer concrete, External Report SCK•CEN ER-239 (2013) 1-43.
[54] Bruggeman, C, N Maes, Radionuclide migration and retention in Boom Clay, SCK•CEN ER-0345, March 2017.
[55] Lothenbach, B, Thermodynamic data for hydrated solids in Portland cement system (CaO-Al2O3-SiO2-CaSO4-CaCO3-Fe2O3-MgO-H2O, www.empa.ch/web/s308/cemdata
[56] Verhoef, EW, AMG de Bruin, RB Wiegers, EAC Neeft, G Deissmann, Cementitious materials in the OPERA disposal concept, OPERA report OPERA-PG-COV020, 2014.
[57] Bruggeman, C, Maes, N, Radionuclide migration and retention in Boom Clay, SCK∙CEN report ER-0345, March 2017.
OPERA-PU-NRG742 DRAFT Page 30 of 39
[58] Thoenen, T, W Hummel, The PSI/Nagra Chemical Thermodynamic Database 12/07:
Data Selection for Uranium, Paul Scherrer Institut (PSI) TM-44-14-03, May 2014.
OPERA-PU-NRG6123 DRAFT Page 31 of 39
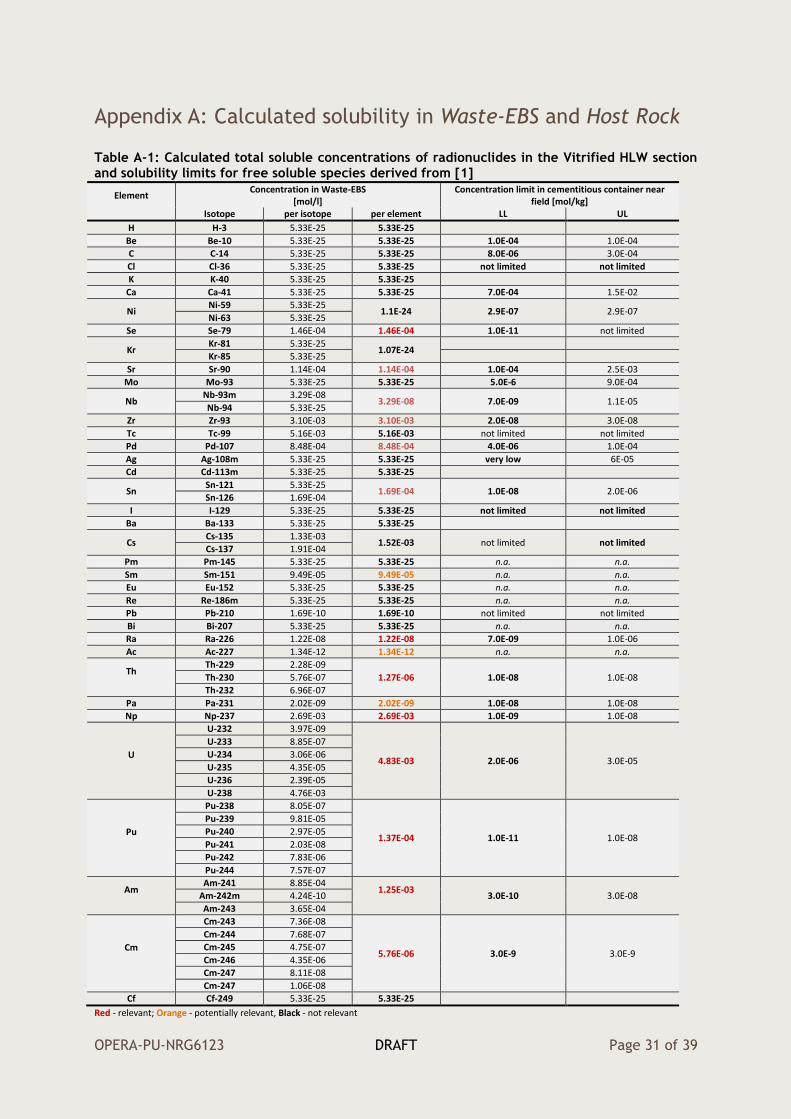
Appendix A: Calculated solubility in Waste-EBS and Host Rock Table A-1: Calculated total soluble concentrations of radionuclides in the Vitrified HLW section and solubility limits for free soluble species derived from [1]
Element Concentration in Waste-EBS
[mol/l] Concentration limit in cementitious container near
field [mol/kg] Isotope per isotope per element LL UL
H H-3 5.33E-25 5.33E-25
Be Be-10 5.33E-25 5.33E-25 1.0E-04 1.0E-04
C C-14 5.33E-25 5.33E-25 8.0E-06 3.0E-04
Cl Cl-36 5.33E-25 5.33E-25 not limited not limited
K K-40 5.33E-25 5.33E-25
Ca Ca-41 5.33E-25 5.33E-25 7.0E-04 1.5E-02
Ni Ni-59 5.33E-25
1.1E-24 2.9E-07 2.9E-07 Ni-63 5.33E-25
Se Se-79 1.46E-04 1.46E-04 1.0E-11 not limited
Kr Kr-81 5.33E-25
1.07E-24
Kr-85 5.33E-25
Sr Sr-90 1.14E-04 1.14E-04 1.0E-04 2.5E-03
Mo Mo-93 5.33E-25 5.33E-25 5.0E-6 9.0E-04
Nb Nb-93m 3.29E-08
3.29E-08 7.0E-09 1.1E-05 Nb-94 5.33E-25
Zr Zr-93 3.10E-03 3.10E-03 2.0E-08 3.0E-08
Tc Tc-99 5.16E-03 5.16E-03 not limited not limited
Pd Pd-107 8.48E-04 8.48E-04 4.0E-06 1.0E-04
Ag Ag-108m 5.33E-25 5.33E-25 very low 6E-05
Cd Cd-113m 5.33E-25 5.33E-25
Sn Sn-121 5.33E-25
1.69E-04 1.0E-08 2.0E-06 Sn-126 1.69E-04
I I-129 5.33E-25 5.33E-25 not limited not limited
Ba Ba-133 5.33E-25 5.33E-25
Cs Cs-135 1.33E-03
1.52E-03 not limited not limited Cs-137 1.91E-04
Pm Pm-145 5.33E-25 5.33E-25 n.a. n.a. Sm Sm-151 9.49E-05 9.49E-05 n.a. n.a. Eu Eu-152 5.33E-25 5.33E-25 n.a. n.a. Re Re-186m 5.33E-25 5.33E-25 n.a. n.a. Pb Pb-210 1.69E-10 1.69E-10 not limited not limited
Bi Bi-207 5.33E-25 5.33E-25 n.a. n.a.
Ra Ra-226 1.22E-08 1.22E-08 7.0E-09 1.0E-06
Ac Ac-227 1.34E-12 1.34E-12 n.a. n.a.
Th
Th-229 2.28E-09
1.27E-06 1.0E-08 1.0E-08 Th-230 5.76E-07
Th-232 6.96E-07
Pa Pa-231 2.02E-09 2.02E-09 1.0E-08 1.0E-08
Np Np-237 2.69E-03 2.69E-03 1.0E-09 1.0E-08
U
U-232 3.97E-09
4.83E-03 2.0E-06 3.0E-05
U-233 8.85E-07
U-234 3.06E-06
U-235 4.35E-05
U-236 2.39E-05
U-238 4.76E-03
Pu
Pu-238 8.05E-07
1.37E-04 1.0E-11 1.0E-08
Pu-239 9.81E-05
Pu-240 2.97E-05
Pu-241 2.03E-08
Pu-242 7.83E-06
Pu-244 7.57E-07
Am
Am-241 8.85E-04 1.25E-03
3.0E-10 3.0E-08 Am-242m 4.24E-10
Am-243 3.65E-04
Cm
Cm-243 7.36E-08
5.76E-06 3.0E-9 3.0E-9
Cm-244 7.68E-07
Cm-245 4.75E-07
Cm-246 4.35E-06
Cm-247 8.11E-08
Cm-247 1.06E-08
Cf Cf-249 5.33E-25 5.33E-25
Red - relevant; Orange - potentially relevant, Black - not relevant
OPERA-PU-NRG6123 DRAFT Page 32 of 39
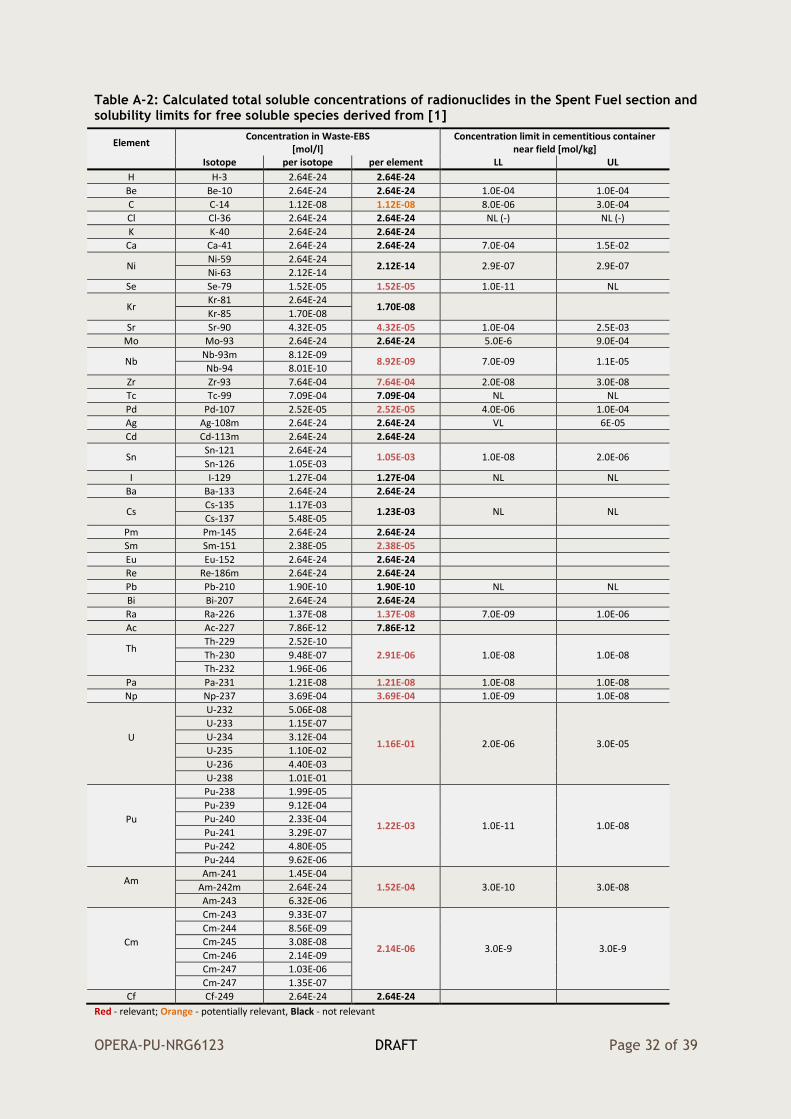
Table A-2: Calculated total soluble concentrations of radionuclides in the Spent Fuel section and solubility limits for free soluble species derived from [1]
Element Concentration in Waste-EBS
[mol/l] Concentration limit in cementitious container
near field [mol/kg] Isotope per isotope per element LL UL
H H-3 2.64E-24 2.64E-24
Be Be-10 2.64E-24 2.64E-24 1.0E-04 1.0E-04
C C-14 1.12E-08 1.12E-08 8.0E-06 3.0E-04
Cl Cl-36 2.64E-24 2.64E-24 NL (-) NL (-)
K K-40 2.64E-24 2.64E-24
Ca Ca-41 2.64E-24 2.64E-24 7.0E-04 1.5E-02
Ni Ni-59 2.64E-24
2.12E-14 2.9E-07 2.9E-07 Ni-63 2.12E-14
Se Se-79 1.52E-05 1.52E-05 1.0E-11 NL
Kr Kr-81 2.64E-24
1.70E-08 Kr-85 1.70E-08
Sr Sr-90 4.32E-05 4.32E-05 1.0E-04 2.5E-03
Mo Mo-93 2.64E-24 2.64E-24 5.0E-6 9.0E-04
Nb Nb-93m 8.12E-09
8.92E-09 7.0E-09 1.1E-05 Nb-94 8.01E-10
Zr Zr-93 7.64E-04 7.64E-04 2.0E-08 3.0E-08
Tc Tc-99 7.09E-04 7.09E-04 NL NL
Pd Pd-107 2.52E-05 2.52E-05 4.0E-06 1.0E-04
Ag Ag-108m 2.64E-24 2.64E-24 VL 6E-05
Cd Cd-113m 2.64E-24 2.64E-24
Sn Sn-121 2.64E-24
1.05E-03 1.0E-08 2.0E-06 Sn-126 1.05E-03
I I-129 1.27E-04 1.27E-04 NL NL
Ba Ba-133 2.64E-24 2.64E-24
Cs Cs-135 1.17E-03
1.23E-03 NL NL Cs-137 5.48E-05
Pm Pm-145 2.64E-24 2.64E-24
Sm Sm-151 2.38E-05 2.38E-05
Eu Eu-152 2.64E-24 2.64E-24
Re Re-186m 2.64E-24 2.64E-24
Pb Pb-210 1.90E-10 1.90E-10 NL NL
Bi Bi-207 2.64E-24 2.64E-24
Ra Ra-226 1.37E-08 1.37E-08 7.0E-09 1.0E-06
Ac Ac-227 7.86E-12 7.86E-12
Th
Th-229 2.52E-10
2.91E-06 1.0E-08 1.0E-08 Th-230 9.48E-07
Th-232 1.96E-06
Pa Pa-231 1.21E-08 1.21E-08 1.0E-08 1.0E-08
Np Np-237 3.69E-04 3.69E-04 1.0E-09 1.0E-08
U
U-232 5.06E-08
1.16E-01 2.0E-06 3.0E-05
U-233 1.15E-07
U-234 3.12E-04
U-235 1.10E-02
U-236 4.40E-03
U-238 1.01E-01
Pu
Pu-238 1.99E-05
1.22E-03 1.0E-11 1.0E-08
Pu-239 9.12E-04
Pu-240 2.33E-04
Pu-241 3.29E-07
Pu-242 4.80E-05
Pu-244 9.62E-06
Am
Am-241 1.45E-04
1.52E-04 3.0E-10 3.0E-08 Am-242m 2.64E-24
Am-243 6.32E-06
Cm
Cm-243 9.33E-07
2.14E-06 3.0E-9 3.0E-9
Cm-244 8.56E-09
Cm-245 3.08E-08
Cm-246 2.14E-09
Cm-247 1.03E-06
Cm-247 1.35E-07
Cf Cf-249 2.64E-24 2.64E-24
Red - relevant; Orange - potentially relevant, Black - not relevant
OPERA-PU-NRG6123 DRAFT Page 33 of 39
Table A-3: Calculated total soluble concentrations of radionuclides in the Non-heat-producing HLW section and solubility limits for free soluble species derived from [1]
Element Concentration in Waste-EBS
[mol/l] Concentration limit in cementitious container
near field [mol/kg] Isotope per isotope per element LL UL
H H-3 5.12E-09 5.12E-09
Be Be-10 3.65E-25 3.65E-25 1.0E-04 1.0E-04
C C-14 1.32E-06 1.32E-06 8.0E-06 3.0E-04
Cl Cl-36 3.65E-25 3.65E-25 NL (-) NL (-)
K K-40 3.65E-25 3.65E-25
Ca Ca-41 5.12E-09 5.12E-09 7.0E-04 1.5E-02
Ni Ni-59 4.57E-04
4.86E-04 2.9E-07 2.9E-07 Ni-63 2.94E-05
Se Se-79 5.30E-07 5.30E-07 1.0E-11 NL
Kr Kr-81 3.65E-25
2.15E-10 Kr-85 2.15E-10
Sr Sr-90 1.50E-06 1.50E-06 1.0E-04 2.5E-03
Mo Mo-93 3.87E-07 3.87E-07 5.0E-6 9.0E-04
Nb Nb-93m 3.79E-09
1.86E-05 7.0E-09 1.1E-05 Nb-94 1.86E-05
Zr Zr-93 2.29E-04 2.29E-04 2.0E-08 3.0E-08
Tc Tc-99 1.32E-04 1.32E-04 NL NL
Pd Pd-107 8.40E-07 8.40E-07 4.0E-06 1.0E-04
Ag Ag-108m 1.14E-14 1.14E-14 VL 6E-05
Cd Cd-113m 3.65E-25 3.65E-25
Sn Sn-121 3.65E-25
4.35E-07 1.0E-08 2.0E-06 Sn-126 4.35E-07
I I-129 1.47E-05 1.47E-05 NL NL
Ba Ba-133 3.65E-25 3.65E-25
Cs Cs-135 4.02E-05 4.19E-05
NL NL
Cs-137 1.71E-06
Pm Pm-145 3.65E-25 3.65E-25
Sm Sm-151 8.15E-07 8.15E-07
Eu Eu-152 8.81E-13 8.81E-13
Re Re-186m 3.65E-25 3.65E-25
Pb Pb-210 1.58E-10 1.58E-10 NL NL
Bi Bi-207 3.65E-25 3.65E-25
Ra Ra-226 1.14E-08 1.14E-08 7.0E-09 1.0E-06
Ac Ac-227 2.26E-12 2.26E-12
Th
Th-229 5.98E-10
1.25E-06 1.0E-08 1.0E-08 Th-230 5.37E-07
Th-232 7.08E-07
Pa Pa-231 3.39E-09 1.0E-08 1.0E-08
Np Np-237 1.61E-06 1.61E-06 1.0E-09 1.0E-08
U
U-232 3.48E-11
1.50E-03 2.0E-06 3.0E-05
U-233 1.30E-08
U-234 2.98E-06
U-235 7.30E-05
U-236 2.43E-05
U-238 1.40E-03
Pu
Pu-238 1.82E-06
1.41E-04 1.0E-11 1.0E-08
Pu-239 8.59E-05
Pu-240 4.02E-05
Pu-241 3.37E-08
Pu-242 1.30E-05
Pu-244 6.65E-09
Am
Am-241 3.96E-07
4.71E-07 3.0E-10 3.0E-08 Am-242m 3.65E-10
Am-243 7.53E-08
Cm
Cm-243 6.43E-10
7.51E-09 3.0E-9 3.0E-9
Cm-244 4.13E-09
Cm-245 1.56E-09
Cm-246 3.76E-10
Cm-247 7.12E-10
Cm-247 9.35E-11
Cf Cf-249 1.90E-14 1.90E-14
Red - relevant; Orange - potentially relevant, Black - not relevant
OPERA-PU-NRG6123 DRAFT Page 34 of 39
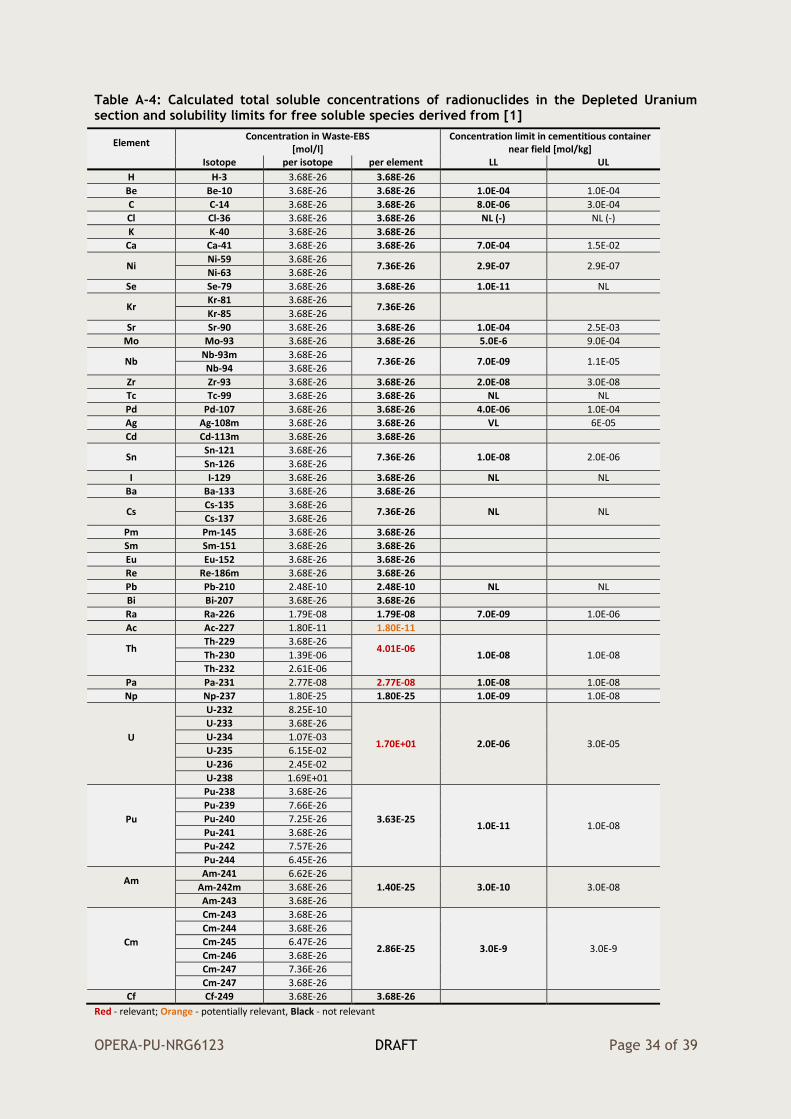
Table A-4: Calculated total soluble concentrations of radionuclides in the Depleted Uranium section and solubility limits for free soluble species derived from [1]
Element Concentration in Waste-EBS
[mol/l] Concentration limit in cementitious container
near field [mol/kg] Isotope per isotope per element LL UL
H H-3 3.68E-26 3.68E-26
Be Be-10 3.68E-26 3.68E-26 1.0E-04 1.0E-04
C C-14 3.68E-26 3.68E-26 8.0E-06 3.0E-04
Cl Cl-36 3.68E-26 3.68E-26 NL (-) NL (-)
K K-40 3.68E-26 3.68E-26
Ca Ca-41 3.68E-26 3.68E-26 7.0E-04 1.5E-02
Ni Ni-59 3.68E-26
7.36E-26 2.9E-07 2.9E-07 Ni-63 3.68E-26
Se Se-79 3.68E-26 3.68E-26 1.0E-11 NL
Kr Kr-81 3.68E-26
7.36E-26 Kr-85 3.68E-26
Sr Sr-90 3.68E-26 3.68E-26 1.0E-04 2.5E-03
Mo Mo-93 3.68E-26 3.68E-26 5.0E-6 9.0E-04
Nb Nb-93m 3.68E-26
7.36E-26 7.0E-09 1.1E-05 Nb-94 3.68E-26
Zr Zr-93 3.68E-26 3.68E-26 2.0E-08 3.0E-08
Tc Tc-99 3.68E-26 3.68E-26 NL NL
Pd Pd-107 3.68E-26 3.68E-26 4.0E-06 1.0E-04
Ag Ag-108m 3.68E-26 3.68E-26 VL 6E-05
Cd Cd-113m 3.68E-26 3.68E-26
Sn Sn-121 3.68E-26
7.36E-26 1.0E-08 2.0E-06 Sn-126 3.68E-26
I I-129 3.68E-26 3.68E-26 NL NL
Ba Ba-133 3.68E-26 3.68E-26
Cs Cs-135 3.68E-26
7.36E-26 NL NL Cs-137 3.68E-26
Pm Pm-145 3.68E-26 3.68E-26
Sm Sm-151 3.68E-26 3.68E-26
Eu Eu-152 3.68E-26 3.68E-26
Re Re-186m 3.68E-26 3.68E-26
Pb Pb-210 2.48E-10 2.48E-10 NL NL
Bi Bi-207 3.68E-26 3.68E-26
Ra Ra-226 1.79E-08 1.79E-08 7.0E-09 1.0E-06
Ac Ac-227 1.80E-11 1.80E-11
Th
Th-229 3.68E-26 4.01E-06
1.0E-08 1.0E-08 Th-230 1.39E-06
Th-232 2.61E-06
Pa Pa-231 2.77E-08 2.77E-08 1.0E-08 1.0E-08
Np Np-237 1.80E-25 1.80E-25 1.0E-09 1.0E-08
U
U-232 8.25E-10
1.70E+01 2.0E-06 3.0E-05
U-233 3.68E-26
U-234 1.07E-03
U-235 6.15E-02
U-236 2.45E-02
U-238 1.69E+01
Pu
Pu-238 3.68E-26
3.63E-25
1.0E-11 1.0E-08
Pu-239 7.66E-26
Pu-240 7.25E-26
Pu-241 3.68E-26
Pu-242 7.57E-26
Pu-244 6.45E-26
Am
Am-241 6.62E-26
1.40E-25 3.0E-10 3.0E-08 Am-242m 3.68E-26
Am-243 3.68E-26
Cm
Cm-243 3.68E-26
2.86E-25 3.0E-9 3.0E-9
Cm-244 3.68E-26
Cm-245 6.47E-26
Cm-246 3.68E-26
Cm-247 7.36E-26
Cm-247 3.68E-26
Cf Cf-249 3.68E-26 3.68E-26
Red - relevant; Orange - potentially relevant, Black - not relevant
OPERA-PU-NRG6123 DRAFT Page 35 of 39
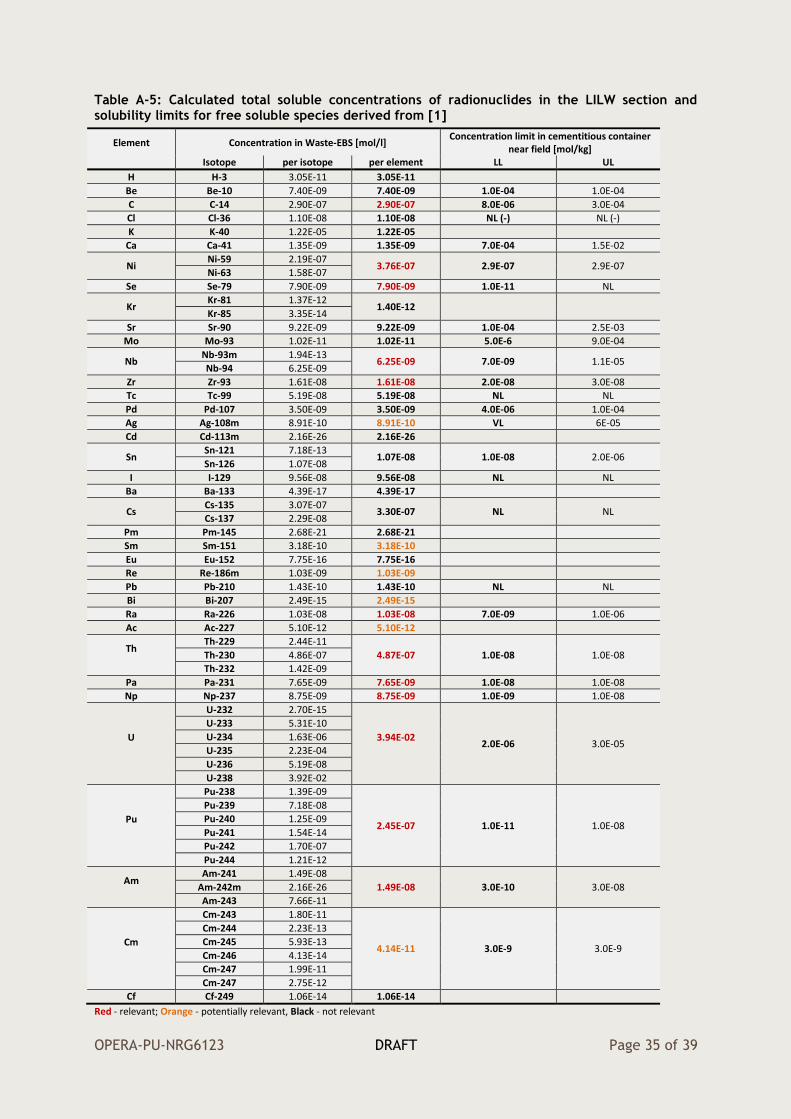
Table A-5: Calculated total soluble concentrations of radionuclides in the LILW section and solubility limits for free soluble species derived from [1]
Element Concentration in Waste-EBS [mol/l] Concentration limit in cementitious container
near field [mol/kg] Isotope per isotope per element LL UL
H H-3 3.05E-11 3.05E-11
Be Be-10 7.40E-09 7.40E-09 1.0E-04 1.0E-04
C C-14 2.90E-07 2.90E-07 8.0E-06 3.0E-04
Cl Cl-36 1.10E-08 1.10E-08 NL (-) NL (-)
K K-40 1.22E-05 1.22E-05
Ca Ca-41 1.35E-09 1.35E-09 7.0E-04 1.5E-02
Ni Ni-59 2.19E-07
3.76E-07 2.9E-07 2.9E-07 Ni-63 1.58E-07
Se Se-79 7.90E-09 7.90E-09 1.0E-11 NL
Kr Kr-81 1.37E-12
1.40E-12 Kr-85 3.35E-14
Sr Sr-90 9.22E-09 9.22E-09 1.0E-04 2.5E-03
Mo Mo-93 1.02E-11 1.02E-11 5.0E-6 9.0E-04
Nb Nb-93m 1.94E-13
6.25E-09 7.0E-09 1.1E-05 Nb-94 6.25E-09
Zr Zr-93 1.61E-08 1.61E-08 2.0E-08 3.0E-08
Tc Tc-99 5.19E-08 5.19E-08 NL NL
Pd Pd-107 3.50E-09 3.50E-09 4.0E-06 1.0E-04
Ag Ag-108m 8.91E-10 8.91E-10 VL 6E-05
Cd Cd-113m 2.16E-26 2.16E-26
Sn Sn-121 7.18E-13
1.07E-08 1.0E-08 2.0E-06 Sn-126 1.07E-08
I I-129 9.56E-08 9.56E-08 NL NL
Ba Ba-133 4.39E-17 4.39E-17
Cs Cs-135 3.07E-07
3.30E-07 NL NL Cs-137 2.29E-08
Pm Pm-145 2.68E-21 2.68E-21
Sm Sm-151 3.18E-10 3.18E-10
Eu Eu-152 7.75E-16 7.75E-16
Re Re-186m 1.03E-09 1.03E-09
Pb Pb-210 1.43E-10 1.43E-10 NL NL
Bi Bi-207 2.49E-15 2.49E-15
Ra Ra-226 1.03E-08 1.03E-08 7.0E-09 1.0E-06
Ac Ac-227 5.10E-12 5.10E-12
Th
Th-229 2.44E-11
4.87E-07 1.0E-08 1.0E-08 Th-230 4.86E-07
Th-232 1.42E-09
Pa Pa-231 7.65E-09 7.65E-09 1.0E-08 1.0E-08
Np Np-237 8.75E-09 8.75E-09 1.0E-09 1.0E-08
U
U-232 2.70E-15
3.94E-02
2.0E-06 3.0E-05
U-233 5.31E-10
U-234 1.63E-06
U-235 2.23E-04
U-236 5.19E-08
U-238 3.92E-02
Pu
Pu-238 1.39E-09
2.45E-07 1.0E-11 1.0E-08
Pu-239 7.18E-08
Pu-240 1.25E-09
Pu-241 1.54E-14
Pu-242 1.70E-07
Pu-244 1.21E-12
Am
Am-241 1.49E-08
1.49E-08 3.0E-10 3.0E-08 Am-242m 2.16E-26
Am-243 7.66E-11
Cm
Cm-243 1.80E-11
4.14E-11 3.0E-9 3.0E-9
Cm-244 2.23E-13
Cm-245 5.93E-13
Cm-246 4.13E-14
Cm-247 1.99E-11
Cm-247 2.75E-12
Cf Cf-249 1.06E-14 1.06E-14
Red - relevant; Orange - potentially relevant, Black - not relevant
OPERA-PU-NRG6123 DRAFT Page 36 of 39
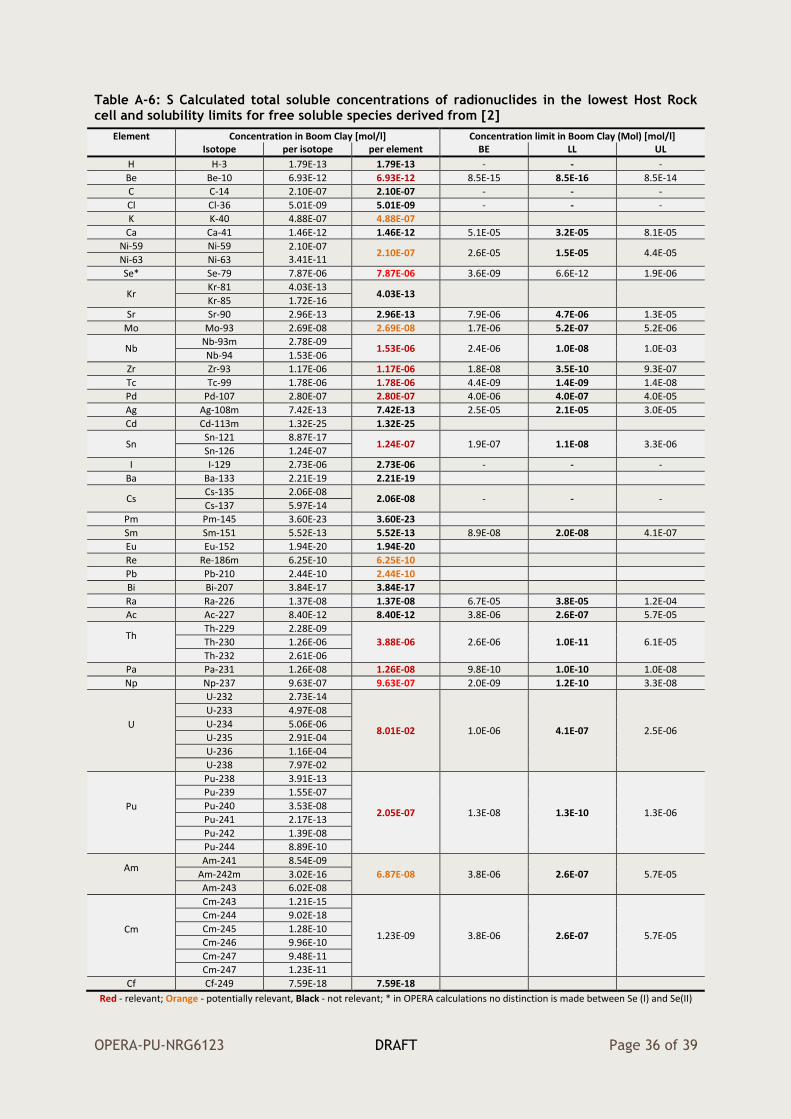
Table A-6: S Calculated total soluble concentrations of radionuclides in the lowest Host Rock cell and solubility limits for free soluble species derived from [2]
Element Concentration in Boom Clay [mol/l] Concentration limit in Boom Clay (Mol) [mol/l] Isotope per isotope per element BE LL UL
H H-3 1.79E-13 1.79E-13 - - -
Be Be-10 6.93E-12 6.93E-12 8.5E-15 8.5E-16 8.5E-14
C C-14 2.10E-07 2.10E-07 - - -
Cl Cl-36 5.01E-09 5.01E-09 - - -
K K-40 4.88E-07 4.88E-07
Ca Ca-41 1.46E-12 1.46E-12 5.1E-05 3.2E-05 8.1E-05
Ni-59 Ni-59 2.10E-07 3.41E-11
2.10E-07 2.6E-05 1.5E-05 4.4E-05 Ni-63 Ni-63
Se* Se-79 7.87E-06 7.87E-06 3.6E-09 6.6E-12 1.9E-06
Kr Kr-81 4.03E-13
4.03E-13 Kr-85 1.72E-16
Sr Sr-90 2.96E-13 2.96E-13 7.9E-06 4.7E-06 1.3E-05
Mo Mo-93 2.69E-08 2.69E-08 1.7E-06 5.2E-07 5.2E-06
Nb Nb-93m 2.78E-09
1.53E-06 2.4E-06 1.0E-08 1.0E-03 Nb-94 1.53E-06
Zr Zr-93 1.17E-06 1.17E-06 1.8E-08 3.5E-10 9.3E-07
Tc Tc-99 1.78E-06 1.78E-06 4.4E-09 1.4E-09 1.4E-08
Pd Pd-107 2.80E-07 2.80E-07 4.0E-06 4.0E-07 4.0E-05
Ag Ag-108m 7.42E-13 7.42E-13 2.5E-05 2.1E-05 3.0E-05
Cd Cd-113m 1.32E-25 1.32E-25
Sn Sn-121 8.87E-17
1.24E-07 1.9E-07 1.1E-08 3.3E-06 Sn-126 1.24E-07
I I-129 2.73E-06 2.73E-06 - - -
Ba Ba-133 2.21E-19 2.21E-19
Cs Cs-135 2.06E-08
2.06E-08 - - - Cs-137 5.97E-14
Pm Pm-145 3.60E-23 3.60E-23
Sm Sm-151 5.52E-13 5.52E-13 8.9E-08 2.0E-08 4.1E-07
Eu Eu-152 1.94E-20 1.94E-20
Re Re-186m 6.25E-10 6.25E-10
Pb Pb-210 2.44E-10 2.44E-10
Bi Bi-207 3.84E-17 3.84E-17
Ra Ra-226 1.37E-08 1.37E-08 6.7E-05 3.8E-05 1.2E-04
Ac Ac-227 8.40E-12 8.40E-12 3.8E-06 2.6E-07 5.7E-05
Th
Th-229 2.28E-09
3.88E-06 2.6E-06 1.0E-11 6.1E-05 Th-230 1.26E-06
Th-232 2.61E-06
Pa Pa-231 1.26E-08 1.26E-08 9.8E-10 1.0E-10 1.0E-08
Np Np-237 9.63E-07 9.63E-07 2.0E-09 1.2E-10 3.3E-08
U
U-232 2.73E-14
8.01E-02 1.0E-06 4.1E-07 2.5E-06
U-233 4.97E-08
U-234 5.06E-06
U-235 2.91E-04
U-236 1.16E-04
U-238 7.97E-02
Pu
Pu-238 3.91E-13
2.05E-07 1.3E-08 1.3E-10 1.3E-06
Pu-239 1.55E-07
Pu-240 3.53E-08
Pu-241 2.17E-13
Pu-242 1.39E-08
Pu-244 8.89E-10
Am
Am-241 8.54E-09
6.87E-08 3.8E-06 2.6E-07 5.7E-05 Am-242m 3.02E-16
Am-243 6.02E-08
Cm
Cm-243 1.21E-15
1.23E-09 3.8E-06 2.6E-07 5.7E-05
Cm-244 9.02E-18
Cm-245 1.28E-10
Cm-246 9.96E-10
Cm-247 9.48E-11
Cm-247 1.23E-11
Cf Cf-249 7.59E-18 7.59E-18
Red - relevant; Orange - potentially relevant, Black - not relevant; * in OPERA calculations no distinction is made between Se (I) and Se(II)
OPERA-PU-NRG6123 DRAFT Page 37 of 39
References Appendix [1] Wang L, Solubility of radionuclides in Supercontainer concrete, External Report
SCK•CEN ER-239 (2013) 1-43. [2] Bruggeman, C, N Maes, Radionuclide migration and retention in Boom Clay, SCK•CEN
ER-0345, March 2017

OPERA-PU-NRG6123 DRAFT Page 38 of 39
OPERA-PU-NRG6123 DRAFT Page 39 of 39
Disclaimer
This report has been prepared at the request and for the sole use of the Client and for the intended purposes as stated in the agreement between the Client and Contractors under which this work was completed.
Contractors have exercised due and customary care in preparing this report, but have not, save as specifically stated, independently verified all information provided by the Client and others. No warranty, expressed or implied is made in relation to the preparation of the report or the contents of this report. Therefore, Contractors are not liable for any damages and/or losses resulting from errors, omissions or misrepresentations of the report.
Any recommendations, opinions and/or findings stated in this report are based on circumstances and facts as received from the Client before the performance of the work by Contractors and/or as they existed at the time Contractors performed the work. Any changes in such circumstances and facts upon which this report is based may adversely affect any recommendations, opinions or findings contained in this report. Contractors have not sought to update the information contained in this report from the time Contractors performed the work.
The Client can only rely on or rights can be derived from the final version of the report; a draft of the report does not bind or obligate Contractors in any way. A third party cannot derive rights from this report and Contractors shall in no event be liable for any use of (the information stated in) this report by third parties.

OPERA-PU-NRG6123 DRAFT Page 1 of 39


![SOLUBILITY AND SOLUBILITY PRODUCT - Instruct · SOLUBILITY AND SOLUBILITY PRODUCT [MH 5; 16.1 & 16.2] • In this section we are going to consider the solubility of ionic solids in](https://img.pdfslide.us/doc/110x75/5ae1efb27f8b9a90138bbc8f/solubility-and-solubility-product-instruct-and-solubility-product-mh-5-161.jpg)