Embed Size (px)
Citation preview

SolocalJanuary 2020
JANUARY 2020
DisclaimerThis document contains forward-looking statements. Any forward-looking statement does not constitute forecasts as defined in Europeanregulation (EC) 809/2004. Forward-looking statements relate to expectations, beliefs, projections, future plans and strategies, anticipated events ortrends and similar expressions concerning matters that are not historical facts. The forward-looking statements are based on the Company’scurrent beliefs, assumptions and expectations of its future performance, taking into account all information currently available. Forward-lookinginformation and statements are not guarantees of future performance and are subject to various risks and uncertainties, many of which are difficultto predict and generally beyond the control of the Company. These risks and uncertainties include those discussed or identified under section 4 “RiskFactors” of the SoLocal Group’s reference document which was filed with the French financial markets authority (AMF) on 21st March 2019. Importantfactors that could cause actual results to differ materially from the results anticipated in the forward-looking statements include, among otherthings: the effects of competition; usage levels; the success of investments by the Group in France and abroad; the effects of the economic situation.SoLocal Group, its affiliates, directors, advisors, employees and representatives expressly disclaim any liability whatsoever for such forward-lookingstatements.
The forward-looking statements contained in this document apply only at the date of this document. Solocal Group does not undertake to updateany of these statements to take account of events or circumstances arising after the date of said document or to take account of the occurrence ofunexpected events.
Accounting data presented on an annual basis are in audited consolidated form, but all accounting data indicated on a quarterly basis are inunaudited consolidated form. Business indicators covered in the presentation are for continued activities. Due to rounding, numbers presentedthroughout this and other documents may not add up precisely to the total provided.
P.2
Key investment highlights
3
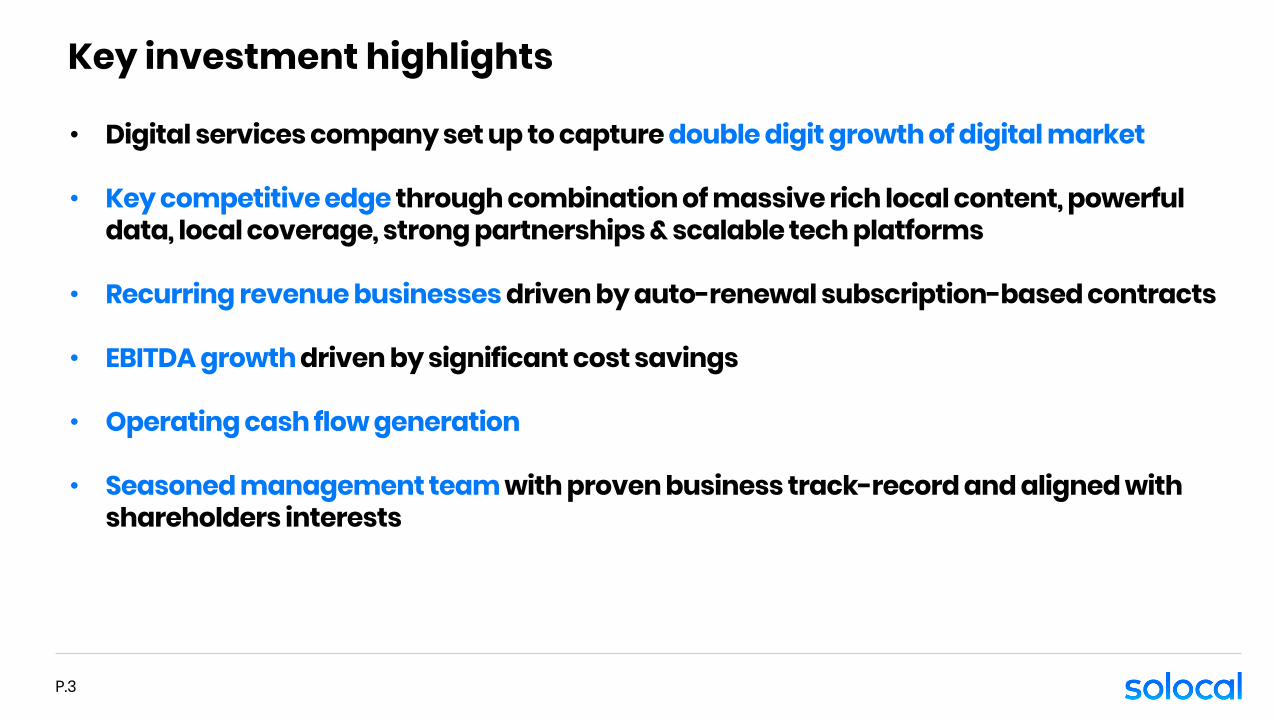
• Digital services company set up to capture double digit growth of digital market
• Key competitive edge through combination of massive rich local content, powerful data, local coverage, strong partnerships & scalable tech platforms
• Recurring revenue businesses driven by auto-renewal subscription-based contracts
• EBITDA growth driven by significant cost savings
• Operating cash flow generation
• Seasoned management team with proven business track-record and aligned with shareholders interests
P.3

Presentation
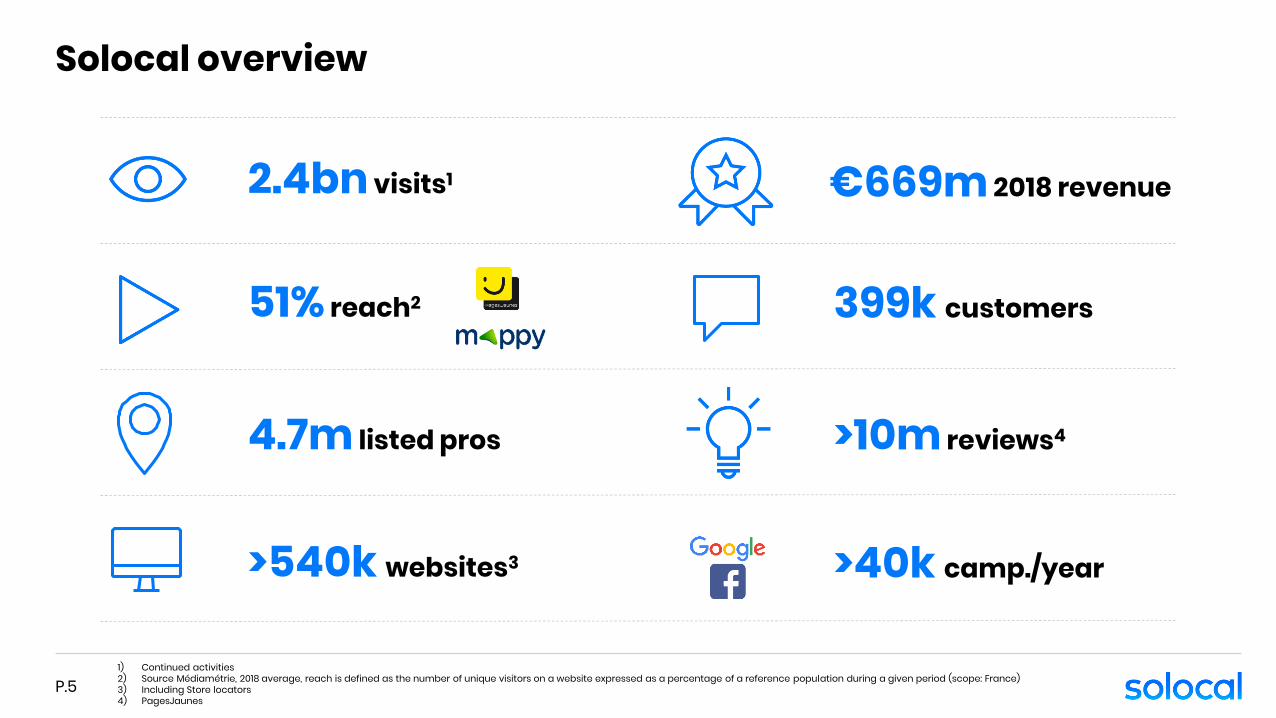
Solocal overview
5
2.4bn visits1
51% reach2
€669m 2018 revenue
399k customers
4.7m listed pros
>40k camp./year>540k websites3
>10m reviews4
1) Continued activities2) Source Médiamétrie, 2018 average, reach is defined as the number of unique visitors on a website expressed as a percentage of a reference population during a given period (scope: France)3) Including Store locators 4) PagesJaunes
P.5
Financial Highlights
P.6
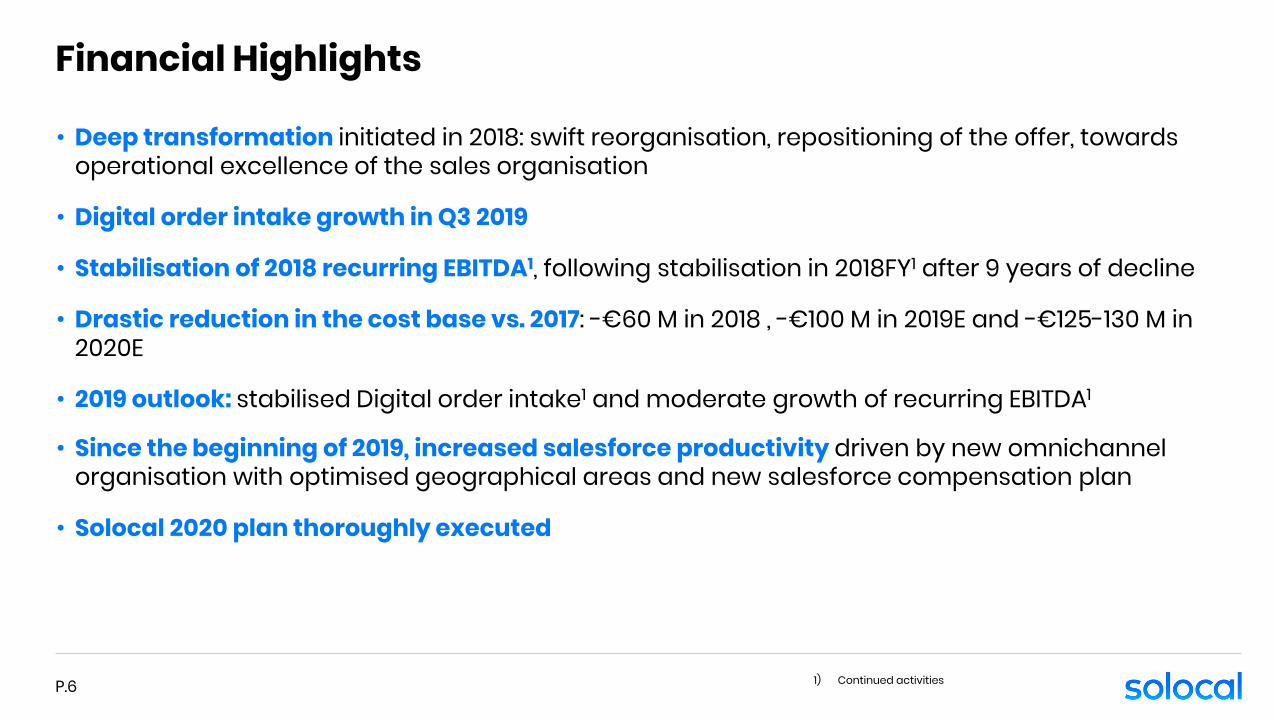
• Deep transformation initiated in 2018: swift reorganisation, repositioning of the offer, towards operational excellence of the sales organisation
• Digital order intake growth in Q3 2019
• Stabilisation of 2018 recurring EBITDA1, following stabilisation in 2018FY1 after 9 years of decline
• Drastic reduction in the cost base vs. 2017: -€60 M in 2018 , -€100 M in 2019E and -€125-130 M in 2020E
• 2019 outlook: stabilised Digital order intake1 and moderate growth of recurring EBITDA1
• Since the beginning of 2019, increased salesforce productivity driven by new omnichannel organisation with optimised geographical areas and new salesforce compensation plan
• Solocal 2020 plan thoroughly executed
1) Continued activities
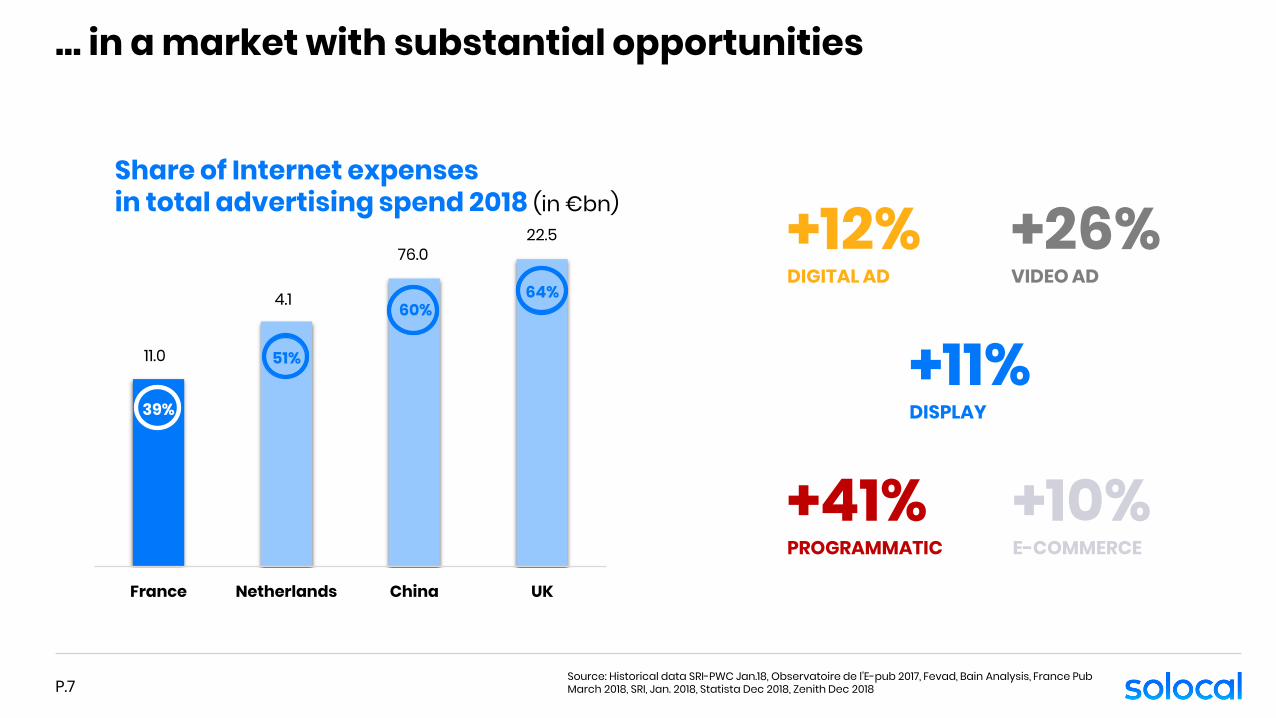
… in a market with substantial opportunities
+12%DIGITAL AD
+41%PROGRAMMATIC
+26%VIDEO AD
+11%DISPLAY
+10%E-COMMERCE
Source: Historical data SRI-PWC Jan.18, Observatoire de l’E-pub 2017, Fevad, Bain Analysis, France Pub March 2018, SRI, Jan. 2018, Statista Dec 2018, Zenith Dec 2018P.7
39%
51%
60%64%
France Netherlands China UK
11.0
4.1
22.576.0
Share of Internet expensesin total advertising spend 2018 (in €bn)
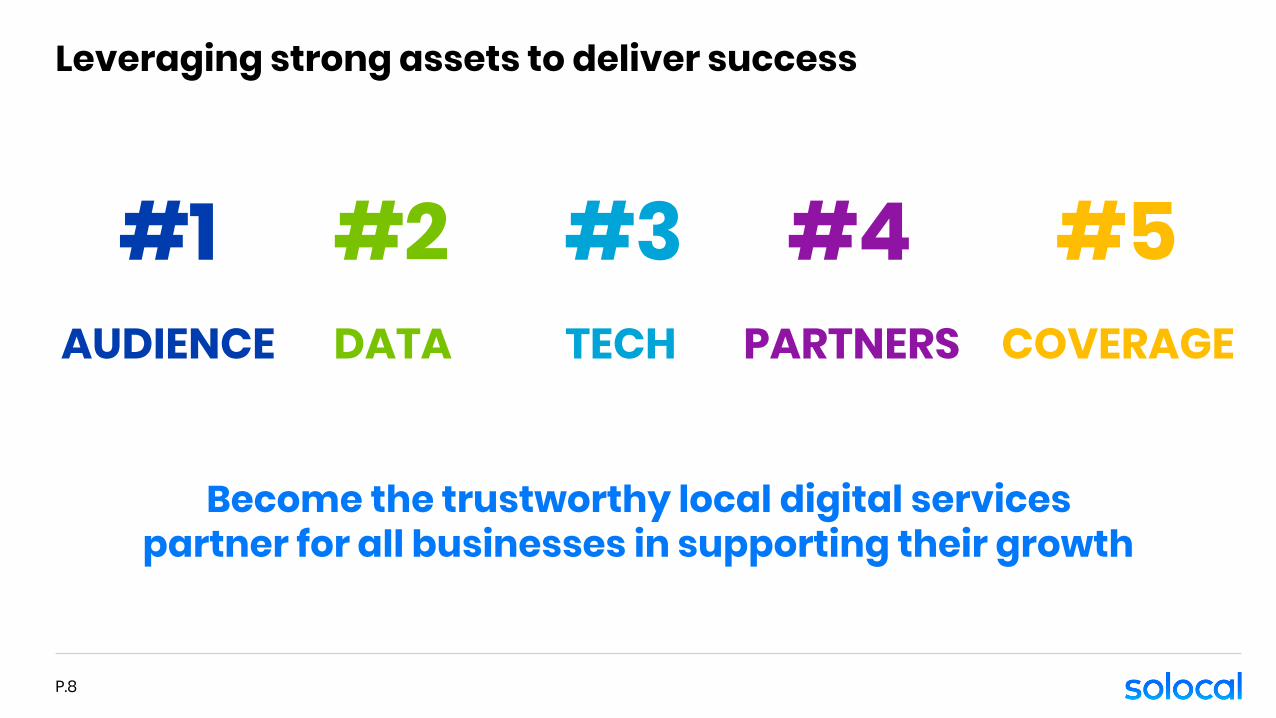
Leveraging strong assets to deliver success
#1 #2 #5#4AUDIENCE DATA COVERAGEPARTNERS
#3TECH
Become the trustworthy local digital services partner for all businesses in supporting their growth
P.8
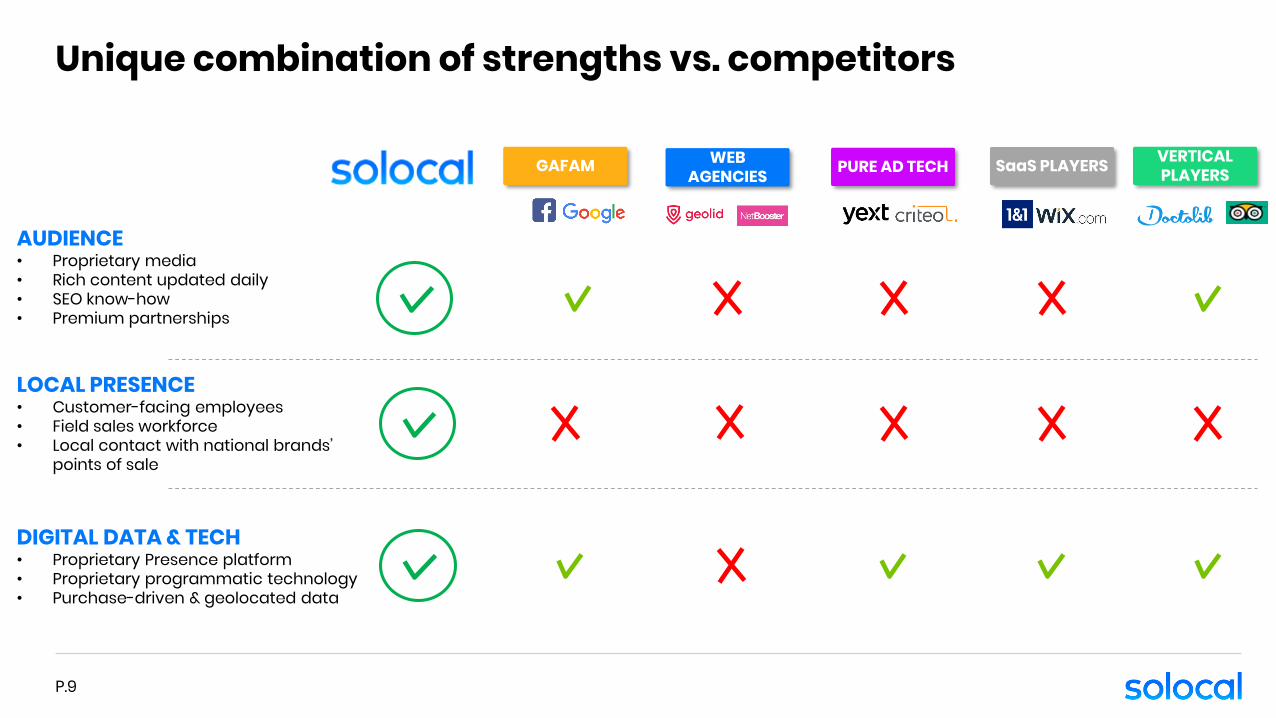
Unique combination of strengths vs. competitors
9
PURE AD TECHGAFAM WEB AGENCIES
LOCAL PRESENCE• Customer-facing employees• Field sales workforce• Local contact with national brands’
points of sale
DIGITAL DATA & TECH• Proprietary Presence platform• Proprietary programmatic technology• Purchase-driven & geolocated data
AUDIENCE• Proprietary media• Rich content updated daily• SEO know-how• Premium partnerships
SaaS PLAYERS VERTICALPLAYERS
P.9

Value Proposition
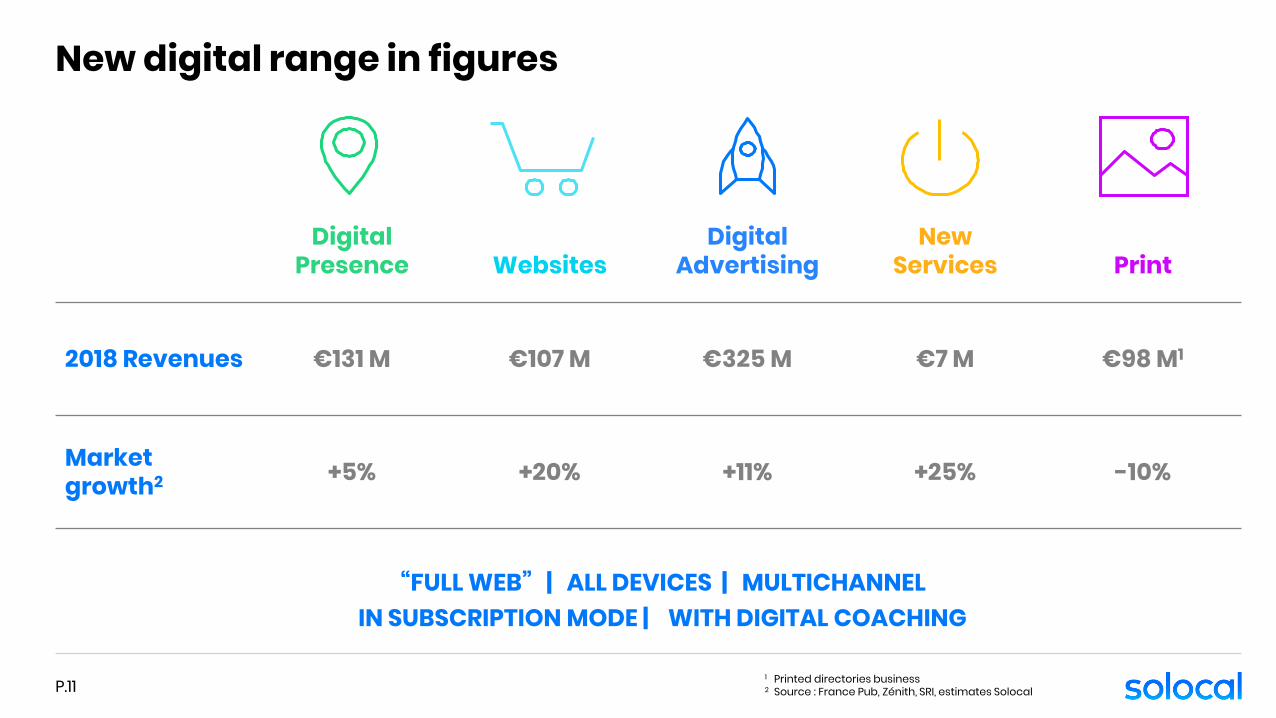
New digital range in figures
P.11
“FULL WEB” | ALL DEVICES | MULTICHANNELIN SUBSCRIPTION MODE | WITH DIGITAL COACHING
1 Printed directories business2 Source : France Pub, Zénith, SRI, estimates Solocal
Digital Presence Websites
DigitalAdvertising
NewServices Print
2018 Revenues €131 M €107 M €325 M €7 M €98 M1
Market growth2 +5% +20% +11% +25% -10%
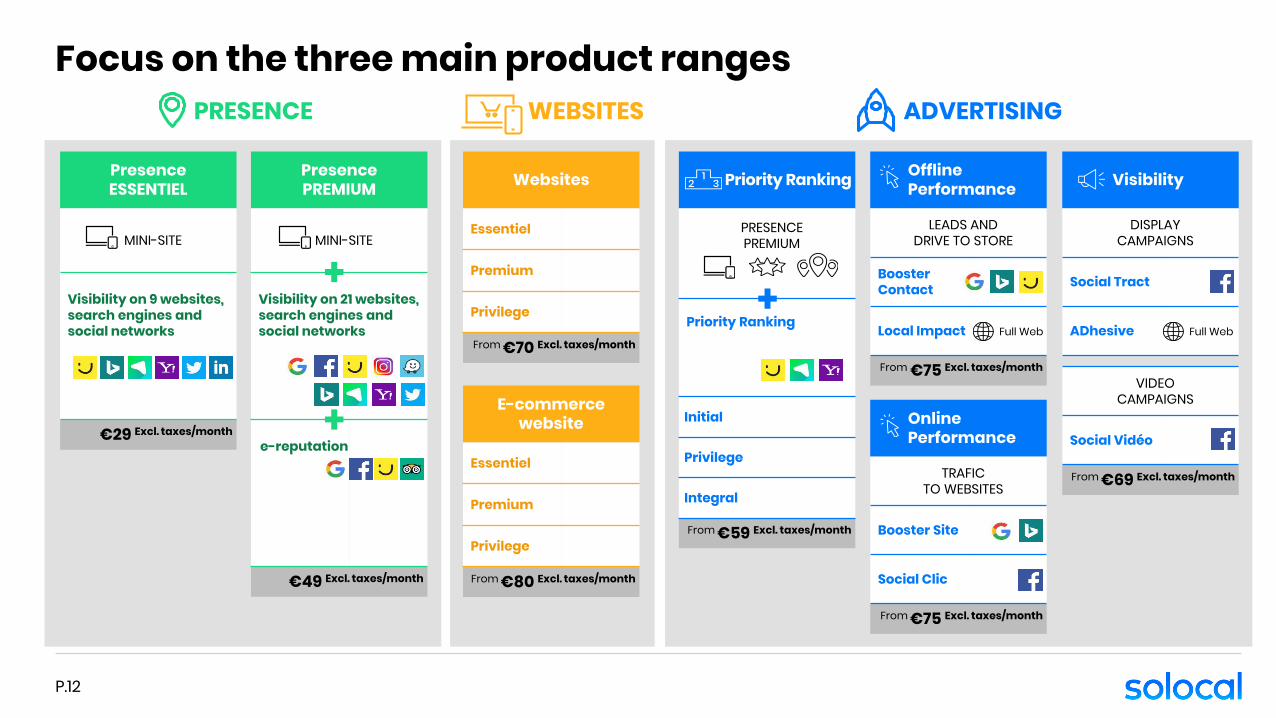
Focus on the three main product ranges
P.12
Offline Performance
LEADS AND DRIVE TO STORE
Booster Contact
Local Impact
From €75 Excl. taxes/month
Full Web
Online Performance
TRAFICTO WEBSITES
Booster Site
Social Clic
From €75 Excl. taxes/month
ADVERTISING
Visibility
DISPLAYCAMPAIGNS
Social Tract
ADhesive
VIDEOCAMPAIGNS
Social Vidéo
From €69 Excl. taxes/month
Full Web
Priority Ranking
PRESENCEPREMIUM
Priority Ranking
Initial
Privilege
Integral
From €59 Excl. taxes/month
WEBSITES
Websites
Essentiel
Premium
Privilege
From €70 Excl. taxes/month
E-commercewebsite
Essentiel
Premium
Privilege
From €80 Excl. taxes/month
PRESENCE
PresencePREMIUM
MINI-SITE
Visibility on 21 websites, search engines and social networks
e-reputation
€49 Excl. taxes/month
PresenceESSENTIEL
MINI-SITE
Visibility on 9 websites, search engines and social networks
€29 Excl. taxes/month
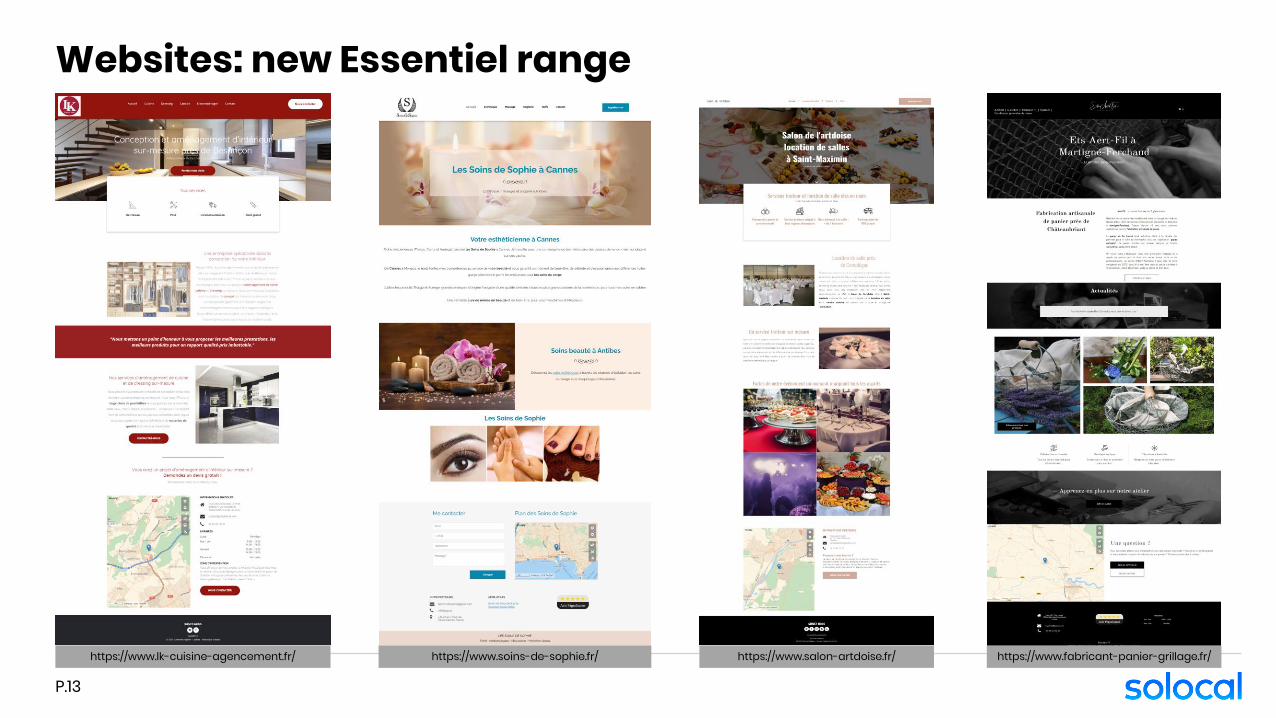
Websites: new Essentiel range
https://www.lk-cuisine-agencement.fr/ https://www.soins-de-sophie.fr/ https://www.salon-artdoise.fr/ https://www.fabricant-panier-grillage.fr/
P.13
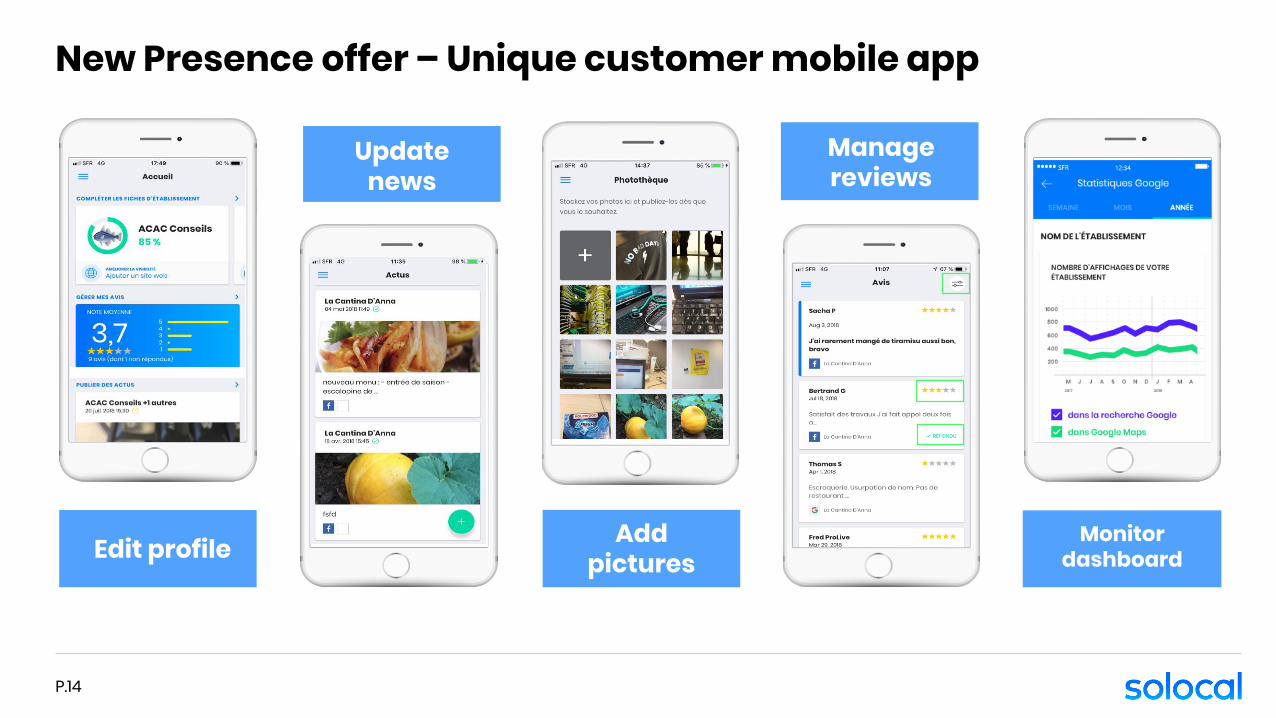
Monitordashboard
New Presence offer – Unique customer mobile app
P.14
Edit profile
Update news
Addpictures
Manage reviews
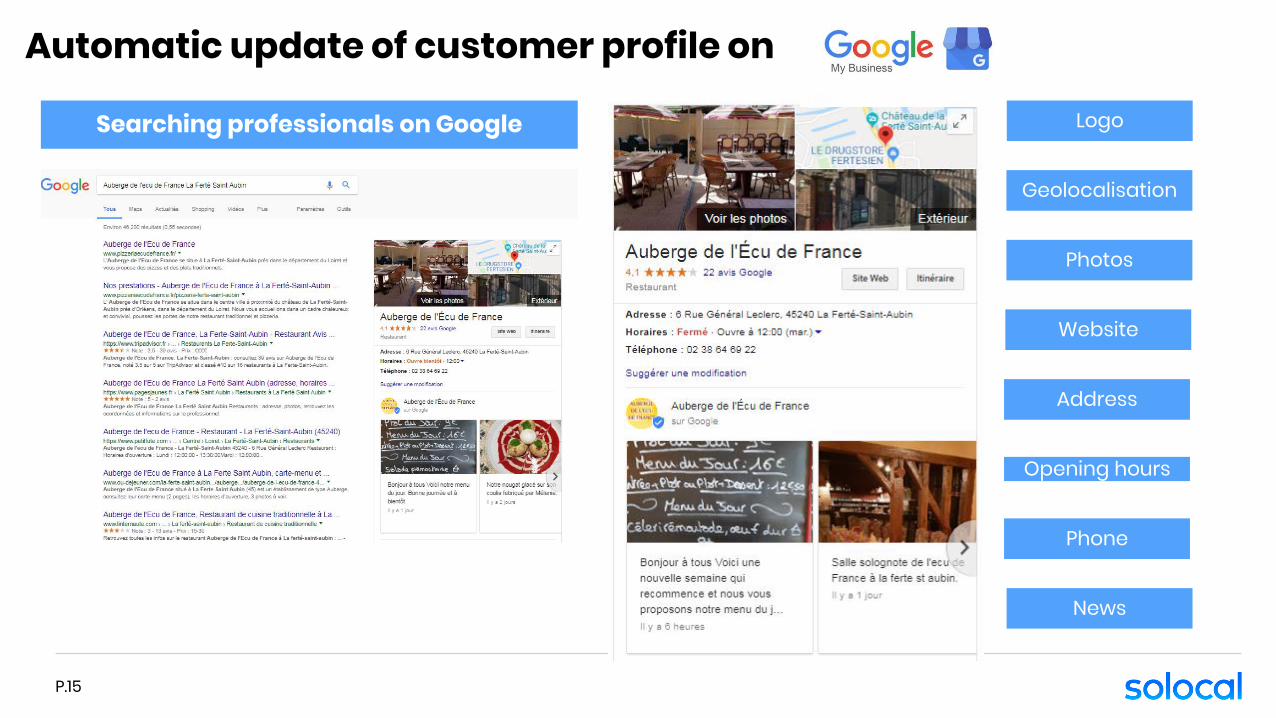
Searching professionals on Google
Address
Opening hours
Website
Phone
Logo
Photos
News
P.15
Automatic update of customer profile on
Geolocalisation
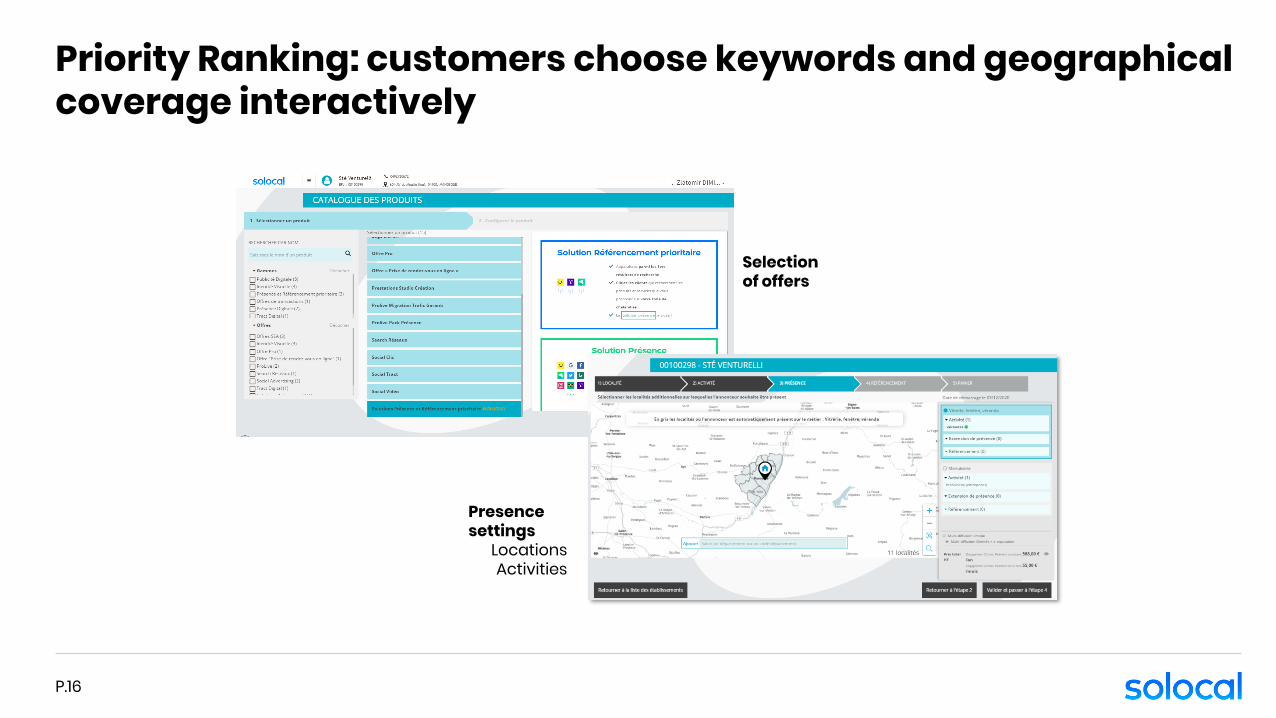
Priority Ranking: customers choose keywords and geographicalcoverage interactively
P.16
Selectionof offers
Presencesettings
LocationsActivities
P.17
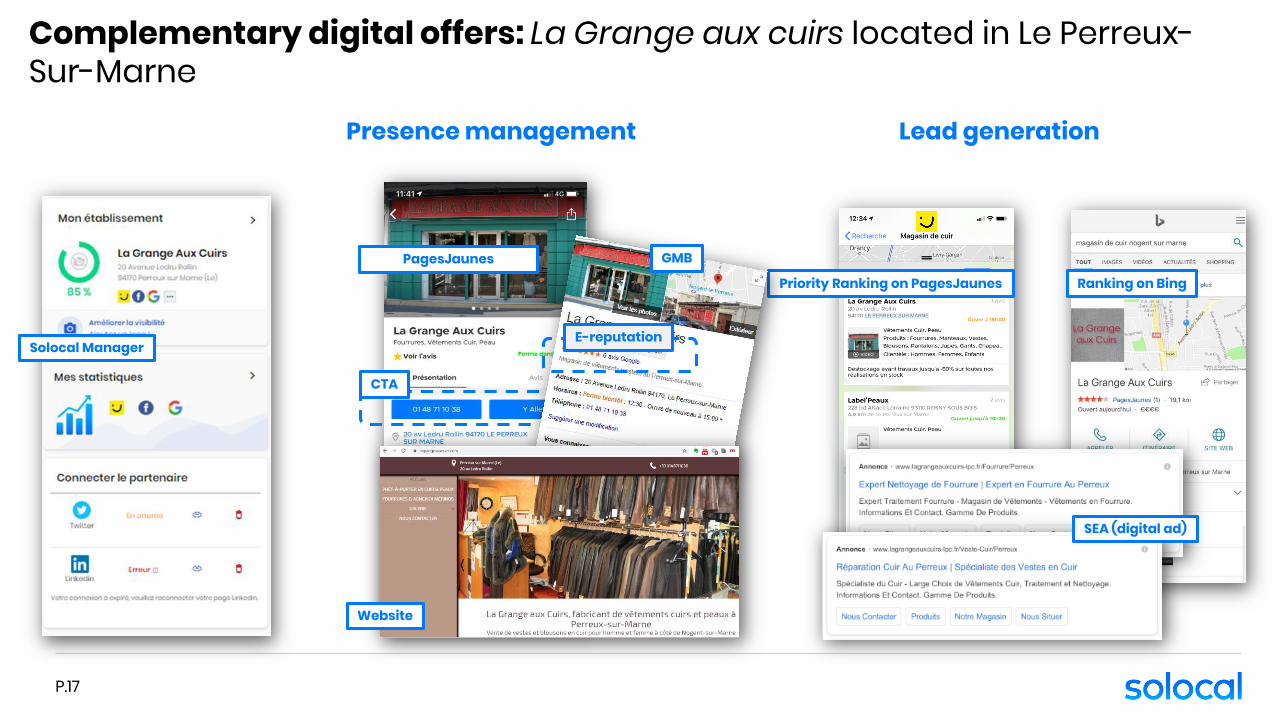
Complementary digital offers: La Grange aux cuirs located in Le Perreux-Sur-Marne
PagesJaunes
Solocal Manager
Priority Ranking on PagesJaunes Ranking on Bing
SEA (digital ad)
CTA
GMB
Presence management Lead generation
Website
E-reputation
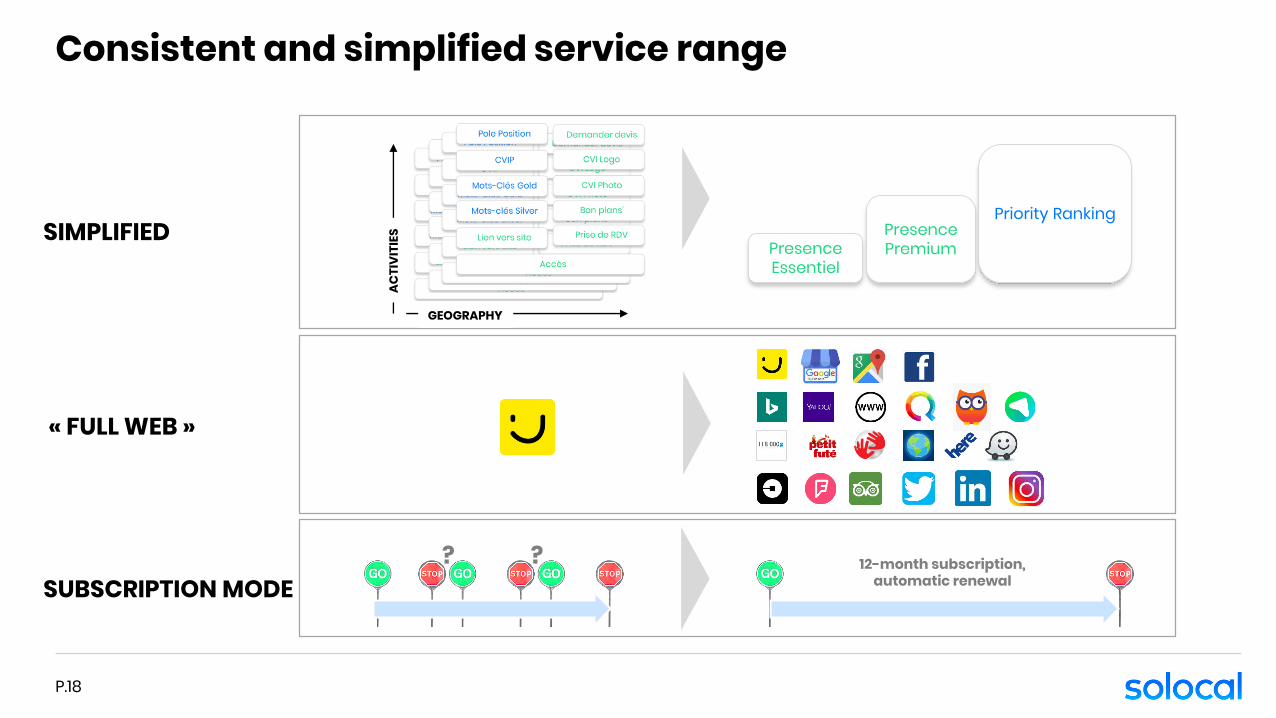
Priority RankingPresencePremiumPresence
Essentiel
GEOGRAPHY
AC
TIV
ITIE
S
12-month subscription,automatic renewal
? ?
Consistent and simplified service range
SIMPLIFIED
« FULL WEB »
SUBSCRIPTION MODE
P.18
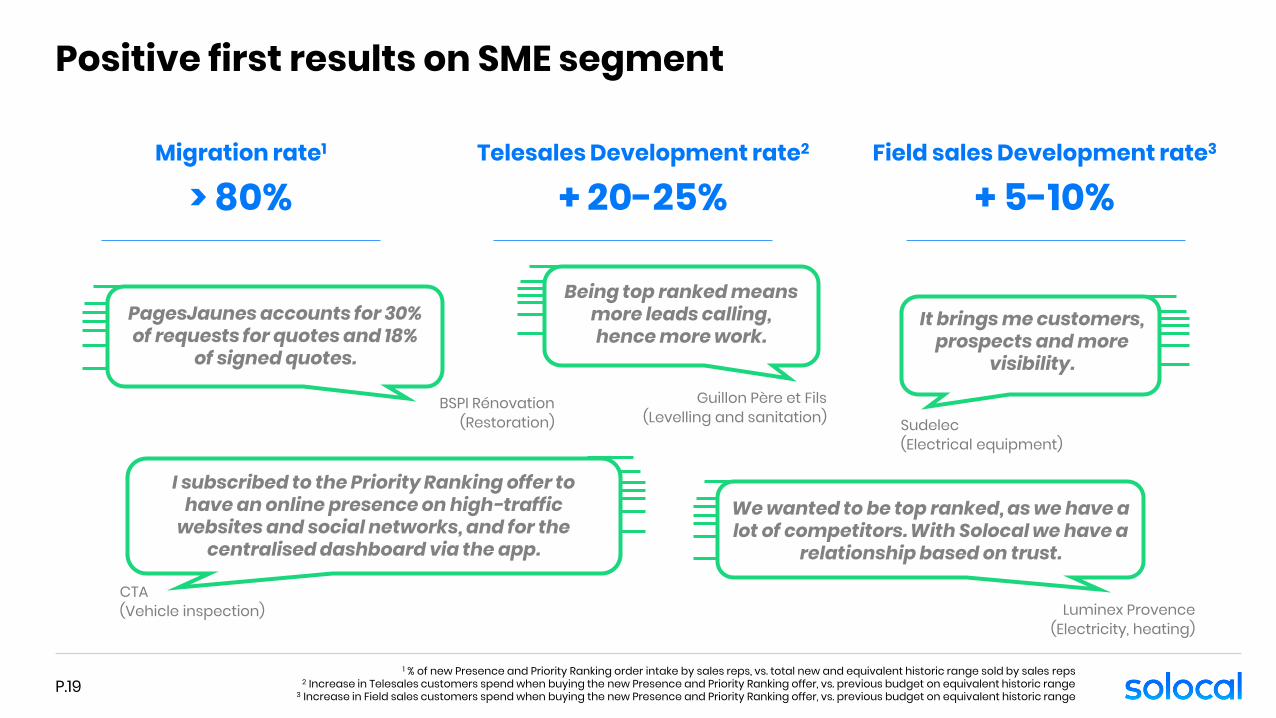
Positive first results on SME segment
P.19
Telesales Development rate2
+ 20-25% Migration rate1
> 80% Field sales Development rate3
+ 5-10%
We wanted to be top ranked, as we have a lot of competitors. With Solocal we have a
relationship based on trust.
Luminex Provence (Electricity, heating)
PagesJaunes accounts for 30% of requests for quotes and 18%
of signed quotes.
BSPI Rénovation(Restoration)
It brings me customers, prospects and more
visibility.
Sudelec(Electrical equipment)
Being top ranked means more leads calling,hence more work.
Guillon Père et Fils(Levelling and sanitation)
I subscribed to the Priority Ranking offer to have an online presence on high-traffic
websites and social networks, and for the centralised dashboard via the app.
CTA (Vehicle inspection)
1 % of new Presence and Priority Ranking order intake by sales reps, vs. total new and equivalent historic range sold by sales reps2 Increase in Telesales customers spend when buying the new Presence and Priority Ranking offer, vs. previous budget on equivalent historic range
3 Increase in Field sales customers spend when buying the new Presence and Priority Ranking offer, vs. previous budget on equivalent historic range
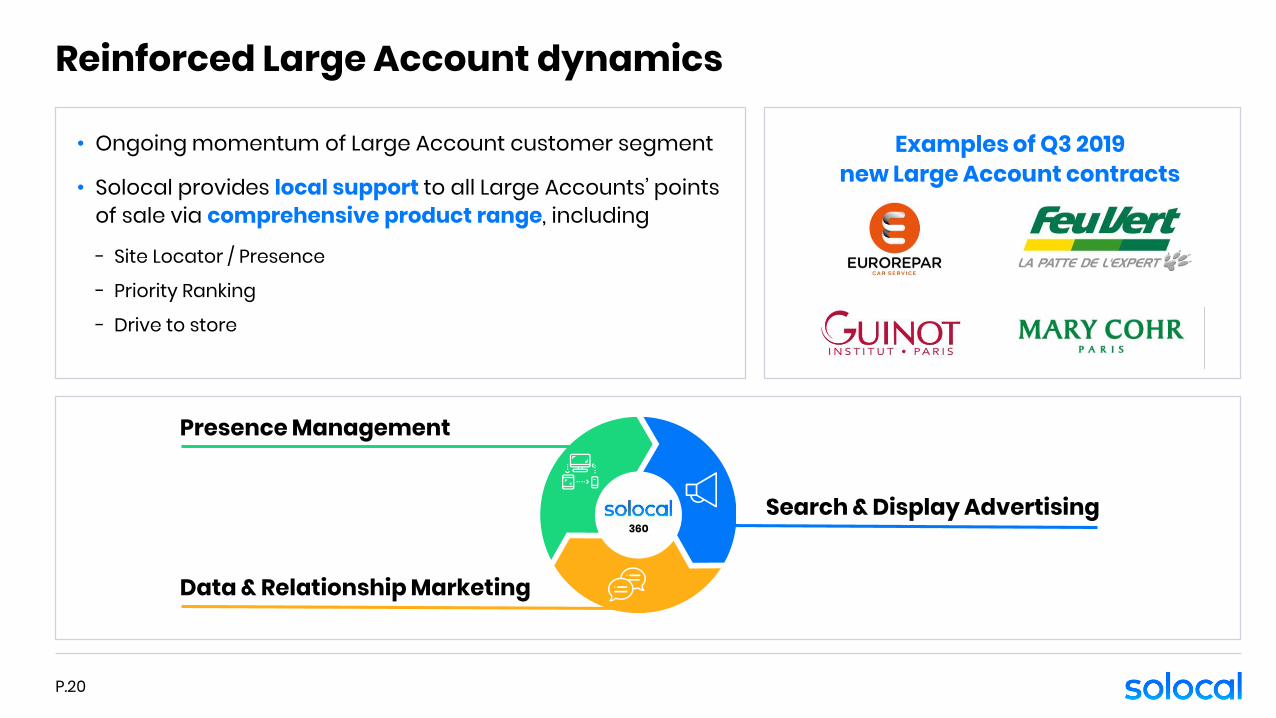
Reinforced Large Account dynamics
P.20
• Ongoing momentum of Large Account customer segment
• Solocal provides local support to all Large Accounts’ points of sale via comprehensive product range, including
- Site Locator / Presence
- Priority Ranking
- Drive to store
360Search & Display Advertising
Data & Relationship Marketing
Presence Management
Examples of Q3 2019new Large Account contracts
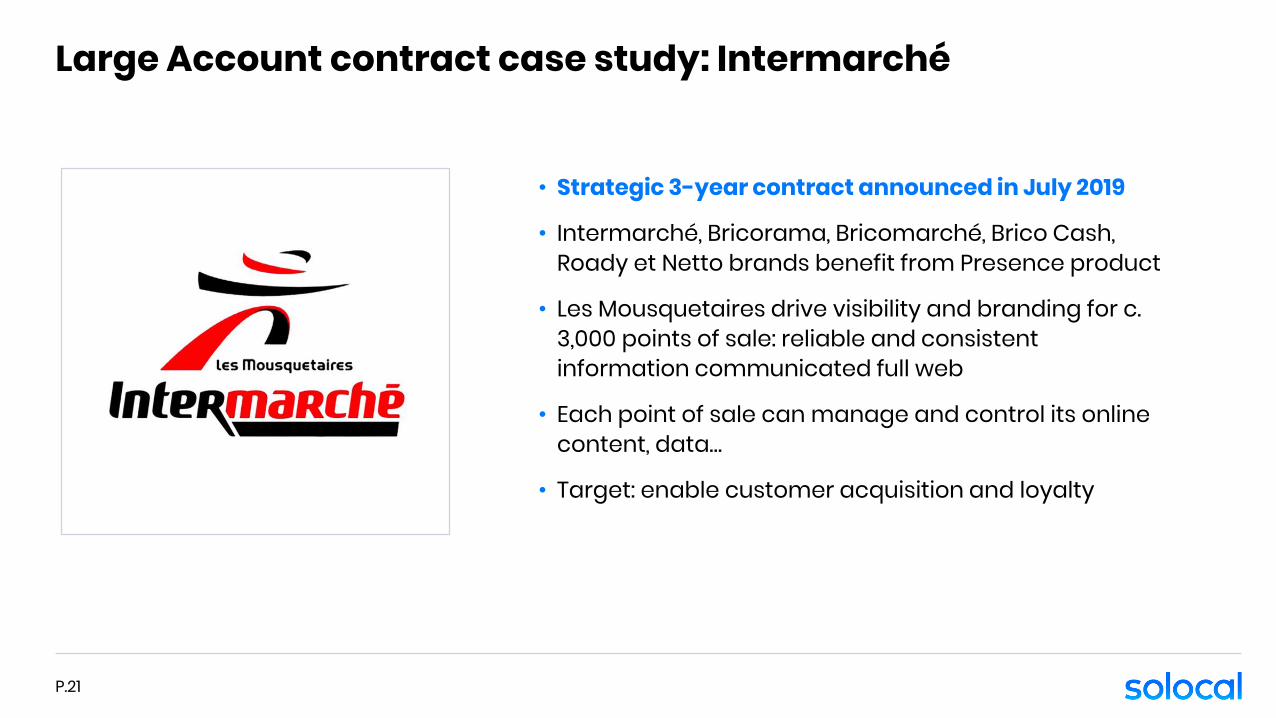
Large Account contract case study: Intermarché
P.21
• Strategic 3-year contract announced in July 2019
• Intermarché, Bricorama, Bricomarché, Brico Cash, Roady et Netto brands benefit from Presence product
• Les Mousquetaires drive visibility and branding for c. 3,000 points of sale: reliable and consistent information communicated full web
• Each point of sale can manage and control its online content, data…
• Target: enable customer acquisition and loyalty
Q3 2018
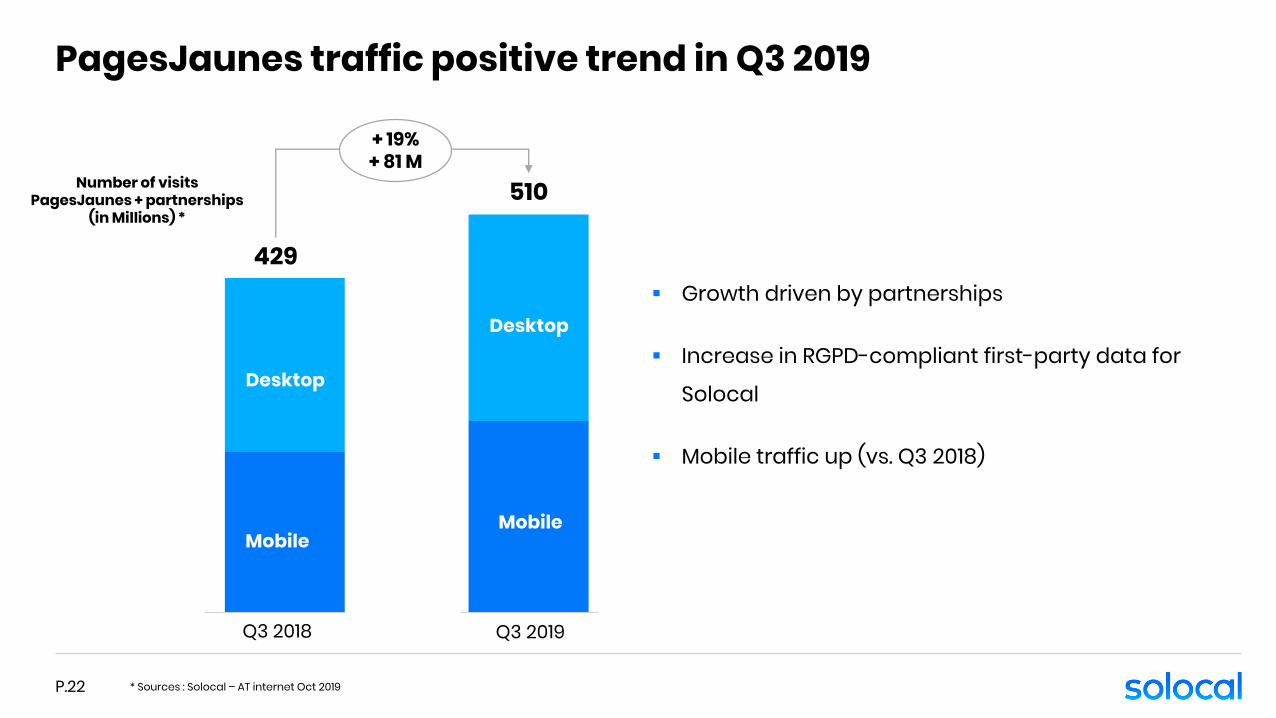
PagesJaunes traffic positive trend in Q3 2019
P.22
▪ Growth driven by partnerships
▪ Increase in RGPD-compliant first-party data for
Solocal
▪ Mobile traffic up (vs. Q3 2018)
429
Desktop
Mobile
Q3 2019
510
Desktop
Mobile
Number of visitsPagesJaunes + partnerships
(in Millions) *
+ 19%+ 81 M
* Sources : Solocal – AT internet Oct 2019

Recentactivity and highlights
Q3 2019 : Key messages
P.24
• Back to growth in H2 2019
• Q3 2019 Digital order intake growth: +5.3% vs. Q3 2018
• New digital service range fueling growth
• Close to 60% subscription sales: driving long-term recurring revenues
• Long-term profitable growth
Accelerated order intake conversion into revenues
P.25
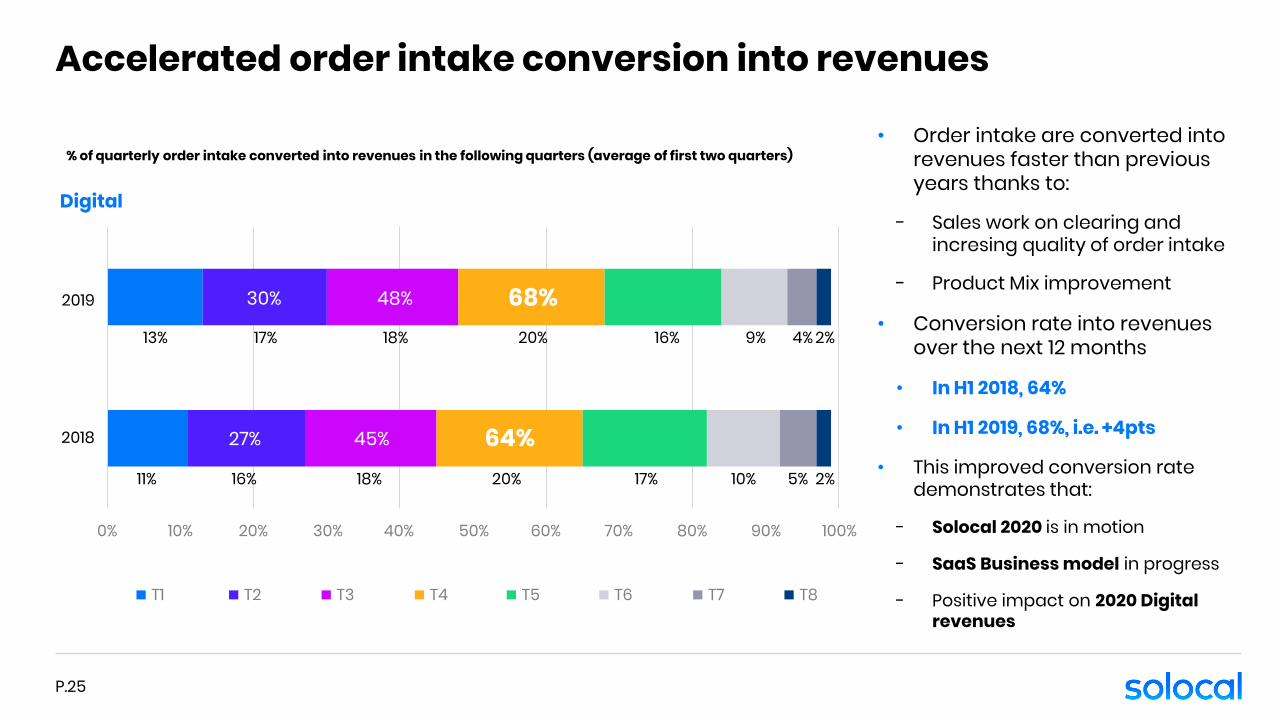
% of quarterly order intake converted into revenues in the following quarters (average of first two quarters)
Digital
0% 20% 40% 60% 80% 100%
2018
2019
13% 17% 18% 20% 16% 9% 4% 2%
68%
64%
48%
45%
30%
27%
11% 16% 18% 20% 17% 10% 5% 2%
0%
2019
T1
10% 20% 30% 40% 50% 60% 70% 80% 90% 100%
T2 T3 T4 T5 T6 T7 T8
2018
• Order intake are converted intorevenues faster than previousyears thanks to:
- Sales work on clearing and incresing quality of order intake
- Product Mix improvement
• Conversion rate into revenues over the next 12 months
• In H1 2018, 64%
• In H1 2019, 68%, i.e. +4pts
• This improved conversion rate demonstrates that:
- Solocal 2020 is in motion
- SaaS Business model in progress
- Positive impact on 2020 Digital revenues
Q3 2019: Digital order intake growth
P.26
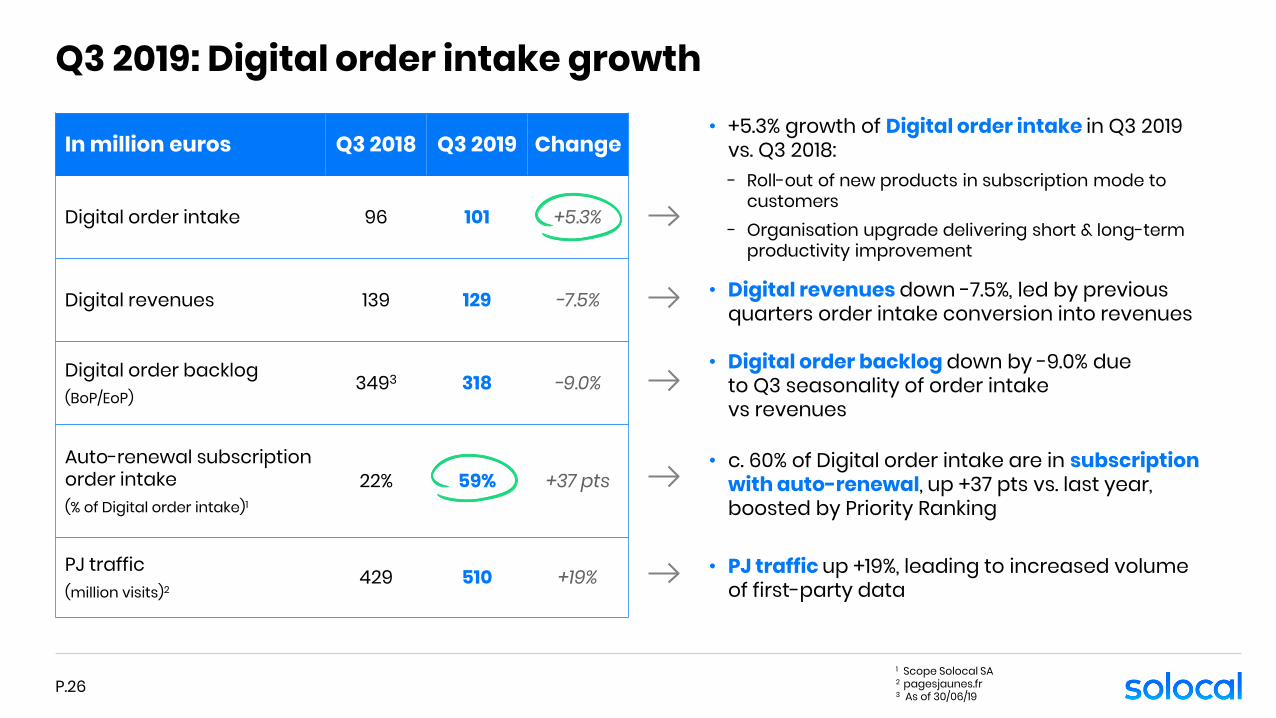
In million euros Q3 2018 Q3 2019 Change
Digital order intake 96 101 +5.3%
Digital revenues 139 129 -7.5%
Digital order backlog (BoP/EoP)
3493 318 -9.0%
Auto-renewal subscription order intake(% of Digital order intake)1
22% 59% +37 pts
PJ traffic(million visits)2
429 510 +19%
1 Scope Solocal SA2 pagesjaunes.fr3 As of 30/06/19
• +5.3% growth of Digital order intake in Q3 2019vs. Q3 2018:- Roll-out of new products in subscription mode to
customers- Organisation upgrade delivering short & long-term
productivity improvement
• Digital revenues down -7.5%, led by previous quarters order intake conversion into revenues
• Digital order backlog down by -9.0% dueto Q3 seasonality of order intakevs revenues
• c. 60% of Digital order intake are in subscription with auto-renewal, up +37 pts vs. last year, boosted by Priority Ranking
• PJ traffic up +19%, leading to increased volumeof first-party data
Q3 2019: Structural shift to deliver sustainable growth
P.27
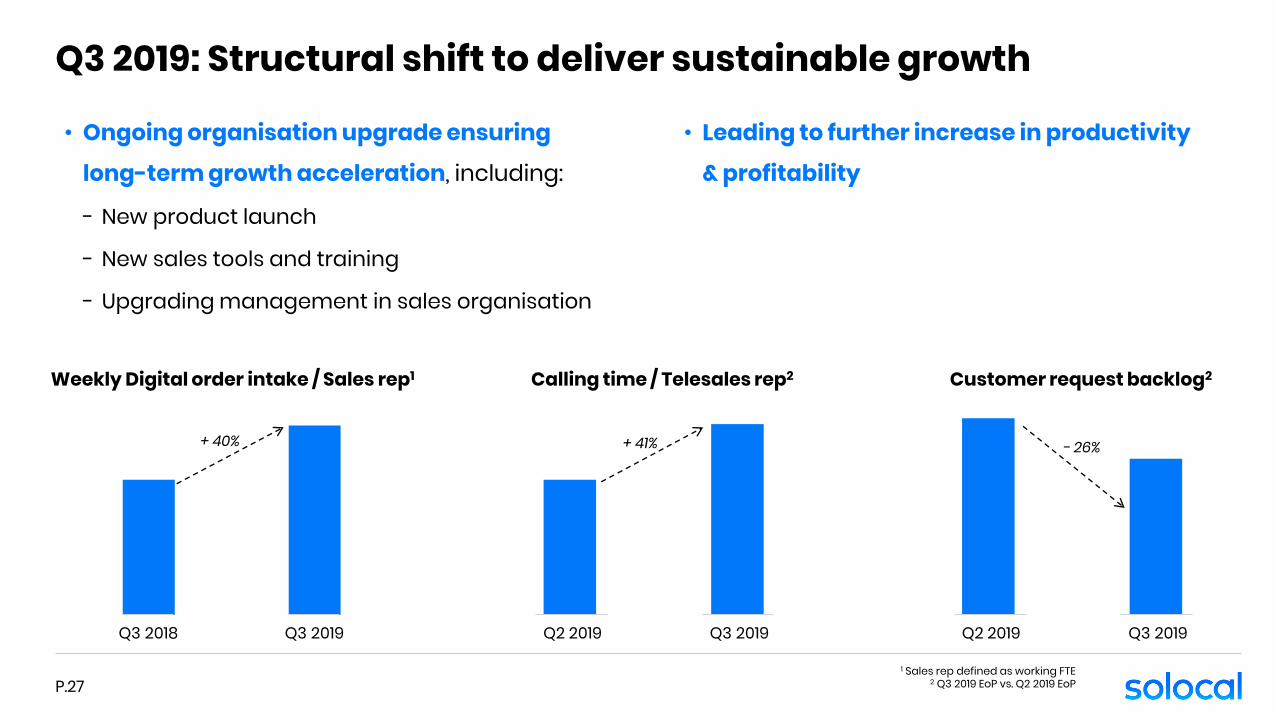
• Ongoing organisation upgrade ensuring
long-term growth acceleration, including:
- New product launch
- New sales tools and training
- Upgrading management in sales organisation
Weekly Digital order intake / Sales rep1 Customer request backlog2
+ 40% - 26%
1 Sales rep defined as working FTE2 Q3 2019 EoP vs. Q2 2019 EoP
Q3 2018 Q3 2019 Q2 2019 Q3 2019
Calling time / Telesales rep2
+ 41%
Q2 2019 Q3 2019
• Leading to further increase in productivity
& profitability
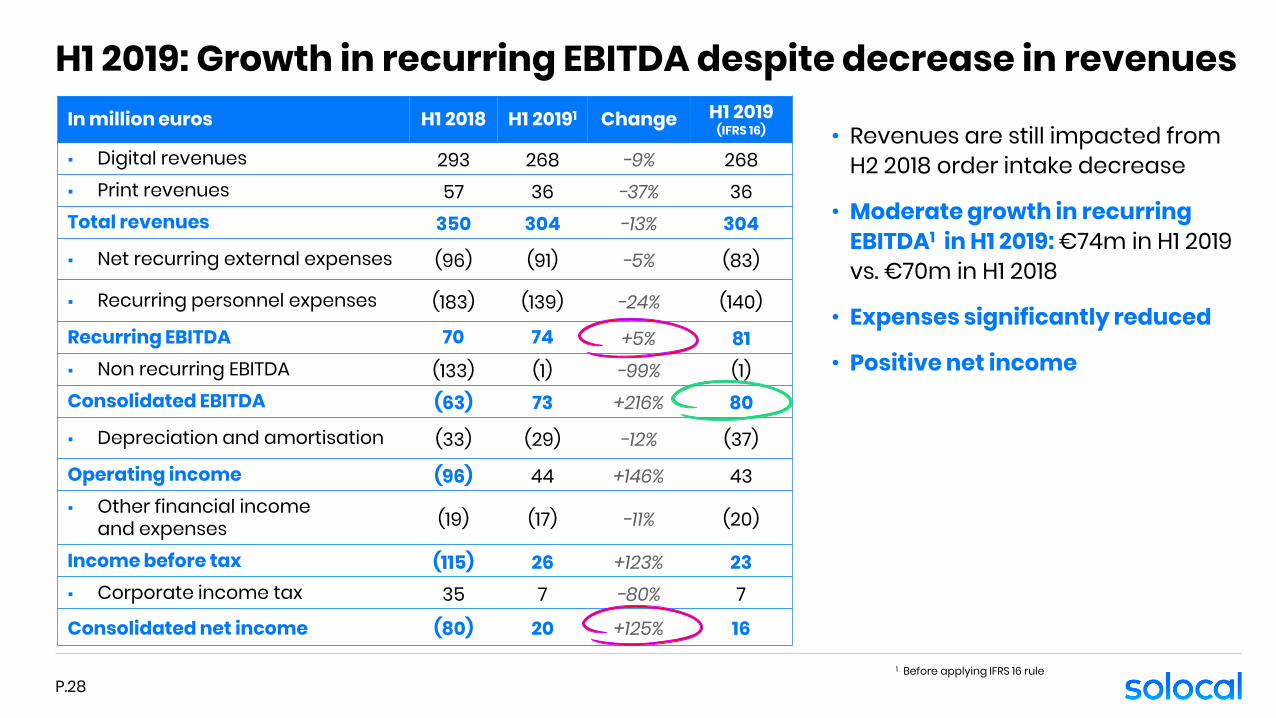
H1 2019: Growth in recurring EBITDA despite decrease in revenuesIn million euros H1 2018 H1 20191 Change H1 2019
(IFRS 16)
▪ Digital revenues 293 268 -9% 268▪ Print revenues 57 36 -37% 36Total revenues 350 304 -13% 304
▪ Net recurring external expenses (96) (91) -5% (83)
▪ Recurring personnel expenses (183) (139) -24% (140)
Recurring EBITDA 70 74 +5% 81▪ Non recurring EBITDA (133) (1) -99% (1)Consolidated EBITDA (63) 73 +216% 80
▪ Depreciation and amortisation (33) (29) -12% (37)
Operating income (96) 44 +146% 43▪ Other financial income
and expenses (19) (17) -11% (20)
Income before tax (115) 26 +123% 23▪ Corporate income tax 35 7 -80% 7
Consolidated net income (80) 20 +125% 16
• Revenues are still impacted from H2 2018 order intake decrease
• Moderate growth in recurring EBITDA1 in H1 2019: €74m in H1 2019 vs. €70m in H1 2018
• Expenses significantly reduced
• Positive net income
P.281 Before applying IFRS 16 rule
H1 2019: Focus on recurring EBITDA
P.29
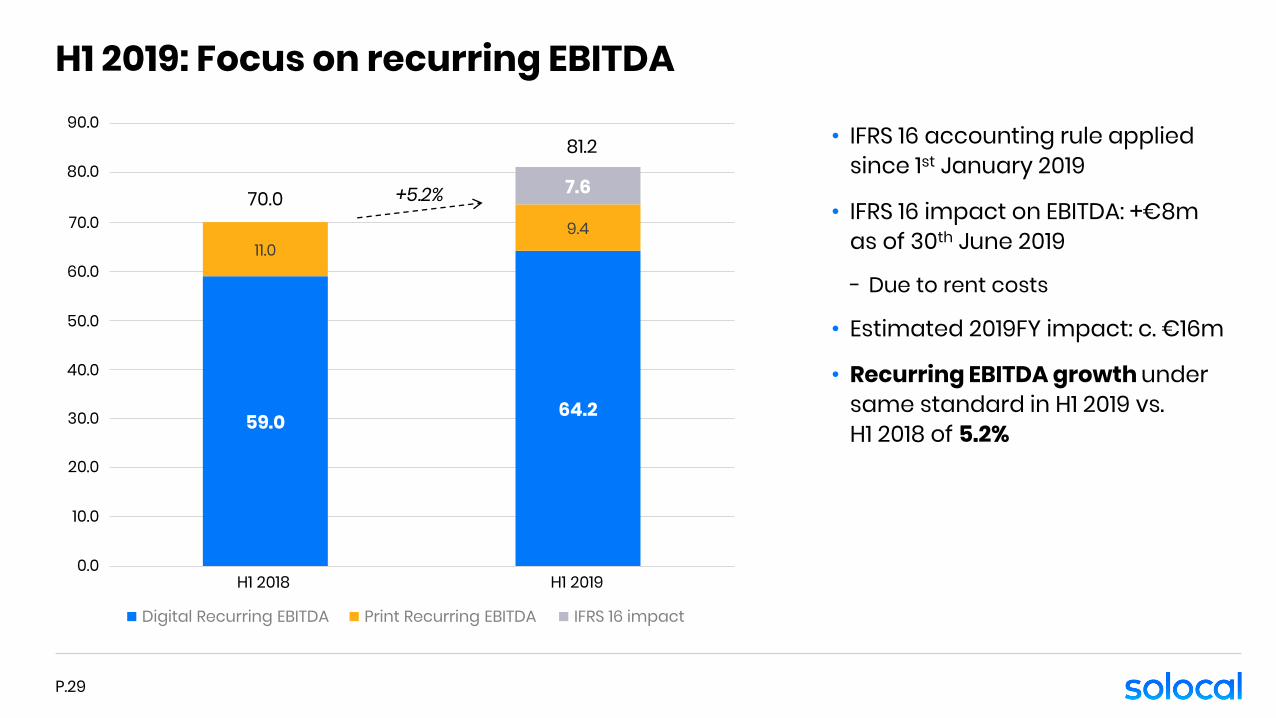
59.0 64.2
11.09.4
7.6
0,0
10,0
20,0
30,0
40,0
50,0
60,0
70,0
80,0
90,0• IFRS 16 accounting rule applied
since 1st January 2019
• IFRS 16 impact on EBITDA: +€8mas of 30th June 2019
- Due to rent costs
• Estimated 2019FY impact: c. €16m
• Recurring EBITDA growth under same standard in H1 2019 vs.H1 2018 of 5.2%
81.2
70.0 +5.2%
H1 2019H1 20180.0
10.0
20.0
30.0
40.0
50.0
60.0
70.0
80.0
90.0
Digital Recurring EBITDA Print Recurring EBITDA IFRS 16 impact
Ongoing decrease in the fixed cost structure in H1 2019
P.30
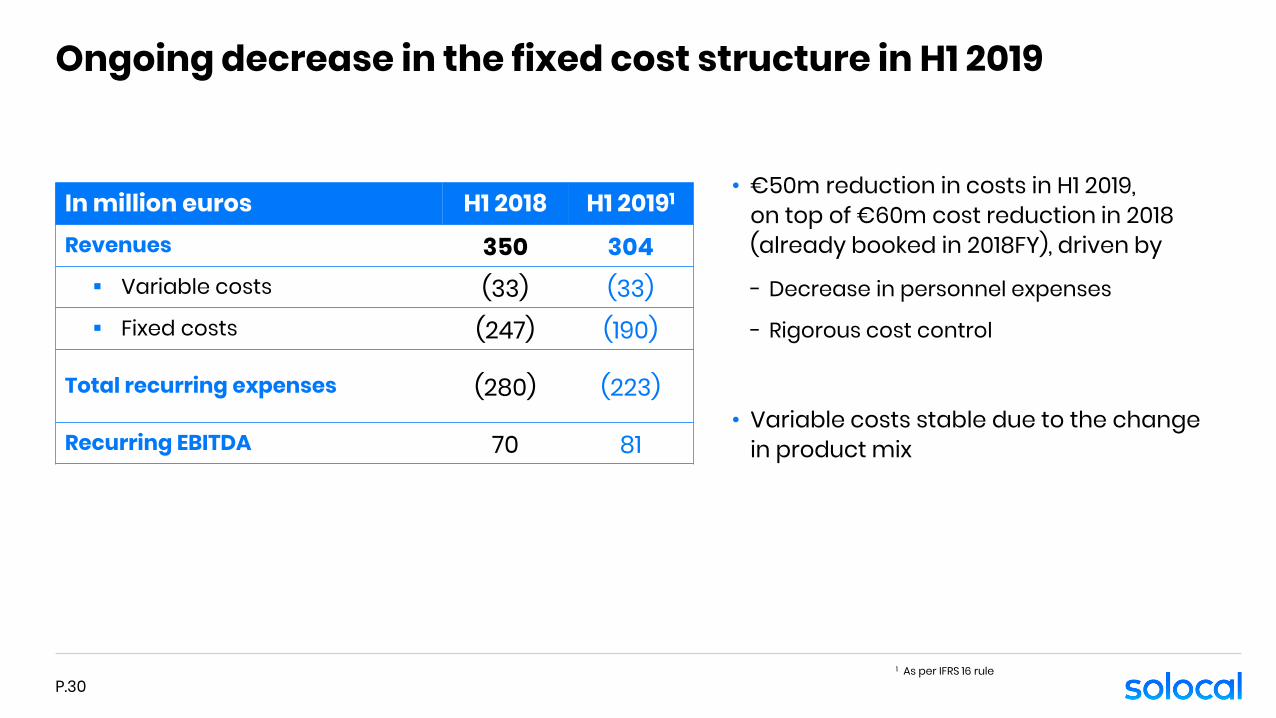
In million euros H1 2018 H1 20191
Revenues 350 304▪ Variable costs (33) (33)▪ Fixed costs (247) (190)
Total recurring expenses (280) (223)
Recurring EBITDA 70 81
• €50m reduction in costs in H1 2019,on top of €60m cost reduction in 2018 (already booked in 2018FY), driven by
- Decrease in personnel expenses
- Rigorous cost control
• Variable costs stable due to the change in product mix
1 As per IFRS 16 rule
Optimising investments for successful transformation & growth
P.31
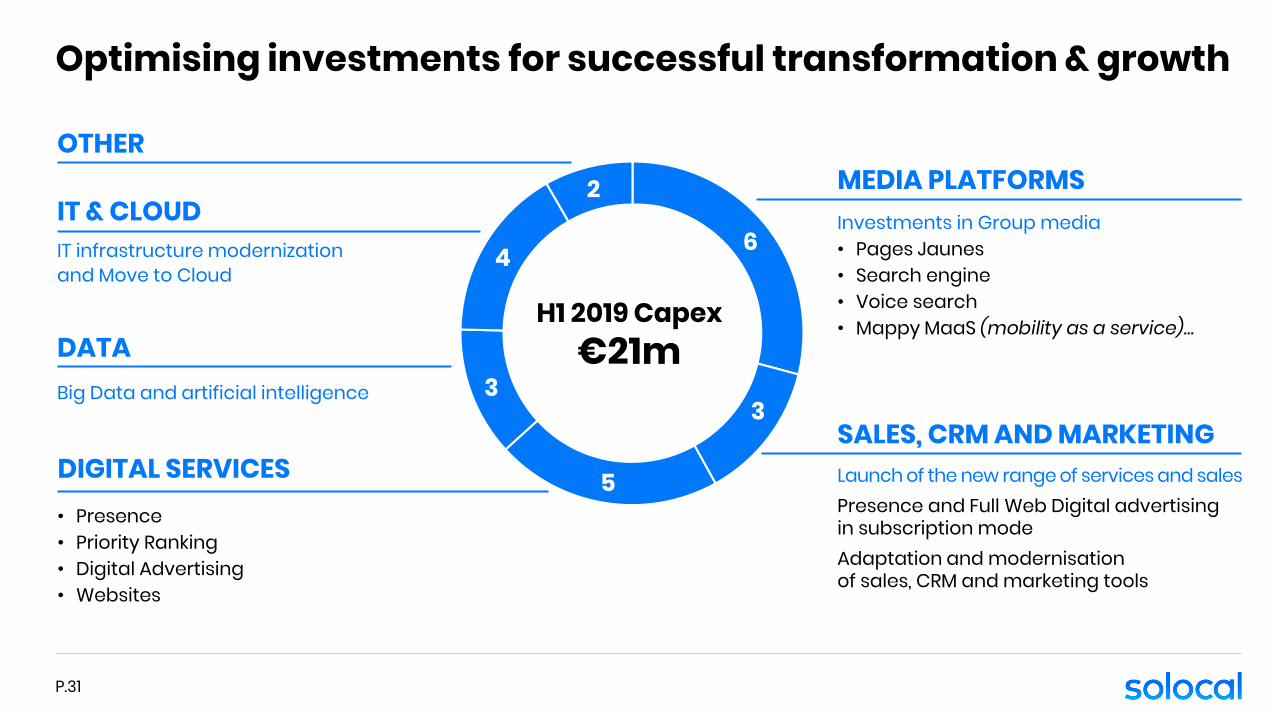
MEDIA PLATFORMS
SALES, CRM AND MARKETING
DATA
IT & CLOUD Investments in Group media• Pages Jaunes• Search engine• Voice search• Mappy MaaS (mobility as a service)…
Launch of the new range of services and salesPresence and Full Web Digital advertising in subscription modeAdaptation and modernisationof sales, CRM and marketing tools
Big Data and artificial intelligence
IT infrastructure modernizationand Move to Cloud
H1 2019 Capex€21m
DIGITAL SERVICES
OTHER
• Presence• Priority Ranking• Digital Advertising• Websites
6
3
5
3
4
2
Cash flow generation
P.32
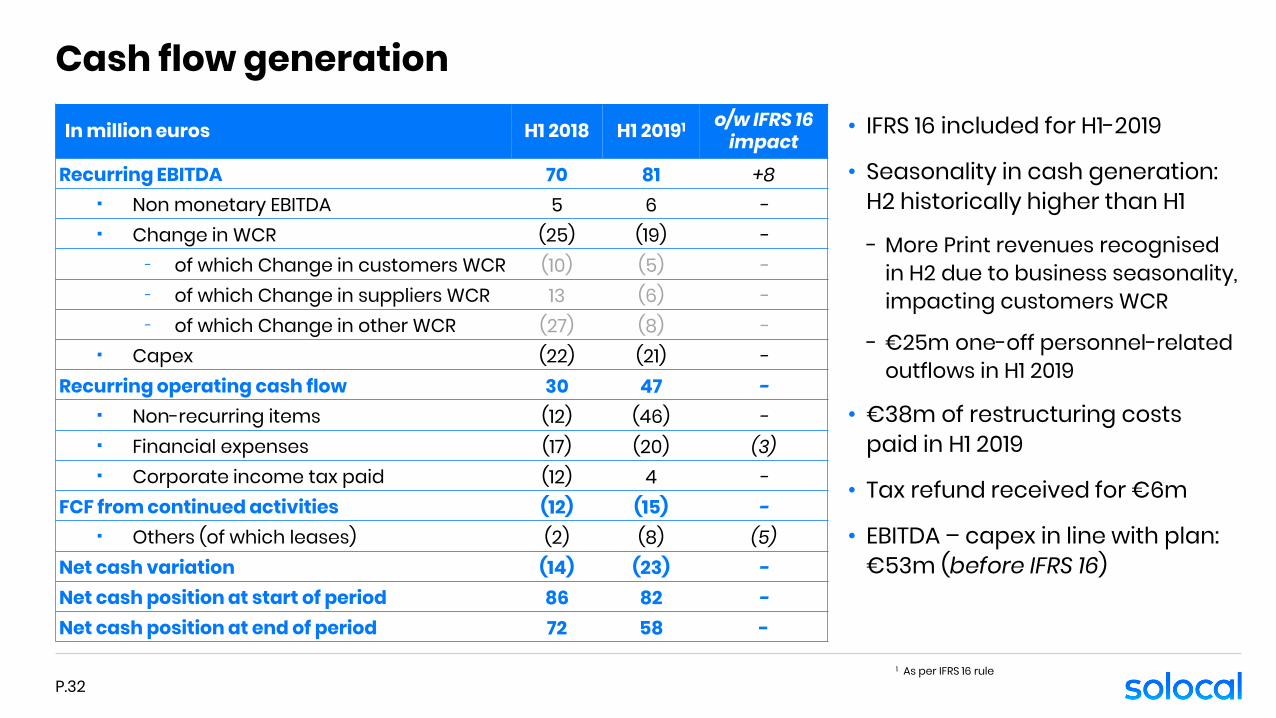
In million euros H1 2018 H1 20191 o/w IFRS 16 impact
Recurring EBITDA 70 81 +8▪ Non monetary EBITDA 5 6 -▪ Change in WCR (25) (19) -
− of which Change in customers WCR (10) (5) -− of which Change in suppliers WCR 13 (6) -− of which Change in other WCR (27) (8) -
▪ Capex (22) (21) -Recurring operating cash flow 30 47 -
▪ Non-recurring items (12) (46) -▪ Financial expenses (17) (20) (3)▪ Corporate income tax paid (12) 4 -
FCF from continued activities (12) (15) -▪ Others (of which leases) (2) (8) (5)
Net cash variation (14) (23) -Net cash position at start of period 86 82 -Net cash position at end of period 72 58 -
• IFRS 16 included for H1-2019
• Seasonality in cash generation:H2 historically higher than H1
- More Print revenues recognised in H2 due to business seasonality, impacting customers WCR
- €25m one-off personnel-related outflows in H1 2019
• €38m of restructuring costs paid in H1 2019
• Tax refund received for €6m
• EBITDA – capex in line with plan: €53m (before IFRS 16)
1 As per IFRS 16 rule
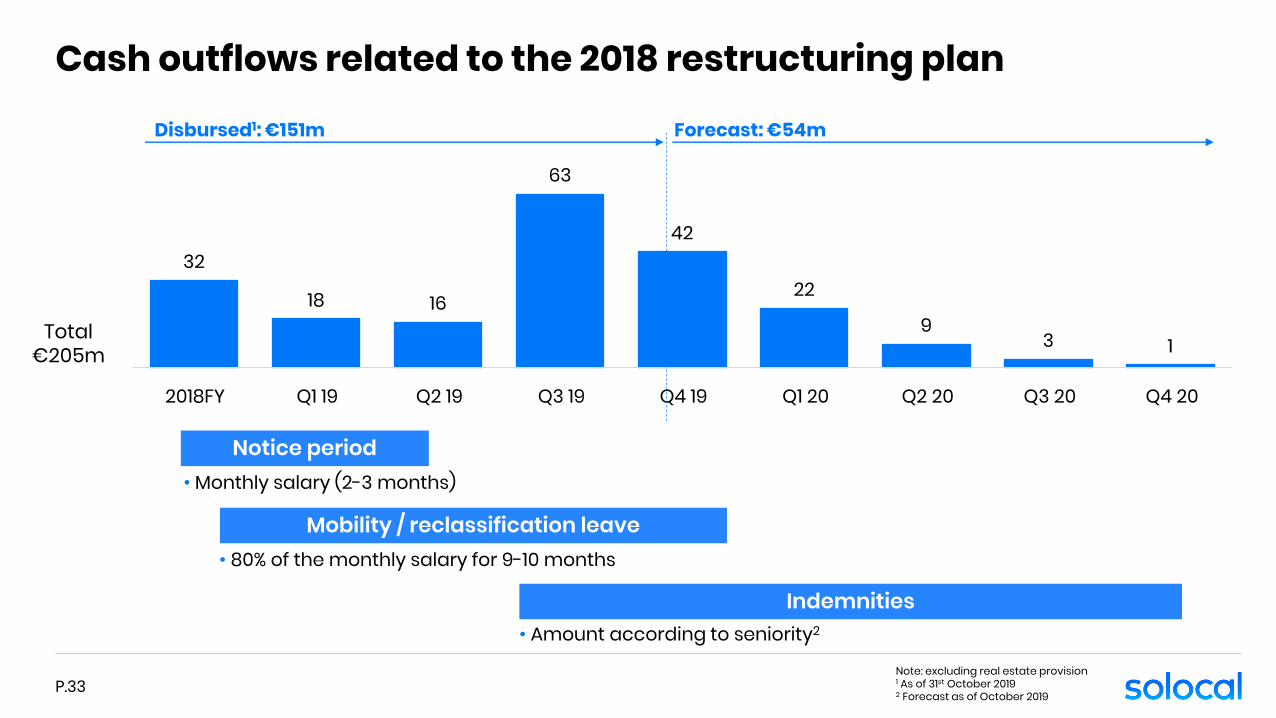
32
18 16
63
42
22
93 1
2018FY Q1 19 Q2 19 Q3 19 Q4 19 Q1 20 Q2 20 Q3 20 Q4 20
Disbursed1: €151m Forecast: €54m
2018FY Q1 19 Q2 19 Q3 19 Q4 19 Q1 20 Q2 20 Q3 20 Q4 20
Cash outflows related to the 2018 restructuring plan
P.33
Total€205m
Notice period• Monthly salary (2-3 months)
• 80% of the monthly salary for 9-10 months
Mobility / reclassification leave
• Amount according to seniority2
Indemnities
Note: excluding real estate provision1 As of 31st October 20192 Forecast as of October 2019
H1 2019: Stable financial leverage
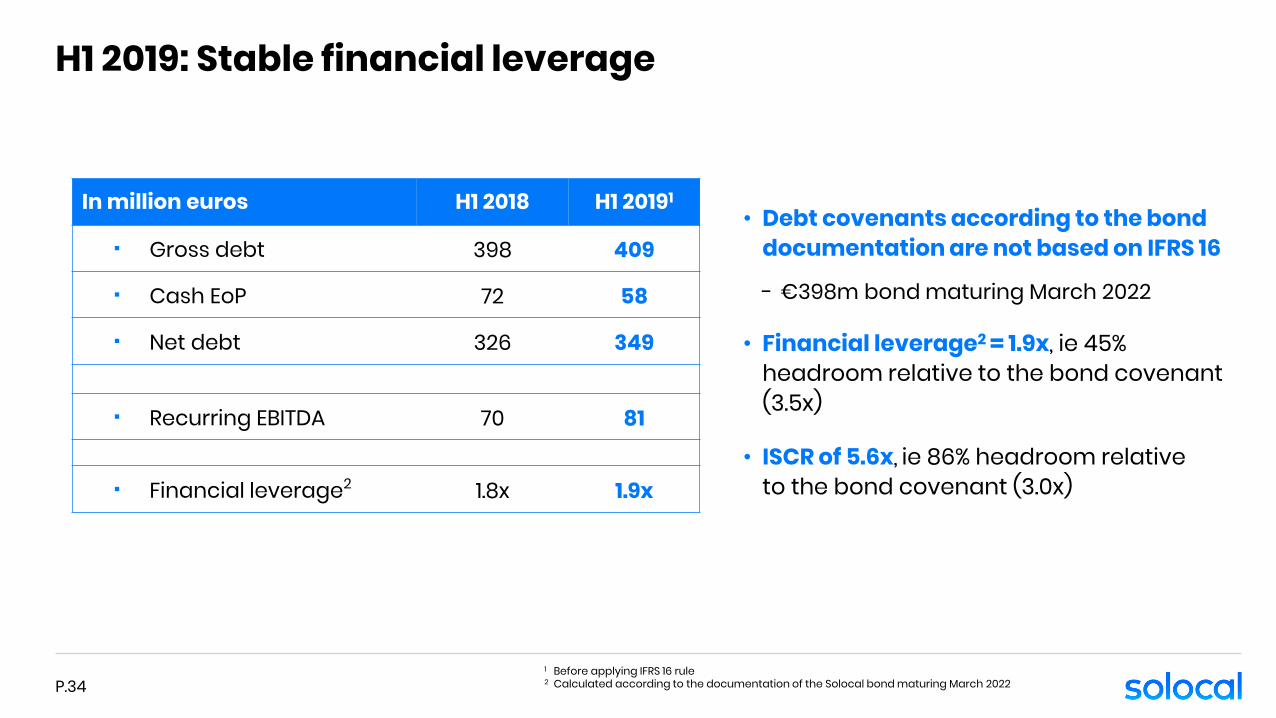
1 Before applying IFRS 16 rule2 Calculated according to the documentation of the Solocal bond maturing March 2022
In million euros H1 2018 H1 20191
▪ Gross debt 398 409
▪ Cash EoP 72 58
▪ Net debt 326 349
▪ Recurring EBITDA 70 81
▪ Financial leverage2 1.8x 1.9x
• Debt covenants according to the bond documentation are not based on IFRS 16
- €398m bond maturing March 2022
• Financial leverage2 = 1.9x, ie 45% headroom relative to the bond covenant (3.5x)
• ISCR of 5.6x, ie 86% headroom relativeto the bond covenant (3.0x)
P.34
Next quarters: Accelerating growth
P.35
• Keeping up growth into Q4 2019
- Focus on new Products roll-out (existing & new customers)
- Cross-media ad campaign to fuel new customer acquisition
- Building on Q3 2019 sales momentum and positive energy
• 2019 target:
• Stabilised Digital order intake in 2019
• Moderate growth of recurring EBITDA in 2019
• Pursuing growth dynamics into forthcoming quarters

Appendix
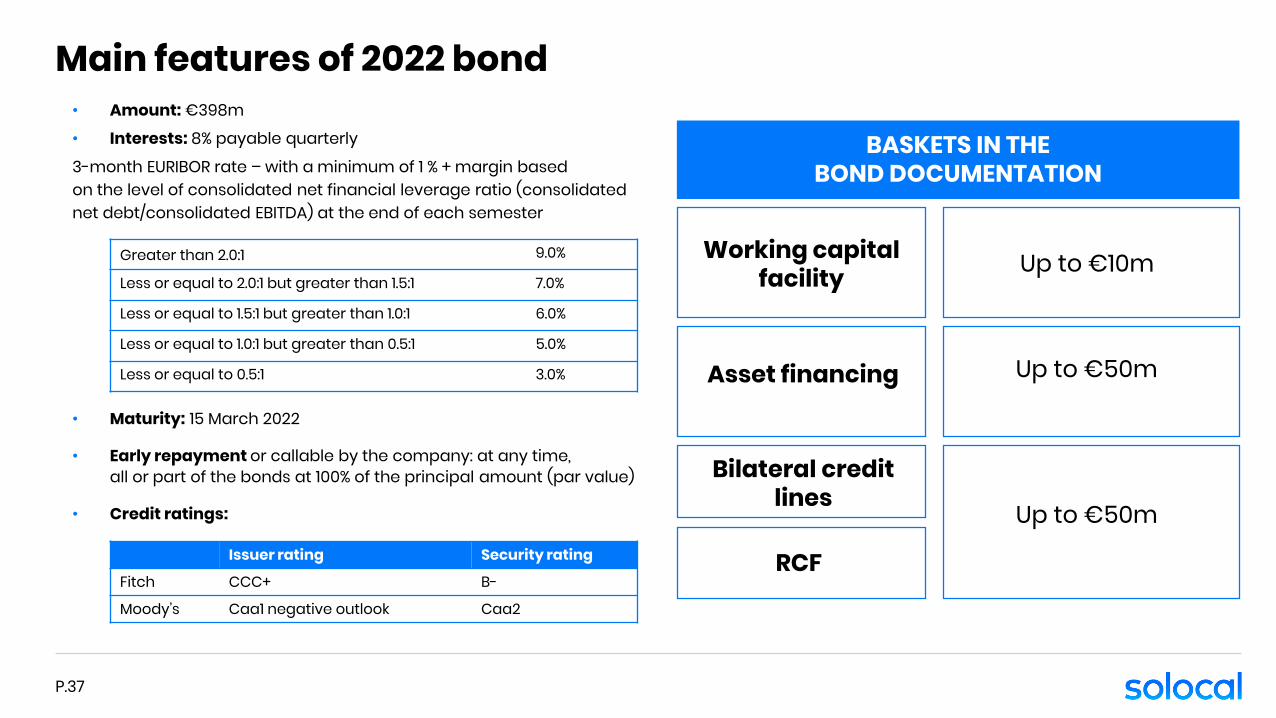
Main features of 2022 bond
Working capital facility
Asset financing
Up to €50m
BASKETS IN THE BOND DOCUMENTATION
Bilateral credit lines
Up to €50m
RCF
Up to €10m
• Amount: €398m
• Interests: 8% payable quarterly
3-month EURIBOR rate – with a minimum of 1 % + margin basedon the level of consolidated net financial leverage ratio (consolidatednet debt/consolidated EBITDA) at the end of each semester
• Maturity: 15 March 2022
• Early repayment or callable by the company: at any time,all or part of the bonds at 100% of the principal amount (par value)
• Credit ratings:
Greater than 2.0:1 9.0%
Less or equal to 2.0:1 but greater than 1.5:1 7.0%
Less or equal to 1.5:1 but greater than 1.0:1 6.0%
Less or equal to 1.0:1 but greater than 0.5:1 5.0%
Less or equal to 0.5:1 3.0%
Issuer rating Security rating
Fitch CCC+ B-
Moody’s Caa1 negative outlook Caa2
P.37
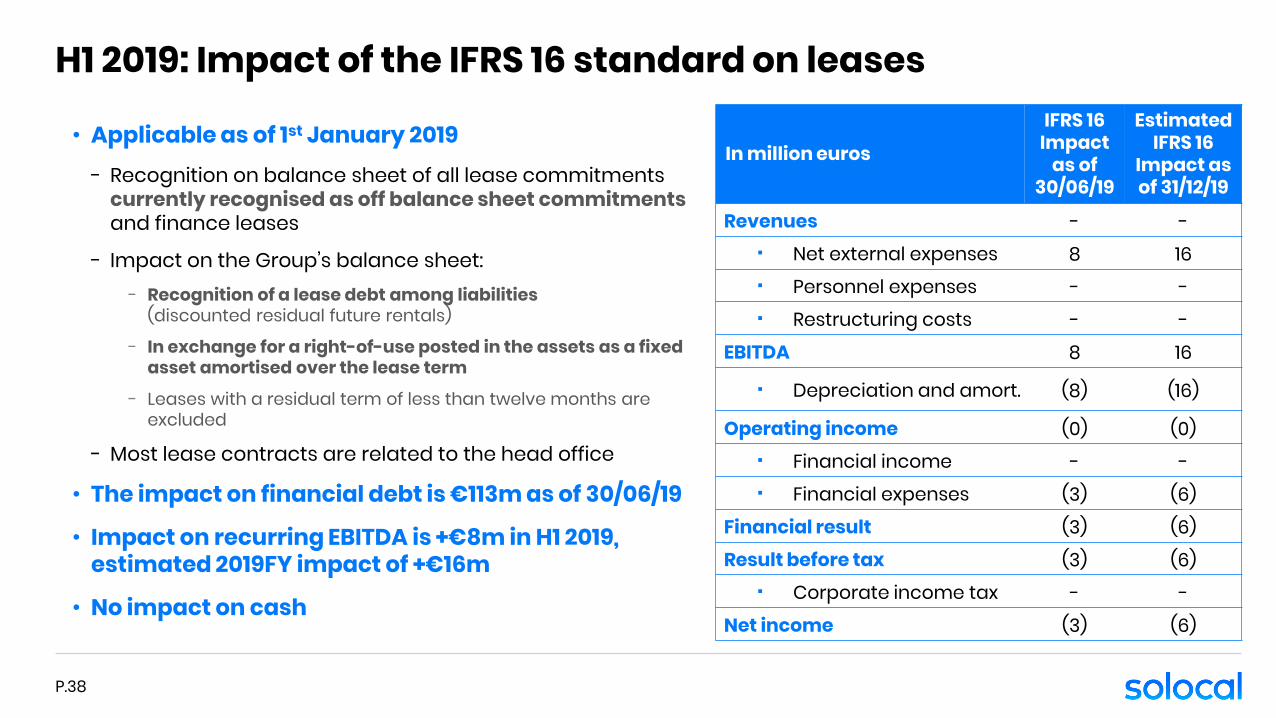
H1 2019: Impact of the IFRS 16 standard on leases
• Applicable as of 1st January 2019- Recognition on balance sheet of all lease commitments
currently recognised as off balance sheet commitmentsand finance leases
- Impact on the Group’s balance sheet:- Recognition of a lease debt among liabilities
(discounted residual future rentals)
- In exchange for a right-of-use posted in the assets as a fixed asset amortised over the lease term
- Leases with a residual term of less than twelve months are excluded
- Most lease contracts are related to the head office
• The impact on financial debt is €113m as of 30/06/19
• Impact on recurring EBITDA is +€8m in H1 2019, estimated 2019FY impact of +€16m
• No impact on cash
P.38
In million euros
IFRS 16Impact
as of 30/06/19
Estimated IFRS 16
Impact as of 31/12/19
Revenues - -▪ Net external expenses 8 16▪ Personnel expenses - -▪ Restructuring costs - -
EBITDA 8 16
▪ Depreciation and amort. (8) (16)
Operating income (0) (0)▪ Financial income - -▪ Financial expenses (3) (6)
Financial result (3) (6)Result before tax (3) (6)
▪ Corporate income tax - -Net income (3) (6)
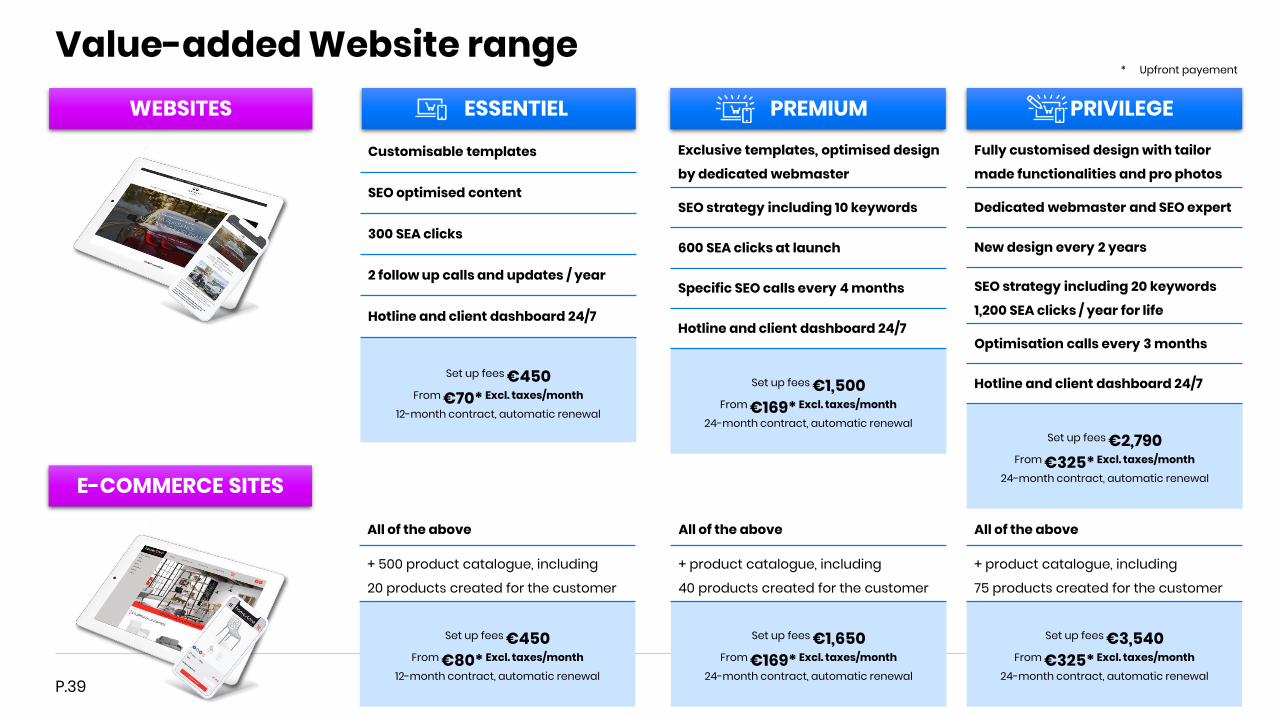
Value-added Website range
Customisable templates
SEO optimised content
300 SEA clicks
2 follow up calls and updates / year
Hotline and client dashboard 24/7
Set up fees €450From €70* Excl. taxes/month
12-month contract, automatic renewal
All of the above
+ 500 product catalogue, including
20 products created for the customer
Set up fees €450From €80* Excl. taxes/month
12-month contract, automatic renewal
Exclusive templates, optimised design
by dedicated webmaster
SEO strategy including 10 keywords
600 SEA clicks at launch
Specific SEO calls every 4 months
Hotline and client dashboard 24/7
Set up fees €1,500From €169* Excl. taxes/month
24-month contract, automatic renewal
All of the above
+ product catalogue, including
40 products created for the customer
Set up fees €1,650From €169* Excl. taxes/month
24-month contract, automatic renewal
Fully customised design with tailor
made functionalities and pro photos
Dedicated webmaster and SEO expert
New design every 2 years
SEO strategy including 20 keywords
1,200 SEA clicks / year for life
Optimisation calls every 3 months
Hotline and client dashboard 24/7
Set up fees €2,790From €325* Excl. taxes/month
24-month contract, automatic renewal
All of the above
+ product catalogue, including
75 products created for the customer
Set up fees €3,540From €325* Excl. taxes/month
24-month contract, automatic renewal
* Upfront payement
ESSENTIEL PREMIUM PRIVILEGEWEBSITESWEBSITES
E-COMMERCE SITES
P.39
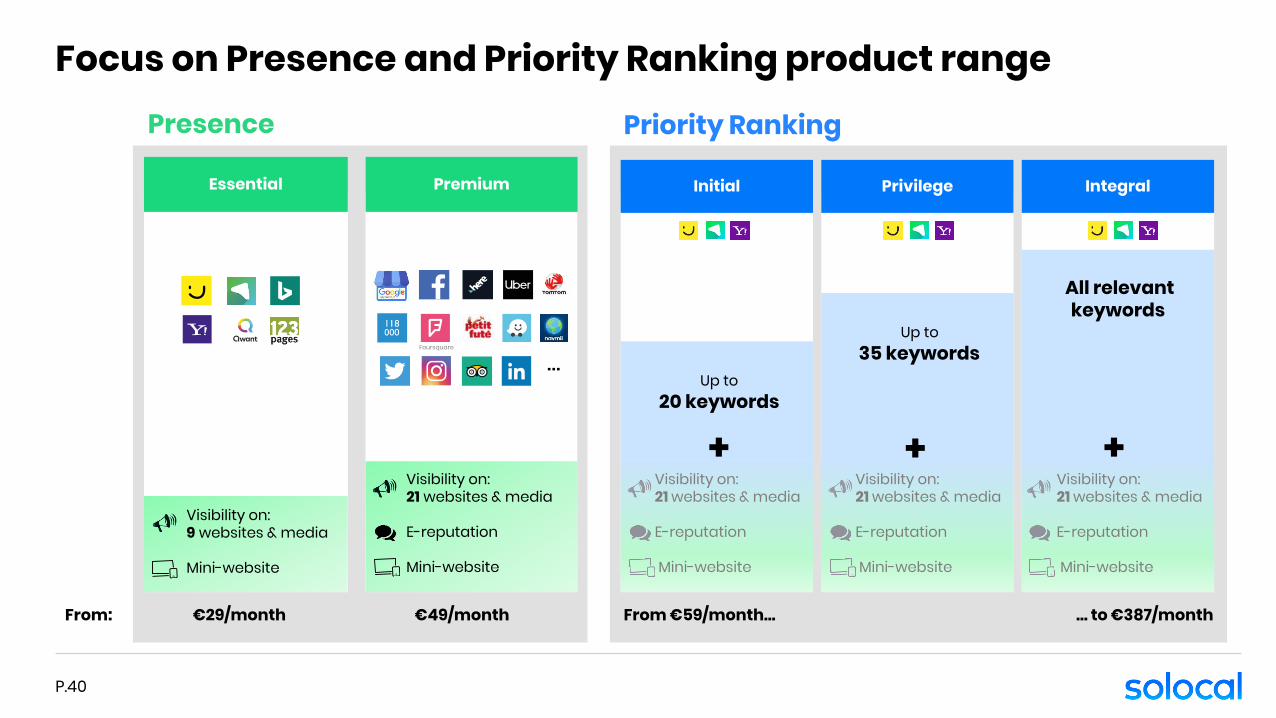
Focus on Presence and Priority Ranking product range
All relevant keywords
Up to35 keywords
Up to20 keywords
Visibility on:21 websites & media
E-reputation
Mini-website
PremiumEssential Initial
Presence Priority Ranking
Privilege Integral
+ + +Visibility on:9 websites & media
Mini-website
Visibility on:21 websites & media
E-reputation
Mini-website
From: €29/month €49/month From €59/month… … to €387/month
Foursquare
…
Visibility on:21 websites & media
E-reputation
Mini-website
Visibility on:21 websites & media
E-reputation
Mini-website
P.40