Embed Size (px)
Citation preview
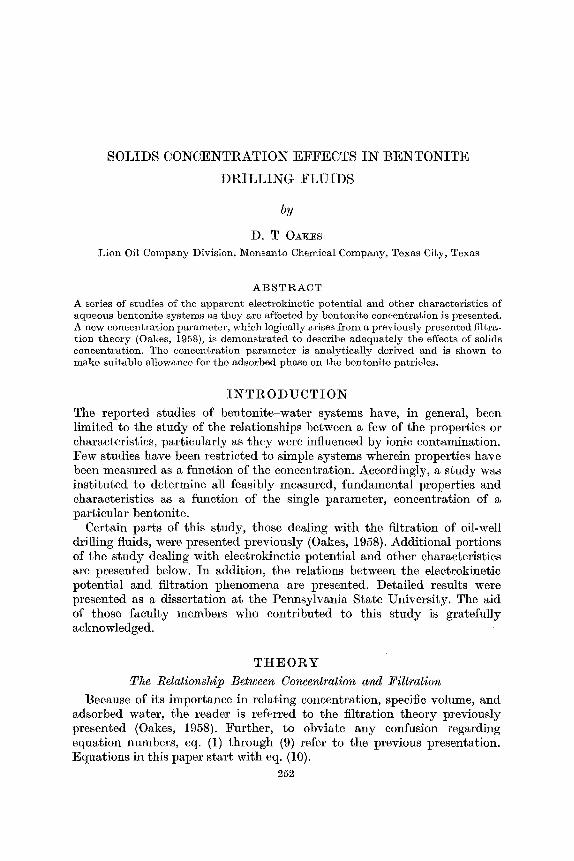
SOLIDS CONCENTRATION EFFECTS I N BENTONITE
DRILLING FLUIDS
Lion Oil Company Division, Monsanto Chemical Company, Texas City, Texas
ABSTRACT
A series of studies of the apparent electrokinetic potential and other characteristics of aqueous bentonite systems as they are affected by bentonite concentration is presented. A new concentration parameter, which logically arises from a previously presented filtra- tion theory (Oakes, 1958), is demonstrated to describe adequately the effects of solids concentration. The concentration parameter is analytically derived and is shown to make suitable allowance for the adsorbed phase on the bentonite patricles.
INTRODUCTION
The reported studies of bentonite-water systems have, in general, been limited to the study of the relationships between a few of the properties or characteristics, particularly as they were influenced by ionic contamination. Few studies have been restricted to simple systems wherein properties have been measured as a function of the concentration. Accordingly, a study was instituted to determine all feasibly measured, fundamental properties and characteristics as a function of the single parameter, concentration of a particular bentonite.
Certain parts of this study, those dealing with the filtration of oil-well drilling fluids, were presented previously (Oakes, 1958). Additional portions of the study dealing with electrokinetic potential and other characteristics are presented below. In addition, the relations between the electrokinetic potential and filtration phenomena are presented. Detailed results were presented as a dissertation a t the Pennsylvania State University. The aid of those faculty members who contributed to this study is gratefully acknowledged.
T H E O R Y
The Relationship Between Concentration and Filtration Because of its importance in relating concentration, specific volume, and
adsorbed water, the reader is referred to the filtration theory previously presented (Oakes, 1958). Further, to obviate any confusion regarding equation numbers, eq. (1) through (9) refer to the previous presentation. Equations in this paper start with eq. (10).
252
The Relationship Between Concentration, Xpecijic Volume, and Adsorbed Water
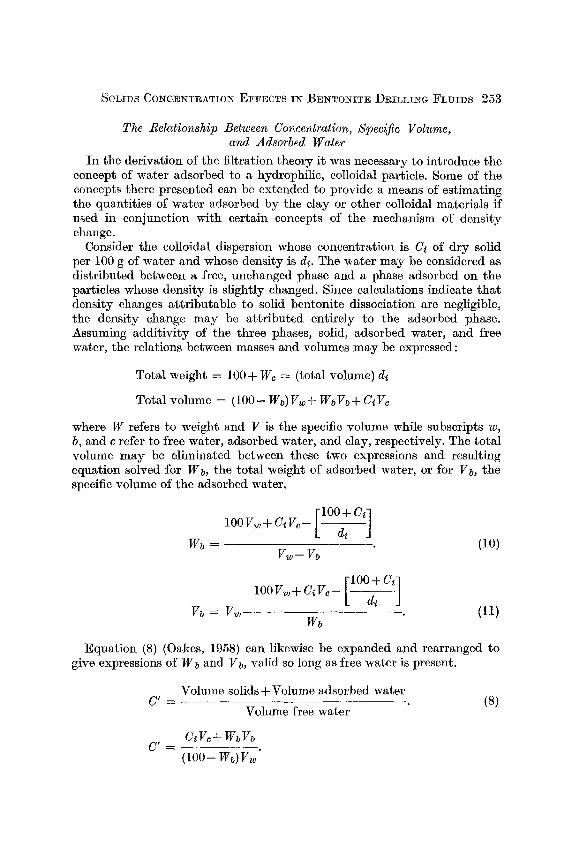
In the derivation of the filtration theory i t was necessary to introduce the concept of water adsorbed to a hydrophilic, colloidal particle. Some of the concepts there presented can be extended to provide a means of estimating the quantities of water adsorbed by the clay or other colloidal materials if used in conjunction with certain concepts of the mechanism of density change.
Consider the colloidal dispersion whose concentration is Ci of dry solid per 100 g of water and whose density is dz. The water may be considered as distributed between a free, unchanged phase and a phase adsorbed on the particles whose density is slightly changed. Since calculations indicate that density changes attributable to solid bentonite dissociation are negligible, the density change may be attributed entirely to the adsorbed phase. Assuming additivity of the three phases, solid, adsorbed water, and free water, the relations between masses and volumes may be expressed:
Total weight = 100 + We = (total volume) di
Total volume = (100 - WB) Vw + Wb Vb + Ci Vc
where W refers to weight and V is the specific volume while subscripts w, b, and c refer to free water, adsorbed water, and clay, respectively. The total volume may be eliminated between these two expressions and resulting equation solved for Wb, the total weight of adsorbed water, or for Vb, the specific volume of the adsorbed water.
Equation (8) (Oakes, 1958) can likewise be expanded and rearranged to give expressions of Wb and Vb, valid so long as free water is present.
Volume solids +Volume adsorbed water C' = ---
Volume free water (8)

Solving for W and Vb :
Eliminating Vb between eq. (11) and (13) gives for the total weight of adsorbed water :
In a similar manner Wb can be eliminated between eq. (10) and (12) to give for the specific volume of adsorbed water:
(C1/dt)(l0O- C,) - CiVc(l+ C') v b = v w -1. (I5)
looVW(I. + Cf)- [(loo+ Cz)/dil
MATERIAL, APPARATUS AND PROCEDURES Preparation of Materials
The colloidal dispersions of bentonite in water which were used in this investigation were prepared from commercial Wyoming bentonite in quanti- ties of each concentration sufficient for all measurements described below. These samples were agitated vigorously with electric stirrers for approxi- mately 6 hr and then placed in stoppered, glass containers. Before any measurements were made on these samples, they were allowed to hydrate a t approximately 30°C for at least 6 months during which time they were periodically agitated.
Apparatus and Procedures Concentration.-Exact concentration of clay samples was determined by
drying a weighed sample to constant weight a t 130 to 135°C. All weighings were made to within 0.0002 g on the analytical balance using calibrated weights. Concentrations are expressed in grams of solids per 100 g of water. Unless specified to the contrary, concentrations will be simplified to the expression of concentrations in grams, with the implication that the material was dispersed in 100 g of water.
Density.-The densities of the various samples of clay dispersions and filter cakes were determined by one of the two methods described below depending on the consistency of the particular sample.

The densities of those samples that were sufficiently fluid to be placed in an accurately calibrated pycnometer (50 ml Leach specific-gravity bottle) were determined using the standard procedure.
All filter cakes were of such consistency that they could be formed into lumps on one end of a platinum support wire of known weight. Great care was taken in the formation of these lumps so that no air was occluded. These lumps were weighed first in air and then in benzene of known temperature. The volumes of the lumps were calculated using Archimedes' principle of buoyancy. Presumably, because of the slight mutual solubility of benzene and water, no difficulty was experienced in displacing air from the surfaces of the clay lumps.
The density of the dry bentonite was determined using the standard pycno- meter procedure for measurement of the density of solids. Approximately 20 g of dry bentonite was placed in a pycnometer and dried a t 130 to 135°C for a period of 5 days after which i t was allowed to cool to room tempera- ture in a desiccator and was weighed with stopper and cap in place. The stopper and cap were removed and the pycnometer was partially filled with pure benzene. The resulting unstable suspension was agitated carefully for 5 hr to allow complete wetting of the bentonite by the benzene. The ben- tonite was allowed to settle until the upper layers of benzene were com- pletely free of bentonite, after which additional benzene was added. The stopper was inserted and the pycnometer and its contents were heated to 30°C in the water bath. Excess benzene was removed from the overflow capillary which was sealed with its cap. The pycnometer was washed, dried and weighed on the analytical balance. As the weights of the pycnometer and the bentonite were known, the weight of benzene and its volume were calculated. The difference in volume between the benzene and the pycnometer was taken as the volume of the bentonite. The density was calculated from this volume and the previously determined weight.
Water loss.-Water loss determinations were made using a standard, wall- building tester thermostated in an air bath a t 30°C (f 1.0"). A constant filtration pressure of 100 psig was maintained throughout all water loss determinations. Water loss data were taken a t short intervals of time up to approximately 50 min. Filtrate volumes were plotted against the square root of time and the standard adjustment to zero time waa made (Rogers, 1953, p. 270). For simplicity, unless otherwise stated, the 30-minute water loss a t 30°C and 100 psig, corrected to zero time, will be referred to as the water loss.
Apparent electrokinetic potential.-As in the determination of density, i t was necessary to use two different techniques in the measurement of the apparent electrokinetic potential. This situation arises as a result of the thixotropy of bentonite sols, since the electroosmotic technique relies on the existence of a gel, whereas the electrophoretic technique assumes its absence.
The apparatus utilized for electroosmotic measurement of electrokinetic potential has been reported previously (Oakes and Burcik, 1956). Potential

gradients applied varied from zero to about 3 v per cm. All measurements were made a t 30°C and the polarity of the electrodes was alternated. Concen- trations varied from 4 g up to 12 g per 100 g of water.
Apparent electrokinetic potentials in the concentration range from 0 to 4 g were determined using a " moving boundary " (electrophoretic) tech- nique. The cell used was a U-shaped tube of 2.77 cmZ cross-sectional area with platinum electrodes spaced 32.0 cm apart. The loading of the U-tube was accomplished in the following manner. After filling the U-tube with filtrate up to the electrodes, the dispersion was placed in the lower portion of the U-tube through a specially constructed pipette which allowed very slow delivery rates. The dispersion was delivered from the pipette into the bottom of the U-tube until the boundary between the filtrate and dispersion was several centimeters below the electrodes in thc vertical portion of the U-tube. Irregularities a t the boundary were removed by careful withdrawal through a very fine capillary tube.
An electrical potential difference was applied to the electrodes and the rate of migration of the boundary was observed dong a scale attached to the apparatus. Applied potentials utilized ranged from 150 to 300 V.
DISCUSSION
Estimation of Adsorbed Water
Gener?l.-One of the most important physical processes that take place in a hydrophilic colloidal suspension is the process which takes place at the solid-liquid phase boundary and which is variously known as solvation, hydration, or adsorption. For an excellent discussion of hydration phenomena the reader is referred to Alexander and Johnson (1949).
In this study several methods were investigated in an attempt to evaluate the hydration-of bentonite dispersions and the quantities of adsorbed water, as they will hereafter be termed. Attempts were limited to techniques that could be conducted a t a constant tem~erature of 30°C and which would not
L
introduce any extraneous materials into the samples. These limitations reduced the possibilities to measurement of vapor pressure, osmotic pressure, dielectric constant, density, and compressibility. o f these density and compressibility were measured.
Adsorbed water from density data.-A theoretical approach to the evalua- tion of the quantity of adsorbed water has been presented in the section on Theory, above. Inherent in this derivation was the assumption that the specific volume of the adsorbed water does not change appreciably with concentrations so long as free water is present. This assumption was made in order that the term " B " of eq. (5) (Oakes, 1958) could be eliminated. To test the validity of this assumption eq. (11) may be modified for the specific volume when all water is adsorbed, that is, when only adsorbed water and solid phases are present.

where C p represents the bentonite concentration of the cake.
CONCENTRATION, g per 100 g
FIGURE 1.-Density vs. concentration for Wyoming bentonite (extended concentration rango)
From eq. (16) it can be seen that only the concentration and density data are needed to evaluate the specific volume of the adsorbed water. These density data are shown in Figs. 1 and 2 and are given in Table 1. Samples of the concentrations greater than filter-cake conceiltration were prepared by an expression process. Expression is here defined as the separation of liquid from a two-phase, solid-liquid system by compression of the system under conditions that permit the liquid to escape while the solid is retained between the compressing surfaces. This was effected by separating a newly

258 EIQHTH NATIONAL CONFERENCE ON CLAYS AND CLAY MINERALS
- 0 2 4 6 8 1 0 1 2
CONCENTRATION, g p e r 100 g
FIGURE 2.-Density vs. concentration for Wyoming bentonite (low concentration range)
Concen- tration
(9) Density (giml)
Water-Loss (ml)
Specific Volume (mug)
Inf. 35.9 25.1 17.7 13.5 10.8 9.8 8.5 -
Adsorbed Water
(Total g)
Density of dry bentonite = 2.5196 g/ml a t 30°C.
Adsorbed Water (gig)

formed filter-cake from the air pressure by a thin, impermeable membrane (du Pont Mylar) and pressing in the filter press until no more fluid was extruded at the given pressure. All pressed samples were prepared from the same initial dispersion (concentration = 6 g). Densities and concentrations of the pressed samples were determined and the specific volume of the remain- ing water, the adsorbed water, was calculated using eq. (16). A plot of the specific volume of adsorbed water versus the expression pressure is given in Fig. 3. If the curve is extrapolated to zero pressure the specific volume of the adsorbed water is seen to be approximately 0.987 ml/g. This compares favorably with 0.9880 ml/g calculated from density data a t filter cake con- centration (Table 2).
FIGURE %.-The effect of expression pressure on specific volume of adsorbed water.
The specific volumes for other points over the entire concentration range were calculated using eq. (16) and are presented in Fig. 4. The curve is com- posed of two smooth portions which intersect at approximately 35 g. This intersection represents the concentration and specific volume of the adsorbed water in the filter cake and is seen to agree with the values as determined both experimentally and by extrapolation of the pressure-specific volume

Concentration (g)
Pressure psi
Density ( g i m l )
* Apparent values based on eq. (16).
Specific Volume of Adsorbed Water
( m l i g )
FIGT~RI? 4.-Variation of specific volume of adsorbed water with clay concentration.
curve to zero pressure. This likewise represents the lower limit of applica- bility of eq. (16). More important, i t suggests that the minimum concentra- tion a t which all water is firmly adsorbed is the filter-cake concentration. Conversely, the concentration of the filter cake may be taken as that concen- tration at which all water is adsorbed.

The concept that all watcr in a concentrated dispersion may be immobilized has been qualitatively indicated by several preliminary tests not discussed. In these tests it was observed that finite pressures were required to initiate flow of filtrate through a concentrated dispersion. For example, a concen- trated bentonite dispersion of about 6 g concentration about 30 cm long was subjected to a head of 50 cm of water for a period of 6 weeks without any observable flow of filtrate through the concentrated plug.
FIGURE 5.-Variation of total adsorbed water with clay concentration.
Referring back to Fig. 4, it is seen that the curve may be extrapolated to zero concentration since its trend is well established. The absence of a change in the physical mechanism of hydration is indicated by the regular, smooth density-concentration curve (Fig. 2). This virtually horizontal curve (Fig. 4) is believed to provide justification for the assumption made in the derivation of eq. (14) and (15), that is, that the specific volume of adsorbed water did not change appreciably, so long as free water is present.
Having thus shown that the assumption involved in the derivation of these equations was reasonable, the quantities of adsorbed water, W b , and the specific volume of adsorbed water, Vb, were estimated using eq. (14) and (15). These values are summarized in Table 1, and the adsorbed water as a function of concentration is presented in Fig. 5. From Table 1 it will be scen

that the adsorbed water (g/g) averages 2.781 g H20 per gram of bentonite with a maximum deviation of about 1 percent. I t should be pointed out that the close agreement between the calculated values of specific volume and the values indicated by the extrapolated curve (below filter-cake concentration) of Fig. 4 arises as a result of the assumption discussed above and does not in itself prove the validity of the assumption.
Figure 5 shows that the adsorbed water curve has a constant slope and, therefore, that the quantity of adsorbed water per gram of bentonite is constant. Inspection of eq. (14) will show that the weight of adsorbed water is not a linear function of C' and that it is a linear function of the concentra- tion, Ci. Further, as Ci (and thus C') approach zero the wcight of adsorbed water also approaches zero. Thus, the fact that the plot of adsorbed water versus clay concentration (Fig. 5) is linear and passes through the origin conclusively demonstrates that the value of B of eq. (2), (4) and (5) is negli- gible and that eq. (9), (14) and (15) are valid. Rephrasedin physical terms, this indicates that there is negligible change in the volume of the water adsorbed on the clay particles as the particles pass from the dispersion to the filter- cake. This is somewhat at variance with adsorbed water determinations made using the dilatometer which usually indicate a greater amount of adsorption per gram of bentonite at the lower concentrations. Since large changes in the specific volume would be required to show such changes in the adsorbed water content as herein estimated and, further, since all measurements made using the dilatometer give substantially lower quantities per gram of ben- tonite, i t is believed that the freezing process itself may account for the observed deviation.
Adsorbed water from compressibility data.-Measurements of the compres- sibility of the bentonite suspensions were made over 500 psig increments from 0 to 3000 psig. Because of the change of compressibility with absolute pressure and the small change with clay concentration, comparison of com- pressibilities can be made only over small absolute pressure ranges. The interval between 2500 and 3000 psig was selected as being less subject to the possibility of the existence of a gaseous, second phase. The compressibility for this range was observed to differ from the compressibility that would be observed if there were no interaction between solid and liquid. The latter was calculated assuming additivity of the compressibilities of the two compo- nents. Unfortunately, no means of determining the compressibility coefficient of adsorbed water was devised which would allow direct estimation of the adsorbed water. As a result, the compressibility provides only qualitative confirmation.
If the quantities of water determined from the density data are assumed to be correct, however, the approximate values of the compressibility coeffi- cient of adsorbed water may be estimated. In this case, additivity of the compressibilities of the three components-bentonite, adsorbed water, and free water-must be assumed. In this manner the compressibility coefficient of the adsorbed water at a concentration of 12.9 g was found to be 42.85 x 10⁻⁶
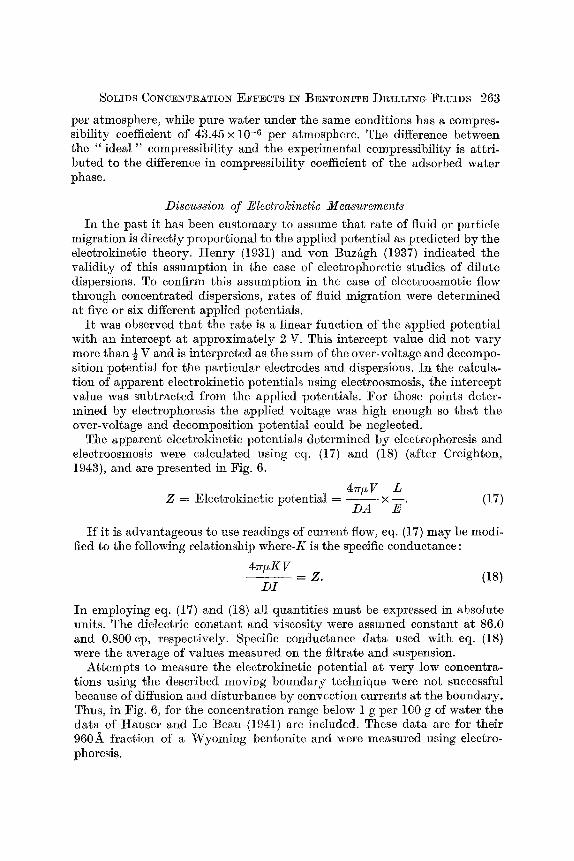
per atmosphere, while pure water under the same conditions has a compres- sibility coefficient of 43.45 x 10⁻⁶ per atmosphere. The difference between the " ideal "compressibility and the experimental compressibility is attri- buted to the difference in compressibility coefficient of the adsorbed water phase.
Discussion of Electrokinetic Measurements
In the past it has been customary to assume that rate of fluid or particle migration is directly proportional to the applied potential as predicted by the electrokinetic theory. Henry (1931) and von BuzAgh (1937) indicated the validity of this assumption in the case of electrophoretic studies of dilute dispersions. To confirm this assumption in the case of electroosmotic flow through concentrated dispersions, rates of fluid migration were determined at five or six different applied potentials.
It was observed that the rate is a linear function of the applied potential with an intercept a t approximately 2 V. This intercept value did not vary more than 4 V and is interpreted as the sum of the over-voltage and decompo- sition potential for the pzrticular electrodes and dispersions. In the calcula- tion of apparent electrokinetic potentials using electroosmosis, the intercept value was subtracted from the applied potentials. For those points deter- mined by electrophoresis the applicd voltage was high enough so that the over-voltage and decomposition potential could be neglected.
The apparent electrokinetic potentials determined by electrophoresis and electroosmosis were calculated using eq. (17) and (18) (after Creighton, 1943), and are presented in Fig. 6.
4npV L Z = Electrokinetic potential = --- x -.
D A E
If it is advantageous to use readings of current flow, eq. (17) may be modi- fied to the following relationship where-K is the specific conductance :
In employing eq. (17) and (18) all quantities must be expressed in absolute units. The dielectric constant and viscosity were assumed constant at 86.0 and 0.800 cp, respectively. Specific conductance data used with eq. (18) were the average of values measured on the filtrate and suspension.
Attempts to measure the electrokinetic potential at very low concentra- tions using the described moving bounda,ry technique were not successful because of diffusion and- disturbance by convection currents at the boundary. Thus, in Fig. 6 , for the concentration range below 1 g per 100 g of water the data of Hauser and Le Beau (1841) are included. These data are for their 960A fraction of a Wyoming bentonite and were measured using electro- phoresis.

With the exception of the values obtained at the concentration of 3.77 g, all values lie on a relatively smooth curve. At 3.77 g the value obtained by electrophoresis occurs above the curve while the values obtained using elec- troosmosis falls an equal distance below the curve. The lower value obtained by electroosmosis may be attributed to movement of the solid phase within the central section of the apparatus, since this technique relies on the gel
FIGURE 6.-Variation of apparent electrokinetic potential with clay concentration (x's, electrophoresis; circles, electroosmosis; squares, electrophoresis, Hauser, 1941).
to prevent such movement in the central section. The only explanation suggested for the high value obtained by electrophoresis is diffusion of the particles from the dispersion into the clear filtrate as a result of the repul- sive forces between particles and varying particle velocities. This effect has been observed in some cases but was not discernible in this particular run.
L
The data obtained in this study are seen to be reasonable extensions of the data of Hauser and LeBeau (1941). While of somewhat doubtful accuracy a t a concentration of between 1 and 4 g of bentonite per 100 g of water, this composite curve presents the only data that cover the usual working range of Wyoming bentonite.

The apparent electrokinetic potential is plotted against the water loss in Fig. 7, data being taken from the smooth curve presented in Fig. 6. The linear relationship postulated by Oakes and Burcik (1956) is seen to exist for the higher concentrations b u t deviates somewhat a t the very low con- centrations. As previously indicated, however, the values of the electro- kinetic potential are questionable in this range.
E L E C T R O K I N E T I C P O T E N T I A L , ( m v )
FIGURE 7.-The dependence of water loss on the electrokinetic potential.
Alternate Theory of Electrokinetic Phenomena Thus far, i t has been assumed that the change in electrokinetic migration
rate is due entirely to changes in the electrokinetic potential. That such change might occur as a result of change in dielectric constant or viscosity has been previously indicated (Alexander, 1949). Support for this belief was offered as early as 1929 when Marinesco (1929) first observed changes in the dielectric constant of colloidal dispersions. His attempts to evaluate adsorbed water were not considered significant because of the long wave lengths utilized (7.5 m). Further support of a qualitative nature was offered by Kistler (1931) who found a reduction in the dielectric constant from 81.0

to 72.6 for a dispersion of dialyzed hydrogen bentonite using wave lengths of 32 cm. The recent work of Deeg and Huber (1955) in several systems over their complete concentration range clearly confirms the change of dielectric constant.
As a result of the above indications an attempt was made to evolve a simplified physical picture of the so-called adsorbed layer or the fixed portion of the double-layer as well as the diffuse layer. This analysis is probably oversimplified, but every attempt has been made to base values on experi- mental data measured on the bentonite systems here investigated or on similar Wyoming bentonite systems.
Consider a bentonite particle of 10A thickness and 250A by 250A areally which attaches to all surfaces a layer of water of thickness, t b in Angstroms. Brindley and MacEwan in discussion to Johnson (1955) indicate that the fundamental crystallites are on the order of 250 to 300A but may link together to form loosely attached larger particles. Brindley further states, in discussion to MacEwan (1955), that " sodium montmorillonite placed in water swells to such an extent that the basal spacing increases up to 20A. Beyond that i t is difficult to follow. The structure swells to the point where there are individual sheets of montmorillonite with no spatial regularity between them."
On the basis of these assumptions and facts the following relations may be written : To the first approximation :
135,000tb grams Mass of adsorbed water =
1024 x .987S particle
gram Mass of clay = 6.25 x 105 x 2.52210-24 = 15.74 x 10⁻¹⁹ ---
particle Mass of adsorbed water - 135,000tb
- Mass of clay 1024 x .9878 x 6.25 x 105 x 2.52 x 10-24
Mass adsorbed water tb = 1 1 . 5 ~
Mass of clay
At the lowest concentration a t which 100 percent of the water is adsorbed (the filter-cake concentration), 100 g of water is adsorbed by 33.395 g of bentonite.
Thickness of adsorbed layer = 34.4 A s. 11 Molecules.
This value compares favorably with numerous measurements of many investigators. For example, Brunauer (1943) cites the following values

observed for adsorption of water on glass: 10, 7.2, 6.5, 9, and 6-7 molecules. Fricke and Parker (1940) observed 5 molecular layers on gelatin.
The change in the properties of the water is not believed confined to the fixed layer immediately adjacent to the particle but may extend considerable distances into, and is perhaps associated with, the diffuse counter-layer. See Forslind (1953) and Kistler (1931).
The most striking indication of the extent of these fields in the case of bentonite was presented by Hauser and Le Beau (1941) and forms a basis for much of the following argument. Using carefully sized fractions of bento- nite, Hauser and Le Beau measured the electrophoretic migration rate as a function of concentration. These data are presented in Fig. 6 for their 960A fraction. It will be observed that the electrokinetic potential remained constant up to a concentration of 0.5 g, above which the apparent electro- kinetic potential decreased very rapidly. This was interpreted as the point a t which inter-particle interference commenced, or the point at which a molecule of water midway between particles would be simultaneously in- fluenced by both. The equivalent particle spacing (between centers) may be estimated in the following manner: For a concentration of 0.50 g bentonite per 100 g H20 :
iV.5 = 0.50115.74 x 10-19 = 31.75 x 10¹⁶ particles
Volume of water 100 x .9988 ml water - - - = 3.145 x 10⁻¹⁶
Particle 31.75 x 10¹⁶ particle
Designating the distance between centers of particles as L:
For concentrations, C, up to about 10 g bentonite per 100 g HeO :
Using the 6808 spacing as equivalent to the concentration above which no unaffected bulk liquid can exist, the following assumptions were made:
1. The dielectric constant of the water in a colloidal suspension of bento- nite varies linearly with dista,nce from the outer surface of the particle, having a value of 2.0 at the outer face of the bentonite particle and a value of 86.0 at 340A (68012).
2. The viscosity varies linearly over the same distance, having a value of 1.8 centipoises at the particle surface and 0.80 a t 240A.
The figures 0.80 centipoises and 86.0 represent the viscosity and dielectric constant of pure water a t 30°C. The figure 2.0 is the experimental dielectric constant for adsorbed water observed by Deeg and Huber (1955) in aqueous suspensions of clay, kaolinite and bentonite.
The viscosity value of 1.8 was arbitrarily assumed and represents the viscosity of water a t or near the freezing point.
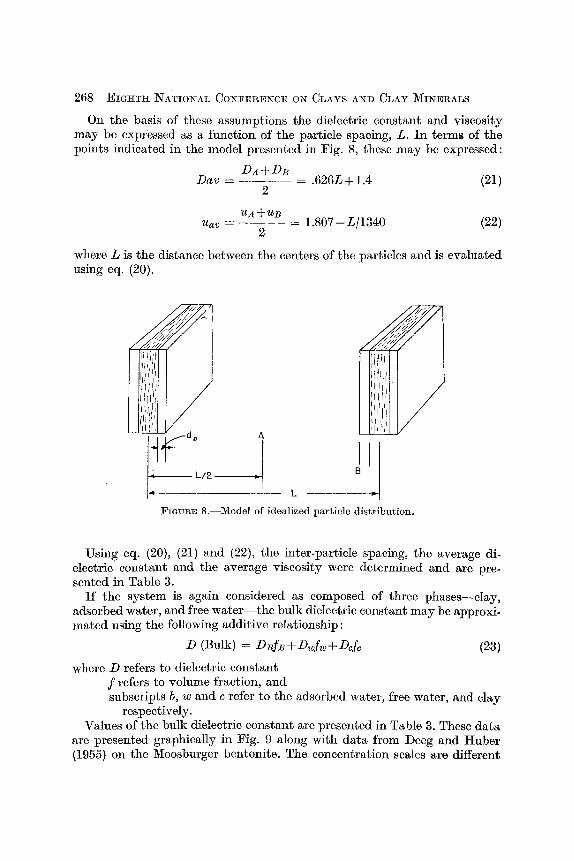
On the basis of these assumptions the dielectric constant and viscosity may be expressed as a function of the particle spacing, L. In terms of the points indicated in the model presented in Fig. 8, these may be expressed:
Dav = DA+DB
= .626L + 1.4 2
where L is the distance between the centers of the particles and is evaluated using eq. (20).
FIGURE 8.-Model of idealized particle distribution.
Using eq. (20), (21) and (22), tho inter-particle spacing, the average di- electric constant and the average viscosity were determined and are pre- sented in Table 3.
If the system is again considered as composed of three phases-clay, adsorbed water, and free water-the bulk dielectric constant may be approxi- mated using the following additive relationship :
D (Bulk) = D ~ f s + Dtofw +Dcfc (23)
where D refers to dielectric constant f refers to volume fraction, and subscripts b, w and c refer to the adsorbed water, free water, and clay
respectively. Values of the bulk dielectric constant are presented in Table 3. These data
are presented graphically in Fig. 9 along with data from Deeg and Huber (1955) on the Moosburger bentonite. The concentration scales are different

Concen- tration
(g) ----
Particle Spacing
(A) --
Dielectric constant of bentonite = 2.0.
Viscosity of Liquid
(CP)
Dielectric Constant of Liquid
-
Water-Loss (mu
Dielectric Constant of Dispersion
Electro- kinetic
Potential (mv) --
FIGURE 9.-Comparison of calculated and experimental dielectric constants of bentonite suspensions (solid circles, calculated; open circles, experimental, Deeg and Huber,
1955).

as would be expected owing to the difference in quality of the two clays. In any event, the comparable decrease in the dielectric constants of the dispersion may be observed.
In the derivation of the expression for the electrokinetic potential, the double layer is usually considered to be a condenser whose potential is 2, in a medium of dielectric constant, D. If the medium is water, the value of D at 30°C is 86.0, Further, the viscosity value used is that corresponding to water a t 30°C or 0.800 cp. Equation (17) may then be expressed:
4mVL 4n x 0,800 x 12.92V Z = - - - -
DAE 86.0 x E (17a)
If, however, the electrokinetic potential, 2, is assumed constant and the change in migration rate, V, is attributable to changes in D and u as the concentration changes, eq. (17) may be rewritten:
D 4nVL 4nx12.92V -=--- - u ZAE (a constant) E
(17b)
Dividing eq. (17a) by eq. (17b) :
Z = a constant x Dlu. ( 1 7 ~ )
Equation (17c) indicates that if the calculated changes in dielectric constant and viscosity are responsible for the observed variation in electrokinetic migration rates, a plot of calculated Dlu versus experimental electrokinetic potential should be linear. This relationship is presented in Fig. 10.
In addition, i t was shown above (Fig. 7) that a linear relationship exists between water loss and apparent electrokinetic potential. It is interesting to note that the plot of calculated Dlu against water loss gives a better straight line (Fig. 11) than is observed in Fig. 7. As indicated above, however, the deviation is presumed to be the result of experimental error in the value of Z.
While the analysis presented above is based on observed facts and pre- sumably reasonable assumptions, i t cannot be considered as proof that the changes obsqrved are conclusively attributable to changes in the dielectric constant and viscosity. It may be considered as a clear suggestion to that effect largely because there is no argument which suggests that the change takes place in the electrokinetic potential. It should be emphasized, how- ever, that these effects are the changes observed with changing concentra- tion of colloidal material. I n the presence of changing contamination by electrolytes the electrokinetic potential would almost surely change.
CONCLUSIONS
On the basis of a careful analysis of the data gathered during this investi- gation, along with the data available in the literature, the following conclu- sions have been formulated. It should be emphasized that the conclusions,

however, while possibly applicable to other colloidal systems, are formulated specifically for bentonite-water systems.
1. The expression of effective concentration, C', arising from a previously presented filtration theory (Oakes, 1958), is an appropriate means of express- ing concentration which more accurately describes the nature and importance of the dispersed phase, whether solids or adsorbed liquid.
2. The amount of adsorbed water may be estimated from density data and constant-pressure filtration data, if the adsorbed phase and free-water phase are each assumed to be homogeneous.
FIGURE 10.-Electrokinetic potential vs. calculated D/u for bentonite systems.
3. The total amount of adsorbed water indicated by density and constailt- pressure filtration data is directly proportional to the amount of bentonite as long as free water is present. The total amount indicated will, however, vary somewhat depending on the filtration pressure.
4. One hundred percent of the water may be considered to be adsorbed or fixed at the filter-cake concentration. Conversely, the simplest means of estimating the amount of adsorbed water is by measurement of the filter- cake concentration and density.

5 . The variation of the apparent electrokinetic potential may reasonably be attributed to changes in the dielectric constant and viscosity of the dispersing medium.
FIGURE 11.-Water-loss vs. calculatod D/u for bentonite systems.
6. The water loss is a linear function of electrokinetic potential if the di- electric constant and viscosity of the dispersing medium are considered constant. The water loss is a linear function of dielectric constant divided by viscosity if the electrokinetic potential is considered constant. This effect is the result of a change in concentration of the dispersed phase and does not apply to the effect of electrolytes.
R E F E R E N C E S
Alexander, A. E. and Johnson, P. (1949) Colloid Science, v. 1 and 2: Oxford Univ. Press, London, 837 pp.
Brunauer, S. (1943) Th.e A d s o r ~ t i o ~ of Gases and Vapors, v. 1 : Princeton Univ. Press, 511 pp.
BuzAgh, A. von (1937) Colloid Systems: The Technical Press, London, 311 pp. Creighton, H. J. (1943) Principles of Electrochemistry, v. 1 : John Wiley & Sons, Inc.,
New York, 477 pp.

SOLIDS CONCENTRATION EFFECTS IN BENTONITE DBILLING FLUIDS 273
Deeg, E. and Huber, 0. (1955) Dielektrische Eigenschaften einiger Tonmassen im Dezi- meterwellengebiet in Abhiingigkeit vom Wassergalt : Ber. dtsch. keram. Ges., Band 32, Heft 9, pp. 261-272.
Forslind, E. (1953) Water association and hydrogels: Proc. Second International Congress on Rheology, London, pp. 50-61.
Fricke, H. and Parker, E. (1940) The dielectric properties of the system gelatin-water, I1 : J. Phys. Chem., v. 44, pp. 716-726.
Hauser, E. (1939) Colloidal Phenomena: McGraw-Hill Book Co., New Yorlz, 294 pp. Hauser, E. and Le Beau, D. S. (1941) Studies in colloidal clays, I1 : J . Phys. Chem., v. 45,
pp. 54-65. Henry, D. C. (1931) The cataphoresis of suspendod particles: Proc. Roy. Soc. A, (Lon-
don), v. A 133, pp. 106-129. Johnson, A. L. (1955) Particle size distribution in clays: in Clays and Clay Technology,
California Division of Mines, Bull. 196, pp. 89-91. Kistler, S. S. (1931) Dielectric constant and structure of thixotropic sols: J.Phys. Chem.,
v. 35, pp. 815-829. Marinesco, N. (1929) Dielectric polarization and the structure of hydrophile colloids:
C.R. Acad. Sci., Paris, v. 189, pp. 1274-1276. MacEwan, D. M. C. (1955) Interlamellar sorption by clay minerals : in Clays and Clay Tech-
nology, California Division of Mines, Bull. 169, pp. 78-85. Oakes, D. T. (1958) Filtration theory for oil-well drilling fluids: in Clays and Clay
Minerals, Natl. Acad. Sci.-Natl. Research Council pub. 566, pp. 46-60. Oalzes, D. T. and Burcik, E. J. (1956) Electrokinetic phenomena in colloidal clays:
in Clays and Clay Minerals, Natl. Acad. Sci.-Natl. Research Council pub. 456, pp. 225-239.
Rogers, W. I?. (1953) Composition and Properties of Oil Well Drilling Fluids: Gulf Publ. Co., Houston, 676 pp.