Embed Size (px)
Citation preview
2011 Business Report Délégation Unédic AGS
PREVENTION
PROTECTION
ANTICIPATION
SOLIDARITY
COMPOSITION
RECOVERY
EMPLOYEES

Dél
égat
ion
Uné
dic
AG
S
1
Summary
BUSINESS & KEY FIGURES ■ Companies & insolvency procedures 4
■ Advances 13
■ Recoveries 16
■ Contributions 18
■ Disputes 19
MEETING & TALKING■ Europe & the European Commission 22
STATISTICS■ Key figures 24
■ Key parameters 25
ORGANIZATION■ Organization chart of DUA 25 26
■ Network and contact information 27
The missions of the AGS garantee scheme
Created in 1973 at the initiative of employers, for purposes of
inter-professional solidarity, AGS assists employees and
employers involved in a receivership process. It intervenes in case the
company is in receivership or liquidation or sometimes, under certain
conditions, in protection proceedings and ensures, as early
as possible, the amounts due to employees.
Pursuant to the provisions of a management agreement between
AGS and Unédic, the assignments entrusted by the legislator to AGS
have been implemented by the Délégation Unédic AGS.
At the heart of receivership proceedings, AGS fulfils three basic
missions as part of the employee claim guarantee scheme:
■ Advancing, via judicial representatives, the funds required to settle
employee’s claims;,
■ Recovering the sums advanced on the basis of monitoring
protection proceedings, receivership proceedings and the
liquidation of company assets;
■ Defending the legal interests of the guarantee scheme.
Financing
The French insolvency fund is financed from contributions paid
by employers. The AGS Board of Directors sets the amount of
contribution employers must pay and is responsible for ensuring the
fund balances. It does this by ensuring advances, recoveries and
contributions remain on an even keel.
The Wage Guarantee Scheme: a centralcomponent in the receivership processes
2 3
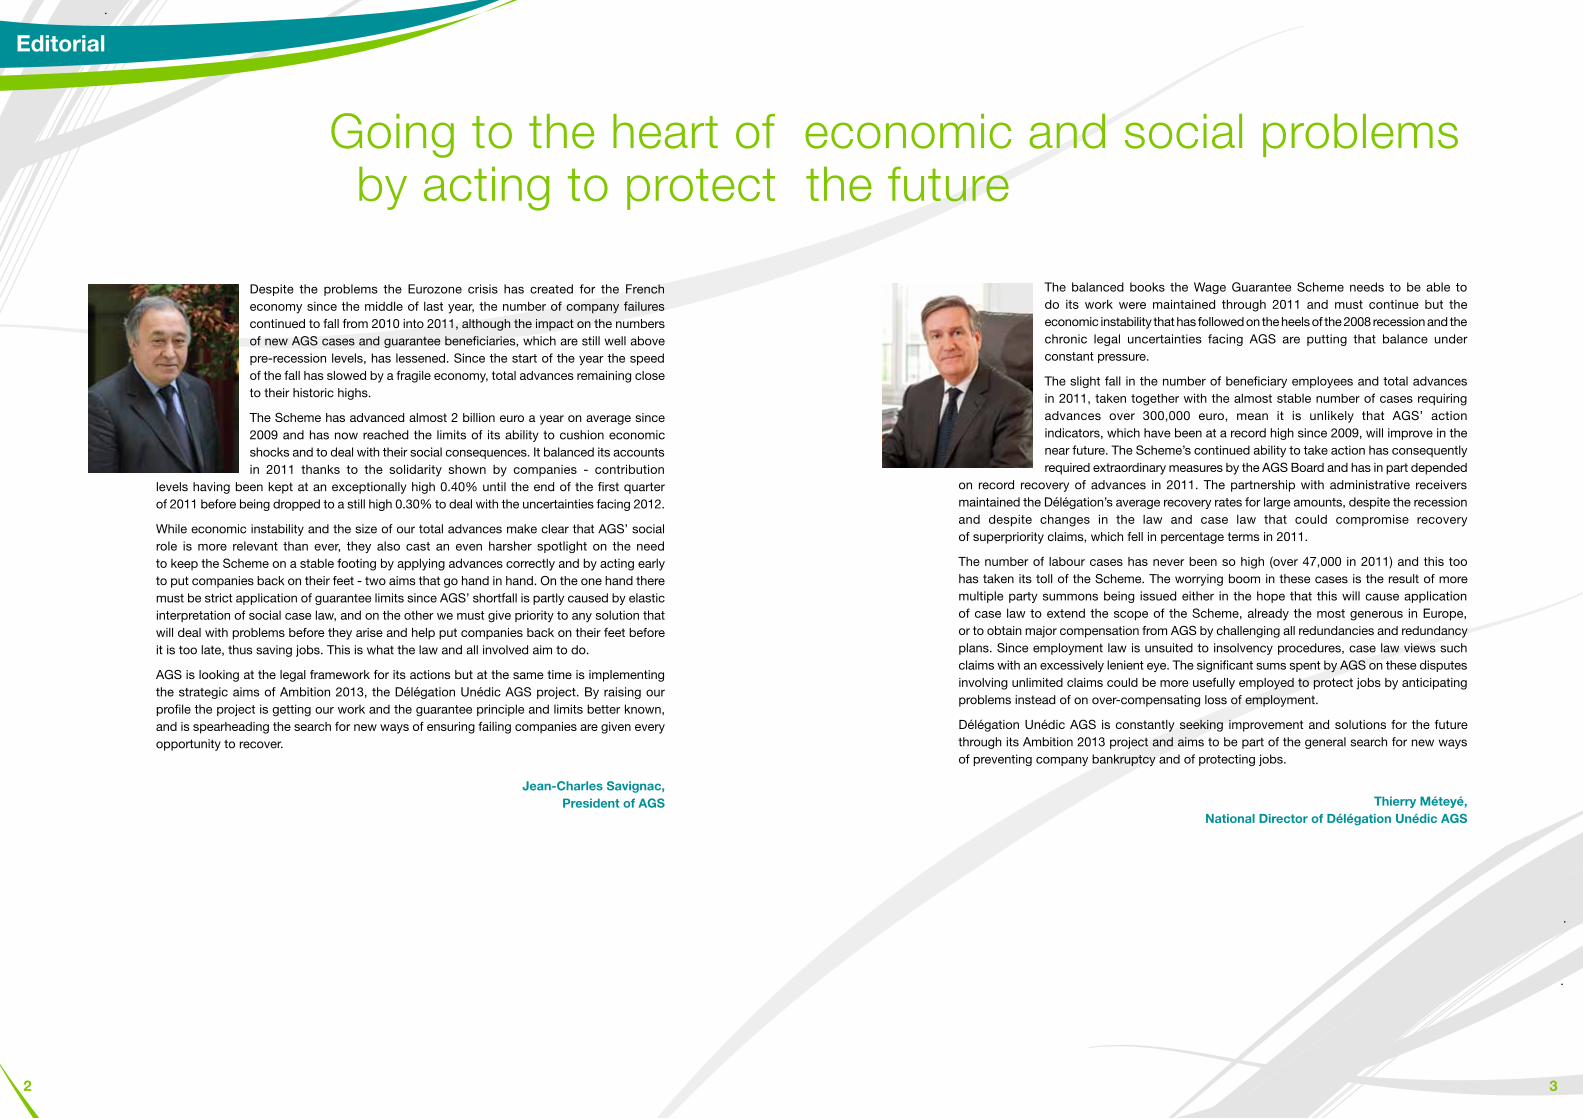
Despite the problems the Eurozone crisis has created for the French economy since the middle of last year, the number of company failures continued to fall from 2010 into 2011, although the impact on the numbers of new AGS cases and guarantee beneficiaries, which are still well above pre-recession levels, has lessened. Since the start of the year the speed of the fall has slowed by a fragile economy, total advances remaining close to their historic highs.
The Scheme has advanced almost 2 billion euro a year on average since 2009 and has now reached the limits of its ability to cushion economic shocks and to deal with their social consequences. It balanced its accounts in 2011 thanks to the solidarity shown by companies - contribution
levels having been kept at an exceptionally high 0.40% until the end of the first quarter of 2011 before being dropped to a still high 0.30% to deal with the uncertainties facing 2012.
While economic instability and the size of our total advances make clear that AGS’ social role is more relevant than ever, they also cast an even harsher spotlight on the need to keep the Scheme on a stable footing by applying advances correctly and by acting early to put companies back on their feet - two aims that go hand in hand. On the one hand there must be strict application of guarantee limits since AGS’ shortfall is partly caused by elastic interpretation of social case law, and on the other we must give priority to any solution that will deal with problems before they arise and help put companies back on their feet before it is too late, thus saving jobs. This is what the law and all involved aim to do.
AGS is looking at the legal framework for its actions but at the same time is implementing the strategic aims of Ambition 2013, the Délégation Unédic AGS project. By raising our profile the project is getting our work and the guarantee principle and limits better known, and is spearheading the search for new ways of ensuring failing companies are given every opportunity to recover.
Jean-Charles Savignac, President of AGS
Going to the heart of economic and social problems
The balanced books the Wage Guarantee Scheme needs to be able to do its work were maintained through 2011 and must continue but the economic instability that has followed on the heels of the 2008 recession and the chronic legal uncertainties facing AGS are putting that balance under constant pressure.
The slight fall in the number of beneficiary employees and total advances in 2011, taken together with the almost stable number of cases requiring advances over 300,000 euro, mean it is unlikely that AGS’ action indicators, which have been at a record high since 2009, will improve in the near future. The Scheme’s continued ability to take action has consequently required extraordinary measures by the AGS Board and has in part depended
on record recovery of advances in 2011. The partnership with administrative receivers maintained the Délégation’s average recovery rates for large amounts, despite the recession and despite changes in the law and case law that could compromise recovery of superpriority claims, which fell in percentage terms in 2011.
The number of labour cases has never been so high (over 47,000 in 2011) and this too has taken its toll of the Scheme. The worrying boom in these cases is the result of more multiple party summons being issued either in the hope that this will cause application of case law to extend the scope of the Scheme, already the most generous in Europe, or to obtain major compensation from AGS by challenging all redundancies and redundancy plans. Since employment law is unsuited to insolvency procedures, case law views such claims with an excessively lenient eye. The significant sums spent by AGS on these disputes involving unlimited claims could be more usefully employed to protect jobs by anticipating problems instead of on over-compensating loss of employment.
Délégation Unédic AGS is constantly seeking improvement and solutions for the future through its Ambition 2013 project and aims to be part of the general search for new ways of preventing company bankruptcy and of protecting jobs.
Thierry Méteyé, National Director of Délégation Unédic AGS
by acting to protect the future
Editorial
5
Bus
ines
s an
d k
ey fi
gure
s
4
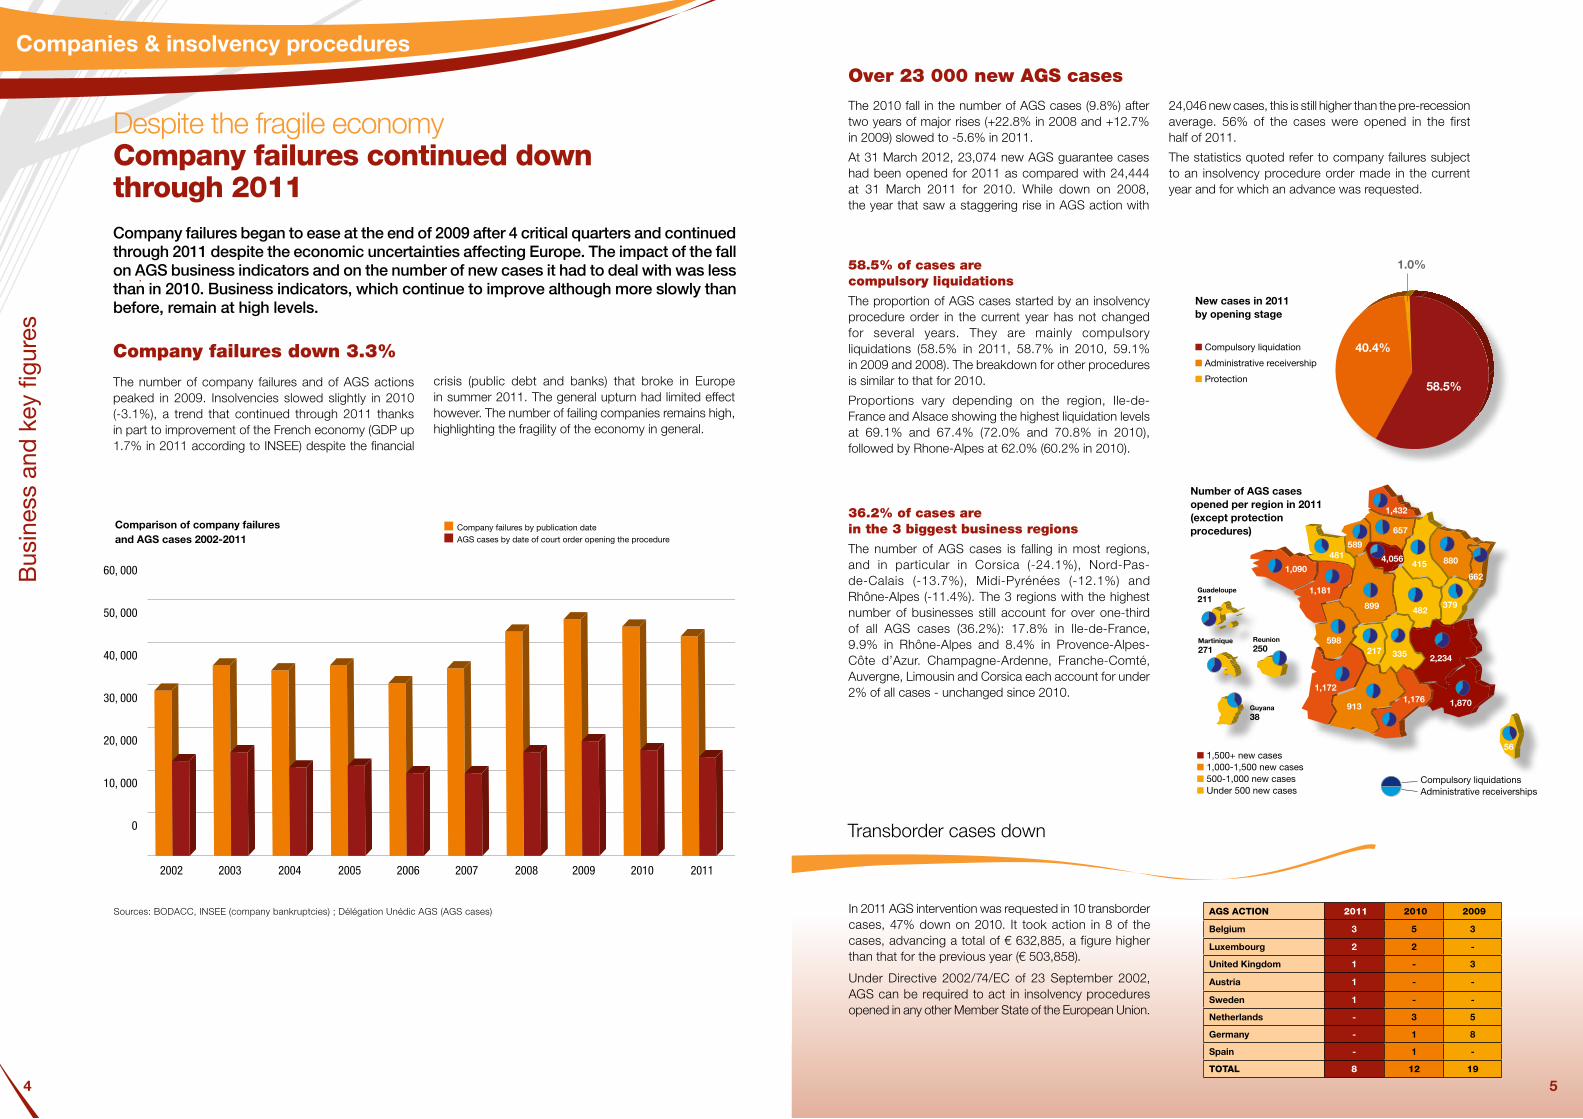
Despite the fragile economy Company failures continued down through 2011 Company failures began to ease at the end of 2009 after 4 critical quarters and continued through 2011 despite the economic uncertainties affecting Europe. The impact of the fall on AGS business indicators and on the number of new cases it had to deal with was less than in 2010. Business indicators, which continue to improve although more slowly than before, remain at high levels.
Company failures down 3.3%
The number of company failures and of AGS actions peaked in 2009. Insolvencies slowed slightly in 2010 (-3.1%), a trend that continued through 2011 thanks in part to improvement of the French economy (GDP up 1.7% in 2011 according to INSEE) despite the financial
crisis (public debt and banks) that broke in Europe in summer 2011. The general upturn had limited effect however. The number of failing companies remains high, highlighting the fragility of the economy in general.
58.5% of cases are compulsory liquidations
The proportion of AGS cases started by an insolvency procedure order in the current year has not changed for several years. They are mainly compulsory liquidations (58.5% in 2011, 58.7% in 2010, 59.1% in 2009 and 2008). The breakdown for other procedures is similar to that for 2010.
Proportions vary depending on the region, Ile-de-France and Alsace showing the highest liquidation levels at 69.1% and 67.4% (72.0% and 70.8% in 2010), followed by Rhone-Alpes at 62.0% (60.2% in 2010).
Companies & insolvency procedures
Sources: BODACC, INSEE (company bankruptcies) ; Délégation Unédic AGS (AGS cases)
■ Company failures by publication date ■ AGS cases by date of court order opening the procedure
Comparison of company failures and AGS cases 2002-2011
Over 23 000 new AGS cases
The 2010 fall in the number of AGS cases (9.8%) after two years of major rises (+22.8% in 2008 and +12.7% in 2009) slowed to -5.6% in 2011.
At 31 March 2012, 23,074 new AGS guarantee cases had been opened for 2011 as compared with 24,444 at 31 March 2011 for 2010. While down on 2008, the year that saw a staggering rise in AGS action with
24,046 new cases, this is still higher than the pre-recession average. 56% of the cases were opened in the first half of 2011.
The statistics quoted refer to company failures subject to an insolvency procedure order made in the current year and for which an advance was requested.
■ Compulsory liquidation
■ Administrative receivership
■ Protection
New cases in 2011 by opening stage
36.2% of cases are in the 3 biggest business regions
The number of AGS cases is falling in most regions, and in particular in Corsica (-24.1%), Nord-Pas-de-Calais (-13.7%), Midi-Pyrénées (-12.1%) and Rhône-Alpes (-11.4%). The 3 regions with the highest number of businesses still account for over one-third of all AGS cases (36.2%): 17.8% in Ile-de-France, 9.9% in Rhône-Alpes and 8.4% in Provence-Alpes-Côte d’Azur. Champagne-Ardenne, Franche-Comté, Auvergne, Limousin and Corsica each account for under 2% of all cases - unchanged since 2010.
Number of AGS cases opened per region in 2011 (except protection procedures)
Transborder cases down
In 2011 AGS intervention was requested in 10 transborder cases, 47% down on 2010. It took action in 8 of the cases, advancing a total of € 632,885, a figure higher than that for the previous year (€ 503,858).
Under Directive 2002/74/EC of 23 September 2002, AGS can be required to act in insolvency procedures opened in any other Member State of the European Union.
AGS ACTION 2011 2010 2009
Belgium 3 5 3
Luxembourg 2 2 -
United Kingdom 1 - 3
Austria 1 - -
Sweden 1 - -
Netherlands - 3 5
Germany - 1 8
Spain - 1 -
TOTAl 8 12 19
60 000
50 000
40 000
30 000
20 000
10 000
0
2002 2003 2004 2005 2006 2007 2008 2009 2010 2011
60 000
50 000
40 000
30 000
20 000
10 000
02002 2003 2004 2005 2006 2007 2008 2009 2010 2011
60, 000
50, 000
40, 000
30, 000
20, 000
10, 000
0
2002 2003 2004 2005 2006 2007 2008 2009 2010 2011
58.5%
40.4%
1.0%
5
3 141
2 5894 828
592
1 5602 480
974 1 97012 098
Guadeloupe211
Martinique271
Reunion250
Guyana 38
657
4,056415 880
379482899
589
1,181
1,090
598217 335 2,234
481
1,870
1,172
1,432
9131,176
662
56■ 1,500+ new cases ■ 1,000-1,500 new cases ■ 500-1,000 new cases ■ Under 500 new cases
Compulsory liquidations Administrative receiverships
7
Bus
ines
s an
d k
ey fi
gure
s
6
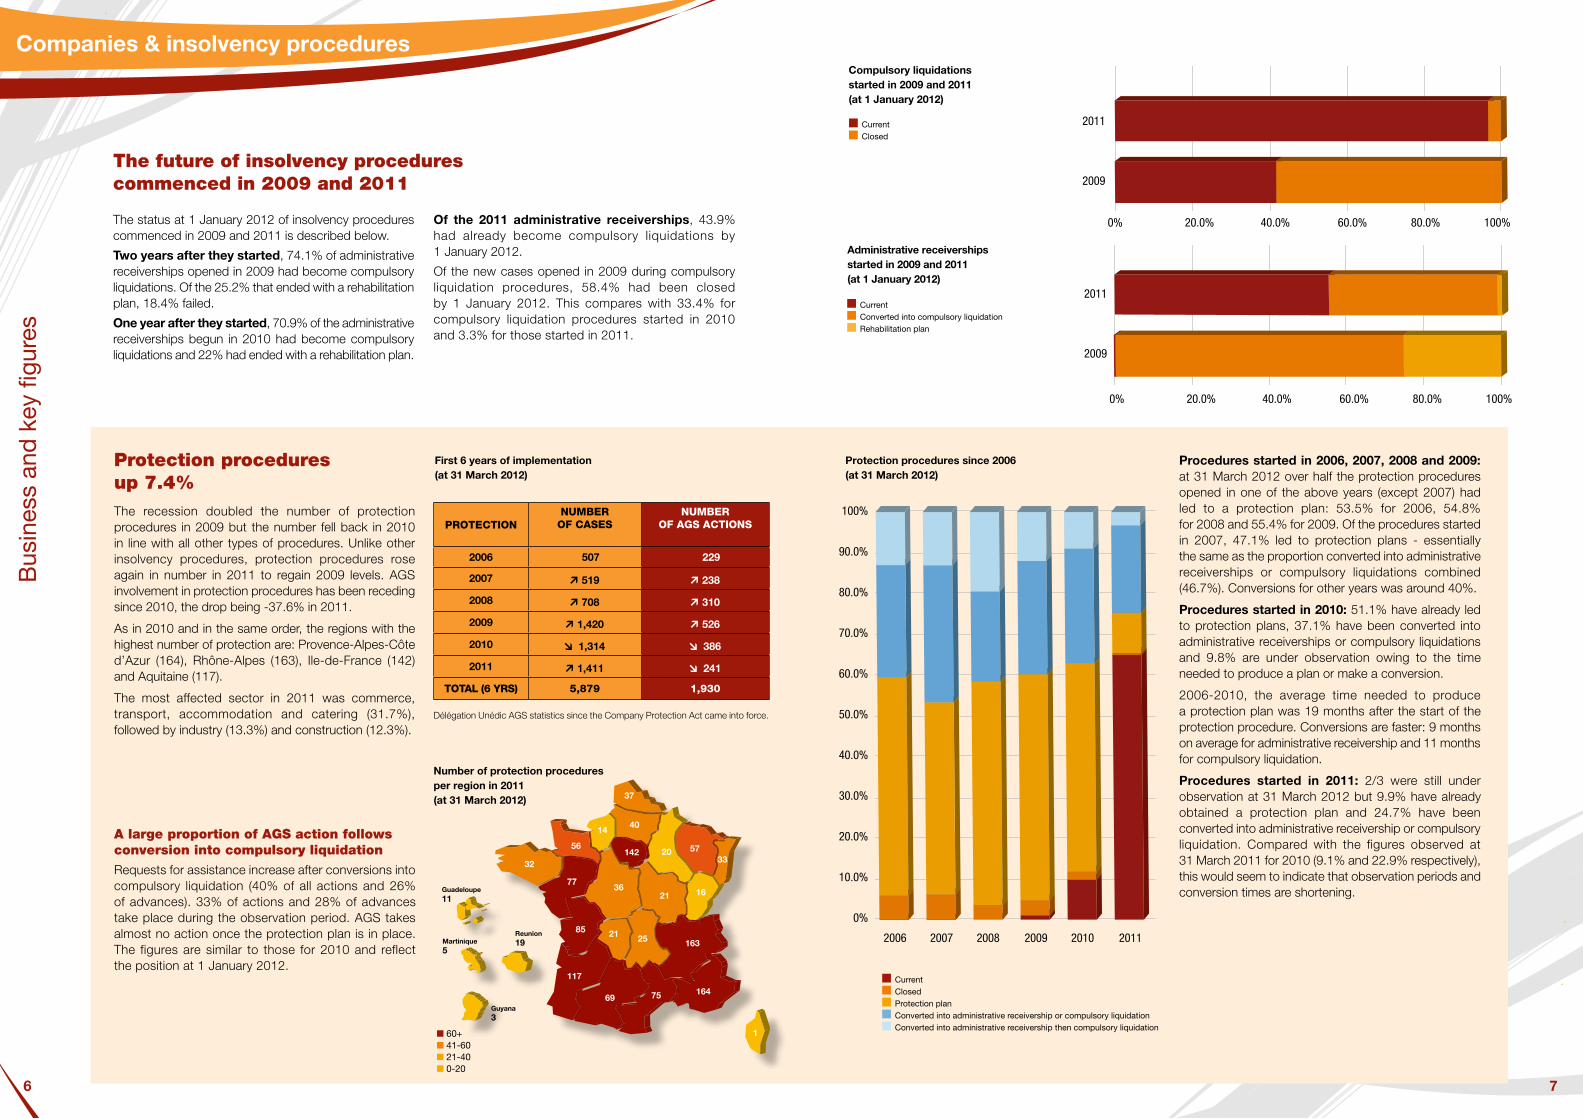
The future of insolvency procedures commenced in 2009 and 2011
The status at 1 January 2012 of insolvency procedures commenced in 2009 and 2011 is described below.
Two years after they started, 74.1% of administrative receiverships opened in 2009 had become compulsory liquidations. Of the 25.2% that ended with a rehabilitation plan, 18.4% failed.
One year after they started, 70.9% of the administrative receiverships begun in 2010 had become compulsory liquidations and 22% had ended with a rehabilitation plan.
Of the 2011 administrative receiverships, 43.9% had already become compulsory liquidations by 1 January 2012.
Of the new cases opened in 2009 during compulsory liquidation procedures, 58.4% had been closed by 1 January 2012. This compares with 33.4% for compulsory liquidation procedures started in 2010 and 3.3% for those started in 2011.
Companies & insolvency procedures
Procedures started in 2006, 2007, 2008 and 2009: at 31 March 2012 over half the protection procedures opened in one of the above years (except 2007) had led to a protection plan: 53.5% for 2006, 54.8% for 2008 and 55.4% for 2009. Of the procedures started in 2007, 47.1% led to protection plans - essentially the same as the proportion converted into administrative receiverships or compulsory liquidations combined (46.7%). Conversions for other years was around 40%.
Procedures started in 2010: 51.1% have already led to protection plans, 37.1% have been converted into administrative receiverships or compulsory liquidations and 9.8% are under observation owing to the time needed to produce a plan or make a conversion.
2006-2010, the average time needed to produce a protection plan was 19 months after the start of the protection procedure. Conversions are faster: 9 months on average for administrative receivership and 11 months for compulsory liquidation.
Procedures started in 2011: 2/3 were still under observation at 31 March 2012 but 9.9% have already obtained a protection plan and 24.7% have been converted into administrative receivership or compulsory liquidation. Compared with the figures observed at 31 March 2011 for 2010 (9.1% and 22.9% respectively), this would seem to indicate that observation periods and conversion times are shortening.
■ Current ■ Closed
Compulsory liquidations started in 2009 and 2011 (at 1 January 2012)
0 % 20 % 40 % 60 % 80 % 100 %
0 % 20 % 40 % 60 % 80 % 100 %
2011
2009
2011
2009
2011
2009
0% 20.0% 40.0% 60.0% 80.0% 100%
■ Current■ Closed ■ Protection plan ■ Converted into administrative receivership or compulsory liquidation ■ Converted into administrative receivership then compulsory liquidation
Protection procedures since 2006 (at 31 March 2012)
100 %
90 %
80 %
70 %
60 %
50 %
40 %
30 %
20 %
10 %
0 %2006 2007 2008 2009 2010 2011
100%
90.0%
80.0%
70.0%
60.0%
50.0%
40.0%
30.0%
20.0%
10.0%
0%
2006 2007 2008 2009 2010 2011
Protection procedures up 7.4% The recession doubled the number of protection procedures in 2009 but the number fell back in 2010 in line with all other types of procedures. Unlike other insolvency procedures, protection procedures rose again in number in 2011 to regain 2009 levels. AGS involvement in protection procedures has been receding since 2010, the drop being -37.6% in 2011.
As in 2010 and in the same order, the regions with the highest number of protection are: Provence-Alpes-Côte d’Azur (164), Rhône-Alpes (163), Ile-de-France (142) and Aquitaine (117).
The most affected sector in 2011 was commerce, transport, accommodation and catering (31.7%), followed by industry (13.3%) and construction (12.3%).
Number of protection procedures per region in 2011 (at 31 March 2012)
First 6 years of implementation (at 31 March 2012)
PROTECTIONNUMBER
OF CASESNUMBER
OF AGS ACTIONS
2006 507 229
2007 519 238
2008 708 310
2009 1,420 526
2010 1,314 386
2011 1,411 241
TOTAl (6 YRS) 5,879 1,930
A large proportion of AGS action follows conversion into compulsory liquidation
Requests for assistance increase after conversions into compulsory liquidation (40% of all actions and 26% of advances). 33% of actions and 28% of advances take place during the observation period. AGS takes almost no action once the protection plan is in place. The figures are similar to those for 2010 and reflect the position at 1 January 2012.
Délégation Unédic AGS statistics since the Company Protection Act came into force.
■ Current ■ Converted into compulsory liquidation ■ Rehabilitation plan
Administrative receiverships started in 2009 and 2011 (at 1 January 2012)
0 % 20 % 40 % 60 % 80 % 100 %
0 % 20 % 40 % 60 % 80 % 100 %
2011
2009
2011
2009
2011
2009
0% 20.0% 40.0% 60.0% 80.0% 100%
■ 60+■ 41-60■ 21-40■ 0-20
3 141
2 5894 8281 560
2 480
974 1 97012 098
Guadeloupe11
Martinique5
Reunion19
Guyana3
40
142 20 57
162136
14
77
32
85 21 25 163
56
164
117
37
69 75
33
1
9
Bus
ines
s an
d k
ey fi
gure
s
8
Companies & insolvency procedures
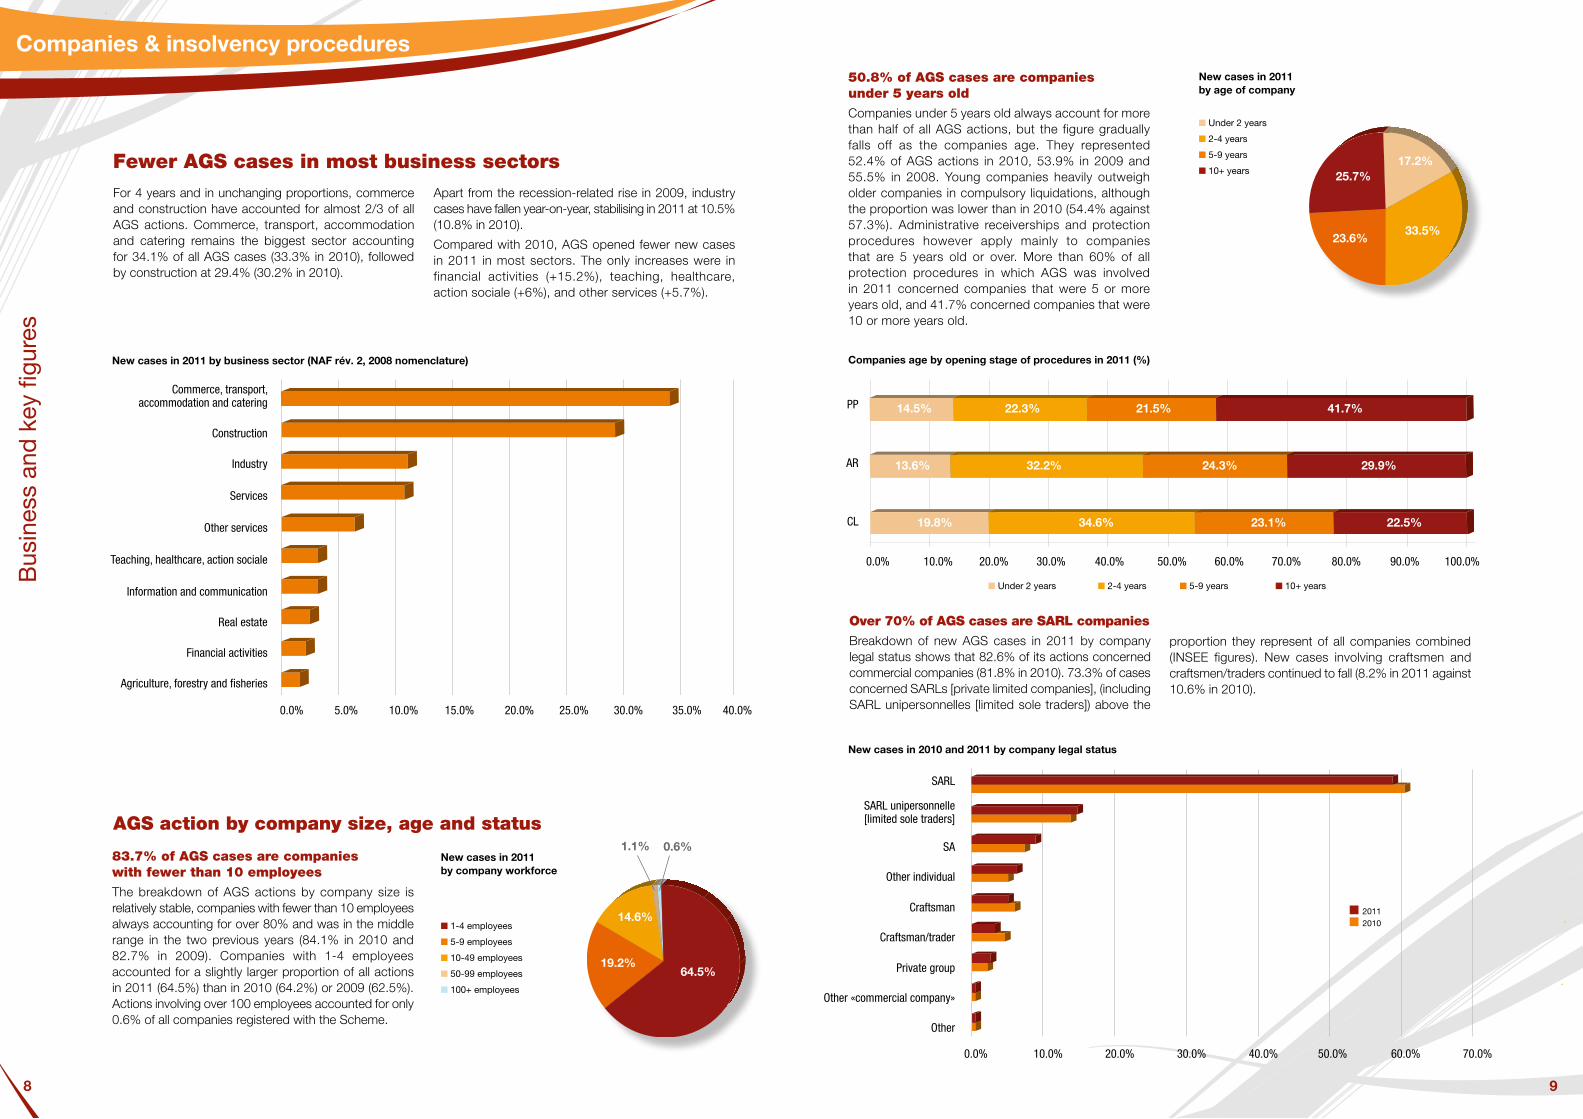
Fewer AGS cases in most business sectorsFor 4 years and in unchanging proportions, commerce and construction have accounted for almost 2/3 of all AGS actions. Commerce, transport, accommodation and catering remains the biggest sector accounting for 34.1% of all AGS cases (33.3% in 2010), followed by construction at 29.4% (30.2% in 2010).
Apart from the recession-related rise in 2009, industry cases have fallen year-on-year, stabilising in 2011 at 10.5% (10.8% in 2010).
Compared with 2010, AGS opened fewer new cases in 2011 in most sectors. The only increases were in financial activities (+15.2%), teaching, healthcare, action sociale (+6%), and other services (+5.7%).
New cases in 2011 by business sector (NAF rév. 2, 2008 nomenclature)
0 % 5 % 10 % 15 % 20 % 25 % 30 % 35 %
Commerce, transports, hébergement et restauration
Construction
Industrie
Activités de services
Autres activités de services
Enseignement, santé, action sociale
Information et communication
Activités immobilières
Activités �nancières
Agriculture, sylviculture et pêche
AGS action by company size, age and status
83.7% of AGS cases are companies with fewer than 10 employees
The breakdown of AGS actions by company size is relatively stable, companies with fewer than 10 employees always accounting for over 80% and was in the middle range in the two previous years (84.1% in 2010 and 82.7% in 2009). Companies with 1-4 employees accounted for a slightly larger proportion of all actions in 2011 (64.5%) than in 2010 (64.2%) or 2009 (62.5%). Actions involving over 100 employees accounted for only 0.6% of all companies registered with the Scheme.
■ 1-4 employees
■ 5-9 employees
■ 10-49 employees
■ 50-99 employees
■ 100+ employees
New cases in 2011 by company workforce
50.8% of AGS cases are companies under 5 years old
Companies under 5 years old always account for more than half of all AGS actions, but the figure gradually falls off as the companies age. They represented 52.4% of AGS actions in 2010, 53.9% in 2009 and 55.5% in 2008. Young companies heavily outweigh older companies in compulsory liquidations, although the proportion was lower than in 2010 (54.4% against 57.3%). Administrative receiverships and protection procedures however apply mainly to companies that are 5 years old or over. More than 60% of all protection procedures in which AGS was involved in 2011 concerned companies that were 5 or more years old, and 41.7% concerned companies that were 10 or more years old.
■ Under 2 years
■ 2-4 years
■ 5-9 years
■ 10+ years
New cases in 2011 by age of company
Companies age by opening stage of procedures in 2011 (%)
0 % 10 % 20 % 30 % 40 % 50 % 60 % 70 % 80 % 90 % 100 %
SV
RJ
LJ
Over 70% of AGS cases are SARL companies
Breakdown of new AGS cases in 2011 by company legal status shows that 82.6% of its actions concerned commercial companies (81.8% in 2010). 73.3% of cases concerned SARLs [private limited companies], (including SARL unipersonnelles [limited sole traders]) above the
proportion they represent of all companies combined (INSEE figures). New cases involving craftsmen and craftsmen/traders continued to fall (8.2% in 2011 against 10.6% in 2010).
New cases in 2010 and 2011 by company legal status
0,0% 10,0% 20,0% 30,0% 40,0% 50,0% 60,0% 70,0%
Autres
Autres "Société commerciale"
Groupement de droit privé
Artisan-Commerçant
Artisan
Autre personne physique
SA
SARL unipersonnelle
SARL
Commerce, transport, accommodation and catering
Construction
Industry
Services
Other services
Teaching, healthcare, action sociale
Information and communication
Real estate
Financial activities
Agriculture, forestry and fisheries
0.0% 5.0% 10.0% 15.0% 20.0% 25.0% 30.0% 35.0% 40.0%
64.5%19.2%
14.6%
0.6%1.1%
33.5%23.6%
25.7%17.2%
0.0% 10.0% 20.0% 30.0% 40.0% 50.0% 60.0% 70.0% 80.0% 90.0% 100.0%
SARL
SARL unipersonnelle [limited sole traders]
SA
Other individual
Craftsman
Craftsman/trader
Private group
Other «commercial company»
Other
0.0% 10.0% 20.0% 30.0% 40.0% 50.0% 60.0% 70.0%
PP
AR
CL
■ Under 2 years ■ 2-4 years ■ 5-9 years ■ 10+ years
■ 2011 ■ 2010
14.5% 22.3% 21.5% 41.7%
13.6% 32.2% 24.3% 29.9%
19.8% 34.6% 23.1% 22.5%

11
Bus
ines
s an
d k
ey fi
gure
s
10
that have major economic and social impact, and also in administrative receiverships and protection procedures involving over 50 employees. In so doing it aims to protect jobs and satisfy creditors as far as possible, while ensuring the success of the solution decided.
AGS was appointed inspector of 264 of all new cases opened in 2011, 106 of which involved at least 100 employees and 158 50-99 employees.For several years AGS has been automatically asking the commercial courts to appoint it as inspector in insolvency procedures involving over 100 employees
Companies & insolvency procedures
Decline in cases involving over 100 employees
These represent under 1% of new AGS cases but pose a major financial challenge. The number of such cases went up significantly by 80% in 2008 and 10% in 2009, but fell back by 25% in 2010 and again, but to a lesser extent, in 2011 when 155 new cases were opened (-8.3% on 2010). This was caused by the 33.9% decrease in the 1st quarter of 2011 as compared with the first quarter of 2010. Over the other 3 quarters of 2011, the number of new cases involving over 100 employees rose against the same quarters the previous year: +2.5% Q2, +3% Q3 and +7.5% Q4.
As in previous years, companies with 100-149 employees accounted for the largest proportion of cases (50.3% against 50.9% in 2010). In numeric terms they dropped by a lower than average 9.3% however.
Cases involving 100+ employees fell for companies with 150-199 employees (23 in 2011 against 32 in 2010) and for companies with 300-499 employees (14 in 2011 against 18 in 2010). The figure for companies with 500+ employees remained almost unchanged (14 in 2011 against 13 in 2010) but increased for companies with 200-299 employees (26 in 2011 against 20 in 2010).
Cases involving 100+ employees by company workforce
0
10
20
30
40
50
60
70
80
90
100
100-149 150-199 200-299 300-499 500 et plus
Over 1/3 of cases involving 100+ employees are in Ile-de-France
As in previous years, Ile-de-France was the largest region in terms of new AGS cases involving companies with over 100 employees (53 new cases in 2011, up 15.2% on 2010). The reason for the region’s predominance is the concentration of business within it and the fact that many of the companies involved in liquidation procedures are registered there even if their other establishments may be located in other regions. Ile-de-France is followed by Rhône-Alpes (15 new cases against 16 in 2010) and the Loire region (12 new cases against 6 in 2010).
The number of cases involving over 100 employees fell in almost all sectors, the drop being particularly steep in the industrial sector (-12.7%) where the actual number of employees concerned was for the first time lower than in the services sector. Industry nevertheless remains the biggest sector in which AGS takes action (31% of cases in 2011 compared with 32.5% in 2010).
Cases involving over 100 employees by business sector in 2011 (number of companies and employees)
0,0% 5,0% 10,0% 15,0% 20,0% 25,0% 30,0% 35,0%
Agriculture
Activités �nancières
Autres activités de services
Information et communication
Construction
Enseignement, santé, action sociale
Commerce, transports, hébergement et restauration
Activités de services
Industrie
Few compulsory liquidations
Cases involving over 100 employees display a number of distinctive features. In 2011 71% began with administrative receivership and only 12.3% with compulsory liquidation. This compares with all cases combined (irrespective of company workforce) where compulsory liquidations account for over half of new cases.The large proportion of administrative receiverships
in cases involving over 100 employees is primarily attributable to the age of the companies concerned, 60% of which have been in business for over 10 years. A large proportion (44%) of new 2011 cases involving over 100 employees began with administrative receivership or protection procedures before being converted into compulsory liquidations.
The second biggest sector was services (23.2% of all cases compared with 23.1% in 2010), followed by commerce, transport, accommodation and catering (16.8% against 17.2% in 2010). The breakdown by sector of cases involving over 100 employees overall showed no significant change over 2010.
100
90
80
70
60
50
40
30
20
10
0100-149 150-199 200-299 300-499 500+
■ 2009 ■ 2010 ■ 2011
Number of cases involving 100+ employees by region in 2011
Industry
Services
Commerce, transport,accommodation and catering
Teaching, healthcare, action sociale
Construction
Information and communication
Other services
Financial activities
Agriculture
0.0% 5.0% 10.0% 15.0% 20.0% 25.0% 30.0% 35.0%
■ Number of companies ■ Number of employees
11
AGS is appointed inspector in 68% of cases involving over 100 employees
Significant reduction in the number of industry employees
2 589
4 828
2 480
974 1 970 12 098
Guadeloupe
Martinique Reunion
Guyana
■ 15+ cases ■ 10-14 cases■ 5-9 cases ■ Under 5 cases
13
Bus
ines
s an
d k
ey fi
gure
s
12
Advances
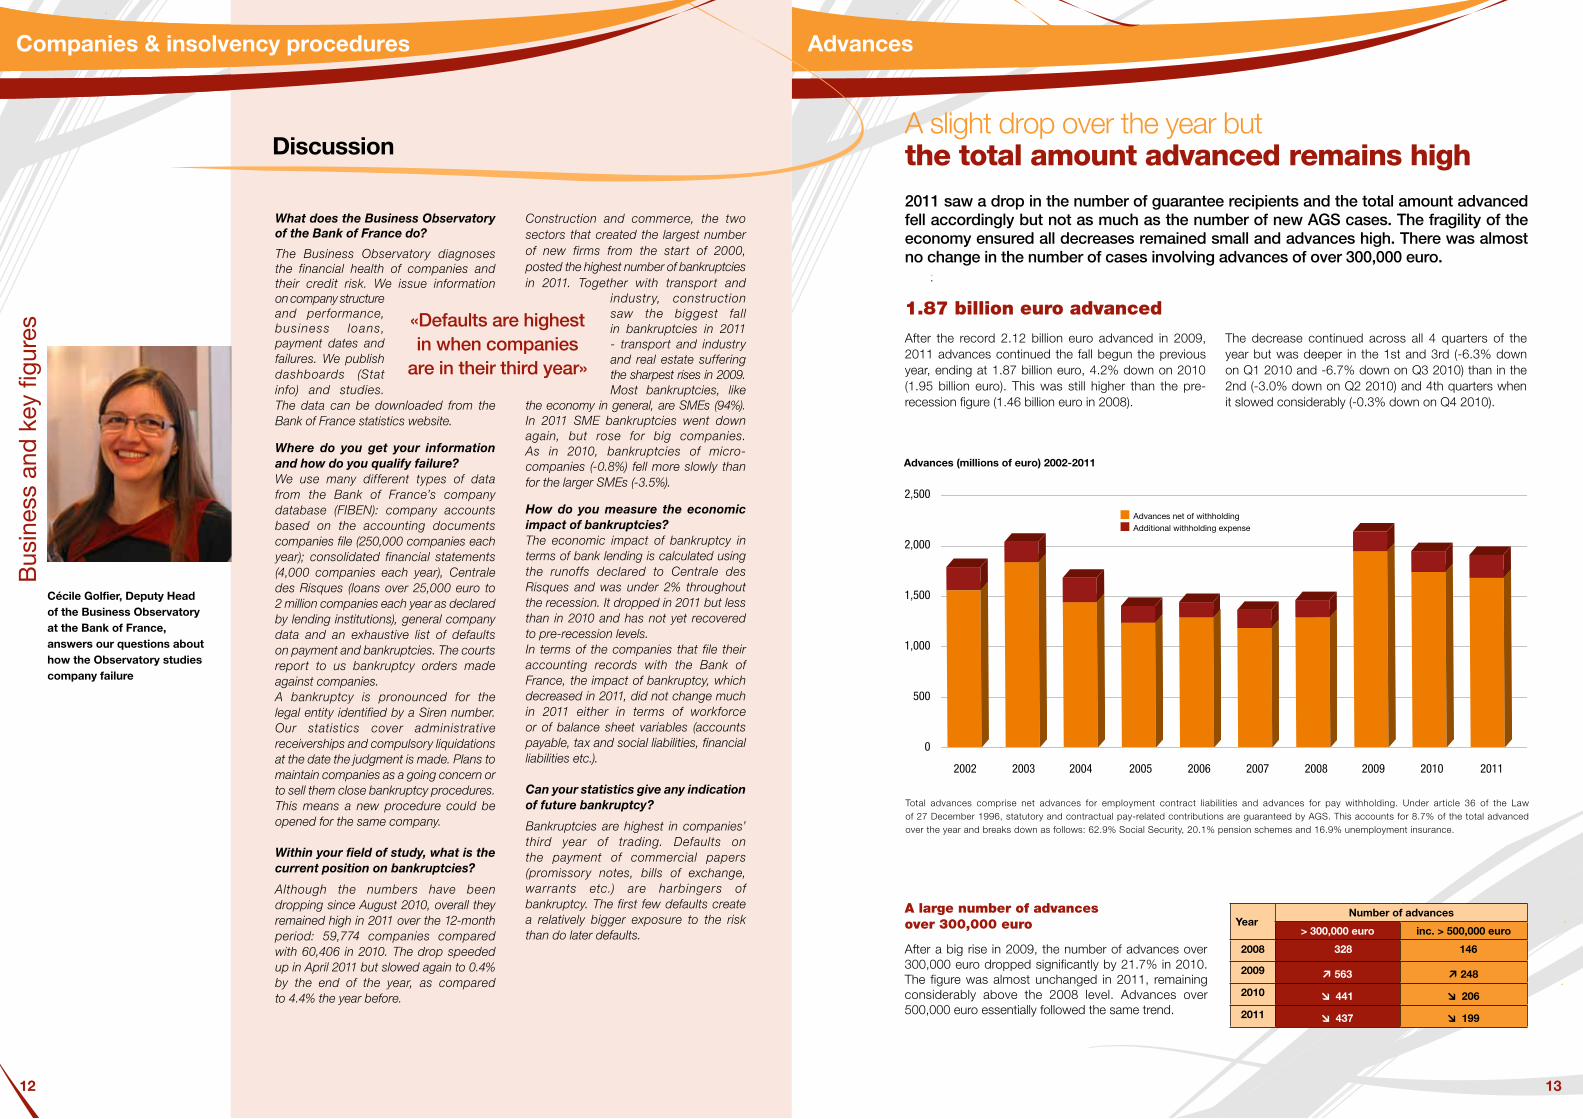
A slight drop over the year but the total amount advanced remains high 2011 saw a drop in the number of guarantee recipients and the total amount advanced fell accordingly but not as much as the number of new AGS cases. The fragility of the economy ensured all decreases remained small and advances high. There was almost no change in the number of cases involving advances of over 300,000 euro.
1.87 billion euro advanced
After the record 2.12 billion euro advanced in 2009, 2011 advances continued the fall begun the previous year, ending at 1.87 billion euro, 4.2% down on 2010 (1.95 billion euro). This was still higher than the pre-recession figure (1.46 billion euro in 2008).
The decrease continued across all 4 quarters of the year but was deeper in the 1st and 3rd (-6.3% down on Q1 2010 and -6.7% down on Q3 2010) than in the 2nd (-3.0% down on Q2 2010) and 4th quarters when it slowed considerably (-0.3% down on Q4 2010).
Total advances comprise net advances for employment contract liabilities and advances for pay withholding. Under article 36 of the Law of 27 December 1996, statutory and contractual pay-related contributions are guaranteed by AGS. This accounts for 8.7% of the total advanced over the year and breaks down as follows: 62.9% Social Security, 20.1% pension schemes and 16.9% unemployment insurance.
■ Advances net of withholding ■ Additional withholding expense
Advances (millions of euro) 2002-2011
2 500
2 000
1 500
1 000
500
0
2002 2003 2004 2005 2006 2007 2008 2009 2010 2011
2 500
2 000
1 500
1 000
500
02002 2003 2004 2005 2006 2007 2008 2009 2010 2011
YearNumber of advances
> 300,000 euro inc. > 500,000 euro
2008 328 146
2009 563 248
2010 441 206
2011 437 199
A large number of advances over 300,000 euro
After a big rise in 2009, the number of advances over 300,000 euro dropped significantly by 21.7% in 2010. The figure was almost unchanged in 2011, remaining considerably above the 2008 level. Advances over 500,000 euro essentially followed the same trend.
What does the Business Observatory of the Bank of France do?
The Business Observatory diagnoses the financial health of companies and their credit risk. We issue information on company structure and performance, business loans, payment dates and failures. We publish dashboards (Stat info) and studies. The data can be downloaded from the Bank of France statistics website.
Where do you get your information and how do you qualify failure?We use many different types of data from the Bank of France’s company database (FIBEN): company accounts based on the accounting documents companies file (250,000 companies each year); consolidated financial statements (4,000 companies each year), Centrale des Risques (loans over 25,000 euro to 2 million companies each year as declared by lending institutions), general company data and an exhaustive list of defaults on payment and bankruptcies. The courts report to us bankruptcy orders made against companies.A bankruptcy is pronounced for the legal entity identified by a Siren number. Our statistics cover administrative receiverships and compulsory liquidations at the date the judgment is made. Plans to maintain companies as a going concern or to sell them close bankruptcy procedures. This means a new procedure could be opened for the same company.
Within your field of study, what is the current position on bankruptcies?
Although the numbers have been dropping since August 2010, overall they remained high in 2011 over the 12-month period: 59,774 companies compared with 60,406 in 2010. The drop speeded up in April 2011 but slowed again to 0.4% by the end of the year, as compared to 4.4% the year before.
Construction and commerce, the two sectors that created the largest number of new firms from the start of 2000, posted the highest number of bankruptcies in 2011. Together with transport and
industry, construction saw the biggest fall in bankruptcies in 2011 - transport and industry and real estate suffering the sharpest rises in 2009. Most bankruptcies, like
the economy in general, are SMEs (94%). In 2011 SME bankruptcies went down again, but rose for big companies. As in 2010, bankruptcies of micro-companies (-0.8%) fell more slowly than for the larger SMEs (-3.5%).
How do you measure the economic impact of bankruptcies?The economic impact of bankruptcy in terms of bank lending is calculated using the runoffs declared to Centrale des Risques and was under 2% throughout the recession. It dropped in 2011 but less than in 2010 and has not yet recovered to pre-recession levels.In terms of the companies that file their accounting records with the Bank of France, the impact of bankruptcy, which decreased in 2011, did not change much in 2011 either in terms of workforce or of balance sheet variables (accounts payable, tax and social liabilities, financial liabilities etc.).
Can your statistics give any indication of future bankruptcy?
Bankruptcies are highest in companies’ third year of trading. Defaults on the payment of commercial papers (promissory notes, bills of exchange, warrants etc.) are harbingers of bankruptcy. The first few defaults create a relatively bigger exposure to the risk than do later defaults.
Discussion
Cécile Golfier, Deputy Head of the Business Observatory at the Bank of France, answers our questions about how the Observatory studies company failure
2,500
2,000
1,500
1,000
500
0
2002 2003 2004 2005 2006 2007 2008 2009 2010 2011
«Defaults are highest in when companies
are in their third year»
Companies & insolvency procedures
15
Bus
ines
s an
d k
ey fi
gure
s
14
■ 2011■ 2010
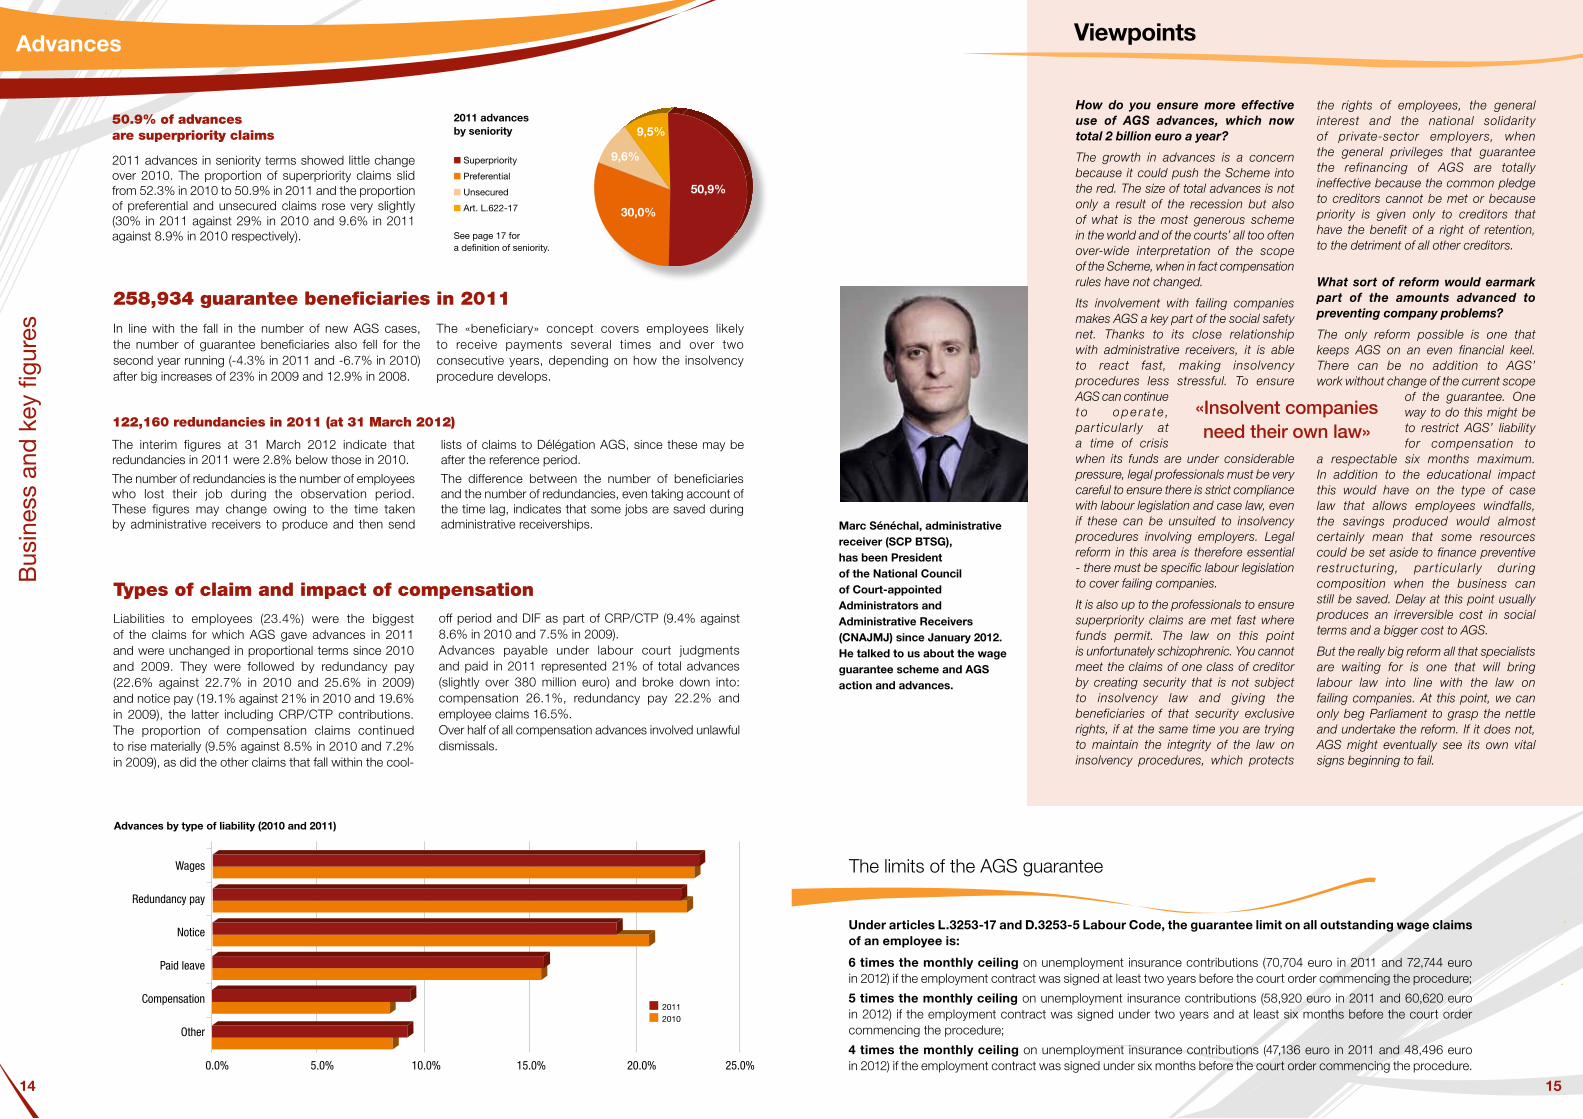
50.9% of advances are superpriority claims
2011 advances in seniority terms showed little change over 2010. The proportion of superpriority claims slid from 52.3% in 2010 to 50.9% in 2011 and the proportion of preferential and unsecured claims rose very slightly (30% in 2011 against 29% in 2010 and 9.6% in 2011 against 8.9% in 2010 respectively).
■ Superpriority
■ Preferential
■ Unsecured
■ Art. L.622-17
2011 advances by seniority
258,934 guarantee beneficiaries in 2011
In line with the fall in the number of new AGS cases, the number of guarantee beneficiaries also fell for the second year running (-4.3% in 2011 and -6.7% in 2010) after big increases of 23% in 2009 and 12.9% in 2008.
The «beneficiary» concept covers employees likely to receive payments several times and over two consecutive years, depending on how the insolvency procedure develops.
122,160 redundancies in 2011 (at 31 March 2012)
The interim figures at 31 March 2012 indicate that redundancies in 2011 were 2.8% below those in 2010.
The number of redundancies is the number of employees who lost their job during the observation period. These figures may change owing to the time taken by administrative receivers to produce and then send
lists of claims to Délégation AGS, since these may be after the reference period.
The difference between the number of beneficiaries and the number of redundancies, even taking account of the time lag, indicates that some jobs are saved during administrative receiverships.
Types of claim and impact of compensationLiabilities to employees (23.4%) were the biggest of the claims for which AGS gave advances in 2011 and were unchanged in proportional terms since 2010 and 2009. They were followed by redundancy pay (22.6% against 22.7% in 2010 and 25.6% in 2009) and notice pay (19.1% against 21% in 2010 and 19.6% in 2009), the latter including CRP/CTP contributions. The proportion of compensation claims continued to rise materially (9.5% against 8.5% in 2010 and 7.2% in 2009), as did the other claims that fall within the cool-
off period and DIF as part of CRP/CTP (9.4% against 8.6% in 2010 and 7.5% in 2009).Advances payable under labour court judgments and paid in 2011 represented 21% of total advances (slightly over 380 million euro) and broke down into: compensation 26.1%, redundancy pay 22.2% and employee claims 16.5%.Over half of all compensation advances involved unlawful dismissals.
How do you ensure more effective use of AGS advances, which now total 2 billion euro a year?
The growth in advances is a concern because it could push the Scheme into the red. The size of total advances is not only a result of the recession but also of what is the most generous scheme in the world and of the courts’ all too often over-wide interpretation of the scope of the Scheme, when in fact compensation rules have not changed.
Its involvement with failing companies makes AGS a key part of the social safety net. Thanks to its close relationship with administrative receivers, it is able to react fast, making insolvency procedures less stressful. To ensure AGS can continue to o p e r a te , par ticularly at a time of crisis when its funds are under considerable pressure, legal professionals must be very careful to ensure there is strict compliance with labour legislation and case law, even if these can be unsuited to insolvency procedures involving employers. Legal reform in this area is therefore essential - there must be specific labour legislation to cover failing companies.
It is also up to the professionals to ensure superpriority claims are met fast where funds permit. The law on this point is unfortunately schizophrenic. You cannot meet the claims of one class of creditor by creating security that is not subject to insolvency law and giving the beneficiaries of that security exclusive rights, if at the same time you are trying to maintain the integrity of the law on insolvency procedures, which protects
the rights of employees, the general interest and the national solidarity of private-sector employers, when the general privileges that guarantee the refinancing of AGS are totally ineffective because the common pledge to creditors cannot be met or because priority is given only to creditors that have the benefit of a right of retention, to the detriment of all other creditors.
What sort of reform would earmark part of the amounts advanced to preventing company problems?
The only reform possible is one that keeps AGS on an even financial keel. There can be no addition to AGS’ work without change of the current scope
of the guarantee. One way to do this might be to restrict AGS’ liability for compensation to
a respectable six months maximum. In addition to the educational impact this would have on the type of case law that allows employees windfalls, the savings produced would almost certainly mean that some resources could be set aside to finance preventive restructuring, par ticularly during composition when the business can still be saved. Delay at this point usually produces an irreversible cost in social terms and a bigger cost to AGS.
But the really big reform all that specialists are waiting for is one that will bring labour law into line with the law on failing companies. At this point, we can only beg Parliament to grasp the nettle and undertake the reform. If it does not, AGS might eventually see its own vital signs beginning to fail.
Viewpoints
Marc Sénéchal, administrative receiver (SCP BTSG), has been President of the National Council of Court-appointed Administrators and Administrative Receivers (CNAJMJ) since January 2012. He talked to us about the wage guarantee scheme and AGS action and advances.
The limits of the AGS guarantee
Under articles L.3253-17 and D.3253-5 Labour Code, the guarantee limit on all outstanding wage claims of an employee is:
6 times the monthly ceiling on unemployment insurance contributions (70,704 euro in 2011 and 72,744 euro in 2012) if the employment contract was signed at least two years before the court order commencing the procedure;
5 times the monthly ceiling on unemployment insurance contributions (58,920 euro in 2011 and 60,620 euro in 2012) if the employment contract was signed under two years and at least six months before the court order commencing the procedure;
4 times the monthly ceiling on unemployment insurance contributions (47,136 euro in 2011 and 48,496 euro in 2012) if the employment contract was signed under six months before the court order commencing the procedure.
Advances by type of liability (2010 and 2011)
Indemnités de licenciement
Salaires
Préavis
Congés payés
Dommages-intérêts
Autres
0,0% 5,0% 10,0% 15,0% 20,0% 25,0%
Advances
50,9%
30,0%
9,5%
9,6%
See page 17 for a definition of seniority.
Wages
Redundancy pay
Notice
Paid leave
Compensation
Other
0.0% 5.0% 10.0% 15.0% 20.0% 25.0%
«Insolvent companies need their own law»
17
Bus
ines
s an
d k
ey fi
gure
s
16
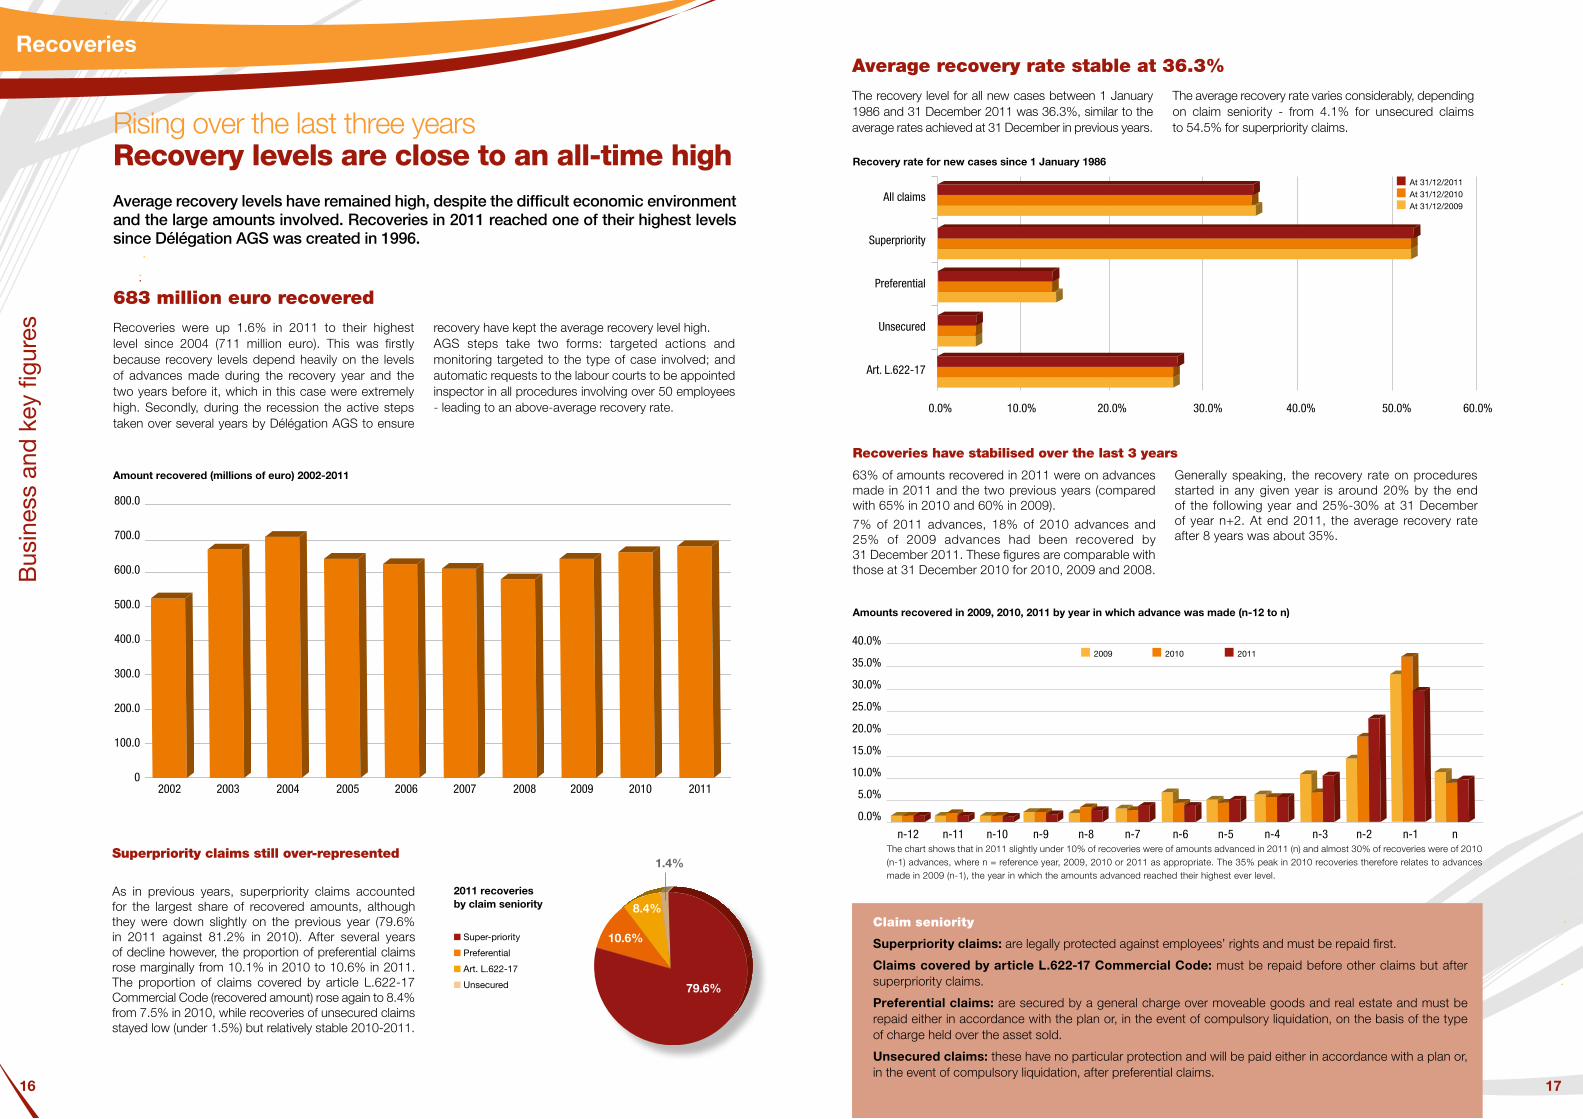
Claim seniority
Superpriority claims: are legally protected against employees’ rights and must be repaid first.
Claims covered by article L.622-17 Commercial Code: must be repaid before other claims but after superpriority claims.
Preferential claims: are secured by a general charge over moveable goods and real estate and must be repaid either in accordance with the plan or, in the event of compulsory liquidation, on the basis of the type of charge held over the asset sold.
Unsecured claims: these have no particular protection and will be paid either in accordance with a plan or, in the event of compulsory liquidation, after preferential claims.
Rising over the last three years Recovery levels are close to an all-time high Average recovery levels have remained high, despite the difficult economic environment and the large amounts involved. Recoveries in 2011 reached one of their highest levels since Délégation AGS was created in 1996.
683 million euro recovered
Recoveries were up 1.6% in 2011 to their highest level since 2004 (711 million euro). This was firstly because recovery levels depend heavily on the levels of advances made during the recovery year and the two years before it, which in this case were extremely high. Secondly, during the recession the active steps taken over several years by Délégation AGS to ensure
recovery have kept the average recovery level high.AGS steps take two forms: targeted actions and monitoring targeted to the type of case involved; and automatic requests to the labour courts to be appointed inspector in all procedures involving over 50 employees - leading to an above-average recovery rate.
Recoveries
Amount recovered (millions of euro) 2002-2011
600,0
700,0
800,0
500,0
400,0
300,0
200,0
100,0
02002 2003 2004 2005 2006 2007 2008 2009 2010 2011
600,0
700,0
800,0
500,0
400,0
300,0
200,0
100,0
0
2002 2003 2004 2005 2006 2007 2008 2009 2010 2011
Superpriority claims still over-represented
As in previous years, superpriority claims accounted for the largest share of recovered amounts, although they were down slightly on the previous year (79.6% in 2011 against 81.2% in 2010). After several years of decline however, the proportion of preferential claims rose marginally from 10.1% in 2010 to 10.6% in 2011. The proportion of claims covered by article L.622-17 Commercial Code (recovered amount) rose again to 8.4% from 7.5% in 2010, while recoveries of unsecured claims stayed low (under 1.5%) but relatively stable 2010-2011.
■ Super-priority
■ Preferential
■ Art. L.622-17
■ Unsecured
2011 recoveries by claim seniority
Average recovery rate stable at 36.3%
The recovery level for all new cases between 1 January 1986 and 31 December 2011 was 36.3%, similar to the average rates achieved at 31 December in previous years.
The average recovery rate varies considerably, depending on claim seniority - from 4.1% for unsecured claims to 54.5% for superpriority claims.
Recovery rate for new cases since 1 January 1986
Toutes créances
Superprivilège
Privilège
Chirographaire
Art.L622-17
0,0% 10,0% 20,0% 30,0% 40,0% 50,0% 60,0%
Recoveries have stabilised over the last 3 years
63% of amounts recovered in 2011 were on advances made in 2011 and the two previous years (compared with 65% in 2010 and 60% in 2009).
7% of 2011 advances, 18% of 2010 advances and 25% of 2009 advances had been recovered by 31 December 2011. These figures are comparable with those at 31 December 2010 for 2010, 2009 and 2008.
Generally speaking, the recovery rate on procedures started in any given year is around 20% by the end of the following year and 25%-30% at 31 December of year n+2. At end 2011, the average recovery rate after 8 years was about 35%.
The chart shows that in 2011 slightly under 10% of recoveries were of amounts advanced in 2011 (n) and almost 30% of recoveries were of 2010 (n-1) advances, where n = reference year, 2009, 2010 or 2011 as appropriate. The 35% peak in 2010 recoveries therefore relates to advances made in 2009 (n-1), the year in which the amounts advanced reached their highest ever level.
30,0%
35,0%
25,0%
20,0%
15,0%
10,0%
5,0%
0,0%
n-12 n-11 n-10 n-9 n-8 n-7 n-6 n-5 n-4 n-3 n-2 n-1 n
30,0%
35,0%
40,0%
25,0%
20,0%
15,0%
10,0%
5,0%
0,0%n-12 n-11 n-10 n-9 n-8 n-7 n-6 n-5 n-4 n-3 n-2 n-1 n
■ 2009 ■ 2010 ■ 2011
800.0
700.0
600.0
500.0
400.0
300.0
200.0
100.0
02002 2003 2004 2005 2006 2007 2008 2009 2010 2011
79.6%
10.6%
8.4%
1.4%
■ At 31/12/2011■ At 31/12/2010■ At 31/12/2009
All claims
Superpriority
Preferential
Unsecured
Art. L.622-17
0.0% 10.0% 20.0% 30.0% 40.0% 50.0% 60.0%
40.0%
35.0%
30.0%
25.0%
20.0%
15.0%
10.0%
5.0%
0.0%
n-12 n-11 n-10 n-9 n-8 n-7 n-6 n-5 n-4 n-3 n-2 n-1 n
Amounts recovered in 2009, 2010, 2011 by year in which advance was made (n-12 to n)
19
Bus
ines
s an
d k
ey fi
gure
s
18
Contribution amount (millions of euro) and rates 2002-2011
1200,0
1400,0
1600,0
1000,0
800,0
600,0
400,0
200,0
02002 2003 2004 2005 2006 2007 2008 2009 2010 2011
600,0
700,0
800,0
500,0
400,0
300,0
200,0
100,0
0
2002 2003 2004 2005 2006 2007 2008 2009 2010 2011
1800,0
2000,02000.0
1800.0
1600.0
1400.0
1200.0
1000.0
800.0
600.0
400.0
200.0
0
2002 2003 2004 2005 2006 2007 2008 2009 2010 2011
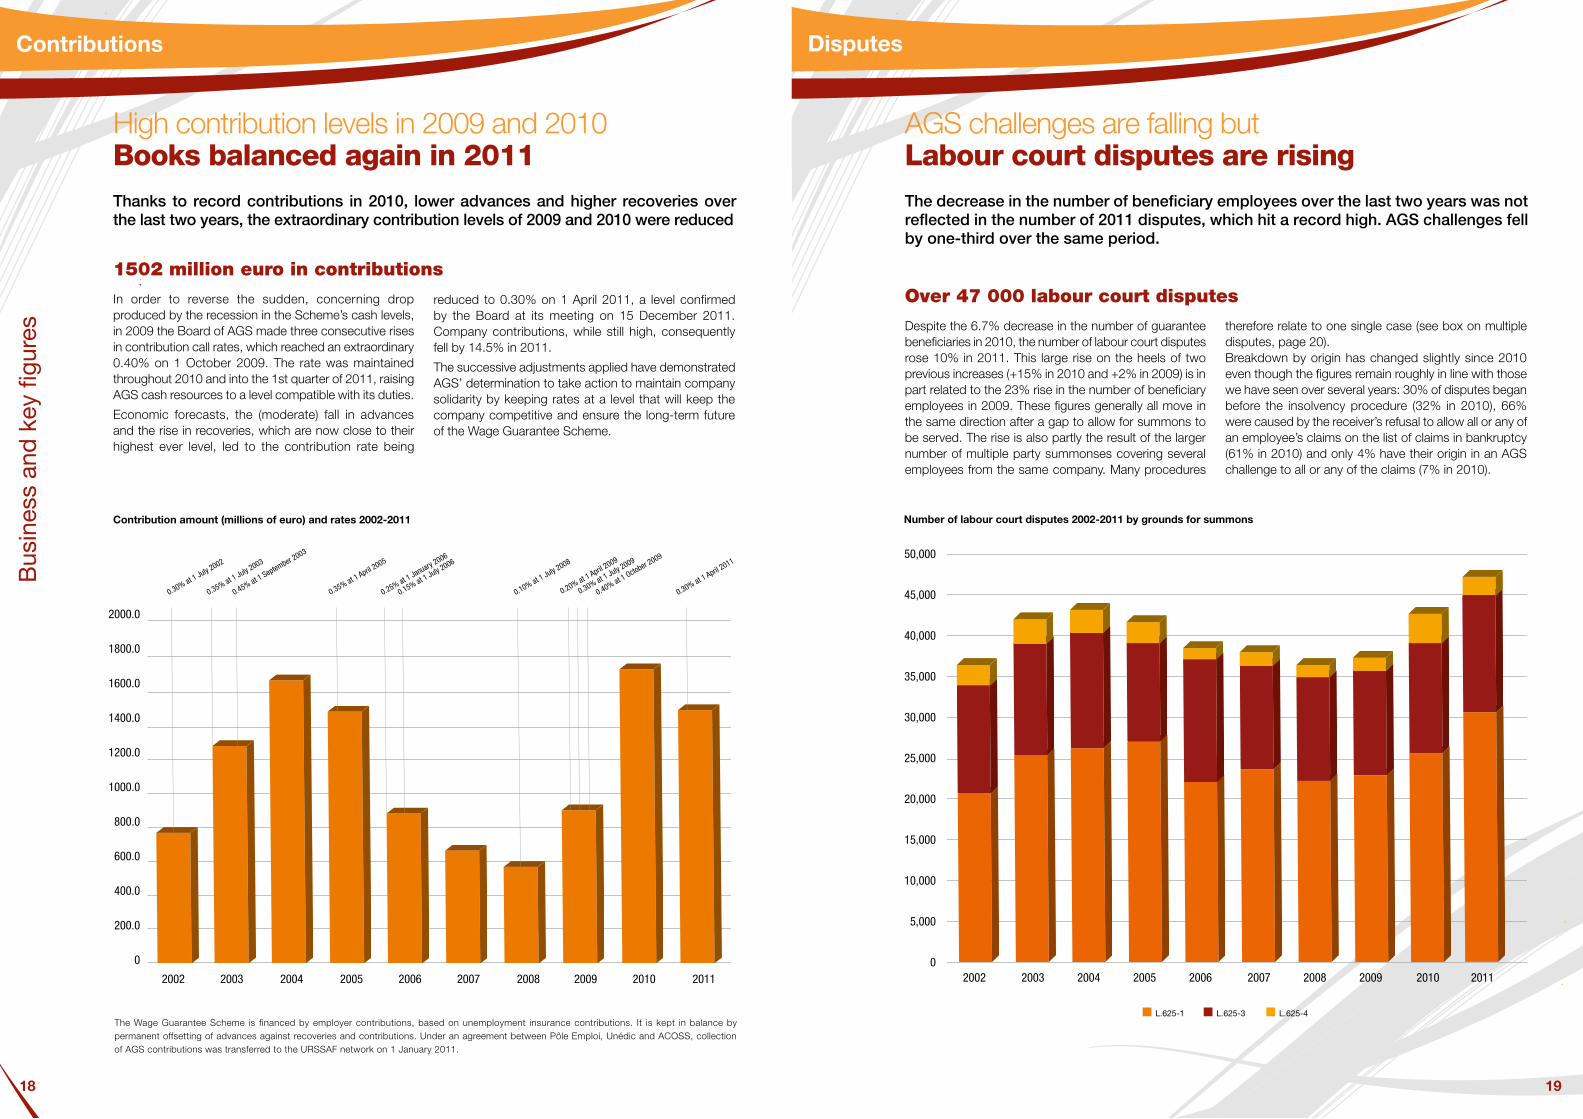
The Wage Guarantee Scheme is financed by employer contributions, based on unemployment insurance contributions. It is kept in balance by permanent offsetting of advances against recoveries and contributions. Under an agreement between Pôle Emploi, Unédic and ACOSS, collection of AGS contributions was transferred to the URSSAF network on 1 January 2011.
0.30% at 1 July 2002
0.35% at 1 July 2003
0.45% at 1 September 2003
0.35% at 1 April 2005
0.25% at 1 January 2006
0.15% at 1 July 2006
0.10% at 1 July 2008
0.20% at 1 April 2009
0.40% at 1 October 2009
0.30% at 1 July 2009
0.30% at 1 April 2011
Disputes
Over 47 000 labour court disputes
Despite the 6.7% decrease in the number of guarantee beneficiaries in 2010, the number of labour court disputes rose 10% in 2011. This large rise on the heels of two previous increases (+15% in 2010 and +2% in 2009) is in part related to the 23% rise in the number of beneficiary employees in 2009. These figures generally all move in the same direction after a gap to allow for summons to be served. The rise is also partly the result of the larger number of multiple party summonses covering several employees from the same company. Many procedures
therefore relate to one single case (see box on multiple disputes, page 20).Breakdown by origin has changed slightly since 2010 even though the figures remain roughly in line with those we have seen over several years: 30% of disputes began before the insolvency procedure (32% in 2010), 66% were caused by the receiver’s refusal to allow all or any of an employee’s claims on the list of claims in bankruptcy (61% in 2010) and only 4% have their origin in an AGS challenge to all or any of the claims (7% in 2010).
Contributions
High contribution levels in 2009 and 2010 Books balanced again in 2011 Thanks to record contributions in 2010, lower advances and higher recoveries over the last two years, the extraordinary contribution levels of 2009 and 2010 were reduced
1502 million euro in contributions
In order to reverse the sudden, concerning drop produced by the recession in the Scheme’s cash levels, in 2009 the Board of AGS made three consecutive rises in contribution call rates, which reached an extraordinary 0.40% on 1 October 2009. The rate was maintained throughout 2010 and into the 1st quarter of 2011, raising AGS cash resources to a level compatible with its duties.
Economic forecasts, the (moderate) fall in advances and the rise in recoveries, which are now close to their highest ever level, led to the contribution rate being
reduced to 0.30% on 1 April 2011, a level confirmed by the Board at its meeting on 15 December 2011. Company contributions, while still high, consequently fell by 14.5% in 2011.
The successive adjustments applied have demonstrated AGS’ determination to take action to maintain company solidarity by keeping rates at a level that will keep the company competitive and ensure the long-term future of the Wage Guarantee Scheme.
AGS challenges are falling but labour court disputes are rising The decrease in the number of beneficiary employees over the last two years was not reflected in the number of 2011 disputes, which hit a record high. AGS challenges fell by one-third over the same period.
■ L.625-1 ■ L.625-3 ■ L.625-4
Number of labour court disputes 2002-2011 by grounds for summons
2 500
2 000
1 500
1 000
500
0
2002 2003 2004 2005 2006 2007 2008 2009 2010 2011
3 500
4 500
2 500
2 000
1 500
1 000
500
0
2002 2003 2004 2005 2006 2007 2008 2009 2010 2011
3 500
4 500
50,000
45,000
40,000
35,000
30,000
25,000
20,000
15,000
10,000
5,000
02002 2003 2004 2005 2006 2007 2008 2009 2010 2011
21
Bus
ines
s an
d k
ey fi
gure
s
20
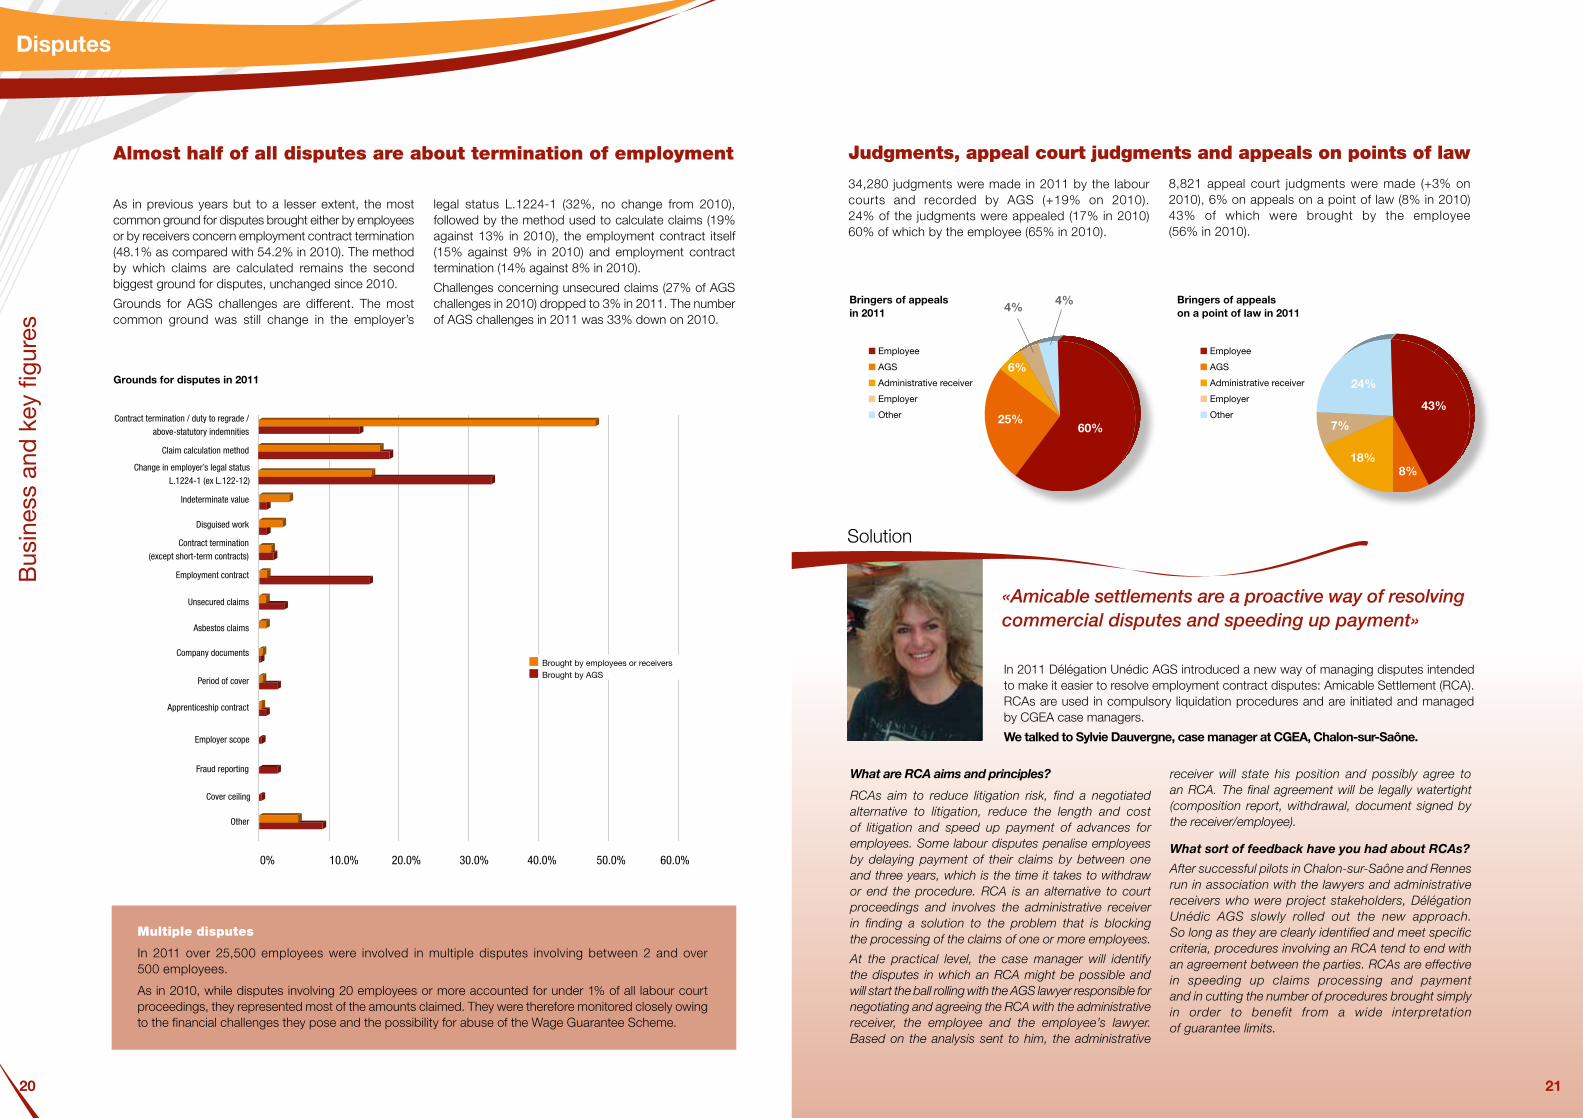
Almost half of all disputes are about termination of employment
As in previous years but to a lesser extent, the most common ground for disputes brought either by employees or by receivers concern employment contract termination (48.1% as compared with 54.2% in 2010). The method by which claims are calculated remains the second biggest ground for disputes, unchanged since 2010.
Grounds for AGS challenges are different. The most common ground was still change in the employer’s
legal status L.1224-1 (32%, no change from 2010), followed by the method used to calculate claims (19% against 13% in 2010), the employment contract itself (15% against 9% in 2010) and employment contract termination (14% against 8% in 2010).
Challenges concerning unsecured claims (27% of AGS challenges in 2010) dropped to 3% in 2011. The number of AGS challenges in 2011 was 33% down on 2010.
Disputes
Grounds for disputes in 2011
0,0% 10% 20% 30% 40% 50% 60%
Agriculture
Activités �nancières
Autres activités de services
Information et communication
Construction
Enseignement, santé, action sociale
Commerce, transports, hébergement et restauration
Activités de services
Industrie Contract termination / duty to regrade /
above-statutory indemnities
0% 10.0% 20.0% 30.0% 40.0% 50.0% 60.0%
■ Brought by employees or receivers ■ Brought by AGS
Claim calculation method
Change in employer’s legal status L.1224-1 (ex L.122-12)
Indeterminate value
Disguised work
Contract termination (except short-term contracts)
Employment contract
Unsecured claims
Asbestos claims
Company documents
Period of cover
Apprenticeship contract
Employer scope
Fraud reporting
Other
Multiple disputes
In 2011 over 25,500 employees were involved in multiple disputes involving between 2 and over 500 employees.
As in 2010, while disputes involving 20 employees or more accounted for under 1% of all labour court proceedings, they represented most of the amounts claimed. They were therefore monitored closely owing to the financial challenges they pose and the possibility for abuse of the Wage Guarantee Scheme.
Judgments, appeal court judgments and appeals on points of law
34,280 judgments were made in 2011 by the labour courts and recorded by AGS (+19% on 2010). 24% of the judgments were appealed (17% in 2010) 60% of which by the employee (65% in 2010).
8,821 appeal court judgments were made (+3% on 2010), 6% on appeals on a point of law (8% in 2010) 43% of which were brought by the employee (56% in 2010).
■ Employee
■ AGS
■ Administrative receiver
■ Employer
■ Other
Bringers of appeals in 2011
60%25%
6%
4%4%
■ Employee
■ AGS
■ Administrative receiver
■ Employer
■ Other
Bringers of appeals on a point of law in 2011
43%
18%8%
24%
7%
Solution
What are RCA aims and principles?
RCAs aim to reduce litigation risk, find a negotiated alternative to litigation, reduce the length and cost of litigation and speed up payment of advances for employees. Some labour disputes penalise employees by delaying payment of their claims by between one and three years, which is the time it takes to withdraw or end the procedure. RCA is an alternative to court proceedings and involves the administrative receiver in finding a solution to the problem that is blocking the processing of the claims of one or more employees.
At the practical level, the case manager will identify the disputes in which an RCA might be possible and will start the ball rolling with the AGS lawyer responsible for negotiating and agreeing the RCA with the administrative receiver, the employee and the employee’s lawyer. Based on the analysis sent to him, the administrative
receiver will state his position and possibly agree to an RCA. The final agreement will be legally watertight (composition report, withdrawal, document signed by the receiver/employee).
What sort of feedback have you had about RCAs?
After successful pilots in Chalon-sur-Saône and Rennes run in association with the lawyers and administrative receivers who were project stakeholders, Délégation Unédic AGS slowly rolled out the new approach. So long as they are clearly identified and meet specific criteria, procedures involving an RCA tend to end with an agreement between the parties. RCAs are effective in speeding up claims processing and payment and in cutting the number of procedures brought simply in order to benefit from a wide interpretation of guarantee limits.
In 2011 Délégation Unédic AGS introduced a new way of managing disputes intended to make it easier to resolve employment contract disputes: Amicable Settlement (RCA). RCAs are used in compulsory liquidation procedures and are initiated and managed by CGEA case managers.
We talked to Sylvie Dauvergne, case manager at CGEA, Chalon-sur-Saône.
21
«Amicable settlements are a proactive way of resolving commercial disputes and speeding up payment»
Cover ceiling

Mee
ting
& t
alki
ng
22
Report on the implementation of EC Directive 2008/94
Under article 15 of EC Directive 2008/94 on the protection of employees in the event of the insolvency of their employer, France attended
budget meetings and was questioned about scope, the claims covered by AGS and transborder failures. 2006-2009, 3.4 million workers received 17.7 billion euro in payment following the insolvency of their employers. Within the European Union, Germany saw the largest number of actions involving company failures (146,473 over 2006-2009), while action in France, via AGS, involved the largest number of employees (953,887 over 2006-2009) and the biggest total advance (6.4 billion euro).
Amendment of Council Regulation (EC) 1346/2000 of 29 May 2000
The European Parliament undertook the amendment of this regulation on insolvency procedures and recommended
better co-ordination and harmonisation of the basics: requirements for commencing procedures, declaration of claims, development of plans, handling of groups, a European bankruptcy register, co-operation etc.
Having been consulted by the European Commission, France set up a working group in liaison with the Ministry of Justice and included as a member Délégation AGS, represented by its director. The first job was to look at the criteria for qualifying a procedure as primary or secondary, to decide how professionals in the various countries can co-operate with each other and to find a level of harmonisation that will be acceptable to all.
Meeting with the International Labour Organisation (ILO)
Since EC Directive 80/987 of 20 October 1980, all EU countries have been required to maintain an insolvency fund. The European
Commission invited Délégation AGS to meet the ILO on 12 October 2011 to share its French and European wage guarantee expertise with the Organisation. AGS Director, Thierry Météyé, Yves Roussel (auditor) and Michel Weiczor (CGEA transborder bankruptcy manager) met George Politakis of the International Labour Standards Department. Their discussions covered recommendation 180, Convention 173 of 25 June 1992 and AGS involvement in a membership campaign to be organised by the ILO. International Convention 173 protects workers’ claims in the event of the insolvency of their employer by placing a special privilege on wages and/or creating an insolvency fund. The International Labour Organisation (ILO), which has 183 member countries, wishes more countries to sign up to the Convention. So far only 19 countries have actually done so.
Discussions on English insolvency procedures
Délégation AGS attended the 28th meeting of the IFPPC in London on 22-25 September 2011). Organised by Prof. François-Xa-
vier Lucas, the main item on the agenda was English insolvency procedures.
AGS took this opportunity to improve its understanding of the English system, to which it had been introduced during a previous meeting with the UK’s National Insurance Fund. Particular emphasis was placed on how procedures affect third-party rights and differences from French law, including the interests protected by English insolvency law. A presentation comparing application of Regulation 1346/2000 under the two legal systems highlighted the differences between eligible English and French procedures.
★
★★
★
★★★
★★
★
★★
✭
★
★★
★
★★★
★★
★
★★
✭
★
★★
★
★★★
★★
★
★★
✭
Ian Huskisson, an English solicitor, has wide experience in the international execution of judgments and of cross- border insolvency procedures. He spoke at the 28th conference of the IFPPC in London and talked to us about the main similarities and differences between English and French company insolvency regulations.
As an insolvency specialist you understand English and French law in this area. How do the rights of failing English and French companies differ and which are their main areas of similarity?
It’s quite hard to compare the two systems. English law, puts power into the hands of the creditor. This means that it is up to the creditor to decide whether to sta r t inso lvency proceedings or to appoint a receiver. In many cases it is the creditors who pay the receiver’s fees, particularly if the assets of the insolvent company are insufficient for the purpose.
Unlike in France, the role of the courts is small and some English insolvencies do not involve the courts at all.
The two systems are similar however in that both sets of legislators are eager to promote protection procedures and to reduce compulsory liquidations. But English protection procedures are very different from the French
In terms of prevention, how does English law seek to avoid insolvency procedures?
The English protection procedure is cal led «administrat ion». The
directors of a company can put it into administration by appointing an administrator. But secured creditors can prevent such action by the directors.
Companies are protected - normally for up to one year - while they are in administration. The administrator’s job
is to find a buyer for the company, not to restructure it. The creditors can accept or reject a d m i n i s t r a t i o n plans. One of the a d m i n i s t r a t o r ’ s
powers is that he can make employees redundant.
Could you explain the main differences between AGS and the UK National Insurance Fund?
Here again, there is a big difference between English and French regulations. The main feature of the English Fund is that the scope of the guarantee is smaller than that of AGS.
The UK National Insurance Fund guarantees unpaid wages when an employer goes bankrupt. The Fund will only step in however if the company does not itself have the funds to pay the wages owed. Guarantee limits are also strict. The weekly wage limit on arrears of pay is £430, with an 8-week ceiling.
Compare
«Under English law, some insolvencies
do not involve the courts at all»
23
Europe & the European Commission
Transborder bankruptcies and globalisation Better co-ordination of regulations A consultant to the European Commission thanks to its expertise in wage guarantee schemes and insolvency procedures, Délégation AGS is involved at the technical level in improving transborder bankruptcy management. It also attends the information exchange meetings organised by its partners to improve its understanding of regulations across Europe and to see how progress can be made in the general interest.
Sta
tistic
s
24 25
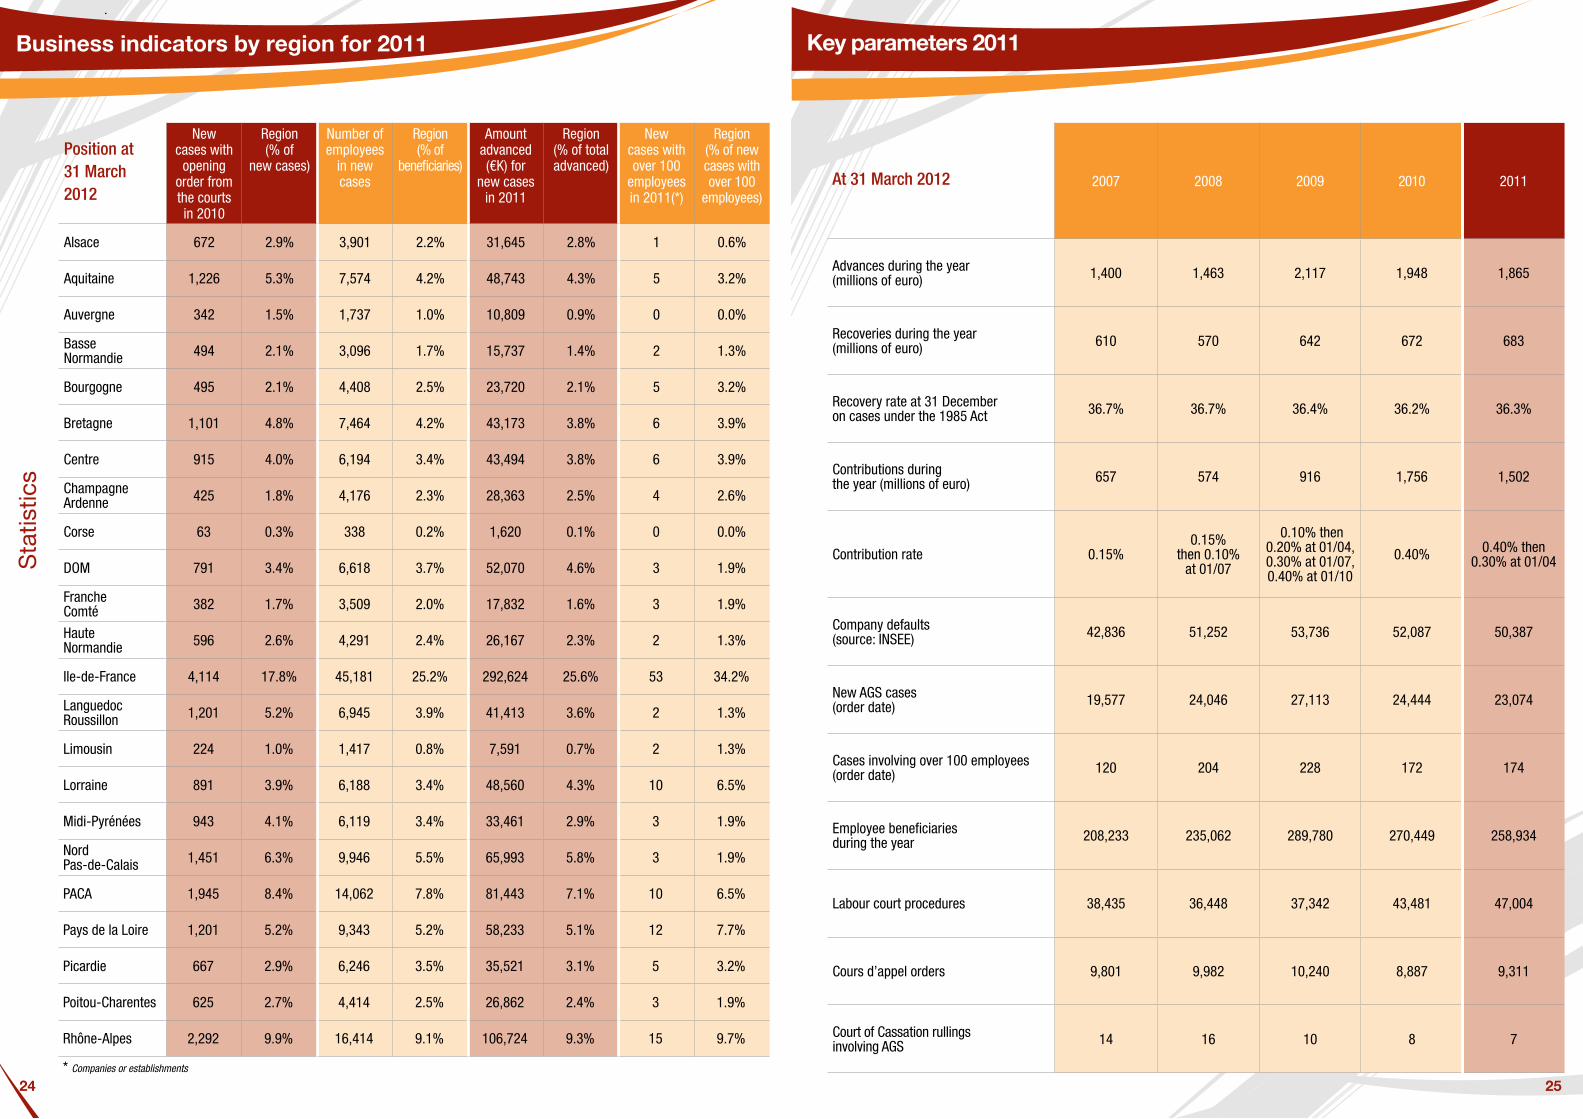
Position at 31 March 2012
New cases with
opening order from the courts in 2010
Region(% of
new cases)
Number of employees
in new cases
Region(% of
beneficiaries)
Amount advanced(€K) for
new cases in 2011
Region (% of total advanced)
New cases with over 100
employees in 2011(*)
Region (% of new cases with over 100
employees)
Alsace 672 2.9% 3,901 2.2% 31,645 2.8% 1 0.6%
Aquitaine 1,226 5.3% 7,574 4.2% 48,743 4.3% 5 3.2%
Auvergne 342 1.5% 1,737 1.0% 10,809 0.9% 0 0.0%
Basse Normandie 494 2.1% 3,096 1.7% 15,737 1.4% 2 1.3%
Bourgogne 495 2.1% 4,408 2.5% 23,720 2.1% 5 3.2%
Bretagne 1,101 4.8% 7,464 4.2% 43,173 3.8% 6 3.9%
Centre 915 4.0% 6,194 3.4% 43,494 3.8% 6 3.9%
Champagne Ardenne 425 1.8% 4,176 2.3% 28,363 2.5% 4 2.6%
Corse 63 0.3% 338 0.2% 1,620 0.1% 0 0.0%
DOM 791 3.4% 6,618 3.7% 52,070 4.6% 3 1.9%
Franche Comté 382 1.7% 3,509 2.0% 17,832 1.6% 3 1.9%
Haute Normandie 596 2.6% 4,291 2.4% 26,167 2.3% 2 1.3%
Ile-de-France 4,114 17.8% 45,181 25.2% 292,624 25.6% 53 34.2%
Languedoc Roussillon 1,201 5.2% 6,945 3.9% 41,413 3.6% 2 1.3%
Limousin 224 1.0% 1,417 0.8% 7,591 0.7% 2 1.3%
Lorraine 891 3.9% 6,188 3.4% 48,560 4.3% 10 6.5%
Midi-Pyrénées 943 4.1% 6,119 3.4% 33,461 2.9% 3 1.9%
Nord Pas-de-Calais 1,451 6.3% 9,946 5.5% 65,993 5.8% 3 1.9%
PACA 1,945 8.4% 14,062 7.8% 81,443 7.1% 10 6.5%
Pays de la Loire 1,201 5.2% 9,343 5.2% 58,233 5.1% 12 7.7%
Picardie 667 2.9% 6,246 3.5% 35,521 3.1% 5 3.2%
Poitou-Charentes 625 2.7% 4,414 2.5% 26,862 2.4% 3 1.9%
Rhône-Alpes 2,292 9.9% 16,414 9.1% 106,724 9.3% 15 9.7%
* Companies or establishments
Business indicators by region for 2011
At 31 March 2012 2007 2008 2009 2010 2011
Advances during the year(millions of euro) 1,400 1,463 2,117 1,948 1,865
Recoveries during the year(millions of euro) 610 570 642 672 683
Recovery rate at 31 Decemberon cases under the 1985 Act 36.7% 36.7% 36.4% 36.2% 36.3%
Contributions duringthe year (millions of euro) 657 574 916 1,756 1,502
Contribution rate 0.15%0.15%
then 0.10% at 01/07
0.10% then 0.20% at 01/04, 0.30% at 01/07, 0.40% at 01/10
0.40% 0.40% then 0.30% at 01/04
Company defaults(source: INSEE) 42,836 51,252 53,736 52,087 50,387
New AGS cases(order date) 19,577 24,046 27,113 24,444 23,074
Cases involving over 100 employees(order date) 120 204 228 172 174
Employee beneficiariesduring the year 208,233 235,062 289,780 270,449 258,934
Labour court procedures 38,435 36,448 37,342 43,481 47,004
Cours d’appel orders 9,801 9,982 10,240 8,887 9,311
Court of Cassation rullings involving AGS 14 16 10 8 7
Key parameters 2011
27
REUNION
Organization chart of DUAO
rgan
izat
ion
Direction Thierry Méteyé Directeur national
Jacques Savoie Chef de Cabinet
Délégation nationale Anne Varin Secrétaire Général
Yves Roussel Responsable Audit interne et prévention des fraudes
Franck Bouchut Responsable Département Statistiques - Pilotage de la Production
Laurent Mery Responsable Département Systèmes d’information - Pilotage de projets
Marie-Ange Nguyen Responsable Département Qualité et contrôle interne
Francis Rousselot Responsable Département Juridique et Conseil
Responsable Département Ressources Humaines
Délégation régionale Centre-Ouest Christophe Fourage Délégué régional
Sophie Daniel Responsable du CGEA de Rennes
Dominique Gury Responsable du CGEA de Rouen
Loïc Duclos Responsable du CGEA d’Orléans
Délégation régionale Sud-Ouest Maryse Deschamps Délégué régional
Jean-Paul Ayraud Responsable du CGEA de Toulouse
Christophe Mounin Responsable du CGEA de Bordeaux
Héry Randriamampianina Responsable du Département de La Réunion
Délégation régionale Sud-Est Jacques Andrieu Délégué régional
Laurent Liard Responsable du CGEA d’Annecy
Sonia Mouroz Responsable du CGEA de Chalon-sur-Saône
Laurent Estroumza Responsable du CGEA de Marseille
Délégation régionale Nord-Est Michel Mathieu Délégué régional a.i.
Vincent Garraud Responsable du CGEA de Nancy
Benoît Graillot Responsable du CGEA d’Amiens
Bernard Van Damme Responsable du CGEA de Lille
Délégation régionale Ile-de-France Michel Mathieu Délégué régional
Marc Hygonenq Responsable du CGEA Ile-de-France Est
Michel Wieczor Responsable du CGEA Ile-de-France Ouest
Délégation régionale DOM américains
Colette Nouchet Responsable du Centre de Fort-de-France
26
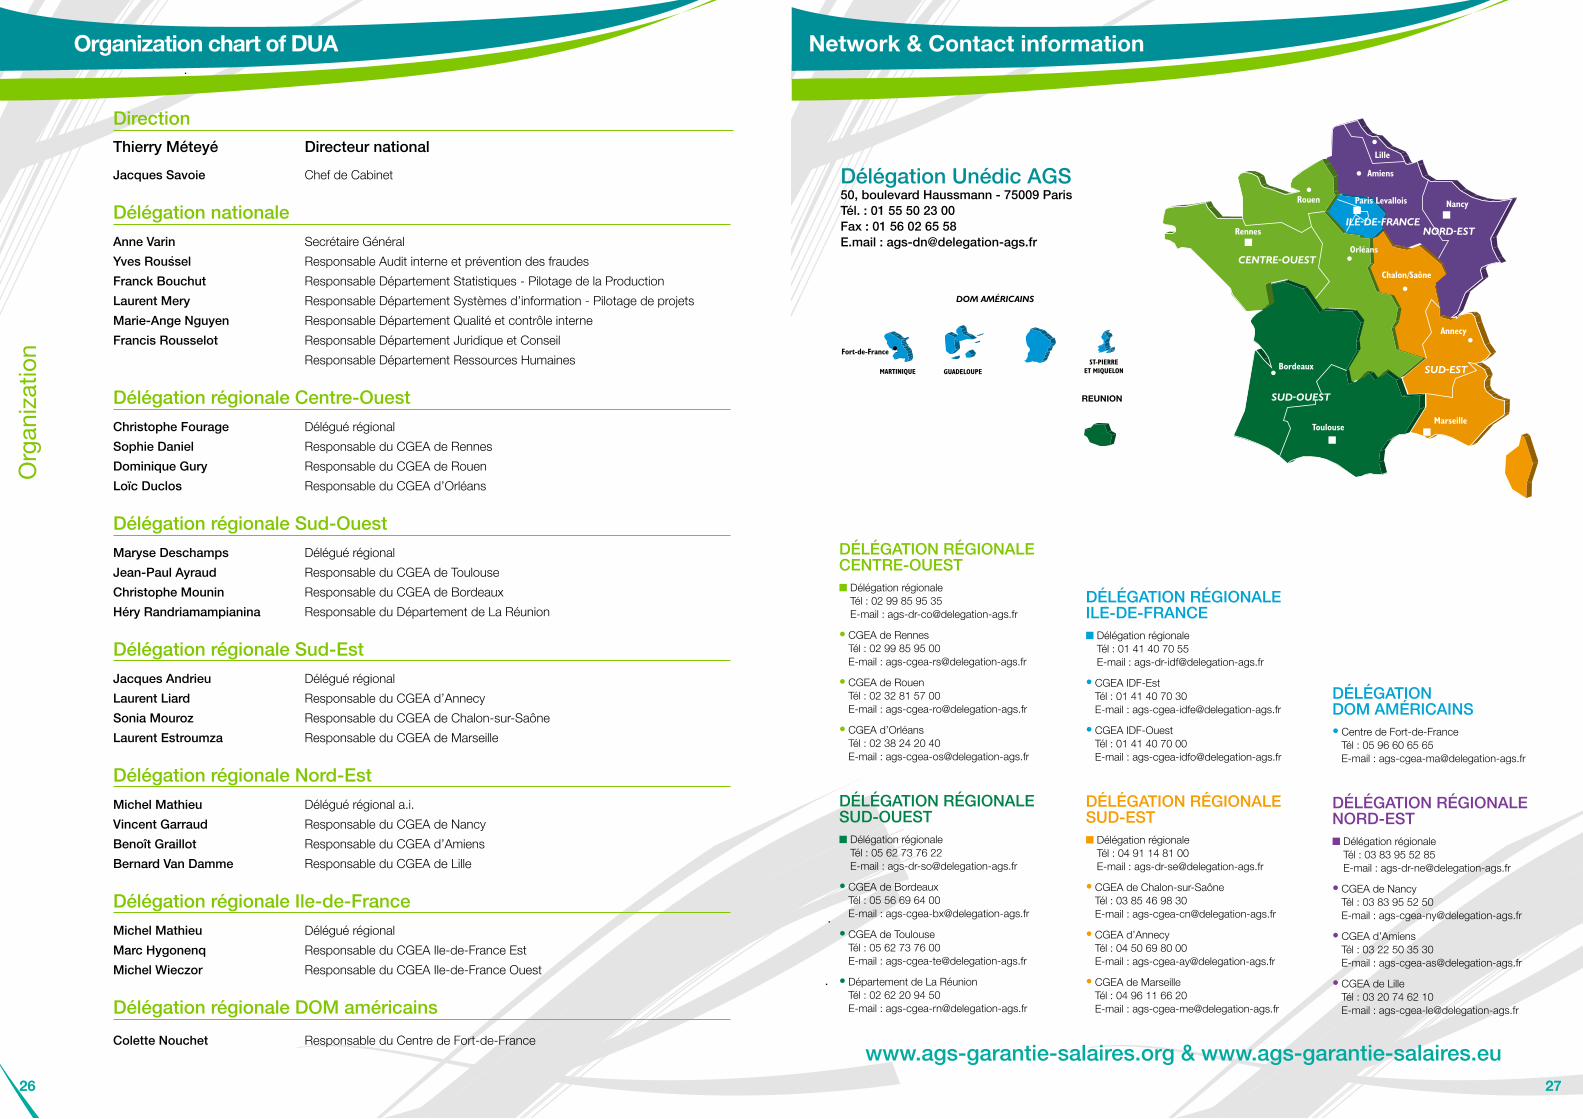
Network & Contact information
Délégation Unédic AGS50, boulevard Haussmann - 75009 ParisTél. : 01 55 50 23 00Fax : 01 56 02 65 58E.mail : [email protected]
DÉLÉGATION RÉGIONALECENTRE-OUEST■ Délégation régionale
Tél : 02 99 85 95 35 E-mail : [email protected]
• CGEA de Rennes Tél : 02 99 85 95 00 E-mail : [email protected]
• CGEA de Rouen Tél : 02 32 81 57 00 E-mail : [email protected]
• CGEA d’Orléans Tél : 02 38 24 20 40 E-mail : [email protected]
DÉLÉGATION RÉGIONALESUD-OUEST■ Délégation régionale
Tél : 05 62 73 76 22 E-mail : [email protected]
• CGEA de Bordeaux Tél : 05 56 69 64 00 E-mail : [email protected]
• CGEA de Toulouse Tél : 05 62 73 76 00 E-mail : [email protected]
• Département de La Réunion Tél : 02 62 20 94 50 E-mail : [email protected]
www.ags-garantie-salaires.org & www.ags-garantie-salaires.eu
DÉLÉGATION RÉGIONALEILE-DE-FRANCE■ Délégation régionale
Tél : 01 41 40 70 55 E-mail : [email protected]
• CGEA IDF-Est Tél : 01 41 40 70 30 E-mail : [email protected]
• CGEA IDF-Ouest Tél : 01 41 40 70 00 E-mail : [email protected]
DÉLÉGATION RÉGIONALESUD-EST■ Délégation régionale
Tél : 04 91 14 81 00 E-mail : [email protected]
• CGEA de Chalon-sur-Saône Tél : 03 85 46 98 30 E-mail : [email protected]
• CGEA d’Annecy Tél : 04 50 69 80 00 E-mail : [email protected]
• CGEA de Marseille Tél : 04 96 11 66 20 E-mail : [email protected]
DÉLÉGATIONDOM AMÉRICAINS• Centre de Fort-de-France
Tél : 05 96 60 65 65 E-mail : [email protected]
DÉLÉGATION RÉGIONALENORD-EST■ Délégation régionale
Tél : 03 83 95 52 85 E-mail : [email protected]
• CGEA de Nancy Tél : 03 83 95 52 50 E-mail : [email protected]
• CGEA d’Amiens Tél : 03 22 50 35 30 E-mail : [email protected]
• CGEA de Lille Tél : 03 20 74 62 10 E-mail : [email protected]
27