Embed Size (px)
Citation preview
December 6, 2017
Solid Waste Master Plan Update
Nashville and Davidson County
Presentation Outline
• Metro Public Works Updates
• Waste & Recycling Characterization
• Public Engagement
• Residential Online Survey Results
• Summary of Research Recommendations
• Solid Waste Funds
Davidson County Solid Waste Region Board3

Metro Public Works Updates
• Organics• Natural Resource Defense Council research
• Food Waste drop-off sites for residents
• Mayor’s Food Waste Challenge & Kroger
• Food waste collection contract for Metro buildings
• School food waste pilots
• TDEC Organics Management Grant
Davidson County Solid Waste Region Board4
Metro Public Works Updates
• Glass• Honky Tonk Glass Bottle Recycling
• Education
• Refocus from “Recycling” to “Reduce, Reuse, Recycle”
• Regional Efforts
• TDEC and Greater Nashville Regional Council
Davidson County Solid Waste Region Board5
• Interviews with key environmental groups
• BURNT/SOCM
• RAM
• Tennessee Environmental Council
• Conduct an online survey of Nashville residents and businesses
• Meetings with TDEC and waste management staff of surrounding counties
• Gathering input from Metro Public Works Committee members
Public Engagement
Davidson County Solid Waste Region Board6

Statistical Survey –Services, Satisfaction, Support
Davidson County Solid Waste Region Board7
• Statistical web survey of random set of: • Residences - Single family (SF) and Multifamily (MF) (200+ responses)
• Commercial businesses. Business survey still on-going; some additional residential surveys to be completed.
• Preliminary responses to key topics• Green generally top 2 responses; red are biggest barriers or
opposition or not sure.
• On support for strategies, the most important responses -- “support” (strong and moderate) vs. “strongly oppose”.

Statistical Survey –Services, Satisfaction, Support
Davidson County Solid Waste Region Board8
Trash RecyclingHow often is your service collection for… All SF All MF
SF-USD
SF-GSD SF all MF all SF -USD SF-GSD
Every Week 86% 88% 90% 85% 21% 53% 13% 35%Every Other Week 3% 2% 9% 6% 17% 7% 11% 27%
About once a month 2% 0% 2% 3% 59% 27% 76% 35%N/A Self-haul or other 9% 4% 0% 4% 3% 13% 0% 4%
The majority of residents• Have their trash containers provided for them free of charge• Only use 1 cart for trash• Have the same hauler/ service provider for trash and recycling• Use 96g carts for recycling• Have recycling containers provided for free (but 23% of SF-GSD say they have to pay)• Have single stream recycling
Summary: Trash reportedly collected Weekly; recyclables collectedWeekly or monthly.
Statistical Survey –Services, Satisfaction, Support
9 Davidson County Solid Waste Region Board
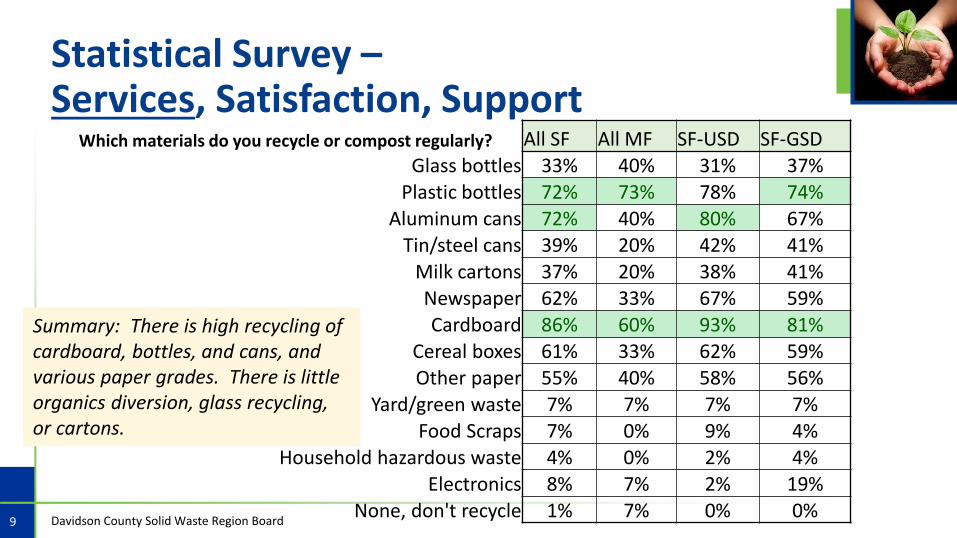
Which materials do you recycle or compost regularly? All SF All MF SF-USD SF-GSDGlass bottles 33% 40% 31% 37%
Plastic bottles 72% 73% 78% 74%Aluminum cans 72% 40% 80% 67%
Tin/steel cans 39% 20% 42% 41%
Milk cartons 37% 20% 38% 41%Newspaper 62% 33% 67% 59%
Cardboard 86% 60% 93% 81%Cereal boxes 61% 33% 62% 59%
Other paper 55% 40% 58% 56%Yard/green waste 7% 7% 7% 7%
Food Scraps 7% 0% 9% 4%Household hazardous waste 4% 0% 2% 4%
Electronics 8% 7% 2% 19%None, don't recycle 1% 7% 0% 0%
Summary: There is high recycling of cardboard, bottles, and cans, and various paper grades. There is littleorganics diversion, glass recycling,or cartons.
Statistical Survey –Services, Satisfaction, Support
Davidson County Solid Waste Region Board10
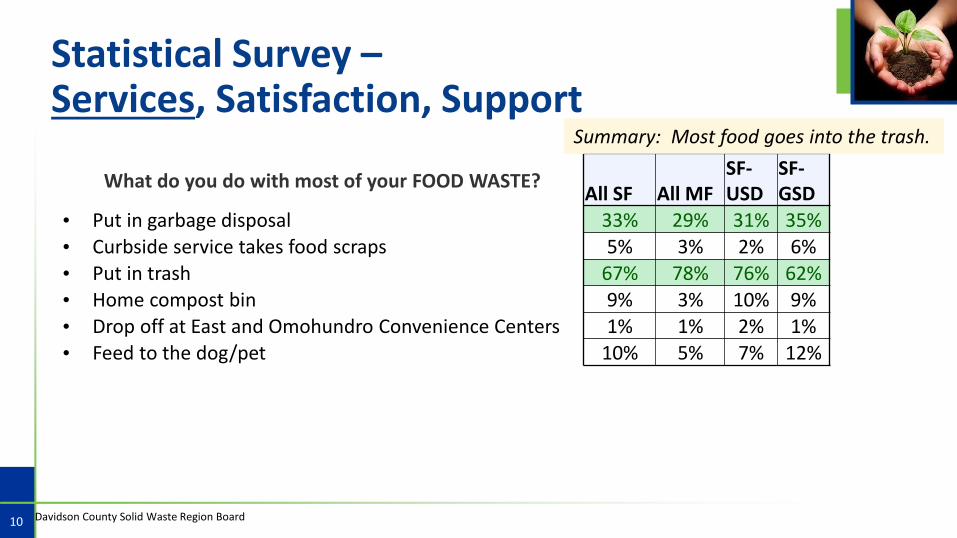
What do you do with most of your FOOD WASTE?All SF All MF
SF-USD
SF-GSD
• Put in garbage disposal 33% 29% 31% 35%
• Curbside service takes food scraps 5% 3% 2% 6%
• Put in trash 67% 78% 76% 62%
• Home compost bin 9% 3% 10% 9%
• Drop off at East and Omohundro Convenience Centers 1% 1% 2% 1%
• Feed to the dog/pet 10% 5% 7% 12%
Summary: Most food goes into the trash.
Statistical Survey –Services, Satisfaction, Support
Somewhat & Strongly Support Strongly Oppose
Support for Program Changes All SF All MFSF-
USDSF-
GSD SF all MF allSF -USD
SF -GSD
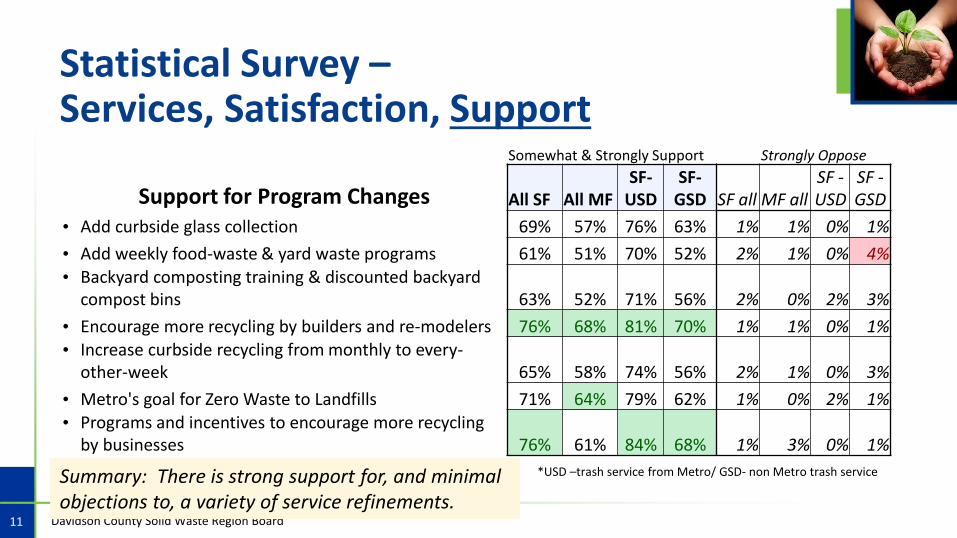
• Add curbside glass collection 69% 57% 76% 63% 1% 1% 0% 1%
• Add weekly food-waste & yard waste programs 61% 51% 70% 52% 2% 1% 0% 4%
• Backyard composting training & discounted backyard compost bins 63% 52% 71% 56% 2% 0% 2% 3%
• Encourage more recycling by builders and re-modelers 76% 68% 81% 70% 1% 1% 0% 1%
• Increase curbside recycling from monthly to every-other-week 65% 58% 74% 56% 2% 1% 0% 3%
• Metro's goal for Zero Waste to Landfills 71% 64% 79% 62% 1% 0% 2% 1%
• Programs and incentives to encourage more recycling by businesses 76% 61% 84% 68% 1% 3% 0% 1%
11 Davidson County Solid Waste Region Board
*USD –trash service from Metro/ GSD- non Metro trash serviceSummary: There is strong support for, and minimal objections to, a variety of service refinements.
Statistical Survey –Services, Satisfaction, Support
Somewhat & Strongly Support Strongly Oppose
Support IF trash service not in taxes (or if pay for service) All SF All MF
SF-USD
SF-GSD
SF all
MF all
SF -USD
SF-GSD
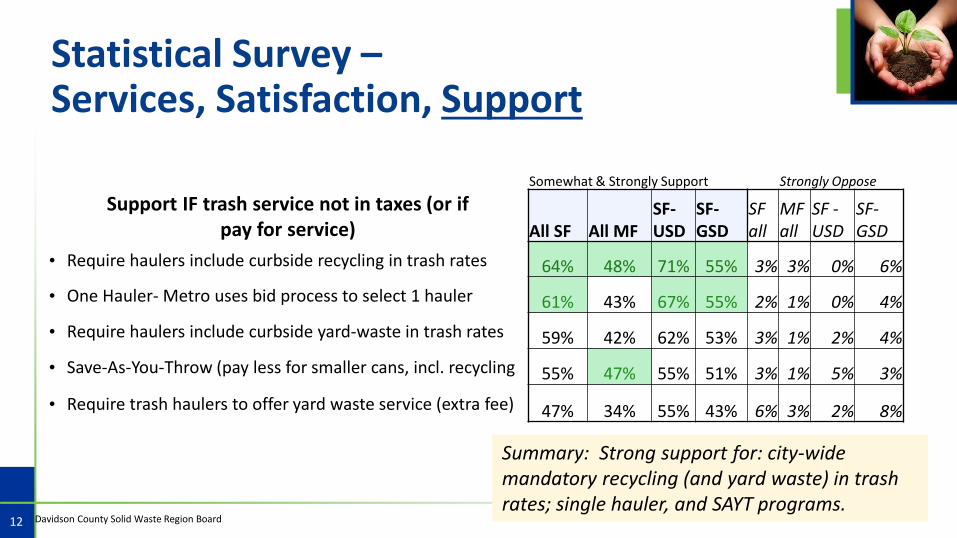
• Require haulers include curbside recycling in trash rates 64% 48% 71% 55% 3% 3% 0% 6%
• One Hauler- Metro uses bid process to select 1 hauler 61% 43% 67% 55% 2% 1% 0% 4%
• Require haulers include curbside yard-waste in trash rates 59% 42% 62% 53% 3% 1% 2% 4%
• Save-As-You-Throw (pay less for smaller cans, incl. recycling 55% 47% 55% 51% 3% 1% 5% 3%
• Require trash haulers to offer yard waste service (extra fee) 47% 34% 55% 43% 6% 3% 2% 8%
Davidson County Solid Waste Region Board12
Summary: Strong support for: city-wide mandatory recycling (and yard waste) in trash rates; single hauler, and SAYT programs.
Statistical Survey –Services, Satisfaction, Support
Davidson County Solid Waste Region Board13
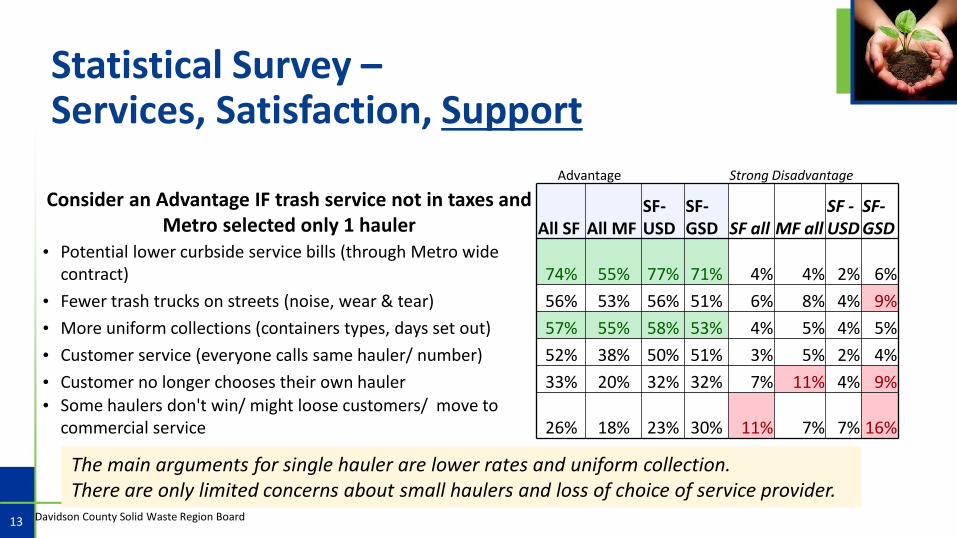
Advantage Strong Disadvantage
Consider an Advantage IF trash service not in taxes and Metro selected only 1 hauler All SF All MF
SF-USD
SF-GSD SF all MF all
SF -USD
SF-GSD
• Potential lower curbside service bills (through Metro wide contract) 74% 55% 77% 71% 4% 4% 2% 6%
• Fewer trash trucks on streets (noise, wear & tear) 56% 53% 56% 51% 6% 8% 4% 9%
• More uniform collections (containers types, days set out) 57% 55% 58% 53% 4% 5% 4% 5%
• Customer service (everyone calls same hauler/ number) 52% 38% 50% 51% 3% 5% 2% 4%
• Customer no longer chooses their own hauler 33% 20% 32% 32% 7% 11% 4% 9%
• Some haulers don't win/ might loose customers/ move to commercial service 26% 18% 23% 30% 11% 7% 7% 16%
The main arguments for single hauler are lower rates and uniform collection. There are only limited concerns about small haulers and loss of choice of service provider.
Waste & Recycling Characterization Study
• Understanding of the disposal and recycling habits in the Metro Nashville area
• Identify waste materials that will significantly impact landfill diversion
• What materials are contaminating single stream recycling?
14 Davidson County Solid Waste Region Board
Waste & Recycling Characterization Study
• Sampling and Sorting was performed in two seasons:
• Summer (July) and Fall (October)
• Peak Tourist Season and Schools are in Session
• Each event lasted 2 weeks (1 week for waste, 1 week for recyclables)
• Study was performed at:
• Waste Management Antioch Transfer Station
• Republic Services Transfer Station
• Waste Management River Hills Materials Recovery Facility
15 Davidson County Solid Waste Region Board
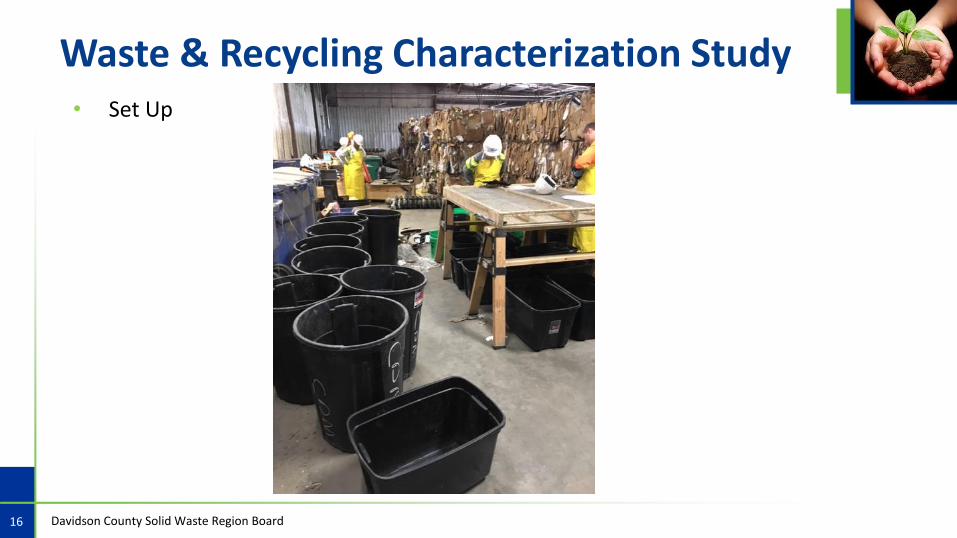
Waste & Recycling Characterization Study• Set Up
16 Davidson County Solid Waste Region Board
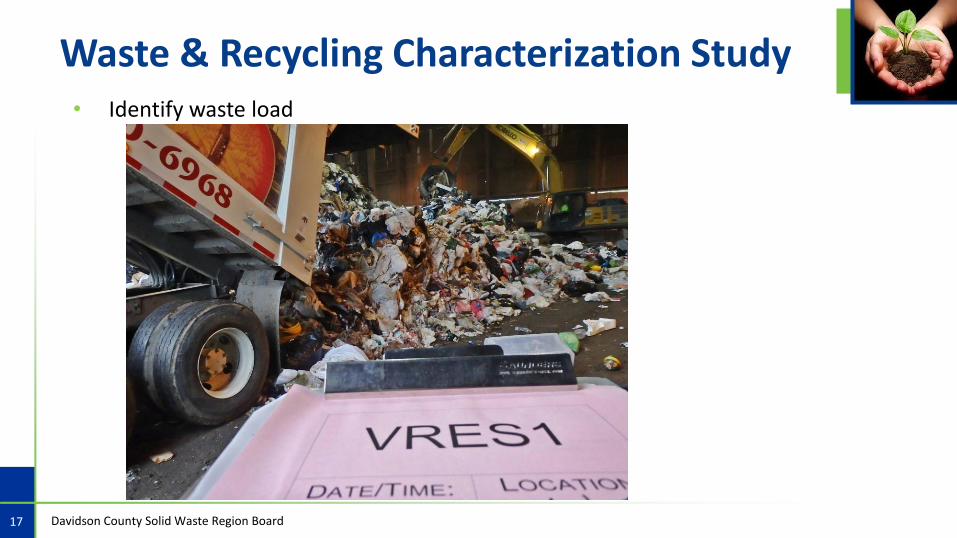
Waste & Recycling Characterization Study• Identify waste load
17 Davidson County Solid Waste Region Board
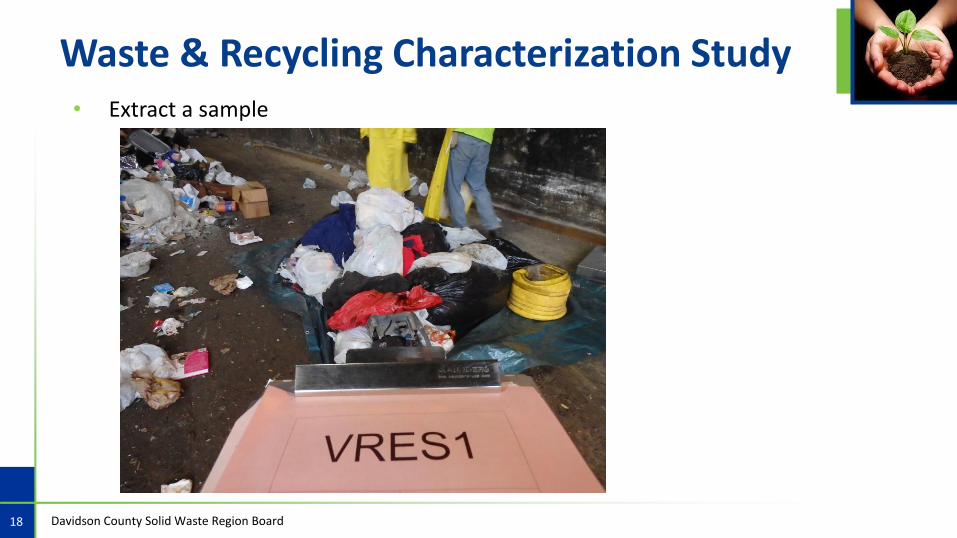
Waste & Recycling Characterization Study• Extract a sample
18 Davidson County Solid Waste Region Board
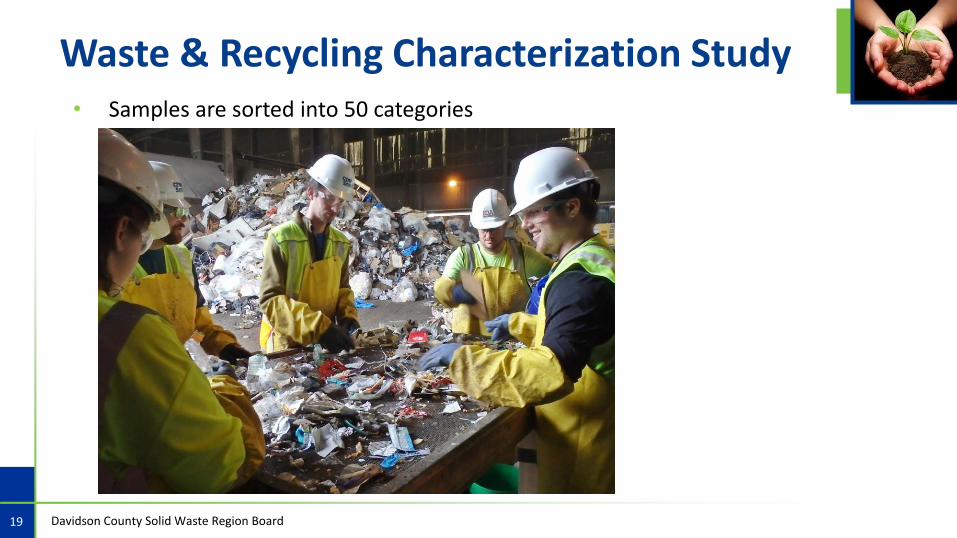
Waste & Recycling Characterization Study• Samples are sorted into 50 categories
19 Davidson County Solid Waste Region Board
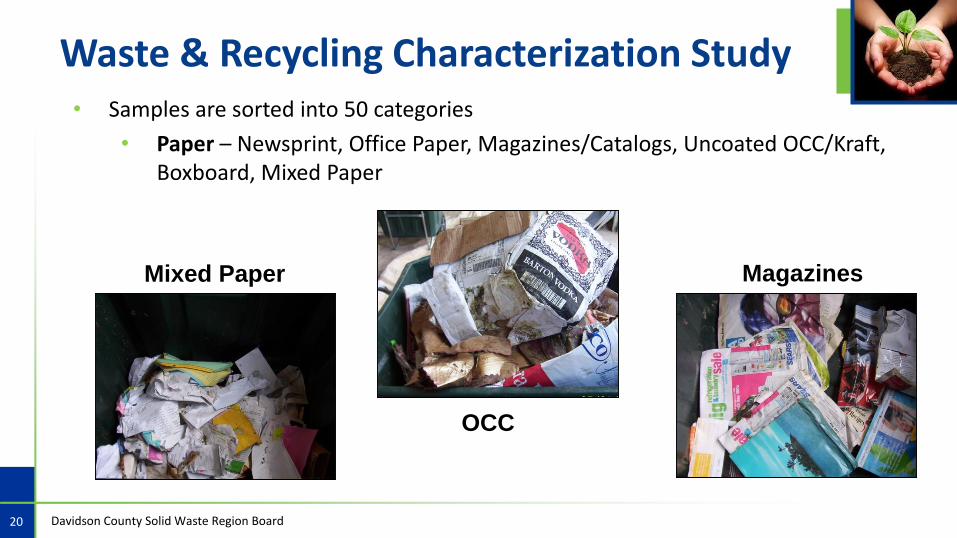
Waste & Recycling Characterization Study• Samples are sorted into 50 categories
• Paper – Newsprint, Office Paper, Magazines/Catalogs, Uncoated OCC/Kraft, Boxboard, Mixed Paper
Mixed Paper Magazines
OCC
20 Davidson County Solid Waste Region Board

Waste & Recycling Characterization Study• Samples are sorted into 50 categories
• Plastics - #1 Pet Bottles/Jars, #1 Other Pet Containers & Packaging, #2 HDPE Bottles/Jars – Clear, #2 HDPE Bottles/Jars – Color, #2 Other HDPE Containers & Packaging, #6 Expanded Polystyrene Packaging (EPS), #3-#7 Other, Rigid Plastic Products, Grocery & Merchandise Film Bags, Trash Film Bags, Commercial & Industrial Film, Other Film, Composite Plastic
#1 PET Other Film
#2 HDPE Clear21 Davidson County Solid Waste Region Board
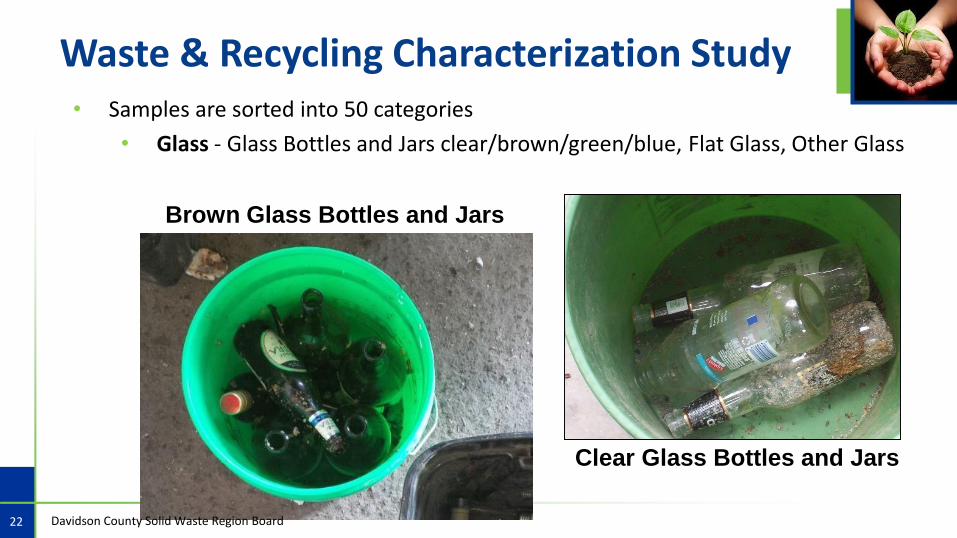
Waste & Recycling Characterization Study• Samples are sorted into 50 categories
• Glass - Glass Bottles and Jars clear/brown/green/blue, Flat Glass, Other Glass
Clear Glass Bottles and Jars
Brown Glass Bottles and Jars
22 Davidson County Solid Waste Region Board
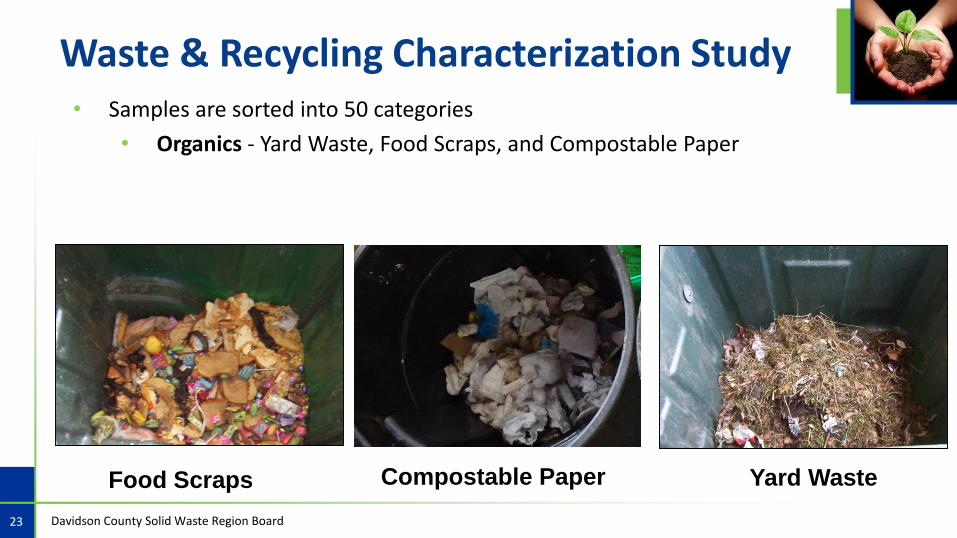
Waste & Recycling Characterization Study• Samples are sorted into 50 categories
• Organics - Yard Waste, Food Scraps, and Compostable Paper
Food Scraps Yard WasteCompostable Paper
23 Davidson County Solid Waste Region Board
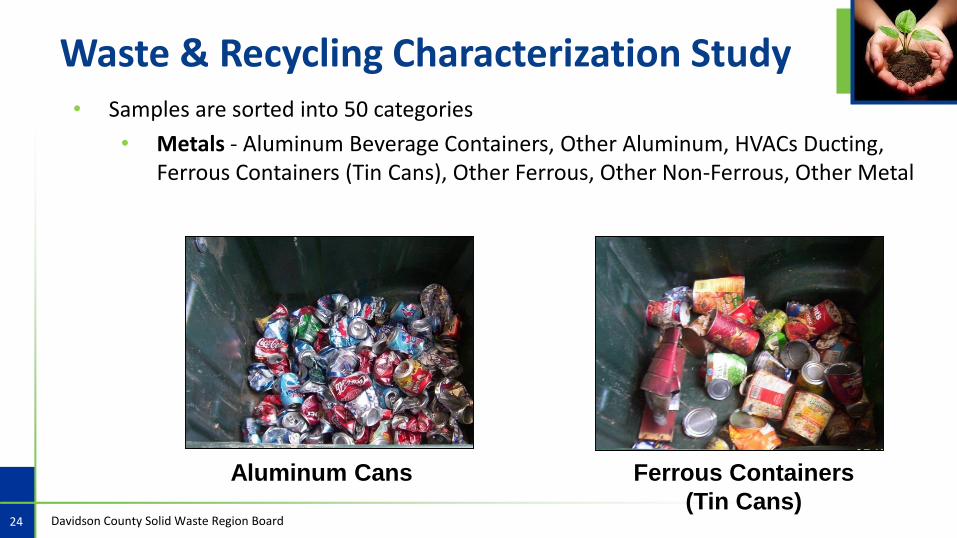
Waste & Recycling Characterization Study• Samples are sorted into 50 categories
• Metals - Aluminum Beverage Containers, Other Aluminum, HVACs Ducting, Ferrous Containers (Tin Cans), Other Ferrous, Other Non-Ferrous, Other Metal
Ferrous Containers
(Tin Cans)
Aluminum Cans
24 Davidson County Solid Waste Region Board

Waste & Recycling Characterization Study• Samples are sorted into 50 categories
• HHW - Latex Paint, Oil Paint, Weed and Pest Control, Used Oil/Filters, Other Automotive Fluids, Mercury-Containing Items, Sharps & Infectious Waste
• Textiles – Carpet, Carpet Padding, Clothing, Other Textiles
Clothing
Sharps
25 Davidson County Solid Waste Region Board
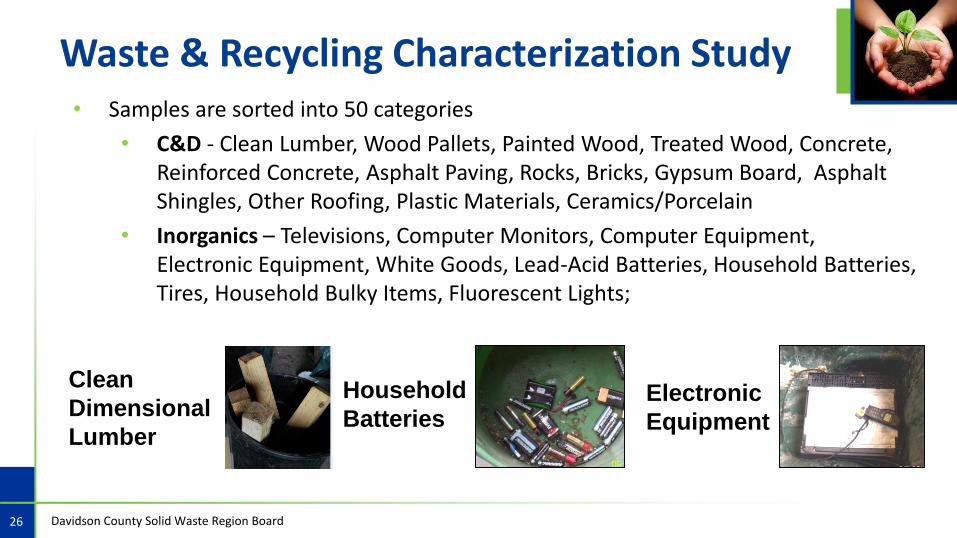
Waste & Recycling Characterization Study• Samples are sorted into 50 categories
• C&D - Clean Lumber, Wood Pallets, Painted Wood, Treated Wood, Concrete, Reinforced Concrete, Asphalt Paving, Rocks, Bricks, Gypsum Board, Asphalt Shingles, Other Roofing, Plastic Materials, Ceramics/Porcelain
• Inorganics – Televisions, Computer Monitors, Computer Equipment, Electronic Equipment, White Goods, Lead-Acid Batteries, Household Batteries, Tires, Household Bulky Items, Fluorescent Lights;
Electronic
Equipment
Household
Batteries
Clean
Dimensional
Lumber
26 Davidson County Solid Waste Region Board
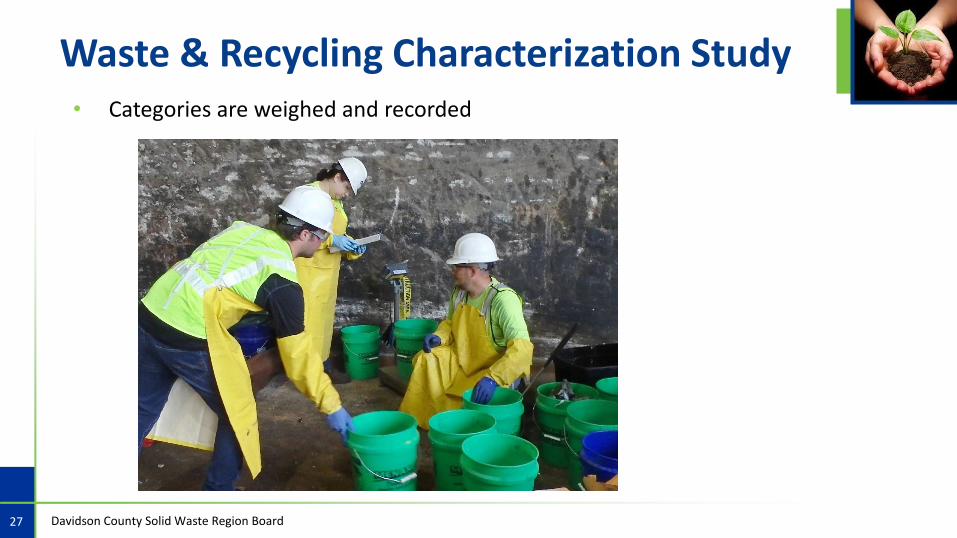
Waste & Recycling Characterization Study• Categories are weighed and recorded
27 Davidson County Solid Waste Region Board
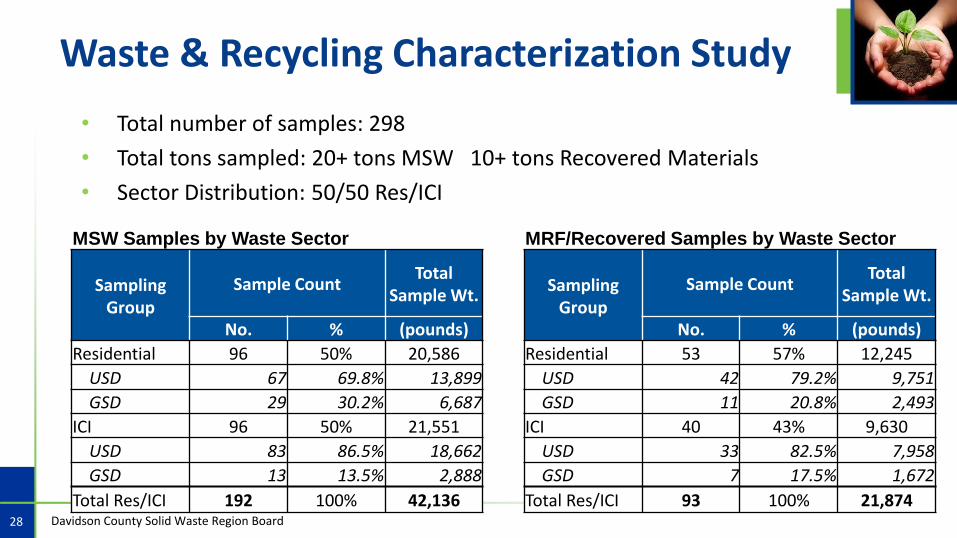
Waste & Recycling Characterization Study
• Total number of samples: 298
• Total tons sampled: 20+ tons MSW 10+ tons Recovered Materials
• Sector Distribution: 50/50 Res/ICI
MSW Samples by Waste Sector
Sampling Group
Sample CountTotal
Sample Wt.
No. % (pounds)
Residential 96 50% 20,586
USD 67 69.8% 13,899
GSD 29 30.2% 6,687
ICI 96 50% 21,551
USD 83 86.5% 18,662
GSD 13 13.5% 2,888
Total Res/ICI 192 100% 42,136
MRF/Recovered Samples by Waste Sector
Sampling Group
Sample CountTotal
Sample Wt.
No. % (pounds)
Residential 53 57% 12,245
USD 42 79.2% 9,751
GSD 11 20.8% 2,493
ICI 40 43% 9,630
USD 33 82.5% 7,958
GSD 7 17.5% 1,672
Total Res/ICI 93 100% 21,87428 Davidson County Solid Waste Region Board

Waste Characterization Study• Summer vs Fall Results: Residential Landfilled Waste
Summer Fall
29 Davidson County Solid Waste Region Board

Recycling Characterization Study• Summer vs Fall Results: Residential Recovered Waste
Summer Fall
30 Davidson County Solid Waste Region Board

Waste Characterization Study• Summer vs Fall Results: ICI Landfilled Waste
Summer Fall
31 Davidson County Solid Waste Region Board

Waste & Recycling Characterization Study• Summer vs Fall Results: ICI Recyclables
Summer Fall
32 Davidson County Solid Waste Region Board
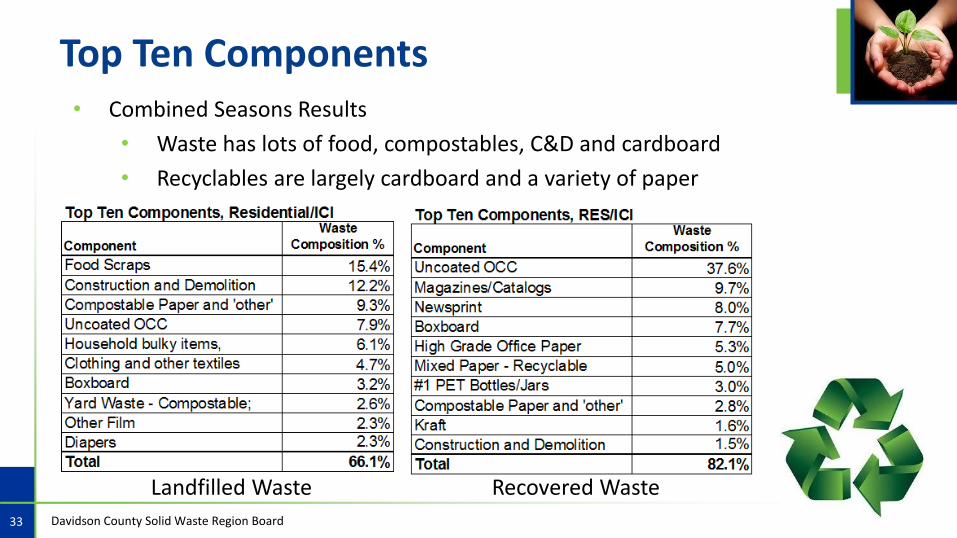
Top Ten Components • Combined Seasons Results
• Waste has lots of food, compostables, C&D and cardboard
• Recyclables are largely cardboard and a variety of paper
Landfilled Waste Recovered Waste
33 Davidson County Solid Waste Region Board
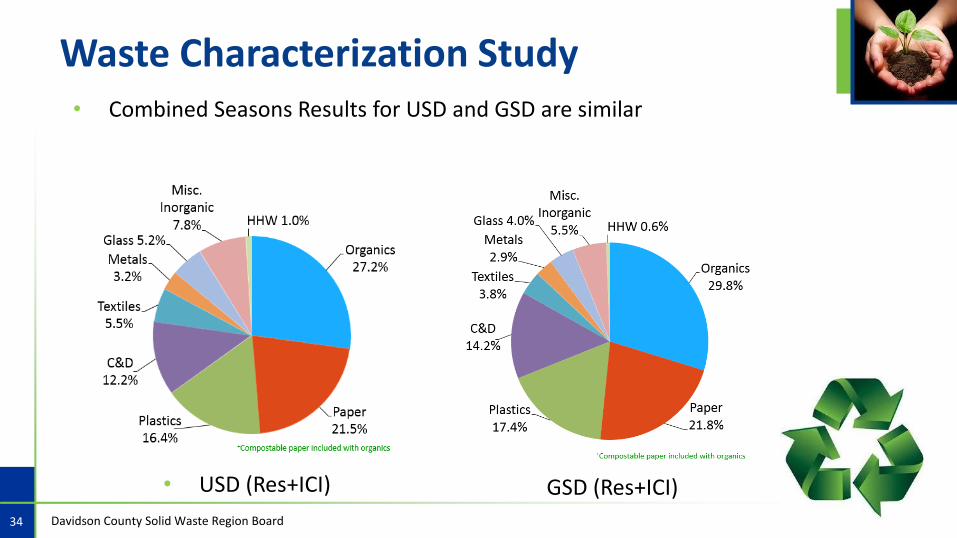
Waste Characterization Study• Combined Seasons Results for USD and GSD are similar
• USD (Res+ICI) GSD (Res+ICI)
34 Davidson County Solid Waste Region Board
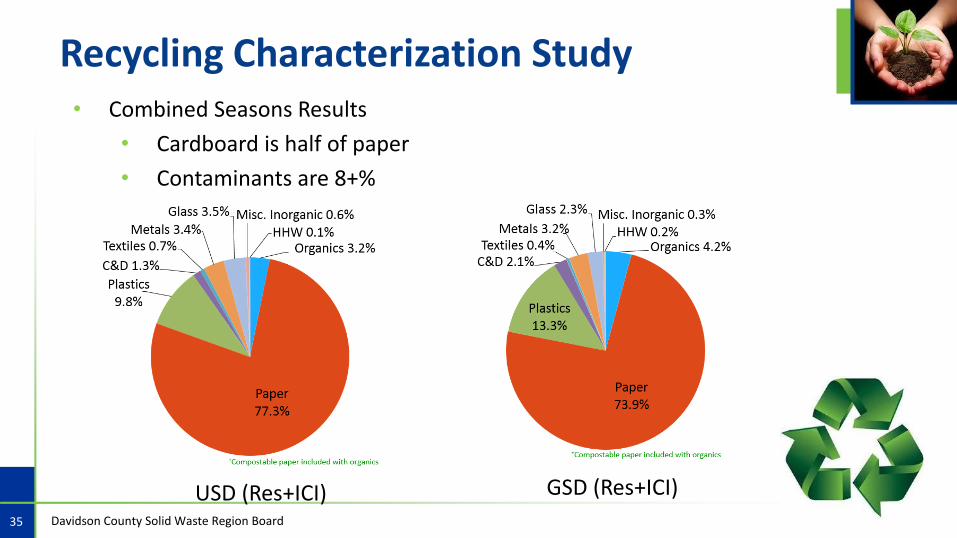
Recycling Characterization Study• Combined Seasons Results
• Cardboard is half of paper
• Contaminants are 8+%
USD (Res+ICI) GSD (Res+ICI)
35 Davidson County Solid Waste Region Board
*
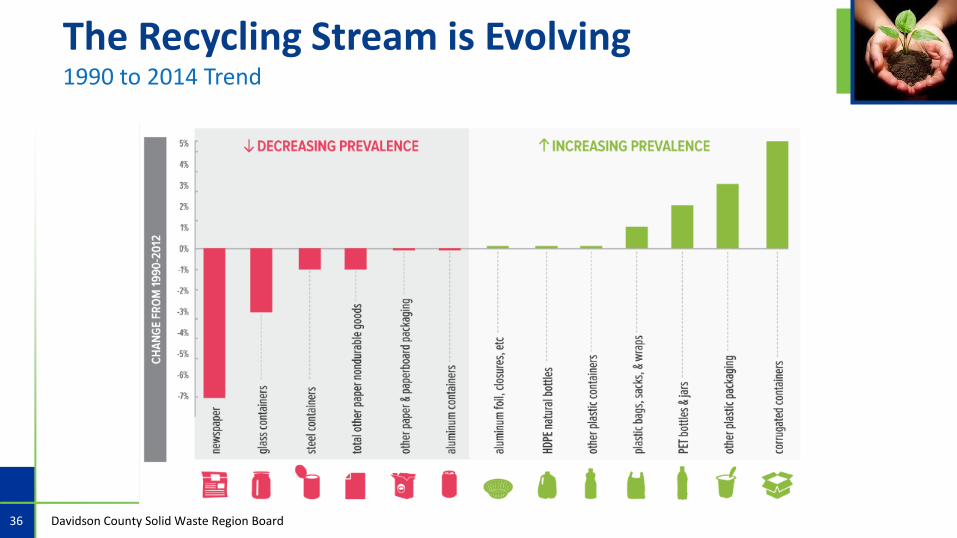
The Recycling Stream is Evolving 1990 to 2014 Trend
Davidson County Solid Waste Region Board36
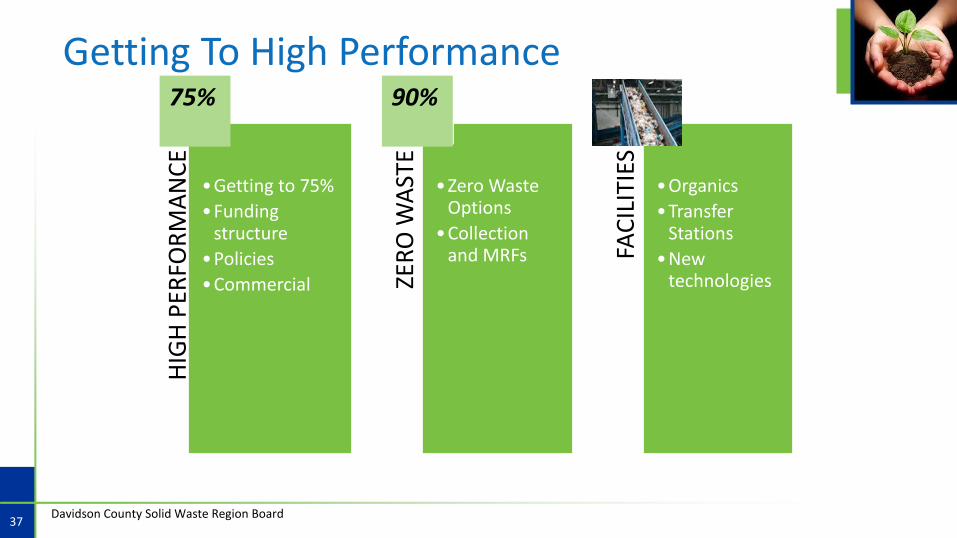
Getting To High Performance
37Davidson County Solid Waste Region Board
HIG
H P
ERFO
RM
AN
CE
•Getting to 75%
•Funding structure
•Policies
•Commercial ZER
O W
AST
E
•Zero Waste Options
•Collection and MRFs FA
CIL
ITIE
S
•Organics
•Transfer Stations
•New technologies
75% 90%

• Inventory of strategies from leading national and international communities• Policies, mandates, incentives, metrics, reporting, etc.
• Multi-step screening process• Key criteria for Nashville
• Pass/fail score;
• Potential performance scale from very high to very low
• Next step for best options • Tonnage estimates, cost, funding analysis, implementation
needs
Identification of Leading Policies
Davidson County Solid Waste Region Board38
Criteria Used:• Diversion• Cost to City• Generator cost• GSD/USD Suitability• Sector suitability• Existing infrastructure• Fundability• Proven• Sustainability• Equity between groups• Target materials• Fatal Flaws

• Highest Scoring Policy Concept(s):
• SAYT Area-wide
• Enforce and Expand Existing Bans
• Mandatory Recycling
• Targeted mandatory food scraps
• ABC Law
• Transparent Billing / Bidding Info
• Surcharges / Tax Concessions
• Small Business Strategies
• Downtown Alleys Program
High Commercial Sector Concepts
Davidson County Solid Waste Region Board39
Opportunities
• Significant divertible tonnage available • Opportunity / (need) to manage costs • Potential inefficiencies• Set policy• Improve equity
Challenges
• Mix of services with USD/GSD• Resistance to change• Limited experience in this sector• Business-based barriers• Funding
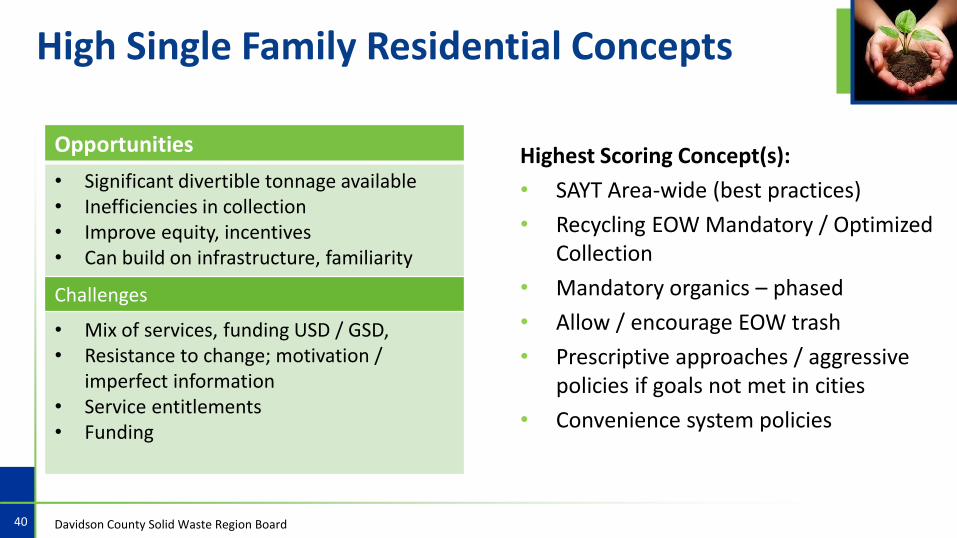
Highest Scoring Concept(s):
• SAYT Area-wide (best practices)
• Recycling EOW Mandatory / Optimized Collection
• Mandatory organics – phased
• Allow / encourage EOW trash
• Prescriptive approaches / aggressive policies if goals not met in cities
• Convenience system policies
High Single Family Residential Concepts
Davidson County Solid Waste Region Board40
Opportunities
• Significant divertible tonnage available • Inefficiencies in collection• Improve equity, incentives• Can build on infrastructure, familiarity
Challenges
• Mix of services, funding USD / GSD, • Resistance to change; motivation /
imperfect information• Service entitlements• Funding
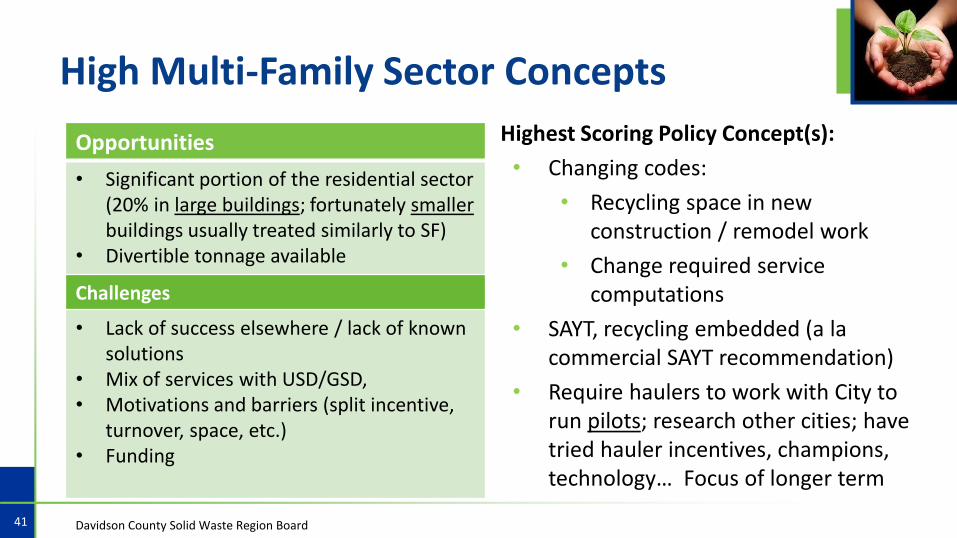
• Highest Scoring Policy Concept(s):
• Changing codes:
• Recycling space in new construction / remodel work
• Change required service computations
• SAYT, recycling embedded (a la commercial SAYT recommendation)
• Require haulers to work with City to run pilots; research other cities; have tried hauler incentives, champions, technology… Focus of longer term
High Multi-Family Sector Concepts
Davidson County Solid Waste Region Board41
Opportunities
• Significant portion of the residential sector (20% in large buildings; fortunately smaller buildings usually treated similarly to SF)
• Divertible tonnage available
Challenges
• Lack of success elsewhere / lack of known solutions
• Mix of services with USD/GSD, • Motivations and barriers (split incentive,
turnover, space, etc.)• Funding
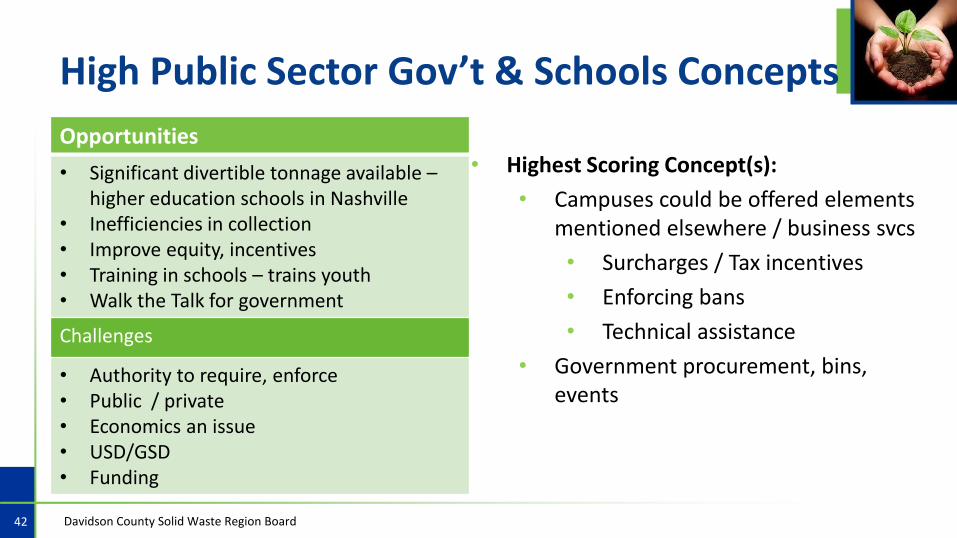
• Highest Scoring Concept(s):
• Campuses could be offered elements mentioned elsewhere / business svcs
• Surcharges / Tax incentives
• Enforcing bans
• Technical assistance
• Government procurement, bins, events
High Public Sector Gov’t & Schools Concepts
Davidson County Solid Waste Region Board42
Opportunities
• Significant divertible tonnage available –higher education schools in Nashville
• Inefficiencies in collection• Improve equity, incentives• Training in schools – trains youth • Walk the Talk for government
Challenges
• Authority to require, enforce• Public / private• Economics an issue• USD/GSD • Funding
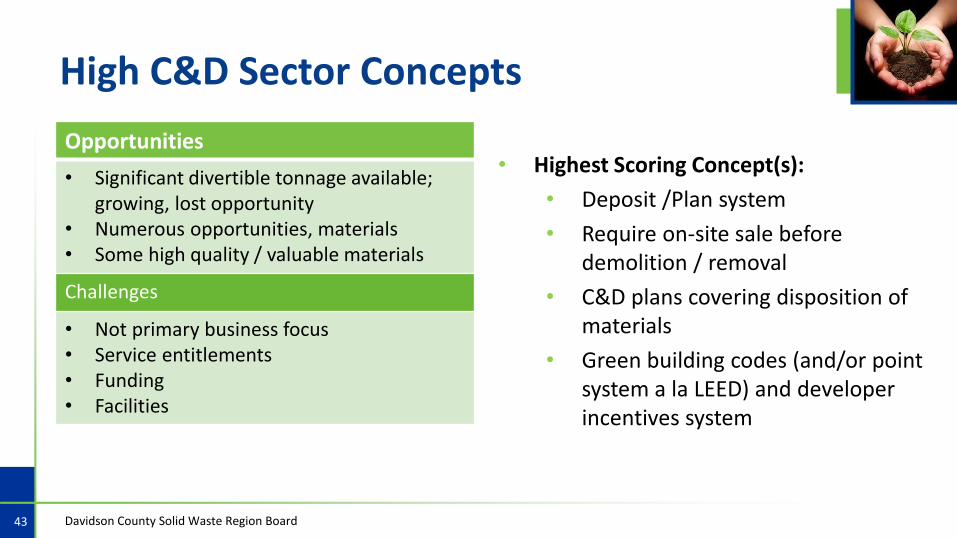
• Highest Scoring Concept(s):
• Deposit /Plan system
• Require on-site sale before demolition / removal
• C&D plans covering disposition of materials
• Green building codes (and/or point system a la LEED) and developer incentives system
High C&D Sector Concepts
Davidson County Solid Waste Region Board43
Opportunities
• Significant divertible tonnage available;growing, lost opportunity
• Numerous opportunities, materials• Some high quality / valuable materials
Challenges
• Not primary business focus• Service entitlements• Funding• Facilities

Moving on to Zero Waste
44 Davidson County Solid Waste Region Board
HIG
H P
ERFO
RM
AN
CE •Getting to
70/75%
•Funding / financial structure
•Policies / mandates
•Commercial
ZER
O W
AST
E •Zero Waste Options
•Also discuss Collection and advanced recycling
FAC
ILIT
IES •Capacity and
expansion
•New technologies
75% 90%
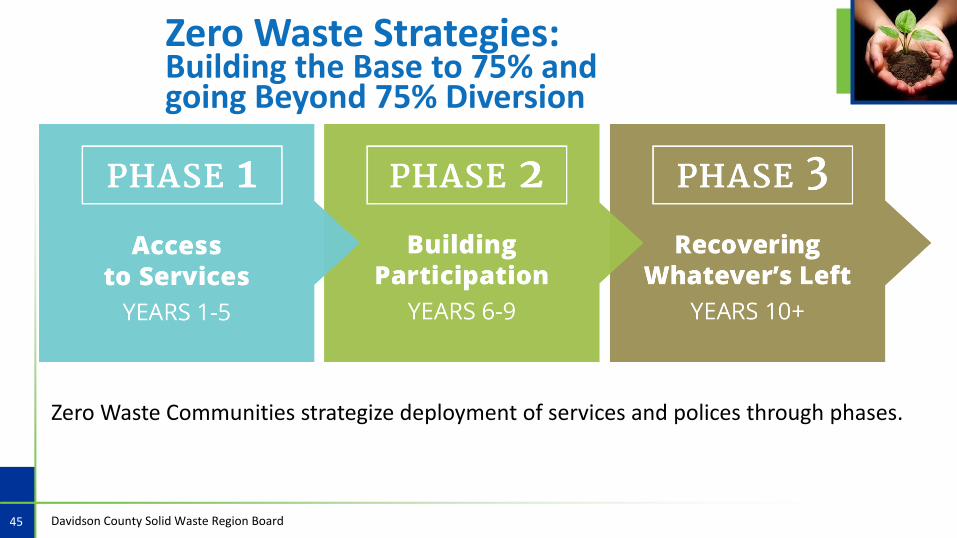
Zero Waste Strategies:Building the Base to 75% and going Beyond 75% Diversion
Davidson County Solid Waste Region Board
Zero Waste Communities strategize deployment of services and polices through phases.
45
• Political Leadership• Establishment of Zero Waste plan, goals and benchmarks with funding
support
• Vision/Mission• Practices Highest and Best Use hierarchy
• Policies/Ordinances• Construction recycled content ordinance
• Implementation Direction• Recycling economic development focus to support local recycling
infrastructure
Zero Waste Strategies:Going Beyond 75% Diversion
Davidson County Solid Waste Region Board46

Evaluation of Program Strategies for Zero Waste
• Residential solid waste collection franchise• Standard service delivery across all service providers• Lower collection and disposal costs from efficiencies and competition for
long term contracts• Leverage technology
• Recyclable materials processing and marketing• MRF for recyclables processing and marketing of curbside and commercial
recyclables• Process recycled materials to the highest value and share the revenue from
end markets (Regional MRF)
• Wet/Dry collection systems (two-can collection system):• One can for Organics (wet) including yard trimmings and food waste• One can for Recyclables (dry) including current and expanded list of
recyclables• No trash can
Davidson County Solid Waste Region Board47

Important Supporting Components of Zero Waste
• Citizen convenience center drop-off recycling• Important part of overall system (equity, access)
• Public space recycling• Demonstrates consistency in messaging to public / citizens• explore new options for Expanded away-from-home recycling
• Public education and outreach• High quality education and outreach efforts can boost collection and
reduce contamination• Focus on motivation and addressing barriers, recycling awareness – Social
marketing and targeted market research
• Strategies to contribute to the sustainability of long term collection programs
Davidson County Solid Waste Region Board48
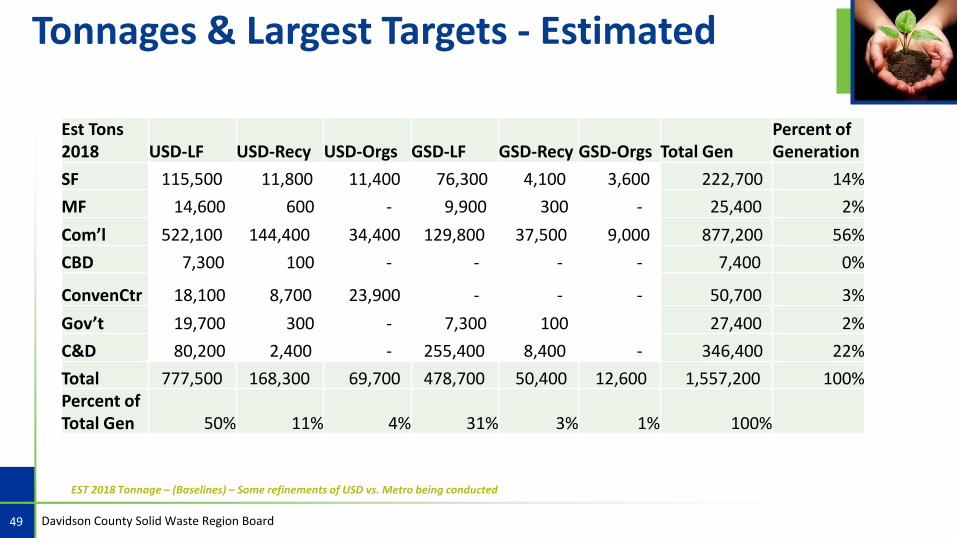
Tonnages & Largest Targets - Estimated
EST 2018 Tonnage – (Baselines) – Some refinements of USD vs. Metro being conducted
49 Davidson County Solid Waste Region Board
Est Tons 2018 USD-LF USD-Recy USD-Orgs GSD-LF GSD-Recy GSD-Orgs Total Gen
Percent of Generation
SF 115,500 11,800 11,400 76,300 4,100 3,600 222,700 14%
MF 14,600 600 - 9,900 300 - 25,400 2%
Com’l 522,100 144,400 34,400 129,800 37,500 9,000 877,200 56%
CBD 7,300 100 - - - - 7,400 0%
ConvenCtr 18,100 8,700 23,900 - - - 50,700 3%
Gov’t 19,700 300 - 7,300 100 27,400 2%
C&D 80,200 2,400 - 255,400 8,400 - 346,400 22%
Total 777,500 168,300 69,700 478,700 50,400 12,600 1,557,200 100%Percent of Total Gen 50% 11% 4% 31% 3% 1% 100%
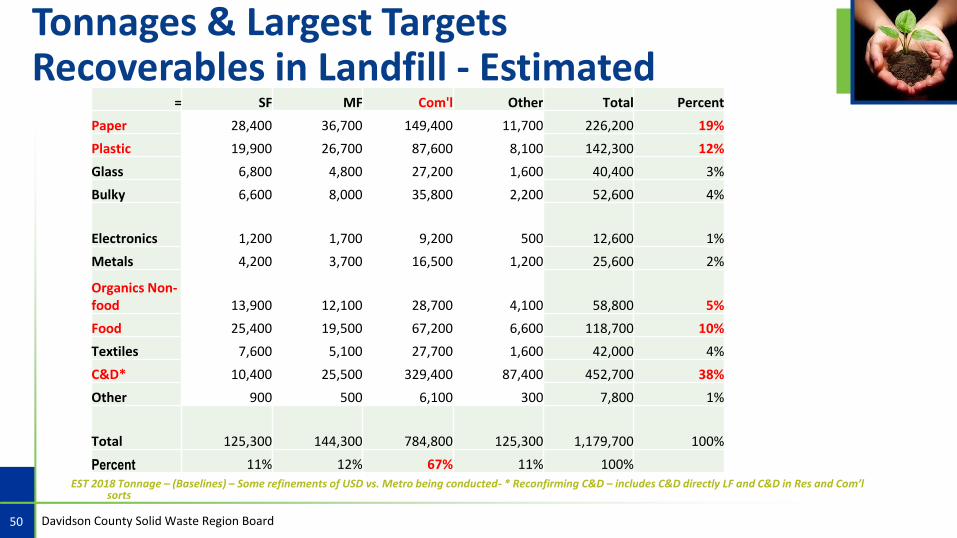
Tonnages & Largest TargetsRecoverables in Landfill - Estimated
= SF MF Com'l Other Total Percent
Paper 28,400 36,700 149,400 11,700 226,200 19%
Plastic 19,900 26,700 87,600 8,100 142,300 12%
Glass 6,800 4,800 27,200 1,600 40,400 3%
Bulky 6,600 8,000 35,800 2,200 52,600 4%
Electronics 1,200 1,700 9,200 500 12,600 1%
Metals 4,200 3,700 16,500 1,200 25,600 2%
Organics Non-food 13,900 12,100 28,700 4,100 58,800 5%
Food 25,400 19,500 67,200 6,600 118,700 10%
Textiles 7,600 5,100 27,700 1,600 42,000 4%
C&D* 10,400 25,500 329,400 87,400 452,700 38%
Other 900 500 6,100 300 7,800 1%
Total 125,300 144,300 784,800 125,300 1,179,700 100%
Percent 11% 12% 67% 11% 100%
EST 2018 Tonnage – (Baselines) – Some refinements of USD vs. Metro being conducted- * Reconfirming C&D – includes C&D directly LF and C&D in Res and Com’l sorts
50 Davidson County Solid Waste Region Board
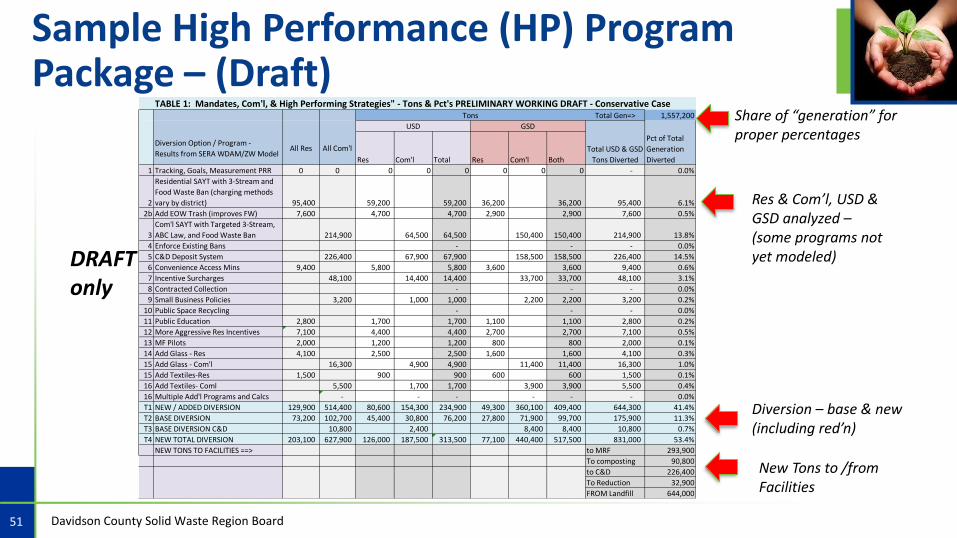
Sample High Performance (HP) Program Package – (Draft)
51 Davidson County Solid Waste Region Board
Share of “generation” for proper percentages
Res & Com’l, USD & GSD analyzed –(some programs not yet modeled)
Diversion – base & new (including red’n)
New Tons to /from Facilities
DRAFTonly
TABLE 1: Mandates, Com'l, & High Performing Strategies" - Tons & Pct's PRELIMINARY WORKING DRAFT - Conservative CaseTons Total Gen=> 1,557,200
USD GSD
Diversion Option / Program -
Results from SERA WDAM/ZW ModelAll Res All Com'l
Res Com'l Total Res Com'l Both
Total USD & GSD
Tons Diverted
Pct of Total
Generation
Diverted
1 Tracking, Goals, Measurement PRR 0 0 0 0 0 0 0 0 - 0.0%
2
Residential SAYT with 3-Stream and
Food Waste Ban (charging methods
vary by district) 95,400 59,200 59,200 36,200 36,200 95,400 6.1%
2b Add EOW Trash (improves FW) 7,600 4,700 4,700 2,900 2,900 7,600 0.5%
3
Com'l SAYT with Targeted 3-Stream,
ABC Law, and Food Waste Ban 214,900 64,500 64,500 150,400 150,400 214,900 13.8%
4 Enforce Existing Bans - - - 0.0%
5 C&D Deposit System 226,400 67,900 67,900 158,500 158,500 226,400 14.5%
6 Convenience Access Mins 9,400 5,800 5,800 3,600 3,600 9,400 0.6%
7 Incentive Surcharges 48,100 14,400 14,400 33,700 33,700 48,100 3.1%
8 Contracted Collection - - - 0.0%
9 Small Business Policies 3,200 1,000 1,000 2,200 2,200 3,200 0.2%
10 Public Space Recycling - - - 0.0%
11 Public Education 2,800 1,700 1,700 1,100 1,100 2,800 0.2%
12 More Aggressive Res Incentives 7,100 4,400 4,400 2,700 2,700 7,100 0.5%
13 MF Pilots 2,000 1,200 1,200 800 800 2,000 0.1%
14 Add Glass - Res 4,100 2,500 2,500 1,600 1,600 4,100 0.3%
15 Add Glass - Com'l 16,300 4,900 4,900 11,400 11,400 16,300 1.0%
15 Add Textiles-Res 1,500 900 900 600 600 1,500 0.1%
16 Add Textiles- Coml 5,500 1,700 1,700 3,900 3,900 5,500 0.4%
16 Multiple Add'l Programs and Calcs - - - - - - 0.0%
T1 NEW / ADDED DIVERSION 129,900 514,400 80,600 154,300 234,900 49,300 360,100 409,400 644,300 41.4%
T2 BASE DIVERSION 73,200 102,700 45,400 30,800 76,200 27,800 71,900 99,700 175,900 11.3%
T3 BASE DIVERSION C&D 10,800 2,400 8,400 8,400 10,800 0.7%
T4 NEW TOTAL DIVERSION 203,100 627,900 126,000 187,500 313,500 77,100 440,400 517,500 831,000 53.4%
NEW TONS TO FACILITIES ==> to MRF 293,900
To composting 90,800
to C&D 226,400
To Reduction 32,900
FROM Landfill 644,000

Facilities
52 Davidson County Solid Waste Region Board
HIG
H P
ERFO
RM
AN
CE •Getting to
70/75%
•Funding / financial structure
•Policies / mandates
•Commercial
ZER
O W
AST
E •Zero Waste Options
•Also discuss Collection and advanced recycling
FAC
ILIT
IES •Capacity and
expansion
•New technologies
75% 90%
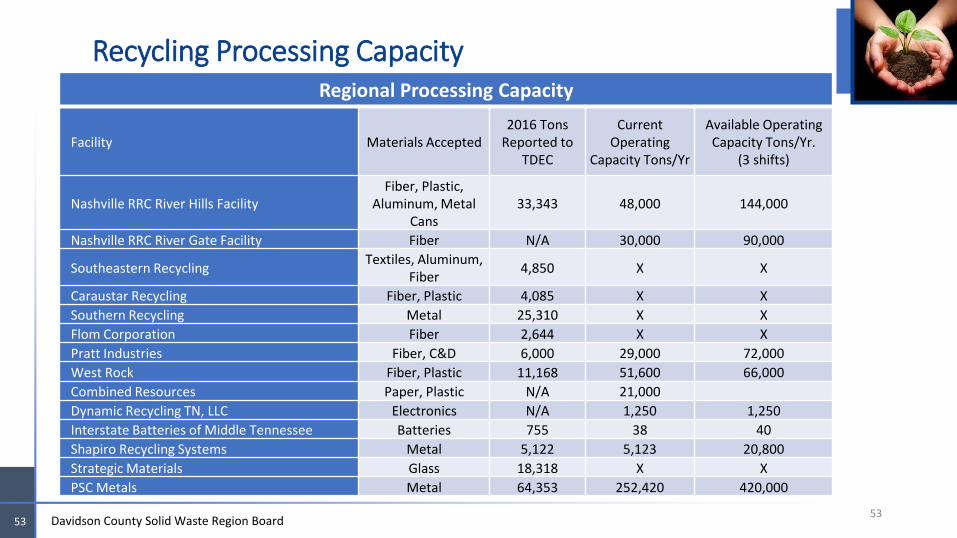
Recycling Processing Capacity
53
Regional Processing Capacity
Facility Materials Accepted2016 Tons
Reported to TDEC
Current Operating
Capacity Tons/Yr
Available Operating Capacity Tons/Yr.
(3 shifts)
Nashville RRC River Hills FacilityFiber, Plastic,
Aluminum, Metal Cans
33,343 48,000 144,000
Nashville RRC River Gate Facility Fiber N/A 30,000 90,000
Southeastern RecyclingTextiles, Aluminum,
Fiber4,850 X X
Caraustar Recycling Fiber, Plastic 4,085 X X
Southern Recycling Metal 25,310 X X
Flom Corporation Fiber 2,644 X X
Pratt Industries Fiber, C&D 6,000 29,000 72,000
West Rock Fiber, Plastic 11,168 51,600 66,000
Combined Resources Paper, Plastic N/A 21,000
Dynamic Recycling TN, LLC Electronics N/A 1,250 1,250
Interstate Batteries of Middle Tennessee Batteries 755 38 40
Shapiro Recycling Systems Metal 5,122 5,123 20,800
Strategic Materials Glass 18,318 X X
PSC Metals Metal 64,353 252,420 420,000
Davidson County Solid Waste Region Board53
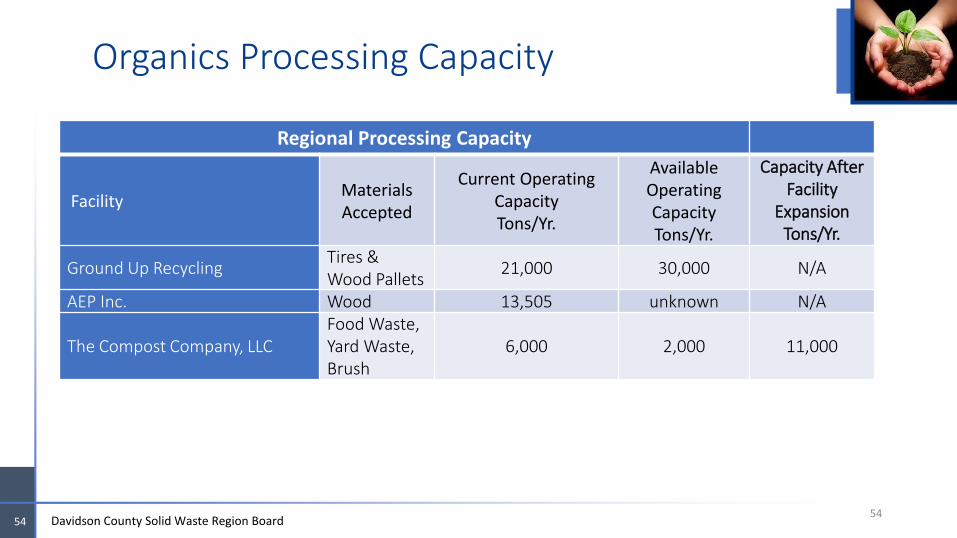
Organics Processing Capacity
54
Regional Processing Capacity
FacilityMaterials Accepted
Current Operating Capacity Tons/Yr.
Available Operating Capacity Tons/Yr.
Capacity After Facility
ExpansionTons/Yr.
Ground Up Recycling Tires & Wood Pallets
21,000 30,000 N/A
AEP Inc. Wood 13,505 unknown N/A
The Compost Company, LLCFood Waste, Yard Waste, Brush
6,000 2,000 11,000
Davidson County Solid Waste Region Board54
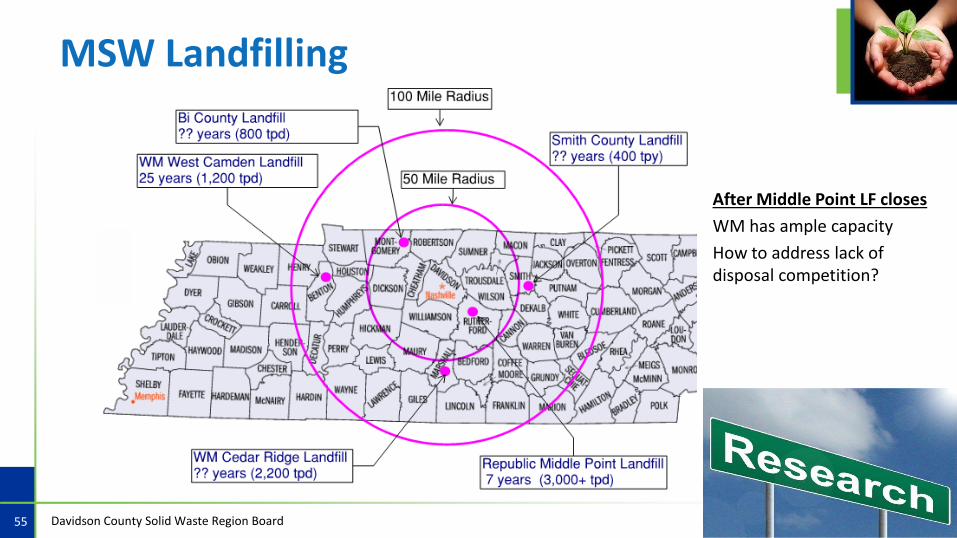
MSW Landfilling
Davidson County Solid Waste Region Board55
After Middle Point LF closes
WM has ample capacity
How to address lack of disposal competition?

Working with Metro Planning Department and Public Property Division to identify potential sites:
• Easy access to major roadways
• Heavy industrial zoned area
• Located outside 100-year floodplain
56
High Level Siting Guidelines for Processing Facilities
Davidson County Solid Waste Region Board
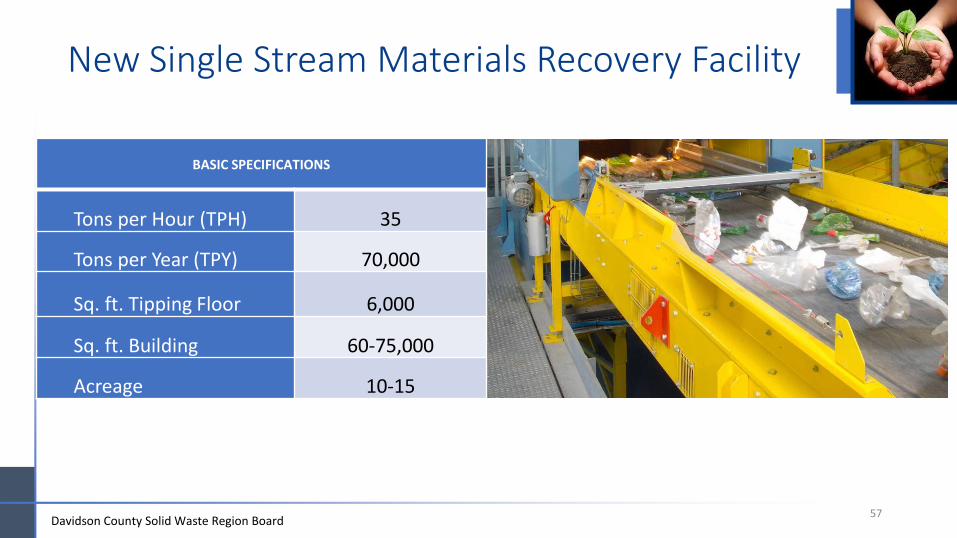
New Single Stream Materials Recovery Facility
57
BASIC SPECIFICATIONS
Tons per Hour (TPH) 35
Tons per Year (TPY) 70,000
Sq. ft. Tipping Floor 6,000
Sq. ft. Building 60-75,000
Acreage 10-15
Davidson County Solid Waste Region Board
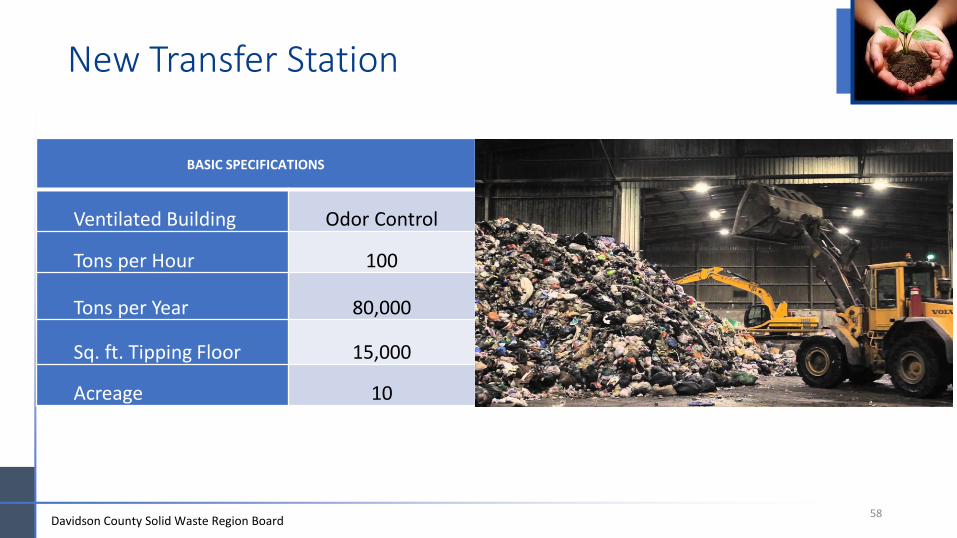
New Transfer Station
58
BASIC SPECIFICATIONS
Ventilated Building Odor Control
Tons per Hour 100
Tons per Year 80,000
Sq. ft. Tipping Floor 15,000
Acreage 10
Davidson County Solid Waste Region Board
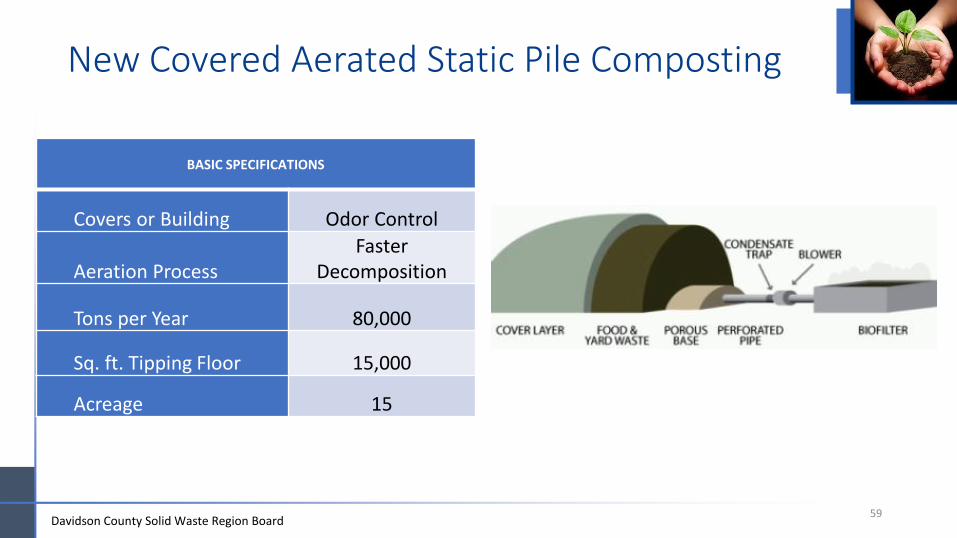
New Covered Aerated Static Pile Composting
59
BASIC SPECIFICATIONS
Covers or Building Odor Control
Aeration ProcessFaster
Decomposition
Tons per Year 80,000
Sq. ft. Tipping Floor 15,000
Acreage 15
Davidson County Solid Waste Region Board
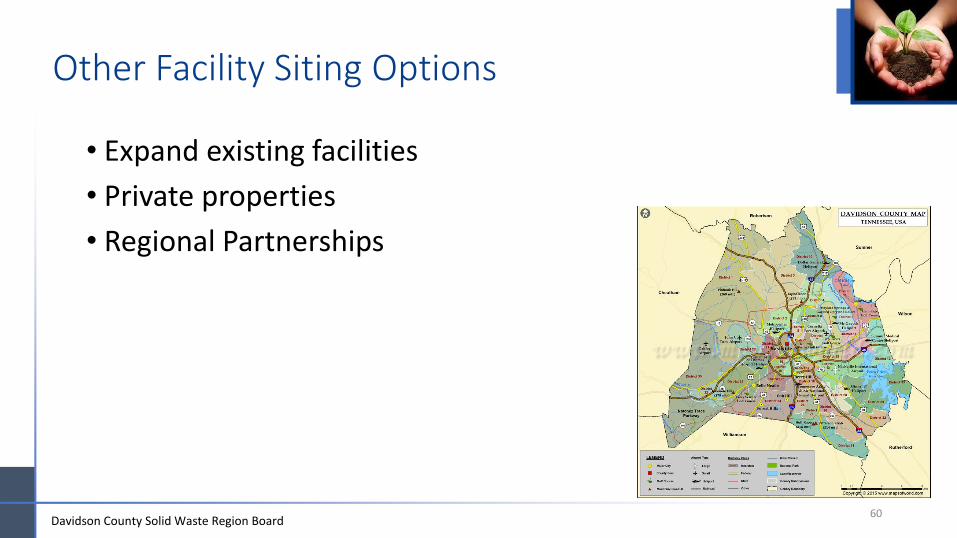
• Expand existing facilities
• Private properties
• Regional Partnerships
60
Other Facility Siting Options
Davidson County Solid Waste Region Board

Solid Waste Fund Structure
• Waste Management Program Funds• Solid Waste Operations – Special Revenue Fund• Solid Waste Grant – Special Purpose Fund• Tire Waste Grant – Special Purpose Fund
• Special Revenue Fund• Required by Solid Waste Management Act for municipal garbage services • Does not generate enough revenue to cover all expenses.• Any new fees charged under this fund must benefit the entire fee base
• Prior Landfill Enterprise Fund• Brush and recycling service are legacy services that were not part of the original
tax base.
Davidson County Solid Waste Region Board61
Solid Waste Fund Structure
• Program Revenue Sources – 22% of operating revenues• FY18 budget = $5,500,000• Waste generation fees • Convenience center fees• Sale of Recyclables
• General Fund Transfers – 78% of operating revenues• FY18 budget accounts for approx. $20,000,000 • USD – 71%• GSD – 29% • Funding levels subject to annual budget process
Davidson County Solid Waste Region Board62
Funding Structure Challenges
• General Fund limitations• Metro Charter doesn’t allow separate charges for waste collection or
disposal
• Charter amendment required to implement new fees
• Lack of revenue generating facilities
• Funding options to consider• Countywide annual household fees• Self-funding programs • Public-private partnerships• Enterprise Fund
Davidson County Solid Waste Region Board63

On-going Solid Waste Master Plan Efforts
• Finalize residential and commercial statistical surveys and review support for strategies
• Continue working on tonnage diversion forecasts
• Crafting and optimizing “high performing” program portfolios designed to achieve 70-75% diversion • Assess tonnage and costs (city and generator) for strategies / portfolio• Provide net changes in tons to facilities to other tasks• Funding / financing• Metrics analysis
• Finalize evaluation of facility needs
Davidson County Solid Waste Region Board 64


![LEAD RECOVERY FROM CRYSTAL GLASS SOLID WASTES [1]](https://img.pdfslide.us/doc/110x75/620e96ff8b11e119db2bcde7/lead-recovery-from-crystal-glass-solid-wastes-1.jpg)