Embed Size (px)
Citation preview
* Corresponding author: [email protected]
Solid Waste Generation from Healthcare Facilities in Surabaya City Indonesia
Wilujeng A Susi1,*
, Damanhuri Enri2, and Mochammad Chaerul
2
1 Doctoral Student, Environmental Engineering Department, Institut Teknologi Bandung, Bandung, Indonesia 2 Environmental Engineering Department, Institut Teknologi Bandung, Bandung, Indonesia
Abstract. This research objective is to obtain information on solid waste generated by clinics, community
health centers and hospitals in Surabaya and its treatment. The waste generation information in each health
facilities is acquired by 5 day-sampling, while survey by questionnaire was performed to know how they
manage their waste as well as to get information on the number of beds and patients. The solid waste
consists of medical and non-medical/general waste. The medical waste generation is 163,9 tons/month
where 97,1% of it (158 tons/month) comes from hospitals. Community health centers and clinics contribute
1,1 tons/month and 3,5 tons/month, respectively. Only 29,6% of hospitals medical waste was treated with
onsite incinerators. As much as 66% of hospitals medical waste was not had incinerators, community health
centers and clinics 0,7% and 0,6% of the waste is treated with incinerator by third parties. Hospitals medical
waste from used packaging (1%) can be reused, while the treatment of 1,5% medical waste from clinics is
unknown. Non-medical waste generation is 431 tona/month, where 99,2% of it 427,5 tons/month comes
from hospitals. Community health centers and clinics generate 1,4 ton/month and 2,1 ton/month non-
medical waste, respectively.
1 Introduction
Health care facilities activities, research centers and
laboratories related to medical procedures produce health
care waste. In addition, it includes waste from “small” or
“spreading” sources such as waste from outpatient
treatments (such as dialysis, insulin injection, recovery
treatments). The waste consists of 75-90% waste that are
non-risk, harmless and resembles household waste, and
then the remaining of 10-25% is hazardous and causing
health and environmental risks [1]. Regulations related
to sustainable management of health care waste remain
unclear and there is no policy related to that matter.
However, there are
some recommendations related to health care waste start
from handling, collecting, transporting, treatment and
disposal [2]. The quantity of waste is the basic
information in a management plan. Sufficient and
accurate information about the quantity and composition
of waste is the key to implement waste management plan
successfully [3].
Indonesian Ministry of Environment and Forestry
Indonesia No.56 Year 2015 on the Technical Procedures
and Requirements for Management of Hazardous and
Toxic Waste Materials from Health Care Facilities
regulates hazardous solid waste in health service
facilities in Indonesia. It regulates waste from
minimizing and sorting, storing, transporting,
processing, and burying hazardous and toxic waste. The
Ministry of Health as an institution that regulates health
care facilities published regulations related to solid waste
management as part of Regulation of the Minister of
Health No. 7 of 2019 on hospital environmental health.
Surabaya is the second largest city in Indonesia, with
a large number of health service facilities to serve nearly
three million people. Therefore, the researcher calculated
the resulting solid waste to find management
recommendations for minimizing risks and improving
environmental quality. This study is to calculate the
amount of solid waste of health service facilities in
Surabaya in both medical and non-medical categories.
2 Material and Methods
The study location was in the health service facilities in
Surabaya, Indonesia, including community health
centers, clinics and hospitals. Data collection used
secondary data survey included the number of bed and
treated patients in each health service facility in a year,
which became the research sample: 16 health centers, 17
clinics, and 12 hospitals. Questionnaires related to how
to sort, store, solid waste transportation and treatment,
and direct observation during the waste sample
measurement revealed the solid waste management used.
There were two types of solid waste sample, namely
medical waste and non-medical or general waste.
Sample measurement took place during the five
working days in July-August 2017, using direct
, 0 0Web of Conferences https://doi.org/10.1051/e3sconf/20 06E3S 148 20142019
10 8010ETMC and RC EnvE
(2020) 6
© The Authors, published by EDP Sciences. This is an open access article distributed under the terms of the Creative Commons Attribution License 4.0 (http://creativecommons.org/licenses/by/4.0/).
weighing in the source of solid waste to determine waste
production in kg/bed/day or kg/patient/day. This study
used descriptive statistics. The number of patients in
health care facilities and the number of hospital beds was
obtained from secondary data from the Surabaya City
Health Office. The researcher used Microsoft Excel in
weighing data and other secondary data to determine the
mass balance of solid waste.
3 Results
3.1 Solid Waste Management of Health Care Facilities in Surabaya
Surabaya has an area of 33,306 hectares, with a
population of 2.9 million people and health care facilities
in the form of 62 Community Health Centers, 262 clinics
and 59 hospitals are divided into several hospital classes,
the number of bed is 8327 beds, in a day average served
4350 inpatients and 16700 outpatient.
Stages of solid waste management in hospitals were
minimizing and segregation, storage, transportation,
treatment and landfill. A fault in a particular stage would
disrupt the entire management system. The segregation
or sorting process divided waste into general waste and
medical waste. General waste is non-hazardous solid
waste from non-medical activities, while medical waste
is toxic and hazardous waste from medical activities.
Medical solid waste in hospitals came from the
outpatient or polyclinic services, laboratories, emergency
rooms, inpatient rooms, delivery rooms and
pharmaceutical warehouses. The waste is in the form of
used gauze swabs, syringes, tubes, catheters, gloves,
masks, bottles/ampoules, sanitary pads, cotton/bandages
contaminated with blood/body fluids, slide glasses,
lancet, and expired medicines. Health centers and clinics
served outpatients who produced the same medical solid
waste as the polyclinic services in the hospital.
Hazardous solid waste was contained in special colored
containers with special signs and symbols in medical
treatment rooms, then collected and stored in hospitals.
Hospitals had incinerators for burning waste,
surprisingly, only four hospitals had incineratorss and
they transport the residue to the next treatment by a third
party. Two hospitals managed the remaining packages
that are uncontaminated by blood, body fluids, and
infections, such as infused bottles and hemodialysis jerry
cans, with disinfection and enumeration to be recycled
plastic waste.
The medical waste generated by Surabaya’s health
facilities amounted to 0.953kg/bed/day for A class
hospitals, 0.824kg/bed/day for B class hospitals and
0.304 kg/bed/day for C class hospitals [4], clinical
medical waste was 0.07 kg/patient [5] whereas for the
community health center was 0.02 kg/patien[6].
The management of non-hazardous solid waste or
domestic waste included the leftovers of patients,
paramedic, employees, canteens, office activities and
kitchens for inpatients. There was a plastic bag for waste
in each room and the janitor collected it twice a day. The
janitor placed waste from each room in clinics and health
centers in containers or recycle bins in front of the
building. In addition, officers transported the waste to
the nearest garbage center owned by the government.
Officials of small hospitals collected waste to the nearest
waste center using cart or four-wheeled vehicles, while
large hospitals sent the waste directly to the final
processing site in Benowo, Surabaya. One hospital had
made an effort to recycle disaggregated plastic waste and
composting for food scraps and kitchen waste.
3.2 Solid Waste Balance of Health Care Facilities
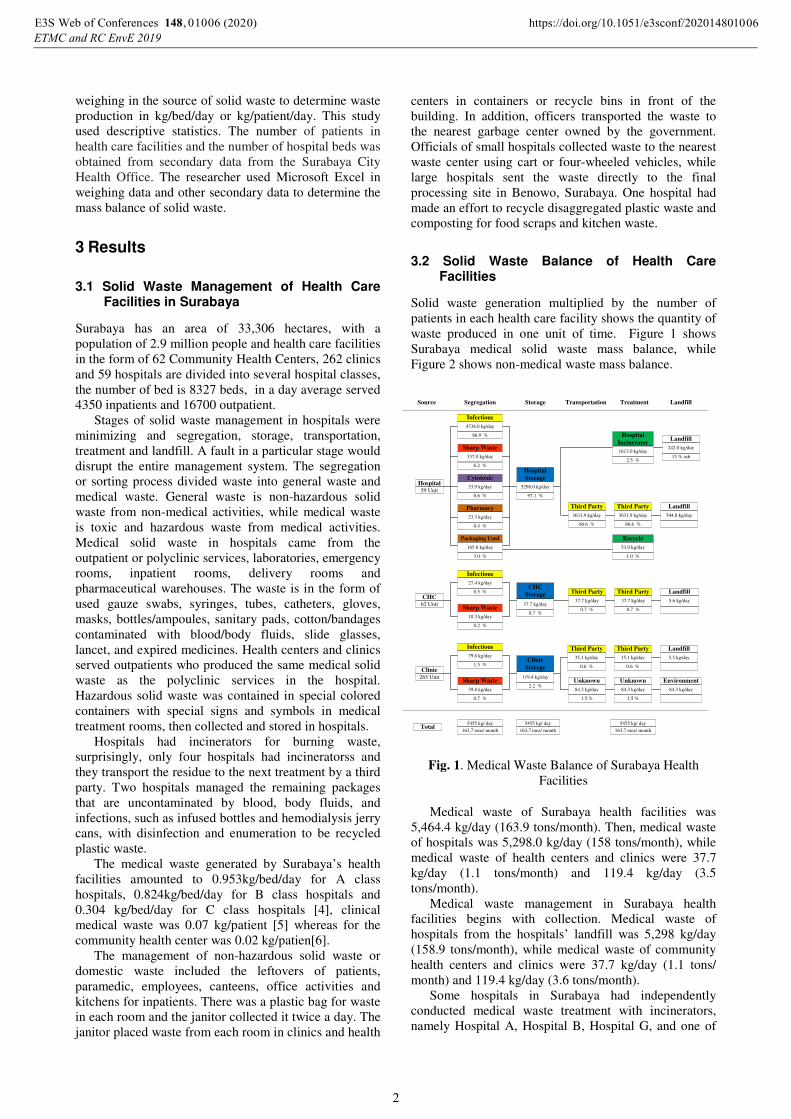
Solid waste generation multiplied by the number of
patients in each health care facility shows the quantity of
waste produced in one unit of time. Figure 1 shows
Surabaya medical solid waste mass balance, while
Figure 2 shows non-medical waste mass balance.
Fig. 1. Medical Waste Balance of Surabaya Health
Facilities
Medical waste of Surabaya health facilities was
5,464.4 kg/day (163.9 tons/month). Then, medical waste
of hospitals was 5,298.0 kg/day (158 tons/month), while
medical waste of health centers and clinics were 37.7
kg/day (1.1 tons/month) and 119.4 kg/day (3.5
tons/month).
Medical waste management in Surabaya health
facilities begins with collection. Medical waste of
hospitals from the hospitals’ landfill was 5,298 kg/day
(158.9 tons/month), while medical waste of community
health centers and clinics were 37.7 kg/day (1.1 tons/
month) and 119.4 kg/day (3.6 tons/month).
Some hospitals in Surabaya had independently
conducted medical waste treatment with incinerators,
namely Hospital A, Hospital B, Hospital G, and one of
Source Segregation Storage Transportation Treatment Landfill
Hospital59 Unit
CHC62 Unit
Clinic265 Unit
Infectious
4738.0 kg/day
86.9 %
Sharp Waste
337.0 kg/day
6.2 %
Cytotoxic
33.9 kg/day
0.6 %
Pharmacy
23.3 kg/day
0.4 %
Packaging Used
165.8 kg/day
3.0 %
Hospital
Storage
5298.0 kg/day
97.1 %
Third Party
3631.9 kg/day
66.6 %
Third Party
3631.9 kg/day
66.6 %
Hospital
Incinerator
1613.0 kg/day
2.5 %
Landfill
544.8 kg/day
Landfill
242.0 kg/day
15 % ash
Recycle
53.0 kg/day
1.0 %
Infectious
27.4 kg/day
0.5 %
Sharp Waste
10.3 kg/day
0.2 %
CHC
Storage
37.7 kg/day
0.7 %
Third Party
37.7 kg/day
0.7 %
Third Party
37.7 kg/day
0.7 %
Landfill
5.6 kg/day
Infectious
79.6 kg/day
1.5 %
Sharp Waste
39.8 kg/day
0.7 %
Clinic
Storage
119.4 kg/day
2.2 %
Third Party
35.1 kg/day
0.6 %
Third Party
35.1 kg/day
0.6 %
Landfill
5.3 kg/day
Environment
84.3 kg/day
Unknown
84.3 kg/day
1.5 %
Unknown
84.3 kg/day
1.5 %
Total5455 kg/ day
163,7 tons/ month
5455 kg/ day
163,7 tons/ month
5455 kg/ day
163,7 tons/ month
, 0 0Web of Conferences https://doi.org/10.1051/e3sconf/20 06E3S 148 20142019
10 8010ETMC and RC EnvE
(2020) 6
2
private hospitals with a processing capacity of 1,613
kg/day (108.9 tons/month). In addition, there was a
processing by recycling the remaining packages by
Hospital A by 53 kg/day (1.5 tons/month). Further,
medical waste management in clinics that was
cooperated with third parties and transported out of
Surabaya was 3,631.9 kg/day (109.0 tons/month).
Community health centers processed their medical
waste by third party and transported it out of Surabaya
by 37.7 kg/day (1.1 tons/month). Clinics conducted
medical waste treatment by transporting 35.1 kg/day (1.1
tons/month) of waste outside Surabaya by a third party.
Some clinics did not cooperate with third parties
(70.6%). Therefore, they transported and managed the
remaining waste by 84.3 kg/day (2.5 tons/month).
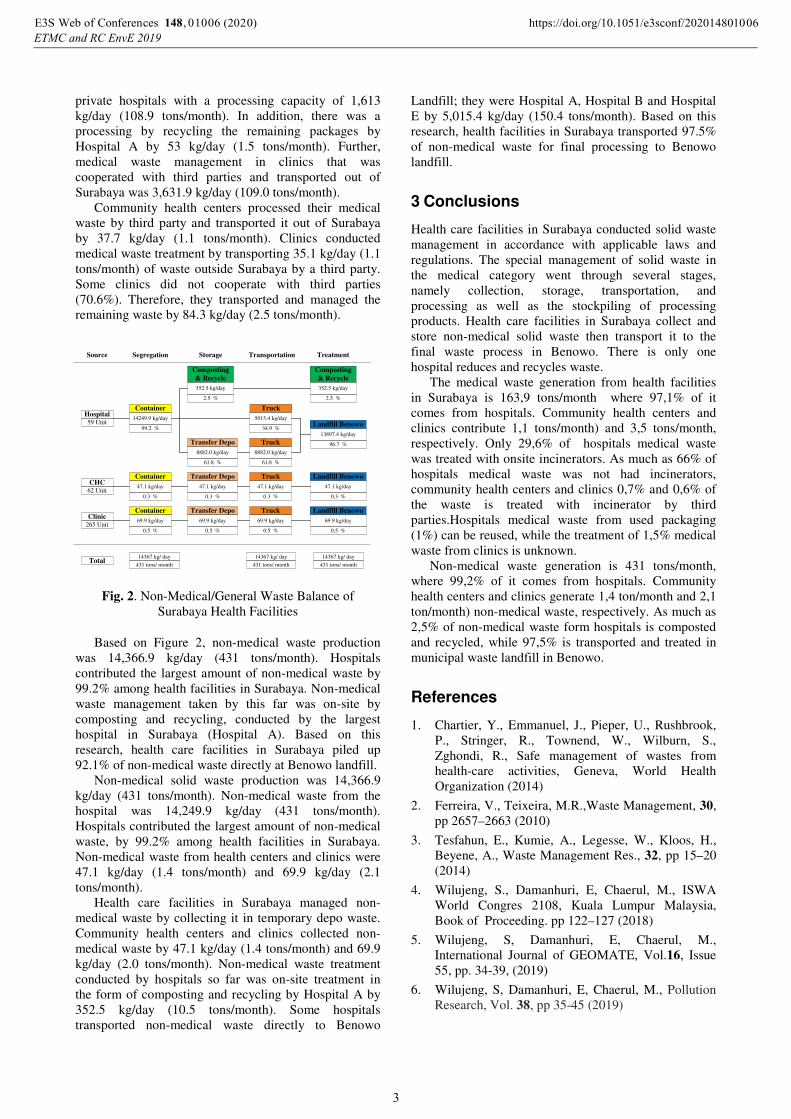
Fig. 2. Non-Medical/General Waste Balance of
Surabaya Health Facilities
Based on Figure 2, non-medical waste production
was 14,366.9 kg/day (431 tons/month). Hospitals
contributed the largest amount of non-medical waste by
99.2% among health facilities in Surabaya. Non-medical
waste management taken by this far was on-site by
composting and recycling, conducted by the largest
hospital in Surabaya (Hospital A). Based on this
research, health care facilities in Surabaya piled up
92.1% of non-medical waste directly at Benowo landfill.
Non-medical solid waste production was 14,366.9
kg/day (431 tons/month). Non-medical waste from the
hospital was 14,249.9 kg/day (431 tons/month).
Hospitals contributed the largest amount of non-medical
waste, by 99.2% among health facilities in Surabaya.
Non-medical waste from health centers and clinics were
47.1 kg/day (1.4 tons/month) and 69.9 kg/day (2.1
tons/month).
Health care facilities in Surabaya managed non-
medical waste by collecting it in temporary depo waste.
Community health centers and clinics collected non-
medical waste by 47.1 kg/day (1.4 tons/month) and 69.9
kg/day (2.0 tons/month). Non-medical waste treatment
conducted by hospitals so far was on-site treatment in
the form of composting and recycling by Hospital A by
352.5 kg/day (10.5 tons/month). Some hospitals
transported non-medical waste directly to Benowo
Landfill; they were Hospital A, Hospital B and Hospital
E by 5,015.4 kg/day (150.4 tons/month). Based on this
research, health facilities in Surabaya transported 97.5%
of non-medical waste for final processing to Benowo
landfill.
3 Conclusions
Health care facilities in Surabaya conducted solid waste
management in accordance with applicable laws and
regulations. The special management of solid waste in
the medical category went through several stages,
namely collection, storage, transportation, and
processing as well as the stockpiling of processing
products. Health care facilities in Surabaya collect and
store non-medical solid waste then transport it to the
final waste process in Benowo. There is only one
hospital reduces and recycles waste.
The medical waste generation from health facilities
in Surabaya is 163,9 tons/month where 97,1% of it
comes from hospitals. Community health centers and
clinics contribute 1,1 tons/month) and 3,5 tons/month,
respectively. Only 29,6% of hospitals medical waste
was treated with onsite incinerators. As much as 66% of
hospitals medical waste was not had incinerators,
community health centers and clinics 0,7% and 0,6% of
the waste is treated with incinerator by third
parties.Hospitals medical waste from used packaging
(1%) can be reused, while the treatment of 1,5% medical
waste from clinics is unknown.
Non-medical waste generation is 431 tons/month,
where 99,2% of it comes from hospitals. Community
health centers and clinics generate 1,4 ton/month and 2,1
ton/month) non-medical waste, respectively. As much as
2,5% of non-medical waste form hospitals is composted
and recycled, while 97,5% is transported and treated in
municipal waste landfill in Benowo.
References
1. Chartier, Y., Emmanuel, J., Pieper, U., Rushbrook,
P., Stringer, R., Townend, W., Wilburn, S.,
Zghondi, R., Safe management of wastes from
health-care activities, Geneva, World Health
Organization (2014)
2. Ferreira, V., Teixeira, M.R.,Waste Management, 30,
pp 2657–2663 (2010)
3. Tesfahun, E., Kumie, A., Legesse, W., Kloos, H.,
Beyene, A., Waste Management Res., 32, pp 15–20
(2014)
4. Wilujeng, S., Damanhuri, E, Chaerul, M., ISWA
World Congres 2108, Kuala Lumpur Malaysia,
Book of Proceeding. pp 122–127 (2018)
5. Wilujeng, S, Damanhuri, E, Chaerul, M.,
International Journal of GEOMATE, Vol.16, Issue
55, pp. 34-39, (2019)
6. Wilujeng, S, Damanhuri, E, Chaerul, M., Pollution
Research, Vol. 38, pp 35-45 (2019)
Source Segregation Storage Transportation Treatment
Hospital59 Unit
Container
14249.9 kg/day
99.2 %
Composting
& Recycle
352.5 kg/day
2.5 %
Truck
5015.4 kg/day
34.9 %
Truck
8882.0 kg/day
61.8 %
Truck
47.1 kg/day
0.3 %
Truck
69.9 kg/day
0.5 %
Transfer Depo
8882.0 kg/day
61.8 %
Transfer Depo
47.1 kg/day
0.3 %
Transfer Depo
69.9 kg/day
0.5 %
Container
47.1 kg/day
0.3 %
Container
69.9 kg/day
0.5 %
CHC62 Unit
Clinic265 Unit
Composting
& Recycle
352.5 kg/day
2.5 %
Landfill Benowo
13897.4 kg/day
96.7 %
Landfill Benowo
47.1 kg/day
0.3 %
Landfill Benowo
69.9 kg/day
0.5 %
Total14367 kg/ day
431 tons/ month
14367 kg/ day
431 tons/ month
14367 kg/ day
431 tons/ month
, 0 0Web of Conferences https://doi.org/10.1051/e3sconf/20 06E3S 148 20142019
10 8010ETMC and RC EnvE
(2020) 6
3