Embed Size (px)
Citation preview
Quarterly Report Q2 2018 18 July 2018
The global leader in door opening solutions
Solid underlying performance for ASSA ABLOY
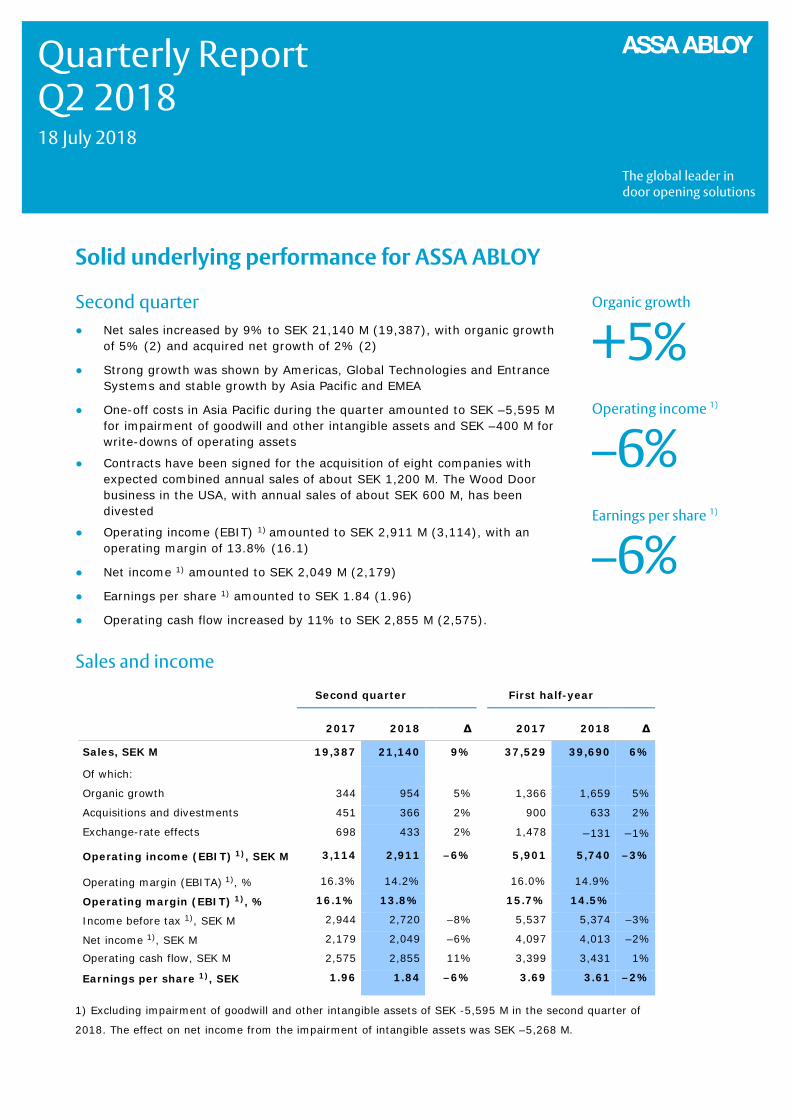
Second quarter ● Net sales increased by 9% to SEK 21,140 M (19,387), with organic growth
of 5% (2) and acquired net growth of 2% (2)
● Strong growth was shown by Americas, Global Technologies and Entrance Systems and stable growth by Asia Pacific and EMEA
● One-off costs in Asia Pacific during the quarter amounted to SEK –5,595 M for impairment of goodwill and other intangible assets and SEK –400 M for write-downs of operating assets
● Contracts have been signed for the acquisition of eight companies with expected combined annual sales of about SEK 1,200 M. The Wood Door business in the USA, with annual sales of about SEK 600 M, has been divested
● Operating income (EBIT) 1) amounted to SEK 2,911 M (3,114), with an operating margin of 13.8% (16.1)
● Net income 1) amounted to SEK 2,049 M (2,179)
● Earnings per share 1) amounted to SEK 1.84 (1.96)
● Operating cash flow increased by 11% to SEK 2,855 M (2,575).
Sales and income
Second quarter First half-year
2017 2018 Δ 2017 2018 Δ
Sales, SEK M 19,387 21,140 9% 37,529 39,690 6%
Of which:
Organic growth 344 954 5% 1,366 1,659 5%
Acquisitions and divestments 451 366 2% 900 633 2%
Exchange-rate effects 698 433 2% 1,478 –131 –1%
Operating income (EBIT) 1), SEK M 3,114 2,911 –6% 5,901 5,740 –3%
Operating margin (EBITA) 1), % 16.3% 14.2% 16.0% 14.9%
Operating margin (EBIT) 1), % 16.1% 13.8% 15.7% 14.5%
Income before tax 1), SEK M 2,944 2,720 –8% 5,537 5,374 –3%
Net income 1), SEK M 2,179 2,049 –6% 4,097 4,013 –2%
Operating cash flow, SEK M 2,575 2,855 11% 3,399 3,431 1%
Earnings per share 1), SEK 1.96 1.84 –6% 3.69 3.61 –2%
1) Excluding impairment of goodwill and other intangible assets of SEK -5,595 M in the second quarter of
2018. The effect on net income from the impairment of intangible assets was SEK –5,268 M.
Organic growth
+5% Operating income 1)
–6% Earnings per share 1)
–6%

© ASSA ABLOY – Quarterly Report Q2 2018 2 (21)
Comments by the President and CEO Strong organic sales growth in the quarter
The second quarter continued with strong organic growth of 5%. Organic growth was strong in Americas (9%), Global Technologies (6%) and Entrance Systems (6%), while Asia Pacific and EMEA reported stable organic sales growth of 2%.
The second quarter’s operating income declined by 6% year-on-year to SEK 2,911 M, corresponding to an operating margin of 13.8%. The Group’s adjusted operating income, excluding write-downs of operating assets of SEK –400 M, was SEK 3,311 M corresponding to a stable operating margin of 15.7%.
Operating cash flow was strong in the second quarter and increased by 11% to SEK 2,855 M. We are continuing with full focus on our current restructuring programs and, as previously announced, we expect to launch a new program by the end of 2018.
Strategic overview in China
Since the peak in 2014 we have been exposed to a general market decline in China. This decline has been particularly evident in the regions where we had our strongest market presence and we have had to adapt to the challenging market conditions.
The market situation in China continues to be difficult, as previously reported. We expect the operating margin to remain low in the Chinese market for the next few years and this has resulted in a required write-down of SEK 5,595 M for impairment of goodwill and other intangible assets. We also made provisions of SEK 400 M for receivables and inventory in the quarter.
After the events of 2016, our focus was internal and directed to stabilizing the organization. We are now building a focused China organization around our main brands: PanPan, Yale and ASSA ABLOY. China will remain very important to us, and we remain firmly committed to the market. In China we are now seeing continued urbanization, a growing aftermarket for our products, and increasing demand for more advanced security solutions. We are convinced that with our new business strategy in place China will give us good returns in the longer term.
Our innovation recognized
I am very proud and pleased to see that ASSA ABLOY is again on the Forbes list of the top 100 most innovative companies in the world. I am convinced that our strong focus on innovation in both products and processes is the best way for us to continue to be the leader in our industry.
We have the right people and the right culture to make a difference and the organization’s ability to innovate is clearly reflected in the strong demand for our new products.
Stockholm, 18 July 2018
Nico Delvaux President and CEO
10,000
20,000
30,000
40,000
50,000
60,000
70,000
80,000
90,000
6,000
8,000
10,000
12,000
14,000
16,000
18,000
20,000
22,000
Q2 Q3 Q4 Q1 2017
Q2 Q3 Q4 Q1 2018
Q2
SEK M
Sales by quarter andlast 12 months
Sales, quarter
Sales, 12 months
2,000
4,000
6,000
8,000
10,000
12,000
0
1,000
2,000
3,000
4,000
5,000
Q2 Q3 Q4 Q1 2017
Q2 Q3 Q4 Q1 2018
Q2
SEK M
Operating cash flow by quarter and last 12 months
Operating cash flow, quarterOperating cash flow, 12 months
© ASSA ABLOY – Quarterly Report Q2 2018 3 (21)
Second quarter The Group’s sales increased by 9% to SEK 21,140 M (19,387). Organic growth amounted to 5% (2). Acquisitions and disposals were 2% (2), of which 4% (2) were acquisitions and –2% (0) were disposals. Exchange-rates affected sales by 2% (4).
The Group’s operating income, EBIT excluding impairment of intangible assets amounted to SEK 2,911 M (3,114) a decrease of 6%. The operating result was impacted by a write-down of operating assets in Asia Pacific amounting to SEK –400 M. The operating margin was 13.8% (16.1).
Operating income before amortizations from acquisitions, EBITA, excluding impairment of intangible assets, amounted to SEK 3,007 M (3,168). The corresponding EBITA margin was 14.2% (16.3).
Net financial items amounted to SEK –191 M (–170). The Group’s income before tax, excluding impairment of intangible assets, was SEK 2,720 M (2,944), a decrease of 8% compared with last year. The corresponding profit margin was 12.9% (15.2). Exchange-rates had an impact of SEK 42 M (96) on income before tax.
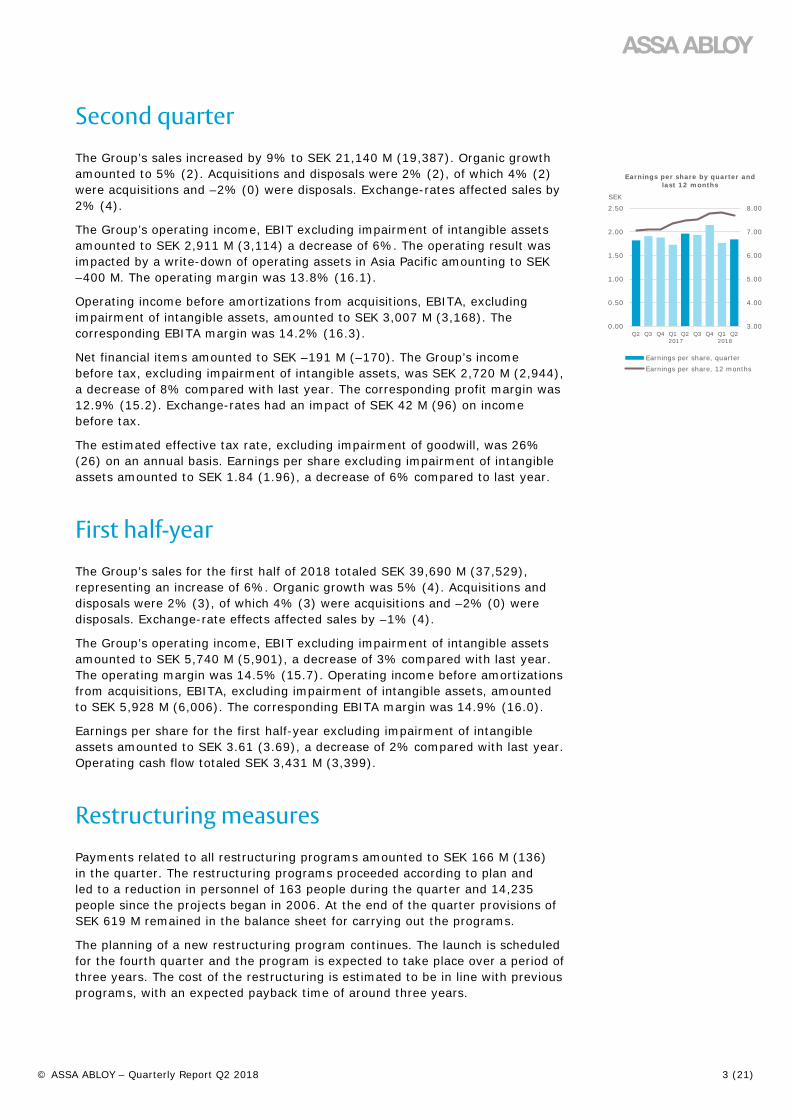
The estimated effective tax rate, excluding impairment of goodwill, was 26% (26) on an annual basis. Earnings per share excluding impairment of intangible assets amounted to SEK 1.84 (1.96), a decrease of 6% compared to last year.
First half-year The Group’s sales for the first half of 2018 totaled SEK 39,690 M (37,529), representing an increase of 6%. Organic growth was 5% (4). Acquisitions and disposals were 2% (3), of which 4% (3) were acquisitions and –2% (0) were disposals. Exchange-rate effects affected sales by –1% (4).
The Group’s operating income, EBIT excluding impairment of intangible assets amounted to SEK 5,740 M (5,901), a decrease of 3% compared with last year. The operating margin was 14.5% (15.7). Operating income before amortizations from acquisitions, EBITA, excluding impairment of intangible assets, amounted to SEK 5,928 M (6,006). The corresponding EBITA margin was 14.9% (16.0).
Earnings per share for the first half-year excluding impairment of intangible assets amounted to SEK 3.61 (3.69), a decrease of 2% compared with last year. Operating cash flow totaled SEK 3,431 M (3,399).
Restructuring measures Payments related to all restructuring programs amounted to SEK 166 M (136) in the quarter. The restructuring programs proceeded according to plan and led to a reduction in personnel of 163 people during the quarter and 14,235 people since the projects began in 2006. At the end of the quarter provisions of SEK 619 M remained in the balance sheet for carrying out the programs.
The planning of a new restructuring program continues. The launch is scheduled for the fourth quarter and the program is expected to take place over a period of three years. The cost of the restructuring is estimated to be in line with previous programs, with an expected payback time of around three years.
3.00
4.00
5.00
6.00
7.00
8.00
0.00
0.50
1.00
1.50
2.00
2.50
Q2 Q3 Q4 Q1 2017
Q2 Q3 Q4 Q1 2018
Q2
SEK
Earnings per share by quarter and last 12 months
Earnings per share, quarterEarnings per share, 12 months
© ASSA ABLOY – Quarterly Report Q2 2018 4 (21)
Organization Carolina Dybeck Happe, Executive Vice President and Chief Financial Officer (CFO) has decided to leave ASSA ABLOY at year-end 2018 after six years’ service as Group CFO to take up a post elsewhere. Recruitment of a successor has begun.
Neil Vann has been appointed Executive Vice President and Head of the EMEA Division. Neil Vann joined ASSA ABLOY with the Group´s acquisition of Yale in 2000 and for the past four years has served as Market Region Manager for ASSA ABLOY UK within EMEA. He succeeds Tzachi Wiesenfeld who has decided to leave ASSA ABLOY after 12 years’ service as Head of the EMEA Division.
Comments by division
EMEA Sales for the quarter in EMEA division totaled SEK 5,069 M (4,529), with organic sales growth of 2% (2). Growth was strong in Finland, Scandinavia, Germany and Eastern Europe, and was good in Southern Europe. The UK and Africa/ Middle East also showed growth while Benelux and France had negative sales development. Electromechanical products showed strong growth, and demand was especially strong for smart door locks for the residential market. Acquired growth net was 5%. Operating income totaled SEK 807 M (713), which represents an operating margin (EBIT) of 15.9% (15.7). Return on capital employed amounted to 19.0% (19.0). Operating cash flow before interest paid totaled SEK 607 M (461).
Americas Sales for the quarter in Americas division totaled SEK 5,078 M (4,704), with organic sales growth of 9% (3). Growth was strong for Architectural Hardware, Perimeter Protection, Electromechanical and High-security products and the Residential market in the USA and in Canada, Mexico and for South America apart from Colombia. Security Doors showed stable growth. The demand for smart door locks for the residential market in the USA was very high. Acquired growth net was 0%. Operating income totaled SEK 1,022 M (1,041), which represents an operating margin (EBIT) of 20.1% (22.1). Return on capital employed amounted to 23.7% (26.1). Operating cash flow before interest paid totaled SEK 1,245 M (1,163).
Asia Pacific Sales for the quarter in Asia Pacific division totaled SEK 2,608 M (2,445), with organic sales growth of 2% (–6). Strong growth was achieved in South Korea, Pacific and Japan, while South Asia had negative sales development. Sales in China were weak and declined for both lock products and security doors. Smart door-locks grew strongly in the region. Acquired growth was 1%. Operating income, including write-down of operating assets of SEK 400 M, totaled SEK –168 M (274), which represents an operating margin (EBIT) of –6.5% (11.2). Return on capital employed amounted to –6.6% (9.0). Operating cash flow before interest paid totaled SEK 244 M (116).
© ASSA ABLOY – Quarterly Report Q2 2018 5 (21)
Global Technologies Sales for the quarter in Global Technologies division totaled SEK 2,871 M (2,640), with organic sales growth of 6% (3). Physical Access control, Citizen ID, Extended Access and Identity & Access Solutions showed strong sales growth, while Secure Issuance and Identification Technology had stable sales development. Hospitality showed continued strong growth. Sales of mobile key solutions continued to grow strongly. Acquired growth net was 2%. Operating income totaled SEK 564 M (486), which represents an operating margin (EBIT) of 19.6% (18.4). Return on capital employed amounted to 13.5% (17.0). Operating cash flow before interest paid totaled SEK 642 M (511).
Entrance Systems Sales for the quarter in Entrance Systems division totaled SEK 5,914 M (5,381), with organic growth of 6% (3). Pedestrian doors, Industrial doors, US Garage doors and Logistic solutions in the USA showed strong growth while High-speed doors showed growth. EU residential doors and Door Components showed negative sales development. Acquired growth was 1%. Operating income totaled SEK 819 M (720), which represents an operating margin (EBIT) of 13.8% (13.4). Return on capital employed amounted to 15.7% (14.7). Operating cash flow before interest paid totaled SEK 577 M (638).
Acquisitions and disposals A total of five acquisitions were consolidated during the quarter. The combined acquisition price for the companies acquired during the year, including adjustments from prior year acquisitions, amounted to SEK 2,691 M. The acquisition price for these companies on a cash and debt free basis amounted to SEK 2,710 M. Preliminary acquisition analyses indicate that goodwill and other intangible assets with indefinite useful life amount to SEK 2,042 M. Estimated deferred considerations amounted to SEK 741 M.
On July 13 it was announced that ASSA ABLOY had signed a contract to acquire Planet GDZ, a leading Swiss supplier of drop down seals and finger protection covers for doors. The acquisition is expected to be completed during the third quarter. The company has approximately 55 employees and its sales in 2018 are expected to amount to SEK 160 M.
On July 3 it was announced that ASSA ABLOY had acquired Door Systems, an American distributor in industrial doors, residential sectional doors, high speed doors and docking solutions. The company has approximately 100 employees and its sales in 2018 are expected to amount to SEK 230 M.
On June 11 it was announced that ASSA ABLOY had acquired HKC, a leading Irish manufacturer of alarms and cloud based monitoring solutions. The company has approximately 45 employees and its sales in 2018 are expected to amount to SEK 180 M.
On June 4 it was announced that ASSA ABLOY had sold its Wood Door business in the USA to Masonite. The business has approximately 275 employees and its sales in 2017 totaled approximately SEK 600 M. The disposal will have a positive effect on ASSA ABLOY’s future operating margin.
On May 9 it was announced that ASSA ABLOY had signed a contract to acquire Pioneer Industries, an American supplier of steel doors and frames for commercial applications. The acquisition was completed during the second quarter. The company has approximately 100 employees and its sales in 2018 are expected to amount to SEK 180 M.
© ASSA ABLOY – Quarterly Report Q2 2018 6 (21)
On May 9 it was announced that ASSA ABLOY had acquired Brüken, a leading Mexican company in glass- and aluminum hardware. It has approximately 80 employees and its sales in 2018 are expected to amount to SEK 260 M.
Sustainable development In the USA, Entrance Systems Division has converted a production line for manufacturing door panels, making use of more environmentally friendly materials. The new process will reduce the Group’s total greenhouse gas emissions by 16 000 tons of CO2 equivalents during 2018, which represents an improvement across the Group of about 5%. The Entrance Systems Division plans to convert another similar production line in the same way early in 2019.
Parent company Other operating income for the Parent company ASSA ABLOY AB totaled SEK 2,272 M (2,113) for the first half-year. Operating income for the same period amounted to SEK 878 M (950). Investments in tangible and intangible assets totaled SEK 16 M (12). Liquidity is good and the equity ratio is 36.4% (41.8).
Accounting principles ASSA ABLOY applies International Financial Reporting Standards (IFRS) as endorsed by the European Union. The same accounting and valuation principles as in the latest Annual Report have been applied, with the exception of new and changed Standards and interpretations that came into force on 1 January 2018 and are described briefly on page 20. This Report was prepared in accordance with IAS 34 ‘Interim Financial Reporting’ and the Annual Accounts Act. The Interim Report for the Parent company was prepared in accordance with the Annual Accounts Act and RFR 2 ‘Reporting by a Legal Entity’.
ASSA ABLOY makes use of a number of financial performance measures that are not defined in the reporting rules that the company uses – so-called ‘alternative performance measures’. For definitions of financial performance measures, refer to Page 21 of this Report and to the company’s latest Annual Report. To check how the financial measurements have been calculated for current and earlier periods, refer to the tabulated figures in this Quarterly Report and to the company’s Annual Report. The Annual Reports for the years 1994 to 2017 appear on the company’s website www.assaabloy.com.
Totals quoted in tables and statements may not always be the exact sum of the individual items because of rounding differences. The aim is that each line item should correspond to its source, and rounding differences may therefore arise.
© ASSA ABLOY – Quarterly Report Q2 2018 7 (21)
Transactions with related parties No transactions that significantly affected the company’s position and income have taken place between ASSA ABLOY and related parties.
Risks and uncertainty factors As an international Group with a wide geographic spread, ASSA ABLOY is exposed to a number of business, financial and tax-related risks. The business risks can be divided into strategic, operational and legal risks. The financial risks are related to such factors as exchange rates, interest rates, liquidity, the giving of credit, raw materials and financial instruments. Risk management in ASSA ABLOY aims to identify, control and reduce risks. This work begins with an assessment of the probability of risks occurring and their potential effect on the Group. For a more detailed description of particular risks and risk management, see the 2017 Annual Report.
© ASSA ABLOY – Quarterly Report Q2 2018 8 (21)
Certification The Board of Directors and the President and CEO declare that this half-year report gives an accurate picture of the Parent Company’s and the Group’s operations, position and income and describes significant risks and uncertainty factors faced by the Parent Company and the companies making up the Group.
Stockholm, 17 July 2018
Lars Renström
Carl Douglas
Nico Delvaux
Chairman Vice Chairman President and CEO
Ulf Ewaldsson
Eva Karlsson
Birgitta Klasén
Board member Board member Board member
Lena Olving
Sofia Schörling Högberg
Jan Svensson
Board member Board member Board member
Rune Hjälm
Mats Persson
Employee representative Employee representative

© ASSA ABLOY – Quarterly Report Q2 2018 9 (21)
Report of Review of Interim Financial Information
Introduction We have reviewed the condensed Interim Financial Information (interim report) of ASSA ABLOY AB (publ.) as of 30 June 2018 and the six-month period then ended. The Board of Directors and the CEO are responsible for the preparation and presentation of the Interim Financial Information in accordance with IAS 34 and the Swedish Annual Accounts Act. Our responsibility is to express a conclusion on this Interim Report based on our review.
Scope of Review We conducted our review in accordance with the International Standard on Review Engagements ISRE 2410, Review of Interim Report Performed by the Independent Auditor of the Entity. A review consists of making inquiries, primarily of persons responsible for financial and accounting matters, and applying analytical and other review procedures. A review is substantially less in scope than an audit conducted in accordance with International Standards on Auditing, ISA, and other generally accepted auditing standards in Sweden. The procedures performed in a review do not enable us to obtain assurance that we would become aware of all significant matters that might be identified in an audit. Accordingly, we do not express an audit opinion.
Conclusion Based on our review, nothing has come to our attention that causes us to believe that the Interim Report is not prepared, in all material respects, in accordance with IAS 34 and the Swedish Annual Accounts Act, regarding the Group, and with the Swedish Annual Accounts Act, regarding the Parent Company.
Stockholm, 17 July 2018 PricewaterhouseCoopers
Bo Karlsson Linda Corneliusson Authorized Public Accountant Authorized Public Accountant Auditor in charge
© ASSA ABLOY – Quarterly Report Q2 2018 10 (21)
Financial information The Interim Report for the third quarter will be published on 19 October 2018
The Year-end Report and Quarterly Report for the fourth quarter will be published on 5 February 2019.
Further information can be obtained from: Nico Delvaux, President and CEO, Tel: +46 8 506 485 82
Carolina Dybeck Happe, Chief Financial Officer, Tel: +46 8 506 485 72
ASSA ABLOY is holding a telephone and web conference at 10.00 today the analysts’ meeting can be followed on the Internet at www.assaabloy.com.
It is possible to submit questions by telephone on: +46 8 566 19 353, +44 203 008 9806 or +1 855 831 5945
This is information that ASSA ABLOY AB is obliged to make public pursuant to the EU Market Abuse Regulation and the Securities Markets Act. The information was submitted for publication, through the agency of the contact persons set out above, at 08.00 CEST on 18 July 2018.
ASSA ABLOY AB (publ) Box 703 40 107 23 Stockholm Visiting address Klarabergsviadukten 90, Stockholm, Sweden
Tel +46 (0)8 506 485 00 Fax +46 (0)8 506 485 85 www.assaabloy.com Corporate identity number: 556059-3575
No.19/2018

© ASSA ABLOY – Quarterly Report Q2 2018 11 (21)
Financial information – Group
CONSOLIDATED INCOME STATEMENT
SEK M 2017 2018 2017 2018Sales 19,387 21,140 37,529 39,690Cost of goods sold -11,806 -12,796 -22,757 -23,973Gross income 7,581 8,345 14,771 15,716
Selling, administrative and R&D costs -4,494 -5,496 -8,926 -10,071Impairment of goodwill and other intangible assets - -5,595 - -5,595Share of earnings in associates 27 62 56 95Operating income 3,114 -2,685 5,901 144
Finance net -170 -191 -365 -366Income before tax 2,944 -2,876 5,537 -222
Tax on income -765 -344 -1,440 -1,034Net income for the period 2,179 -3,220 4,097 -1,256
Net income for the period attributable to:Parent company's shareholders 2,178 -3,222 4,096 -1,257Non-controlling interests 1 2 1 2
Earnings per shareBefore and after dilution, SEK 1.96 -2.90 3.69 -1.13Before and after dilution and excluding items affecting comparability, SEK 1.96 1.84 3.69 3.61
STATEMENT OF COMPREHENSIVE INCOMESEK M 2017 2018 2017 2018Net income for the period 2,179 -3,220 4,097 -1,256
Other comprehensive income:Items that will not be reclassified to profit or lossActuarial gain/loss on post-employment benefit obligations, net after tax -67 -15 -43 11Total -67 -15 -43 11
Items that may be reclassified subsequently to profit or lossShare of other comprehensive income of associates 31 3 70 106Cashflow hedges and net investment hedges -27 -11 -37 -28Exchange rate differences -1,382 1,276 -1,547 2,478Total -1,378 1,267 -1,514 2,555
Total comprehensive income for the period 734 -1,967 2,540 1,311
Total comprehensive income for the period attributable to:Parent company's shareholders 734 -1,969 2,540 1,309Non-controlling interests 0 2 0 2
Q2 Q1-Q2
Q2 Q1-Q2
© ASSA ABLOY – Quarterly Report Q2 2018 12 (21)
Financial information – Group
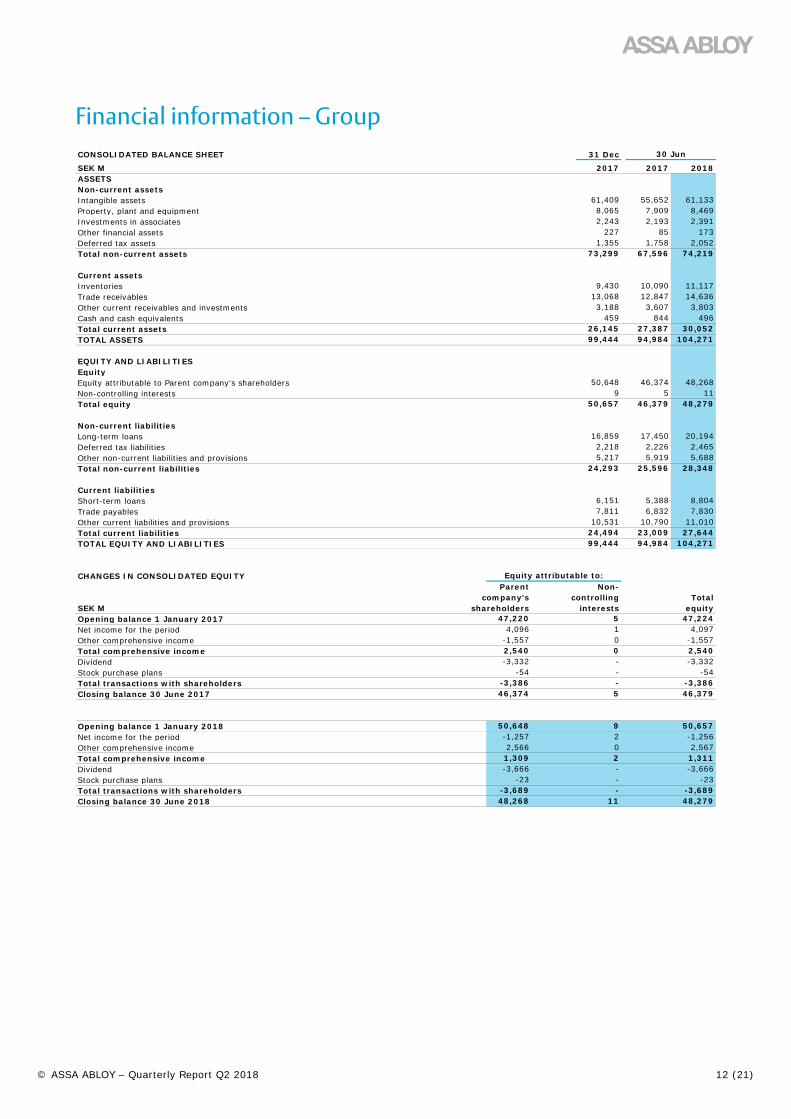
CONSOLIDATED BALANCE SHEET 31 DecSEK M 2017 2017 2018ASSETSNon-current assetsIntangible assets 61,409 55,652 61,133Property, plant and equipment 8,065 7,909 8,469Investments in associates 2,243 2,193 2,391Other financial assets 227 85 173Deferred tax assets 1,355 1,758 2,052Total non-current assets 73,299 67,596 74,219
Current assetsInventories 9,430 10,090 11,117Trade receivables 13,068 12,847 14,636Other current receivables and investments 3,188 3,607 3,803Cash and cash equivalents 459 844 496Total current assets 26,145 27,387 30,052TOTAL ASSETS 99,444 94,984 104,271
EQUITY AND LIABILITIESEquityEquity attributable to Parent company's shareholders 50,648 46,374 48,268Non-controlling interests 9 5 11Total equity 50,657 46,379 48,279
Non-current liabilitiesLong-term loans 16,859 17,450 20,194Deferred tax liabilities 2,218 2,226 2,465Other non-current liabilities and provisions 5,217 5,919 5,688Total non-current liabilities 24,293 25,596 28,348
Current liabilitiesShort-term loans 6,151 5,388 8,804Trade payables 7,811 6,832 7,830Other current liabilities and provisions 10,531 10,790 11,010Total current liabilities 24,494 23,009 27,644TOTAL EQUITY AND LIABILITIES 99,444 94,984 104,271
CHANGES IN CONSOLIDATED EQUITY Equity attributable to:Parent Non-
company's controlling TotalSEK M shareholders interests equityOpening balance 1 January 2017 47,220 5 47,224Net income for the period 4,096 1 4,097Other comprehensive income -1,557 0 -1,557Total comprehensive income 2,540 0 2,540Dividend -3,332 - -3,332Stock purchase plans -54 - -54Total transactions with shareholders -3,386 - -3,386Closing balance 30 June 2017 46,374 5 46,379
Opening balance 1 January 2018 50,648 9 50,657Net income for the period -1,257 2 -1,256Other comprehensive income 2,566 0 2,567Total comprehensive income 1,309 2 1,311Dividend -3,666 - -3,666Stock purchase plans -23 - -23Total transactions with shareholders -3,689 - -3,689Closing balance 30 June 2018 48,268 11 48,279
30 Jun

© ASSA ABLOY – Quarterly Report Q2 2018 13 (21)
Financial information – Group
CONSOLIDATED STATEMENT OF CASH FLOWS
SEK M 2017 2018 2017 2018OPERATING ACTIVITIESOperating income 3,114 -2,685 5,901 144Depreciation and amortization 429 497 850 965Impairment of goodwill and other intangible assets - 5,595 - 5,595Restructuring payments -136 -166 -220 -339Other non-cash items 28 -49 -7 -156Cash flow before interest and tax 3,436 3,192 6,524 6,209
Interest paid and received -198 -219 -291 -341Tax paid on income -961 -986 -1,590 -1,595Cash flow before changes in working capital 2,277 1,987 4,643 4,273
Changes in working capital -207 127 -2,089 -2,009Cash flow from operating activities 2,070 2,114 2,554 2,264
INVESTING ACTIVITIESNet investments in intangible assets and property, plant and equipment -593 -411 -965 -767Investments in subsidiaries -270 -1,064 -716 -2,031Investments in associates - 0 0 0Disposals of subsidiaries 0 392 1 382Other investments and disposals 0 0 0 0Cash flow from investing activities -863 -1,082 -1,680 -2,416
FINANCING ACTIVITIESDividends -3,332 -3,666 -3,332 -3,666Acquisition of non-controlling interests - -219 - -219Net cash effect of changes in borrowings 2,284 2,788 2,565 4,058Cash flow from financing activities -1,049 -1,097 -767 173CASH FLOW FOR THE PERIOD 159 -65 107 21
CASH AND CASH EQUIVALENTSCash and cash equivalents at beginning of period 697 551 750 459Cash flow for the period 159 -65 107 21Effect of exchange rate differences -12 11 -13 16Cash and cash equivalents at end of period 844 496 844 496
KEY RATIOS
2017 2017 2018Return on capital employed, % 16.6 16.2 7.5Return on capital employed excluding items affecting comparability, % 16.6 16.2 14.6Return on shareholders' equity, % 17.6 17.5 6.2Equity ratio, % 50.9 48.8 46.3Interest coverage ratio, times 19.1 18.2 0.4Total number of shares, thousands 1,112,576 1,112,576 1,112,576Number of shares outstanding, thousands 1,110,776 1,110,776 1,110,776Weighted average number of outstanding shares before and after dilution, thousands 1,110,776 1,110,776 1,110,776Average number of employees 47,426 46,791 48,070
Q2 Q1-Q2
Q1-Q2Year

© ASSA ABLOY – Quarterly Report Q2 2018 14 (21)
Financial information – Parent company
INCOME STATEMENT Year
SEK M 2017 2017 2018Operating income 1,701 950 878Income before appropriations and tax 4,238 1,691 1,054Net income for the period 4,670 1,688 890
BALANCE SHEET 31 Dec
SEK M 2017 2017 2018Non-current assets 39,579 35,834 39,779Current assets 12,740 10,829 14,282Total assets 52,319 46,663 54,061
Equity 22,494 19,492 19,695Untaxed reserves 565 - 565Non-current liabilities 10,581 9,844 13,599Current liabilities 18,679 17,327 20,202Total equity and liabilities 52,319 46,663 54,061
Q1-Q2
30 Jun
© ASSA ABLOY – Quarterly Report Q2 2018 15 (21)
Quarterly information – Group
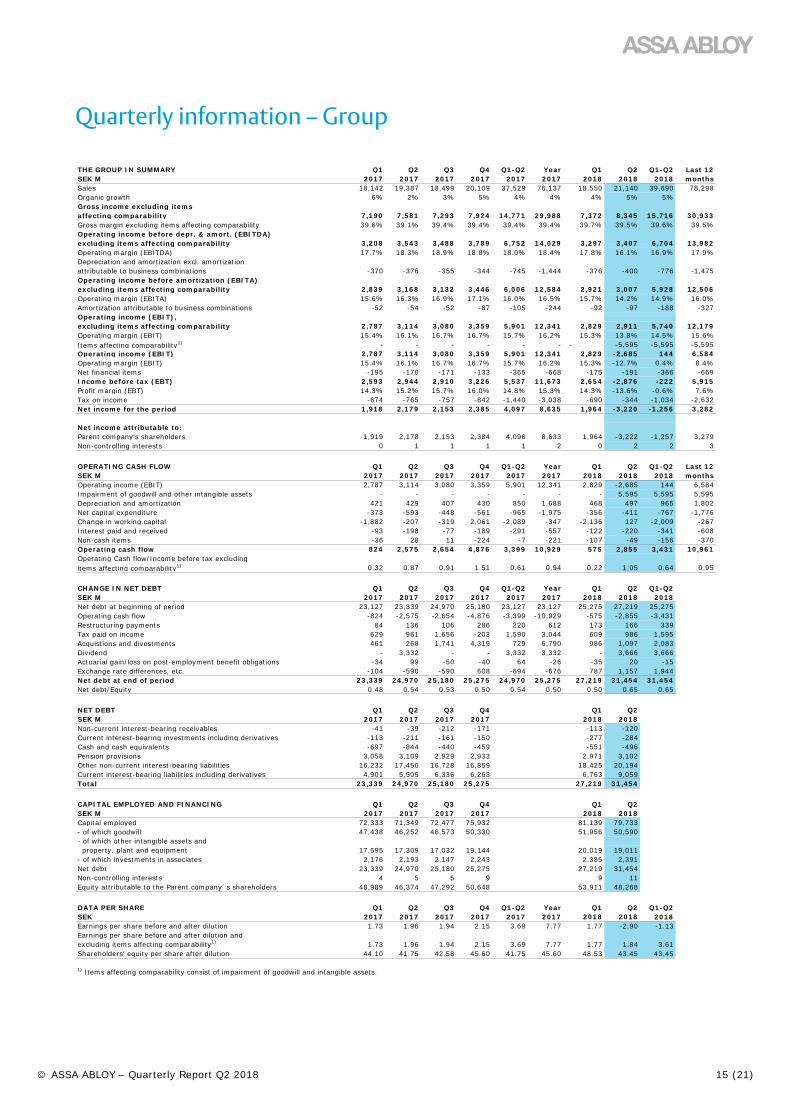
THE GROUP IN SUMMARY Q1 Q2 Q3 Q4 Q1-Q2 Year Q1 Q2 Q1-Q2 Last 12SEK M 2017 2017 2017 2017 2017 2017 2018 2018 2018 monthsSales 18,142 19,387 18,499 20,109 37,529 76,137 18,550 21,140 39,690 78,298Organic growth 6% 2% 3% 5% 4% 4% 4% 5% 5%Gross income excluding itemsaffecting comparability 7,190 7,581 7,293 7,924 14,771 29,988 7,372 8,345 15,716 30,933Gross margin excluding items affecting comparability 39.6% 39.1% 39.4% 39.4% 39.4% 39.4% 39.7% 39.5% 39.6% 39.5%Operating income before depr. & amort. (EBITDA)excluding items affecting comparability 3,208 3,543 3,488 3,789 6,752 14,029 3,297 3,407 6,704 13,982Operating margin (EBITDA) 17.7% 18.3% 18.9% 18.8% 18.0% 18.4% 17.8% 16.1% 16.9% 17.9%Depreciation and amortization excl. amortizationattributable to business combinations -370 -376 -355 -344 -745 -1,444 -376 -400 -776 -1,475Operating income before amortization (EBITA)excluding items affecting comparability 2,839 3,168 3,132 3,446 6,006 12,584 2,921 3,007 5,928 12,506Operating margin (EBITA) 15.6% 16.3% 16.9% 17.1% 16.0% 16.5% 15.7% 14.2% 14.9% 16.0%Amortization attributable to business combinations -52 -54 -52 -87 -105 -244 -92 -97 -188 -327Operating income (EBIT),excluding items affecting comparability 2,787 3,114 3,080 3,359 5,901 12,341 2,829 2,911 5,740 12,179Operating margin (EBIT) 15.4% 16.1% 16.7% 16.7% 15.7% 16.2% 15.3% 13.8% 14.5% 15.6%Items affecting comparability1) - - - - - - - -5,595 -5,595 -5,595Operating income (EBIT) 2,787 3,114 3,080 3,359 5,901 12,341 2,829 -2,685 144 6,584Operating margin (EBIT) 15.4% 16.1% 16.7% 16.7% 15.7% 16.2% 15.3% -12.7% 0.4% 8.4%Net financial items -195 -170 -171 -133 -365 -668 -175 -191 -366 -669Income before tax (EBT) 2,593 2,944 2,910 3,226 5,537 11,673 2,654 -2,876 -222 5,915Profit margin (EBT) 14.3% 15.2% 15.7% 16.0% 14.8% 15.3% 14.3% -13.6% -0.6% 7.6%Tax on income -674 -765 -757 -842 -1,440 -3,038 -690 -344 -1,034 -2,632Net income for the period 1,918 2,179 2,153 2,385 4,097 8,635 1,964 -3,220 -1,256 3,282
Net income attributable to:Parent company's shareholders 1,919 2,178 2,153 2,384 4,096 8,633 1,964 -3,222 -1,257 3,279Non-controlling interests 0 1 1 1 1 2 0 2 2 3
OPERATING CASH FLOW Q1 Q2 Q3 Q4 Q1-Q2 Year Q1 Q2 Q1-Q2 Last 12SEK M 2017 2017 2017 2017 2017 2017 2018 2018 2018 monthsOperating income (EBIT) 2,787 3,114 3,080 3,359 5,901 12,341 2,829 -2,685 144 6,584Impairment of goodwill and other intangible assets - - - - - - - 5,595 5,595 5,595Depreciation and amortization 421 429 407 430 850 1,688 468 497 965 1,802Net capital expenditure -373 -593 -448 -561 -965 -1,975 -356 -411 -767 -1,776Change in working capital -1,882 -207 -319 2,061 -2,089 -347 -2,136 127 -2,009 -267Interest paid and received -93 -198 -77 -189 -291 -557 -122 -220 -341 -608Non-cash items -36 28 11 -224 -7 -221 -107 -49 -156 -370Operating cash flow 824 2,575 2,654 4,876 3,399 10,929 575 2,855 3,431 10,961Operating Cash flow/Income before tax excludingitems affecting comparability1) 0.32 0.87 0.91 1.51 0.61 0.94 0.22 1.05 0.64 0.95
CHANGE IN NET DEBT Q1 Q2 Q3 Q4 Q1-Q2 Year Q1 Q2 Q1-Q2SEK M 2017 2017 2017 2017 2017 2017 2018 2018 2018Net debt at beginning of period 23,127 23,339 24,970 25,180 23,127 23,127 25,275 27,219 25,275Operating cash flow -824 -2,575 -2,654 -4,876 -3,399 -10,929 -575 -2,855 -3,431Restructuring payments 84 136 106 286 220 612 173 166 339Tax paid on income 629 961 1,656 -203 1,590 3,044 609 986 1,595Acquistions and divestments 461 268 1,741 4,319 729 6,790 986 1,097 2,083Dividend - 3,332 - - 3,332 3,332 - 3,666 3,666Actuarial gain/loss on post-employment benefit obligations -34 99 -50 -40 64 -26 -35 20 -15Exchange rate differences, etc. -104 -590 -590 608 -694 -676 787 1,157 1,944Net debt at end of period 23,339 24,970 25,180 25,275 24,970 25,275 27,219 31,454 31,454Net debt/Equity 0.48 0.54 0.53 0.50 0.54 0.50 0.50 0.65 0.65
NET DEBT Q1 Q2 Q3 Q4 Q1 Q2SEK M 2017 2017 2017 2017 2018 2018Non-current interest-bearing receivables -41 -39 -212 -171 -113 -120Current interest-bearing investments including derivatives -113 -211 -161 -150 -277 -284Cash and cash equivalents -697 -844 -440 -459 -551 -496Pension provisions 3,058 3,109 2,929 2,933 2,971 3,102Other non-current interest-bearing liabilities 16,232 17,450 16,728 16,859 18,425 20,194Current interest-bearing liabilities including derivatives 4,901 5,505 6,336 6,263 6,763 9,059Total 23,339 24,970 25,180 25,275 27,219 31,454
CAPITAL EMPLOYED AND FINANCING Q1 Q2 Q3 Q4 Q1 Q2SEK M 2017 2017 2017 2017 2018 2018Capital employed 72,333 71,349 72,477 75,932 81,139 79,733- of which goodwill 47,438 46,252 46,573 50,330 51,956 50,590- of which other intangible assets and property, plant and equipment 17,595 17,309 17,032 19,144 20,019 19,011- of which investments in associates 2,176 2,193 2,147 2,243 2,385 2,391Net debt 23,339 24,970 25,180 25,275 27,219 31,454Non-controlling interests 4 5 5 9 9 11Equity attributable to the Parent company´s shareholders 48,989 46,374 47,292 50,648 53,911 48,268
DATA PER SHARE Q1 Q2 Q3 Q4 Q1-Q2 Year Q1 Q2 Q1-Q2SEK 2017 2017 2017 2017 2017 2017 2018 2018 2018Earnings per share before and after dilution 1.73 1.96 1.94 2.15 3.69 7.77 1.77 -2.90 -1.13Earnings per share before and after dilution andexcluding items affecting comparability1) 1.73 1.96 1.94 2.15 3.69 7.77 1.77 1.84 3.61Shareholders' equity per share after dilution 44.10 41.75 42.58 45.60 41.75 45.60 48.53 43.45 43.45
1) Items affecting comparability consist of impairment of goodwill and intangible assets.
© ASSA ABLOY – Quarterly Report Q2 2018 16 (21)
Reporting by division
Q2 and 30 Jun
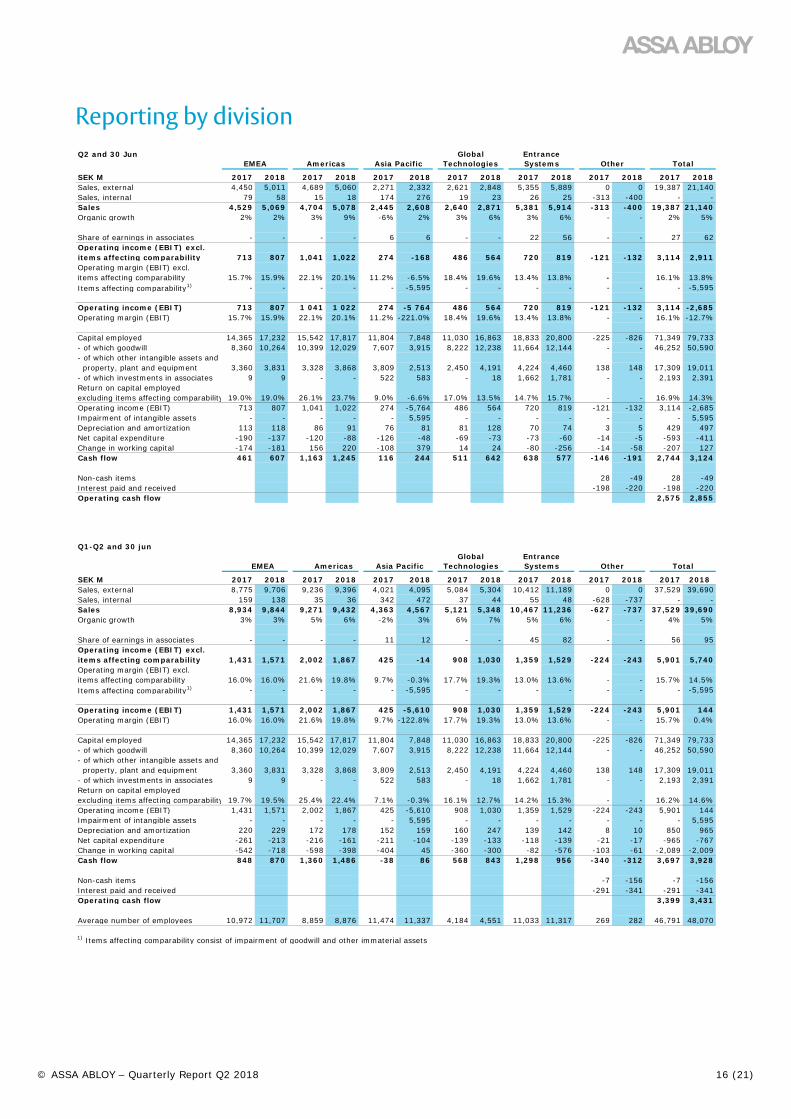
SEK M 2017 2018 2017 2018 2017 2018 2017 2018 2017 2018 2017 2018 2017 2018Sales, external 4,450 5,011 4,689 5,060 2,271 2,332 2,621 2,848 5,355 5,889 0 0 19,387 21,140Sales, internal 79 58 15 18 174 276 19 23 26 25 -313 -400 - -Sales 4,529 5,069 4,704 5,078 2,445 2,608 2,640 2,871 5,381 5,914 -313 -400 19,387 21,140Organic growth 2% 2% 3% 9% -6% 2% 3% 6% 3% 6% - - 2% 5%
Share of earnings in associates - - - - 6 6 - - 22 56 - - 27 62Operating income (EBIT) excl.items affecting comparability 713 807 1,041 1,022 274 -168 486 564 720 819 -121 -132 3,114 2,911Operating margin (EBIT) excl.items affecting comparability 15.7% 15.9% 22.1% 20.1% 11.2% -6.5% 18.4% 19.6% 13.4% 13.8% - 16.1% 13.8%Items affecting comparability1) - - - - - -5,595 - - - - - - - -5,595
Operating income (EBIT) 713 807 1 041 1 022 274 -5 764 486 564 720 819 -121 -132 3,114 -2,685Operating margin (EBIT) 15.7% 15.9% 22.1% 20.1% 11.2% -221.0% 18.4% 19.6% 13.4% 13.8% - - 16.1% -12.7%
Capital employed 14,365 17,232 15,542 17,817 11,804 7,848 11,030 16,863 18,833 20,800 -225 -826 71,349 79,733- of which goodwill 8,360 10,264 10,399 12,029 7,607 3,915 8,222 12,238 11,664 12,144 - - 46,252 50,590- of which other intangible assets and property, plant and equipment 3,360 3,831 3,328 3,868 3,809 2,513 2,450 4,191 4,224 4,460 138 148 17,309 19,011- of which investments in associates 9 9 - - 522 583 - 18 1,662 1,781 - - 2,193 2,391Return on capital employedexcluding items affecting comparability 19.0% 19.0% 26.1% 23.7% 9.0% -6.6% 17.0% 13.5% 14.7% 15.7% - - 16.9% 14.3%Operating income (EBIT) 713 807 1,041 1,022 274 -5,764 486 564 720 819 -121 -132 3,114 -2,685Impairment of intangible assets - - - - - 5,595 - - - - - - - 5,595Depreciation and amortization 113 118 86 91 76 81 81 128 70 74 3 5 429 497Net capital expenditure -190 -137 -120 -88 -126 -48 -69 -73 -73 -60 -14 -5 -593 -411Change in working capital -174 -181 156 220 -108 379 14 24 -80 -256 -14 -58 -207 127Cash flow 461 607 1,163 1,245 116 244 511 642 638 577 -146 -191 2,744 3,124
Non-cash items 28 -49 28 -49Interest paid and received -198 -220 -198 -220Operating cash flow 2,575 2,855
Global EntranceEMEA Americas Asia Pacific Technologies Systems Other Total
Q1-Q2 and 30 jun
SEK M 2017 2018 2017 2018 2017 2018 2017 2018 2017 2018 2017 2018 2017 2018Sales, external 8,775 9,706 9,236 9,396 4,021 4,095 5,084 5,304 10,412 11,189 0 0 37,529 39,690Sales, internal 159 138 35 36 342 472 37 44 55 48 -628 -737 - -Sales 8,934 9,844 9,271 9,432 4,363 4,567 5,121 5,348 10,467 11,236 -627 -737 37,529 39,690Organic growth 3% 3% 5% 6% -2% 3% 6% 7% 5% 6% - - 4% 5%
Share of earnings in associates - - - - 11 12 - - 45 82 - - 56 95Operating income (EBIT) excl.items affecting comparability 1,431 1,571 2,002 1,867 425 -14 908 1,030 1,359 1,529 -224 -243 5,901 5,740Operating margin (EBIT) excl.items affecting comparability 16.0% 16.0% 21.6% 19.8% 9.7% -0.3% 17.7% 19.3% 13.0% 13.6% - - 15.7% 14.5%Items affecting comparability1) - - - - - -5,595 - - - - - - - -5,595
Operating income (EBIT) 1,431 1,571 2,002 1,867 425 -5,610 908 1,030 1,359 1,529 -224 -243 5,901 144Operating margin (EBIT) 16.0% 16.0% 21.6% 19.8% 9.7% -122.8% 17.7% 19.3% 13.0% 13.6% - - 15.7% 0.4%
Capital employed 14,365 17,232 15,542 17,817 11,804 7,848 11,030 16,863 18,833 20,800 -225 -826 71,349 79,733- of which goodwill 8,360 10,264 10,399 12,029 7,607 3,915 8,222 12,238 11,664 12,144 - - 46,252 50,590- of which other intangible assets and property, plant and equipment 3,360 3,831 3,328 3,868 3,809 2,513 2,450 4,191 4,224 4,460 138 148 17,309 19,011- of which investments in associates 9 9 - - 522 583 - 18 1,662 1,781 - - 2,193 2,391Return on capital employedexcluding items affecting comparability 19.7% 19.5% 25.4% 22.4% 7.1% -0.3% 16.1% 12.7% 14.2% 15.3% - - 16.2% 14.6%Operating income (EBIT) 1,431 1,571 2,002 1,867 425 -5,610 908 1,030 1,359 1,529 -224 -243 5,901 144Impairment of intangible assets - - - - - 5,595 - - - - - - - 5,595Depreciation and amortization 220 229 172 178 152 159 160 247 139 142 8 10 850 965Net capital expenditure -261 -213 -216 -161 -211 -104 -139 -133 -118 -139 -21 -17 -965 -767Change in working capital -542 -718 -598 -398 -404 45 -360 -300 -82 -576 -103 -61 -2,089 -2,009Cash flow 848 870 1,360 1,486 -38 86 568 843 1,298 956 -340 -312 3,697 3,928
Non-cash items -7 -156 -7 -156Interest paid and received -291 -341 -291 -341Operating cash flow 3,399 3,431
Average number of employees 10,972 11,707 8,859 8,876 11,474 11,337 4,184 4,551 11,033 11,317 269 282 46,791 48,070
1) Items affecting comparability consist of impairment of goodwill and other immaterial assets
Other TotalGlobal Entrance
EMEA Americas Asia Pacific Technologies Systems
© ASSA ABLOY – Quarterly Report Q2 2018 17 (21)
Reporting by division
Year and 31 Dec
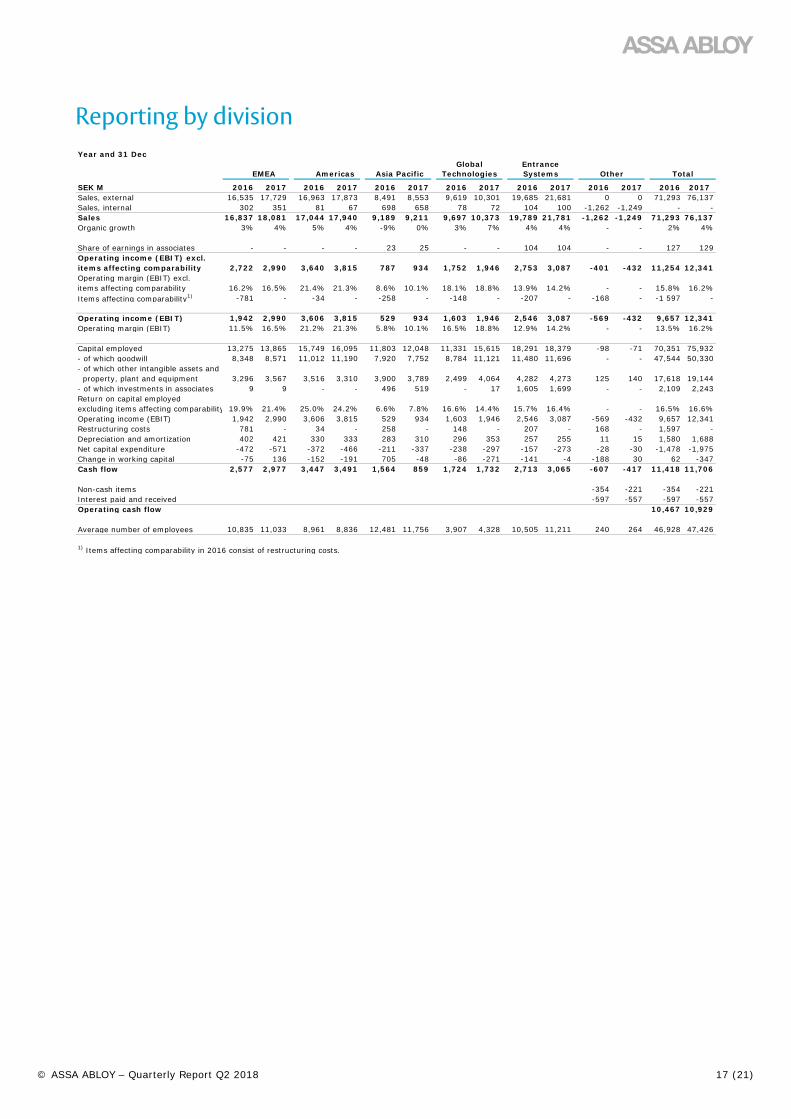
SEK M 2016 2017 2016 2017 2016 2017 2016 2017 2016 2017 2016 2017 2016 2017Sales, external 16,535 17,729 16,963 17,873 8,491 8,553 9,619 10,301 19,685 21,681 0 0 71,293 76,137Sales, internal 302 351 81 67 698 658 78 72 104 100 -1,262 -1,249 - -Sales 16,837 18,081 17,044 17,940 9,189 9,211 9,697 10,373 19,789 21,781 -1,262 -1,249 71,293 76,137Organic growth 3% 4% 5% 4% -9% 0% 3% 7% 4% 4% - - 2% 4%
Share of earnings in associates - - - - 23 25 - - 104 104 - - 127 129Operating income (EBIT) excl.items affecting comparability 2,722 2,990 3,640 3,815 787 934 1,752 1,946 2,753 3,087 -401 -432 11,254 12,341Operating margin (EBIT) excl.items affecting comparability 16.2% 16.5% 21.4% 21.3% 8.6% 10.1% 18.1% 18.8% 13.9% 14.2% - - 15.8% 16.2%Items affecting comparability1) -781 - -34 - -258 - -148 - -207 - -168 - -1 597 -
Operating income (EBIT) 1,942 2,990 3,606 3,815 529 934 1,603 1,946 2,546 3,087 -569 -432 9,657 12,341Operating margin (EBIT) 11.5% 16.5% 21.2% 21.3% 5.8% 10.1% 16.5% 18.8% 12.9% 14.2% - - 13.5% 16.2%
Capital employed 13,275 13,865 15,749 16,095 11,803 12,048 11,331 15,615 18,291 18,379 -98 -71 70,351 75,932- of which goodwill 8,348 8,571 11,012 11,190 7,920 7,752 8,784 11,121 11,480 11,696 - - 47,544 50,330- of which other intangible assets and property, plant and equipment 3,296 3,567 3,516 3,310 3,900 3,789 2,499 4,064 4,282 4,273 125 140 17,618 19,144- of which investments in associates 9 9 - - 496 519 - 17 1,605 1,699 - - 2,109 2,243Return on capital employedexcluding items affecting comparability 19.9% 21.4% 25.0% 24.2% 6.6% 7.8% 16.6% 14.4% 15.7% 16.4% - - 16.5% 16.6%Operating income (EBIT) 1,942 2,990 3,606 3,815 529 934 1,603 1,946 2,546 3,087 -569 -432 9,657 12,341Restructuring costs 781 - 34 - 258 - 148 - 207 - 168 - 1,597 -Depreciation and amortization 402 421 330 333 283 310 296 353 257 255 11 15 1,580 1,688Net capital expenditure -472 -571 -372 -466 -211 -337 -238 -297 -157 -273 -28 -30 -1,478 -1,975Change in working capital -75 136 -152 -191 705 -48 -86 -271 -141 -4 -188 30 62 -347Cash flow 2,577 2,977 3,447 3,491 1,564 859 1,724 1,732 2,713 3,065 -607 -417 11,418 11,706
Non-cash items -354 -221 -354 -221Interest paid and received -597 -557 -597 -557Operating cash flow 10,467 10,929
Average number of employees 10,835 11,033 8,961 8,836 12,481 11,756 3,907 4,328 10,505 11,211 240 264 46,928 47,426
1) Items affecting comparability in 2016 consist of restructuring costs.
TotalGlobal Entrance
EMEA Americas Asia Pacific Technologies Systems Other

© ASSA ABLOY – Quarterly Report Q2 2018 18 (21)
Financial information - Notes
NOTE 1 DISAGGREGATION OF REVENUE
Sales by continent Q2
SEK M 2017 2018 2017 2018 2017 2018 2017 2018 2017 2018 2017 2018 2017 2018Europe 3,933 4,388 15 10 126 158 708 803 2,570 2,828 -151 -187 7,201 7,999North America 171 177 4,254 4,615 147 211 1,136 1,318 2,318 2,594 -102 -135 7,925 8,781Central- and South America 22 26 405 429 11 16 92 117 15 27 -8 -11 538 604Africa 151 209 9 2 2 5 54 106 13 19 -5 -6 224 335Asia 231 238 22 21 1,719 1,754 557 453 328 316 -29 -38 2,829 2,744Oceania 22 31 1 1 440 464 93 75 135 130 -19 -23 671 678Total 4,529 5,069 4,704 5,078 2,445 2,608 2,640 2,871 5,381 5,914 -313 -400 19,387 21,140
Sales by continent Q1-Q2
SEK M 2017 2018 2017 2018 2017 2018 2017 2018 2017 2018 2017 2018 2017 2018Europe 7,798 8,602 25 21 238 283 1,382 1,427 5,092 5,471 -294 -338 14,242 15,465North America 283 282 8,366 8,574 285 371 2,189 2,511 4,438 4,849 -208 -260 15,353 16,327Central- and South America 47 44 817 784 19 24 184 209 33 48 -16 -17 1,084 1,092Africa 300 401 15 4 4 7 117 195 29 32 -12 -12 453 627Asia 461 460 46 48 2,930 3,010 1,083 866 620 590 -56 -66 5,084 4,908Oceania 45 55 2 3 886 872 167 140 256 246 -43 -45 1,312 1,271Total 8,934 9,844 9,271 9,432 4,363 4,567 5,121 5,348 10,467 11,236 -627 -737 37,529 39,690
Sales by product group Q2
SEK M 2017 2018 2017 2018 2017 2018 2017 2018 2017 2018 2017 2018 2017 2018Mechanical locks, lock systems and fittings 2,390 2,549 1,884 1,982 1,263 1,311 31 7 2 2 -172 -177 5,397 5,674Electromechanical and electronic locks 1,391 1,637 671 914 465 576 2,609 2,864 150 207 -100 -177 5,187 6,022Security doors and hardware 686 782 2,136 2,150 715 715 0 0 0 0 -15 -20 3,523 3,628Entrance automation 62 100 13 32 3 5 0 0 5,229 5,705 -27 -27 5,280 5,816Total 4,529 5,069 4,704 5,078 2,445 2,608 2,640 2,871 5,381 5,914 -313 -400 19,387 21,140
Sales by product group Q1-Q2
SEK M 2017 2018 2017 2018 2017 2018 2017 2018 2017 2018 2017 2018 2017 2018Mechanical locks, lock systems and fittings 4,709 5,004 3,742 3,680 2,310 2,382 53 15 4 4 -329 -342 10,488 10,743Electromechanical and electronic locks 2,736 3,153 1,306 1,672 849 995 5,069 5,333 344 416 -214 -308 10,090 11,260Security doors and hardware 1,341 1,502 4,198 4,035 1,198 1,180 0 0 0 0 -27 -37 6,710 6,680Entrance automation 148 185 26 46 5 10 0 0 10,119 10,816 -57 -51 10,241 11,007Total 8,934 9,844 9,271 9,432 4,363 4,567 5,121 5,348 10,467 11,236 -627 -737 37,529 39,690
NOTE 2 BUSINESS COMBINATIONS
SEK M 2017 2018 2017 2018Purchase pricesCash paid for acquisitions during the year 221 1,013 526 1,950Holdbacks and deferred considerations for acquisitions during the year 54 522 157 742Adjustment of purchase prices for acquisitions in prior years 4 0 4 -2Total 279 1,535 687 2,691
Acquired assets and liabilities at fair valueIntangible assets 12 38 133 430Property, plant and equipment 8 25 18 86Financial assets 2 1 3 212Inventories 33 133 68 213Current receivables and investments 26 122 128 248Cash and cash equivalents 11 34 37 150
Non-current liabilities -56 -1 -68 -160Current liabilities -18 -226 -93 -329Total 18 126 226 849Goodwill 261 1,409 462 1,842
Change in cash and cash equivalents due to acquisitionsCash paid for acquisitions during the year 221 1,013 526 1,950Cash and cash equivalents in acquired subsidiaries -11 -34 -37 -150Paid considerations for acquisitions in prior years 61 85 227 231Total 271 1,064 716 2,031
Fair value adjustments of acquired net assets from acquisitions made in previous periods are included in the above table.
Other Total
Q1-Q2Q2
Other Total
Global Entrance
Technologies Systems
Global Entrance
EMEA Americas Asia Pacific Technologies Systems
Global EntranceEMEA Americas Asia Pacific
EMEA Americas Asia Pacific Technologies Systems Övrigt Total
Global EntranceEMEA Americas Asia Pacific Technologies Systems Other Total
© ASSA ABLOY – Quarterly Report Q2 2018 19 (21)
Financial information – Notes
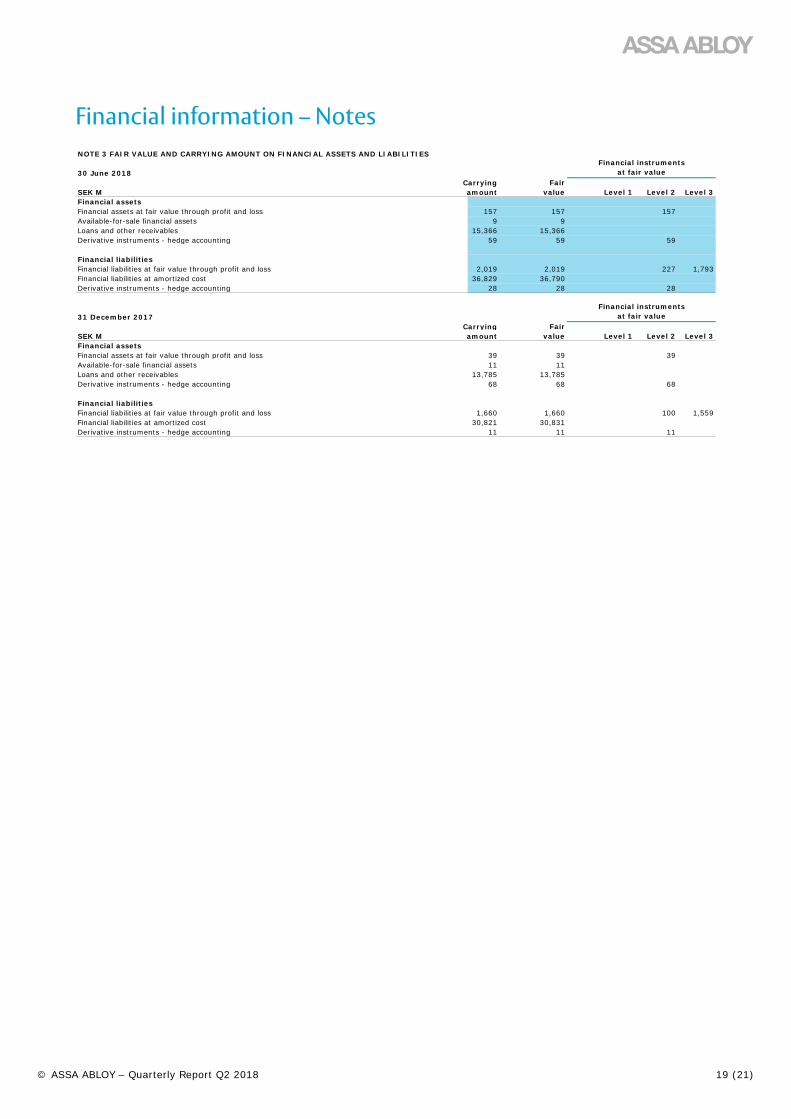
NOTE 3 FAIR VALUE AND CARRYING AMOUNT ON FINANCIAL ASSETS AND LIABILITIES
30 June 2018Carrying Fair
SEK M amount value Level 1 Level 2 Level 3Financial assetsFinancial assets at fair value through profit and loss 157 157 157Available-for-sale financial assets 9 9Loans and other receivables 15,366 15,366Derivative instruments - hedge accounting 59 59 59
Financial liabilitiesFinancial liabilities at fair value through profit and loss 2,019 2,019 227 1,793Financial liabilities at amortized cost 36,829 36,790Derivative instruments - hedge accounting 28 28 28
31 December 2017Carrying Fair
SEK M amount value Level 1 Level 2 Level 3Financial assetsFinancial assets at fair value through profit and loss 39 39 39Available-for-sale financial assets 11 11Loans and other receivables 13,785 13,785Derivative instruments - hedge accounting 68 68 68
Financial liabilitiesFinancial liabilities at fair value through profit and loss 1,660 1,660 100 1,559Financial liabilities at amortized cost 30,821 30,831Derivative instruments - hedge accounting 11 11 11
Financial instrumentsat fair value
Financial instrumentsat fair value
© ASSA ABLOY – Quarterly Report Q2 2018 20 (21)
New accounting standards and standards not yet effective
IFRS 9 ‘Financial Instruments’IFRS 9 addresses the classification, measurement and recognition ASSA ABLOY allocates the transaction price to each performanceof financial liabilities and assets and replaces the parts of IAS 39 obligation on the basis of a stand-alone selling price. The stand-that relate to the classification and measurement of financial alone selling price is the price at which the Group would sell instruments. With IFRS 9 a new impairment model is being the good or service separately to a customer. If a stand-alone implemented, based on expected credit losses rather than incurred selling price is not directly observable, it is usually calculated either losses. For the Group, the new model will entail a partly new by the method of adjusted market assessment or from expected process for the measurement of credit losses, but the Standard will costs plus a profit margin.have no material impact on the Group’s performance and financialposition. Any rebates are allocated proportionately to all performance
obligations in the contract unless there is clear evidence that IFRS 15 ‘Revenue from Contracts with Customers’ the rebates do not apply to all performance obligations.IFRS 15 supersedes IAS 11 ‘Construction Contracts’ andIAS 18 ‘Revenues’ and includes a new single model for revenue ASSA ABLOY recognizes revenues when the Group fulfils recognition related to customer contracts. The new Standard a performance obligation by delivering a good or service to introduces a five-step model as the basis for the recognition a customer, i.e. when the customer acquires control over the asset. of revenues from contracts with customers. The Standard A performance obligation may either be fulfilled over time or at prescribes that a company shall recognize revenues when the a particular point in time. ASSA ABLOY recognizes the revenues company fulfills a performance obligation by transferring a over time if any of the following criteria are met:promised good or service to a customer. The good or service is transferred when the customer acquires control over the asset, a) The customer simultaneously receives and consumes the which may happen either over time or at a particular point in time. benefits provided by the Group’s performance as the GroupIn all important respects the Group’s previous revenue recognition performspractices conform with IFRS 15 and the new Standard will therefore b) The Group’s performance creates or enhances an asset which have no impact on the Group’s performance and financial position. the customer controls as the asset is created or enhanced However, additional information about the disaggregation of c) The Group’s performance does not create an asset with anrevenue is given in Note 1. alternative use to the Group and the Group has a right to
payment for performance completed to date.According to the five-step model, a company should carry out the following steps of revenue recognition: Identify the customer Revenues that are not recognized over time are recognized at contract; Identify the performance obligations; determining the a particular point in time: i.e. the time when the customer acquires transaction price; Allocate the transaction price to the performance control over the asset.obligations, and finally recognize the revenues assignable to eachof the performance obligations. ASSA ABLOY’s revenues come mainly from sales of products.
Service related to products sold provides only a limited part of At the start of a customer contract, ASSA ABLOY decides whether the revenues. Reporting of revenues resulting from sale of the goods and/or services that are promised comprise a single the Group’s products is made at a particular point in time when performance obligation or several separate performance the customer acquires control of the product – normally upon obligations. A performance obligation is defined as a distinct delivery. ASSA ABLOY also provides installation services which promise to transfer a good or service to the customer. A promised are recognized over time. For shorter installation contracts, good or service is distinct if both the following criteria are met: revenues are in practice recognized when the installation is
completed. Revenues from service contracts are recognized as a) the customer can benefit from the good or service either on its income over time.own or together with other resources that are readily available to the customer, and Adjustment of opening balances in 2018b) the Group’s promise to transfer the good or services to Since IFRS 9 and IFRS 15 have no material impacts on thethe customer is separately identifiable from other promises in the financial reports, no new opening balance is presented in 2018. contract.
IFRS 16 ‘Leasing’When setting the transaction price, which is the payment promised IFRS 16 will apply to the accounting year that begins on 1 January in the contract, the Group takes account of possible payment 2019. Earlier application is permitted but the Group has chosen variations such as cash discounts, volume discounts and rights to not to take up this option. Application of the new Standard means return goods. Payment variations are included in the transaction that ASSA ABLOY will recognize all significant lease contracts in price only if it is highly probable that no significant return of the balance sheet. The Group’s lease contracts mainly concern revenues is expected to occur in a future period. leased premises, company cars and production and office
equipment. Preparatory work prior to implementation is in ASSA ABLOY receives advance payments from customers to progress, but the Group has not yet evaluated the financial effects a limited extent. None of the Group’s customer contracts of the Standard.concerning the sale of goods or services is thought to incorporate a significant financing component. The Group reports no contractassets because it adopts the practical solution permitted bythe Standard which means that moneys for paying a customer contract are reported as costs at the time when they arise if the write-off period for the asset that the Group would otherwise have reported is no more than one year.

© ASSA ABLOY – Quarterly Report Q2 2018 21 (21)
Definitions of financial performance measures
Organic growth Net debtChange in sales for comparable units after adjustments for Interest-bearing liabilities less interest-bearing assets.acquisitions and exchange rate effects.
Capital employedOperating margin (EBITDA) Total assets less interest-bearing assets and non-interest-Operating income before depreciation and amortization as a bearing liabilities including deferred tax liability.percentage of sales.
Equity ratioOperating margin (EBITA) Shareholders' equity as a percentage of total assets.Operating income before amortization of intangible assetsrecognized in business combinations, as a percentage of sales. Interest coverage ratio
Income before tax plus net interest divided by net interest.Operating margin (EBIT)Operating income as a percentage of sales. Return on shareholders' equity
Net income attributable to parent company's shareholdersProfit margin (EBT) as a percentage of average parent company's shareholdersIncome before tax as a percentage of sales. equity.
Operating cash flow Return on capital employedSee the table on operating cash flow for detailed information. For Income before tax plus net interest as a percentage ofrelationship between operating cash flow and cash flow from average capital employed excluding restructuring reserves.operating activities see the company's last Annual Report.
Earnings per share after tax and dilutionNet capital expenditure Net income excluding non-controlling interests divided byInvestments in, less disposals of, intangible assets and weighted average number of outstanding shares after anyproperty, plant and equipment. potential dilution.
Depreciation and amortizationDepreciation and amortization of intangible assets andproperty, plant and equipment.