Embed Size (px)
Citation preview

Solid-State Nuclear Magnetic Resonance (NMR) Spectroscopy ofHuman Immunodeficiency Virus gp41 Protein That Includes theFusion Peptide: NMR Detection of Recombinant Fgp41 in InclusionBodies in Whole Bacterial Cells and Structural Characterization ofPurified and Membrane-Associated Fgp41Erica P. Vogel, Jaime Curtis-Fisk, Kaitlin M. Young, and David P. Weliky*
Department of Chemistry, Michigan State University, East Lansing, Michigan 48824, United States
*S Supporting Information
ABSTRACT: Human immunodeficiency virus (HIV) infec-tion of a host cell begins with fusion of the HIV and host cellmembranes and is mediated by the gp41 protein, a single-passintegral membrane protein of HIV. The 175 N-terminalresidues make up the ectodomain that lies outside the virus.This work describes the production and characterization of anectodomain construct containing the 154 N-terminal gp41residues, including the fusion peptide (FP) that binds to targetcell membranes. The Fgp41 sequence was derived from one of the African clade A strains of HIV-1 that have been less studiedthan European/North American clade B strains. Fgp41 expression at a level of ∼100 mg/L of culture was evidenced by anapproach that included amino acid type 13CO and 15N labeling of recombinant protein and solid-state NMR (SSNMR)spectroscopy of lyophilized whole cells. The approach did not require any protein solubilization or purification and may be ageneral approach for detection of recombinant protein. The purified Fgp41 yield was ∼5 mg/L of culture. SSNMR spectra ofmembrane-associated Fgp41 showed high helicity for the residues C-terminal of the FP. This was consistent with a “six-helixbundle” (SHB) structure that is the final gp41 state during membrane fusion. This observation and negligible Fgp41-inducedvesicle fusion supported a function for SHB gp41 of membrane stabilization and fusion arrest. SSNMR spectra of residues in themembrane-associated FP provided evidence of a mixture of molecular populations with either helical or β-sheet FP conformation.These and earlier SSNMR data strongly support the existence of these populations in the SHB state of membrane-associatedgp41.
The human immunodeficiency virus (HIV) is enveloped bya membrane obtained during budding from an infected
host cell. An early step in HIV infection of a new cell is joiningor “fusion” of the HIV and host cell membranes. This process iscatalyzed by the ∼350-residue HIV gp41 protein that is anintegral membrane protein of the viral envelope.1 The ∼175 N-terminal residues form the ectodomain that lies outside HIV(see Figure 1a for most of the ectodomain sequence andidentification of structural and functional regions). Prior tofusion, gp41 is noncovalently associated with the gp120 protein(Figure 1b). Productive infection begins with binding of gp120to receptor proteins in a target cell membrane and is followedby dissociation of gp120 from gp41.2 There are ensuingstructural changes of gp41 and likely binding of the ∼20-residue N-terminal “fusion peptide” (FP) region to target cellmembranes with concurrent changes in the two membranes,including mixing of lipids, formation of a single hemifusiondiaphragm bilayer that separates the HIV and cell contents, andopening of the diaphragm to form a single membrane thatencloses HIV and the cell.3 Although there are no high-resolution structures of full-length gp41, other structural andfunctional data support (1) trimeric gp41, (2) an early stage
“prehairpin intermediate” (PHI) state with a parallel trimer offully extended ectodomains between the HIV membrane andthe FP in the cell membrane, and (3) a final “six-helix bundle”(SHB) state with a gp41 trimer with each gp41 molecule havingan N-helix−turn−C-helix hairpin structure and parallel N-helices in the trimer interior and parallel C-helices on thetrimer exterior (Figure 1b).4−7 Studies of cell−cell fusioninduced by gp120−gp41 complexes indicate that mostmembrane fusion steps with the exception of diaphragmopening occur prior to formation of the final SHB state.8
The importance of the FP in fusion and infection has beenhighlighted by decreases in both functions with point mutationsin the FP.9 The current understanding of gp41 is also based onsmaller fragments of gp41 where fusogenic function hastypically been assayed by fragment-induced perturbation orfusion of membrane vesicles. One such fragment is the HIVfusion peptide (HFP) that corresponds to the 20−30 N-
Received: August 13, 2011Revised: October 7, 2011Published: October 10, 2011
Article
pubs.acs.org/biochemistry
© 2011 American Chemical Society 10013 dx.doi.org/10.1021/bi201292e |Biochemistry 2011, 50, 10013−10026

terminal residues of gp41 and has moderate fusogenicity.10 Thefunctional significance of the PHI trimeric topology (Figure 1b)has been supported by the high fusogenicity of (1) a cross-linked HFP trimer (HFPtr) and (2) “N70”, the 70 N-terminalresidues of gp41.10−13 The higher fusogenicity of N70 relativeto that of the HFP may also have a contribution from the N-helix residues that are C-terminal of the FP. Much largerectodomain constructs have also been produced with N-helixand C-helix regions and form the thermostable SHB structure(Figure 1b), which is the final gp41 state. Different approacheswere used to obtain these FP-containing hairpin constructs. Inone approach, the FP and hairpin regions were producedseparately by chemical synthesis and bacterial expression,respectively, and the “FP-hairpin” was then made by nativechemical ligation.11,12 In another approach, a chimera wasexpressed in Escherichia coli and contained an N-terminalmolecular carrier protein (e.g., glutathione S-transferase)followed by the gp41 ectodomain.14−16 The carrier was cleavedduring purification. There are conflicting results from differentstudies of the fusogenicity of such hairpin constructs withreports of both very high levels of fusion and no fusion. Therewere some differences among the studies, including (1)deletion of loop residues between the N- and C-helices insome constructs, (2) lipid compositions of the vesiclesincluding different fractions of negatively charged lipid, (3)the use of smaller and less stable sonicated vesicles versus largerand more stable extruded vesicles, and (4) pH values thatranged between 3.0 and 7.5.17
Structural studies have also been conducted for some of theaforementioned fragments. A helical monomer HFP has beenobserved in detergent with one report of a continuous helixbetween residues 4 and 22.18−22 However, to the best of ourknowledge, the HFP does not induce fusion between detergentmicelles. The structure of the membrane-associated HFP hasbeen probed mostly by solid-state nuclear magnetic resonance(SSNMR) spectroscopy with supporting data from othertechniques such as infrared spectroscopy.23−25 SSNMR spectra
of the HFP associated with membranes lacking cholesterolshow distinct populations of predominant β-sheet andpredominant α-helical molecules, while the HFP associatedwith membranes with ∼30 mol % cholesterol shows only the β-sheet conformation with an antiparallel alignment of adjacenthydrogen-bonded HFPs.10,26−30 The biological relevance ofmembrane cholesterol is supported by the ∼25 mol %cholesterol in host cell membranes and the ∼45 mol %cholesterol in HIV membranes.31 The FP structure appears tobe similar in the highly fusogenic HFP trimer and in N70,whereas the FP-hairpin construct with SHB structure showedapproximately equal populations of molecules with either β-sheet or helical FP structures.10,12,29 For membrane-associatedN70, the N-helix residues appear to be predominantly helicaland N70 is recognized by an antibody specific for trimericcoiled-coil N-helices.32 There are several high-resolutionstructures of hairpin constructs without the FP that show (1)the hairpin structure of individual molecules and (2) moleculartrimers with SHB structure.4−7
SSNMR requires production of multimilligram quantities ofisotopically labeled protein, and protein yields may be reducedby ligation and/or cleavage steps. This was the reason behindone of the goals of this study, expression of the FP-containinggp41 ectodomain (“Fgp41”) in bacteria without a chimera orligation. This goal seemed reasonable because recentlydeveloped protocols yielded 20 mg of protein/L of culturefor the full-length “FHA2” ectodomain of the influenza virusfusion protein.33−35 There is considerable diversity among HIVprotein sequences in patient sera and in cell cultures. This wasthe reason behind a second goal of this study, functional andstructural experiments on a gp41 ectodomain sequence thatdiffered from the sequence of the earlier studies to address thegenerality of the functional and structural findings across strainsof HIV. In these earlier studies, the sequence was from theHXB2 strain of HIV-1 that was first created in a cell culture in1984 and is grouped with “clade B” HIV-1 prevalent in patientsin North America and Europe.36 In some contrast, the gp41
Figure 1. (a) Fgp41 amino acid sequence with regions encompassing the fusion peptide, N-helix, and C-helix colored blue, red, and green,respectively. (b) Conceptual representation of gp41 structural states with time increasing from left to right and the same color coding as panel a. Thesequence is from the HIV-1 clade A isolate, AY288087 or Q45D5. This is a primary isolate from a female patient in Kenya. The last eight residues ofthe sequence are non-native. The red and green regions were based on continuous helical regions in high-resolution structures of different solubleectodomain gp41 constructs with the hairpin conformation (shown schematically in panel b). In these SHB structures, the red and green helices areantiparallel to one another.
Biochemistry Article
dx.doi.org/10.1021/bi201292e |Biochemistry 2011, 50, 10013−1002610014

sequence in this study is from the primary HIV-1 isolateQ45D5 from the sera of a newly infected Kenyan woman.37
The Q45D5 isolate is grouped with clade A HIV-1 that isprevalent in Central and East Africa. The HXB2 and Q45D5gp41 ectodomain sequences are provided in the SupportingInformation. A third goal of this study was to conductfunctional and SSNMR structural studies to compare with theFP-hairpin construct in which 46 contiguous residues, includingthe native loop, were replaced with the non-native SGGRGGsequence.11,12,17 The FP-hairpin did not induce vesicle fusionand inhibited fusion by constructs such as N70. The deletion ofthese residues in the FP-hairpin may be important as a 35-residue peptide that included the native loop region inducedvesicle fusion under some conditions.38 The Fgp41 construct ofthe present study has the native sequence without deletion.
■ MATERIALS AND METHODS
Materials. The Fgp41 plasmid was constructed within thepET24a(+) vector using the DNA sequence of the Q45D5primary isolate that is grouped with clade A of HIV-1. Theplasmid was transformed into BL21(DE3) chemically com-petent E. coli cells (Novagen, Gibbstown, NJ). The Fgp41amino acid sequence is given in Figure 1a, and the correlativesequence from plasmid DNA extracted from the cells isprovided in the Supporting Information. Other reagents andtheir sources were as follows: Luria-Bertani broth (LB) medium(Acumedia, Lansing, MI), n-octyl β-D-thioglucopyranoside(bTOG) and isopropyl β-D-thiogalactopyranoside (IPTG)(Anatrace, Maumee, OH), 1-palmitoyl-2-oleoyl-sn-glycero-3-phosphocholine (POPC) and 1-palmitoyl-2-oleoyl-sn-glycero-3-[phospho-rac-(1-glycerol)] (sodium salt) (POPG) (AvantiPolar Lipids, Alabaster, AL), and isotopically labeled aminoacids (Cambridge Isotope Laboratories, Andover, MA). Othermaterials were obtained from Sigma-Aldrich (St. Louis, MO).Protein Production and Purification. The protocol was
based on a previous protocol for the influenza virus fusionprotein ectodomain.34 One key feature was initial bacterialgrowth in rich medium to high cell densities. Relative to initialgrowth in minimal medium, protein production was augmentedby the cell densities and by the larger number of ribosomes percell. Bacterial cell cultures were grown in media containing 15mg/L kanamycin because the pET24a(+) vector contains agene for kanamycin resistance. Bacterial cells in 1 mL of an 80/20 (v/v) H2O/glycerol mixture were added to two 2.8 L baffledfernbach flasks that each contained 1 L of LB and were cappedwith a foam plug. Bacterial growth to an OD600 of ≈4 occurredduring overnight incubation at 37 °C with shaking at 140 rpm.The cell suspensions were centrifuged (10000g for 10 min),and the cell pellets were harvested and then resuspended in asingle flask containing 1 L of fresh medium with M9 minimalsalts, 2.0 mL of 1.0 M MgSO4, and 5.0 mL of a 50% glycerolsolution. Growth resumed after incubation at 37 °C forapproximately 1 h. At this time, 100 mg of 1-13C-labeled aminoacid per liter and 100 mg of 15N-labeled amino acid per liter (or100 mg of 1-13C- and 15N-labeled amino acid per liter) wereadded to the medium. IPTG was then added to a finalconcentration of 2 mM, which induced expression of Fgp41 (6h at 23 °C). The cell pellet was harvested after centrifugationand stored at −80 °C. The wet cell mass was ∼8 g.A variant of this procedure was used to make whole cell
NMR samples and included (1) 50 mL culture volumes in 250mL flasks, (2) overall reagent concentrations similar to those
described above, including ∼10 mg of labeled amino acid(s),and (3) in some cases lyophilization of the cells.The Fgp41 purification was based on the C-terminal His tag,
and the following protocol is for ∼3 g of wet cells. Most Fgp41was in inclusion bodies, so cells were lysed in a 40 mL solutioncontaining 1% sodium dodecyl sulfate (SDS) as well as 50 mMsodium phosphate (pH 8.0), 300 mM NaCl, and 1 mMimidazole. Lysis was accomplished by sonication (4 × 1 min)with a tip sonifier (Branson, Danbury, CT), and the soluble andinsoluble portions of the lysate were then separated bycentrifugation (48000g for 20 min at 4 °C). The soluble lysatewas mixed with 0.25 mL of cobalt His-Select resin (preparedusing the manufacturer’s instructions) and then agitated atambient temperature for 1 h. The resin with bound Fgp41 wasseparated from the lysate by flow through a fritted column.Purification was accomplished by passing buffer [50 mMsodium phosphate (pH 8.0), 300 mM NaCl, and 0.5% SDS]through the resin with stepwise increases in imidazoleconcentration. Weakly bound protein was first eluted withbuffer containing 1, 20, or 50 mM imidazole, and tightly boundprotein (predominantly Fgp41) was subsequently eluted withbuffer containing 250 mM imidazole. Excess SDS wasprecipitated by overnight incubation at 4 °C and removed bycentrifugation (16000g for 1 min). Fgp41 was typically dialyzedinto “HEPES/MES” buffer [5 mM HEPES and 10 mM MES(pH 7.4)]. Fgp41 concentrations were quantified using an ε 280of 46000 M−1 cm−1, which was estimated from the sum of theε 280 values of individual tryptophans and tyrosines.Circular Dichroism (CD) Spectroscopy. Spectra were
recorded using a CD instrument (Chirascan, Applied Photo-physics, Surrey, U.K.), a 1 mm path length, a 260−200 nmspectral window, wavelength points separated by 0.5 nm, and 1s signal averaging per point. Fgp41 samples were prepared byprecipitation of excess SDS followed by overnight dialysis intoHEPES/MES buffer (pH 7.4) with DTT added at 2 times themolar concentration of Fgp41 to prevent disulfide bondformation. Most spectra were obtained with 20 μM Fgp41.For each sample, a reference spectrum was also taken of bufferwithout Fgp41 and the relevant Fgp41 spectrum was thedifference between the spectra for Fgp41 and buffer and bufferonly.Lipid Mixing. One early step in fusion between the HIV
and target cell membranes is mixing of lipids between the twomembranes. This aspect of Fgp41 fusogenicity was probed byfluorescence-detected Fgp41-induced mixing of lipids betweenmembrane vesicles. A set of vesicles that contained POPC andPOPG lipids in a 4:1 molar ratio was prepared, and another setof “labeled” vesicles that contained an additional 2 mol % of thefluorescent lipid N-NBD-PE and 2 mol % of the quenchinglipid N-Rh-PE was prepared. Large unilamellar vesicles (LUVs)were prepared by (1) dissolving lipids in chloroform and thenremoving chloroform by nitrogen gas and overnight vacuum,(2) formation of pH 7.5 aqueous lipid dispersions with ≈5 mMtotal lipid and 25 mM HEPES, including five freeze−thawcycles, and (3) ∼20-fold extrusion through a polycarbonatefilter with 0.1 μm diameter pores. The assay was conducted at37 °C with continuous stirring in HEPES buffer using a mixtureof unlabeled vesicles (135 μM total lipid) and labeled vesicles(15 μM total lipid). After measurement of the initialfluorescence F0, an aliquot of 30 μM Fgp41 in HEPES/MESbuffer was added to the vesicle solution so that the final Fgp41concentration was 3 μM and the Fgp41:total lipid ratio was0.02. Fgp41-induced fusion between labeled and unlabeled
Biochemistry Article
dx.doi.org/10.1021/bi201292e |Biochemistry 2011, 50, 10013−1002610015

vesicles resulted in a longer fluorophore−quencher distanceand increased fluorescence. The fluorescence increase ΔFFgp41was compared to the maximal fluorescence increase (ΔFmax)obtained after subsequent addition of the Triton X-100detergent that solubilized the vesicles. Assay parametersincluded (1) the fluorimeter from Photon TechnologyInternational, (2) excitation and emission wavelengths of 465and 530 nm, respectively, with 4 nm bandwidths, and (3) 1.8mL of an initial vesicle solution, a 0.2 mL aliquot of Fgp41, andan ∼20 μL aliquot of 10% Triton X-100.Membrane Reconstitution. A homogeneous mixture of
the POPC (28 mg) and POPG (7 mg) lipids and the bTOG(140 mg) detergent was made by (1) dissolution in chloroform,(2) removal of chloroform via nitrogen gas and overnight
vacuum, and (3) dissolution in HEPES/MES buffer. Fgp41(∼10 mg) was added to the solution and had been in affinitycolumn eluents from which excess SDS had been removed.Dialysis of the bTOG/lipid/Fgp41 solution against HEPES/MES buffer removed bTOG with consequent liposomeformation with bound Fgp41. Dialysis parameters included(1) a bTOG/lipid/Fgp41 solution in 10 kDa molecular masscutoff tubing (initial volume of ∼15 mL), (2) a 3 L buffervolume, and (3) a 3 day duration with one buffer change. Theproteoliposome pellet was harvested after centrifugation(50000g for 3 h), and unbound Fgp41 did not pellet underthese conditions. The pellet was packed into a 4 mm diametermagic angle spinning (MAS) rotor with ∼5 mg of Fgp41 and∼20 mg of total lipid in the 40 μL active sample volume.
Figure 2. REDOR 13CO NMR spectra of whole bacterial cells produced by sequential steps: (1) growth in rich medium, (2) growth in minimalmedium, (3) addition of labeled or unlabeled amino acid(s), (4) induction of Fgp41 expression, and (5) centrifugation. The induction temperatureand duration were either (a−c) 23 °C and ∼2 h or (d) 37 °C and ∼5 h, respectively. The left panels display S0 (blue) and S1 (red) spectra and theright panels the ΔS ≡ S0 − S1 spectra. The REDOR dephasing time was either (a−c) 1 or (d) 2 ms. For panels a, b, and d, the dominant contributionto each ΔS spectrum was from residues with labeled 13CO groups that were directly bonded to labeled 15N atoms. These residues were (a and b)L33, L44, L54, L81, L134, and L149 of the LL sequential pairs of Fgp41 and (d) G10 of the G10-F11 unique sequential pair. Each S0 or S1 spectrumwas processed with 100 Hz Gaussian line broadening, and each ΔS spectrum was processed with either (a and d) 200 or (b and c) 100 Hz linebroadening. Polynomial baseline correction (typically fifth order) was applied to each spectrum. Each S0 or S1 spectrum was the sum of (a) 100000,(b) 100000, (c) 127222, or (d) 48448 scans.
Biochemistry Article
dx.doi.org/10.1021/bi201292e |Biochemistry 2011, 50, 10013−1002610016
Solid-State NMR Spectroscopy. Data were obtained witha 9.4 T instrument (Agilent Infinity Plus) and a triple-resonance MAS probe whose rotor was cooled with nitrogengas at −10 °C. Because of heating from MAS and rf radiation,we expect that water in the sample was liquid rather than solid.Experimental parameters included (1) an 8.0 kHz MASfrequency, (2) a 5 μs 1H π/2 pulse and 2 ms cross-polarizationtime with a 50 kHz 1H field and a 70−80 kHz ramped 13C field,(3) a 1−2 ms rotational-echo double-resonance (REDOR)dephasing time with a 9 μs 13C π-pulse at the end of each rotorperiod except the last period and, for some data, a 12 μs 15N π-pulse at the center of each rotor period, (4) 13C detection with90 kHz two-pulse phase modulation 1H decoupling (which wasalso on during the dephasing time), and (5) a 0.8 s pulsedelay.39 Data were acquired without (S0) and with (S1)
15N π-pulses during the dephasing time and represented the full 13Csignal and the signal of 13C atoms not directly bonded to 15Nnuclei, respectively. The S0 − S1 (ΔS) difference signal wastherefore dominated by the labeled 13CO groups in thesequential pairs targeted by the labeling. Spectra were externallyreferenced to the methylene carbon of adamantane at 40.5ppm, so that the 13CO shifts could be directly compared tothose of soluble proteins.40
■ RESULTS
Detection of Fgp41 in Whole Cells by Solid-StateNMR. The bacterial growth and Fgp41 expression conditionswere very similar to those used for FHA2, a constructcorresponding to the full-length ectodomain (including thefusion peptide) of the influenza virus HA2 fusion protein.34
Like Fgp41, FHA2 had a C-terminal hexahistidine tag, andbacterial cell lysis and protein solubilization in buffer containingN-lauroylsarcosine detergent followed by affinity chromatog-raphy resulted in 10 mg of purified FHA2/L of culture. In somecontrast, application of this protocol to cells induced tosynthesize Fgp41 gave only 0.1 mg of Fgp41/L of culture. Itwas unclear whether the poor yield was due to a low level ofFgp41 expression or to poor Fgp41 solubilization by thedetergent.The FHA2 solubilized by the detergent was likely initially
associated with the cell membrane. It was also shown that amuch larger fraction of FHA2 was not solubilized by detergentand was likely constituted in inclusion bodies. The poor yield ofFgp41 might therefore be due to dominant incorporation ininclusion bodies. The molecular structure of FHA2 in inclusionbodies had been probed by (1) adding specific 13CO- and 15N-
Figure 3. REDOR 13C NMR spectra of lyophilized whole bacterial cells produced with either [1-13C,15N]Leu or unlabeled Leu. The cell productionand NMR parameters are described in the legend of Figure 2b,c. Panel a displays the S0 spectra of the (blue) labeled and (black) unlabeled cells withthe relative intensities adjusted to yield the best agreement in the 0−90 ppm region. The spectral intensity in this region should not be affected bythe labeling. The incorporation of the labeled Leu into protein synthesized during the induction period is evidenced by the larger 13CO intensity forthe labeled cell spectrum. Panel b displays the S1 spectra of the (red) labeled and (black) unlabeled cells. Panel c displays the S0 (blue) and S1 (red)spectra processed from the difference NMR data: labeled cells − 0.75 × unlabeled cells. The 0.75 factor reflects the ratio of the number of scanssummed for the labeled cells relative to the number for the unlabeled cells and resulted in a minimal signal in the 0−90 ppm region. The spectra inpanel c are representative of the [1-13C,15N]Leu incorporated into the cellular protein.
Biochemistry Article
dx.doi.org/10.1021/bi201292e |Biochemistry 2011, 50, 10013−1002610017

labeled amino acids immediately prior to induction, (2)recording REDOR SSNMR spectra of the whole cells afterinduction so that the filtered ΔS signal corresponded to the13CO group of a targeted residue in FHA2, and (3) correlationof the experimental peak 13CO shift with the localconformation at this residue.41 A modified approach wasapplied to cells induced to express Fgp41 with the goal ofassessing Fgp41 production. Addition of 10 mg of[1-13C,15N]Leu to a 50 mL culture just prior to induction ofexpression targeted the 24 Leu residues and six LL repeats inthe Fgp41 sequence (Figure 1a). The isotropic 13CO regions ofthe REDOR S0, S1, and ΔS spectra of the cells are displayed inFigure 2a,b. The Figure 2a sample was an aliquot of the wet cellpellet obtained after the induction period and subsequentcentrifugation, and the Figure 2b sample was an aliquot of thiswhole cell pellet that had been lyophilized. The spectra weresimilar for both wet and lyophilized cells with ∼4 times greatersignal per scan in the lyophilized cell sample because thissample had a higher fraction of nonaqueous cell mass. Foreither sample type, the intensity of the S1 spectrum was reducedrelative to S0. This supported the presence of LL repeats in theprotein produced during the induction period and correlatedwith the six LL repeats in the Fgp41 sequence. The ΔS spectrahad prominent signals in the 13CO region, and these were theonly signals that could be detected above the noise (see theSupporting Information for full spectra). Control cells wereproduced using unlabeled rather than labeled Leu. Theresultant NMR spectra are displayed in Figure 2c and hadcomparable S0 and S1 intensities with little 13CO ΔS signal.This provided further support for the idea that the 13CO ΔSsignal from the labeled cells could be ascribed to LL repeats inprotein produced during expression. Cells were also labeledwith [1-13C]Gly and [15N]Phe that targeted the 11 Gly residuesin the Fgp41 sequence and the single GF pair at G10 and F11.The resulting NMR spectra are displayed in Figure 2d andincluded a prominent 13CO ΔS signal that was consistent withFgp41 production.Both labeled and natural abundance 13CO groups contribute
to the S0 and S1 NMR signals of the labeled whole cells. Panelsa and b of Figure 3 provide quantitative assessment of thesetwo contributions and show the full S0 and S1 spectra,respectively, of the Leu-labeled and unlabeled cells. In eachpanel, the two spectra were scaled to have equal intensity in the0−90 ppm region because this region should be unaffected bylabeling. The ratio of the unlabeled to labeled scaling factorswas ∼0.75 and matched the ratio of numbers of scans summedfor the labeled versus unlabeled samples. This matching wasexpected because the signal intensities of individual scans wereapproximately equal to each other, so the sum signal intensityincreased linearly with the number of scans. For panels a and b,the difference between the intensities in the 13CO region wasthe labeled Leu contribution to the S0 and S1 signal,respectively. For these labeled Leu 13CO groups, there was asmaller S1 intensity relative to that of S0. This is shown moreclearly in Figure 3c, which displays the S0 and S1 spectraprocessed from labeled cell data − 0.75 × unlabeled cell data.For labeled Leu in the cells, the normalized experimentaldephasing (ΔS/S0)exp equals 0.13 ± 0.01 and was determinedfrom the 13CO S0 and S1 intensities in panel c.The following model and analysis support the idea that most
of the labeled Leu was in Fgp41; i.e., Fgp41 was the dominantprotein produced during expression. Consider the model. (1)The 24 Leu residues of Fgp41 are labeled with 13CO and 15N.
(2) The 13CO groups of the N-terminal Leu residues of the sixLL repeats (directly bonded to 15N) have an S1/S0 intensityratio of 0.3. (3) The other 18 Leu 13CO groups have an S1/S0ratio of 1.0. Points 2 and 3 are based on earlier experiments andsimulations.42 For the Fgp41 Leu 13CO groups, (ΔS/S0)calc =[24 − 18 − (6)(0.3)]/24 = 0.17, which is close to (ΔS/S0)expand supports dominant production of Fgp41 during theinduction period. Additional evidence of the production ofFgp41 from SSNMR spectra is described later in the paper andresulted in an estimate of the ratio of the mass of Fgp41 to themass of lyophilized cells.Optimization of Fgp41 Solubilization. Initial cell lysis
buffers contained either 8 M urea, 0.5% N-lauroylsarcosine,0.5% Triton X-100, or 10% SDS (see Materials and Methodsfor other buffer components). The solubilization efficiency ofthe buffer was assessed using detection of a band at ∼19 kDa(assigned to Fgp41) in the SDS−PAGE gel of the soluble lysateand then consideration of the absolute intensity of this band aswell as its intensity relative to those of other bands in the gellane. A dark Fgp41 band that was intense relative to otherproteins was observed with lysis in buffer containing SDS (seethe Supporting Information for a representative gel). Bandsthat may be Fgp41 were also apparent for lyses in either urea orN-lauroylsarcosine; however, purifications of these lysatesconsistently yielded <1 mg of Fgp41/L of culture, whereaspurifications of SDS lysates yielded >1 mg of Fgp41/L ofculture. Subsequent lyses were therefore conducted with SDS.The effect of SDS concentration on Fgp41 solubilization wasfurther investigated by comparison of lysis in buffer containingeither 0.5, 1, 3, or 5% SDS. For 1%, a dark band that wasintense relative to other proteins was observed (see theSupporting Information). Subsequent lyses were conductedusing 1% SDS. The effect of different sonication conditionsduring lysis on Fgp41 solubilization was also investigated. Thedarkest Fgp41 band was observed using four 1 min cycles at80% amplitude with 0.8 s on and 0.2 s off. Increasing thenumber of cycles did not result in a darker band.Optimization of Fgp41 Expression. Experiments were
conducted to investigate the effects on Fgp41 expression of (1)the glycerol concentration in the expression medium, (2) theIPTG concentration, and (3) the induction time. The protocolincluded (1) overnight cell growth at 37 °C from a glycerolstock in 2 L of LB, (2) cell pelleting by centrifugation followedby resuspension in 1 L of LB, (3) growth at 37 °C for 1 h, (4)transferring 100 mL aliquots of medium into separate flasks,(5) addition of glycerol and then IPTG with the concomitantinduction of expression at 23 °C, (6) cell pelleting bycentrifugation followed by lysis in buffer with 1% SDS, and(7) SDS−PAGE of the soluble cell lysates with visualcomparison of their Fgp41 band intensities. In general, onlyone parameter, e.g., IPTG concentration, was varied among agroup of aliquots. Results were as follows. (1) Comparisonamong 0.2, 1.0, or 2.0 mM IPTG showed the darkest band at2.0 mM. (2) Comparison among 0.1, 0.25, and 0.5% (v/v)glycerol showed the darkest bands for 0.1 and 0.25%. (3)Comparison among induction times of 2, 4, and 6 h showed thedarkest band for 6 h. Subsequent experiments were conductedusing 2 mM IPTG, 0.25% glycerol, and a 6 h induction.Optimization of Fgp41 Purification. The basis for the
development of the Fgp41 purification protocol was an earlierprotocol developed in our lab for FHA2.34 The Fgp41 bandwas observed with a modified protocol using buffers thatcontained 50 mM sodium phosphate (pH 8.0), 0.5% SDS, 300
Biochemistry Article
dx.doi.org/10.1021/bi201292e |Biochemistry 2011, 50, 10013−1002610018
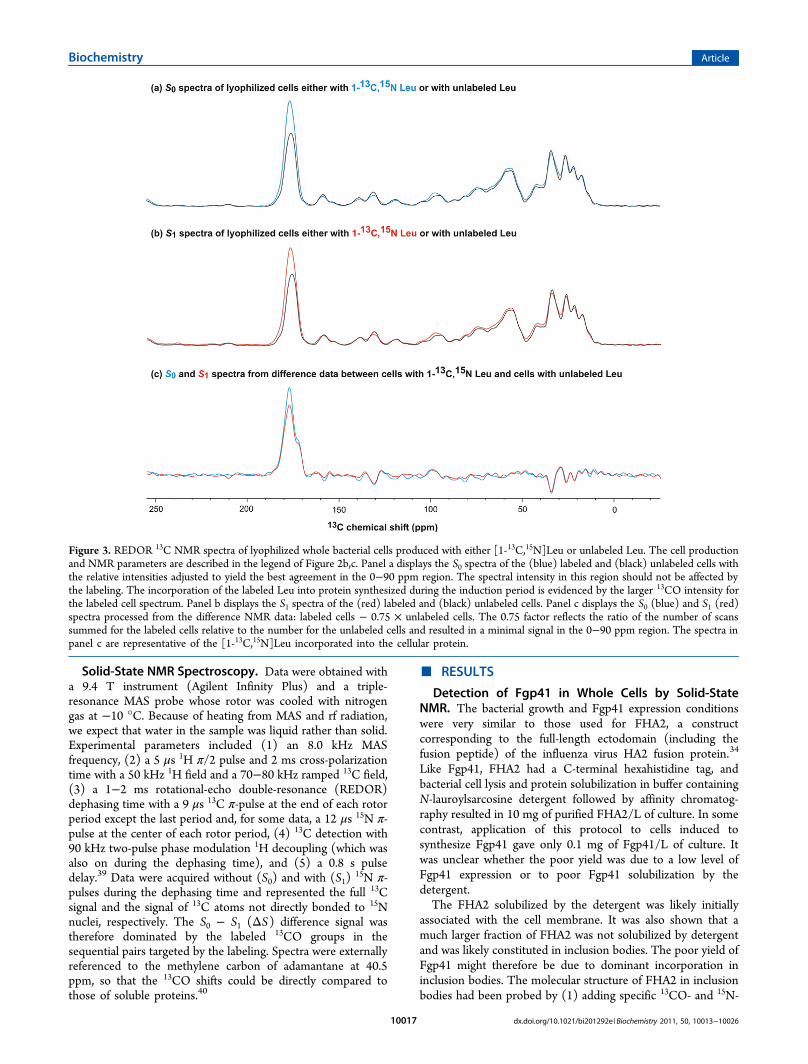
mM NaCl, and imidazole at different concentrations. Relativeto only washing with buffer containing 20 mM imidazole,SDS−PAGE showed that sequential washes with bufferscontaining 1, 20, and 50 mM imidazole was more effective atwashing non-Fgp41 proteins from the resin while leaving mostFgp41 bound to the resin. After the washes, the Fgp41 waseluted from the resin using buffer containing 250 mMimidazole. The eluent was incubated overnight at 4 °C withconsequent precipitation of excess SDS. Negligible Fgp41precipitated as evidenced by very similar A280 values for theeluent before and after incubation. SDS−PAGE showed thatthe eluent contained highly pure Fgp41 (Figure 4a) and that
Fgp41 could be membrane-reconstituted (Figure 4b). The finalpurified yield of Fgp41 (as determined by A280) was ∼5 mg/Lof culture. This yield was obtained using a 1 h initial mixing ofthe lysate and resin with a similar yield obtained for a 2 hmixing and a reduced yield 3 mg/L for a 4 h mixing. Enhancedproteolysis is one explanation for a reduced yield with a longermixing time.CD Spectroscopy. Figure 5 (black trace) displays the CD
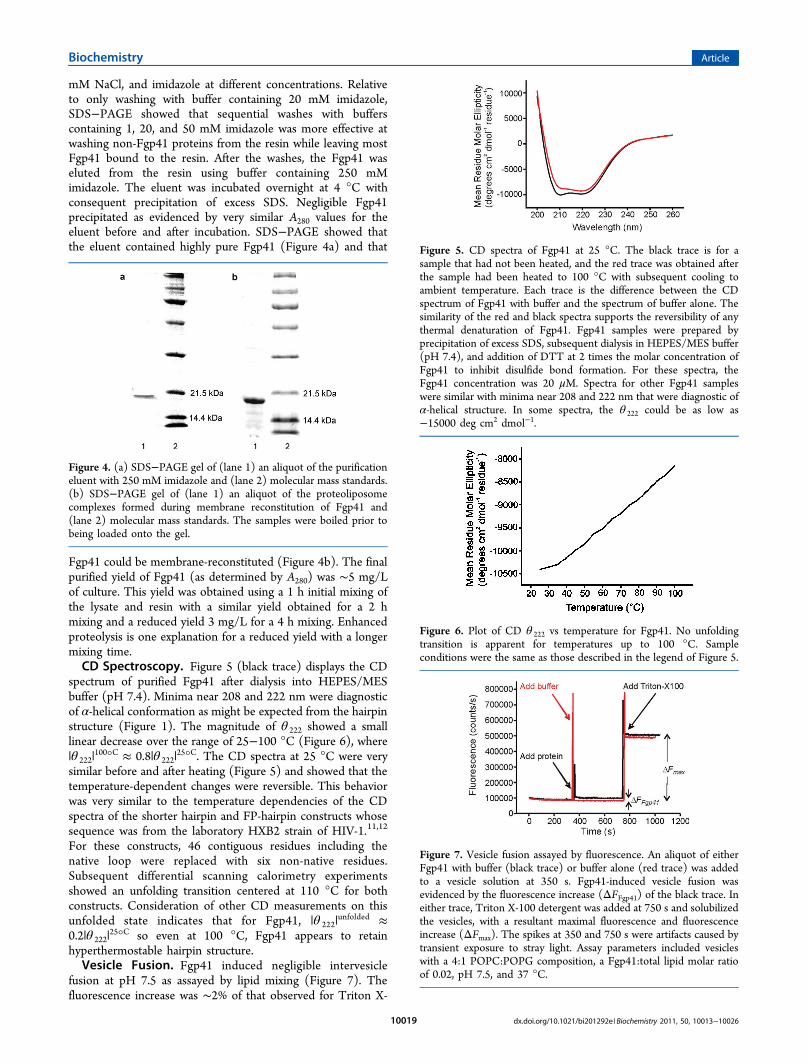
spectrum of purified Fgp41 after dialysis into HEPES/MESbuffer (pH 7.4). Minima near 208 and 222 nm were diagnosticof α-helical conformation as might be expected from the hairpinstructure (Figure 1). The magnitude of θ 222 showed a smalllinear decrease over the range of 25−100 °C (Figure 6), where|θ 222|
100°C ≈ 0.8|θ 222|25°C. The CD spectra at 25 °C were very
similar before and after heating (Figure 5) and showed that thetemperature-dependent changes were reversible. This behaviorwas very similar to the temperature dependencies of the CDspectra of the shorter hairpin and FP-hairpin constructs whosesequence was from the laboratory HXB2 strain of HIV-1.11,12
For these constructs, 46 contiguous residues including thenative loop were replaced with six non-native residues.Subsequent differential scanning calorimetry experimentsshowed an unfolding transition centered at 110 °C for bothconstructs. Consideration of other CD measurements on thisunfolded state indicates that for Fgp41, |θ 222|
unfolded ≈0.2|θ 222|
25°C so even at 100 °C, Fgp41 appears to retainhyperthermostable hairpin structure.Vesicle Fusion. Fgp41 induced negligible intervesicle
fusion at pH 7.5 as assayed by lipid mixing (Figure 7). Thefluorescence increase was ∼2% of that observed for Triton X-
Figure 4. (a) SDS−PAGE gel of (lane 1) an aliquot of the purificationeluent with 250 mM imidazole and (lane 2) molecular mass standards.(b) SDS−PAGE gel of (lane 1) an aliquot of the proteoliposomecomplexes formed during membrane reconstitution of Fgp41 and(lane 2) molecular mass standards. The samples were boiled prior tobeing loaded onto the gel.
Figure 5. CD spectra of Fgp41 at 25 °C. The black trace is for asample that had not been heated, and the red trace was obtained afterthe sample had been heated to 100 °C with subsequent cooling toambient temperature. Each trace is the difference between the CDspectrum of Fgp41 with buffer and the spectrum of buffer alone. Thesimilarity of the red and black spectra supports the reversibility of anythermal denaturation of Fgp41. Fgp41 samples were prepared byprecipitation of excess SDS, subsequent dialysis in HEPES/MES buffer(pH 7.4), and addition of DTT at 2 times the molar concentration ofFgp41 to inhibit disulfide bond formation. For these spectra, theFgp41 concentration was 20 μM. Spectra for other Fgp41 sampleswere similar with minima near 208 and 222 nm that were diagnostic ofα-helical structure. In some spectra, the θ 222 could be as low as−15000 deg cm2 dmol−1.
Figure 6. Plot of CD θ 222 vs temperature for Fgp41. No unfoldingtransition is apparent for temperatures up to 100 °C. Sampleconditions were the same as those described in the legend of Figure 5.
Figure 7. Vesicle fusion assayed by fluorescence. An aliquot of eitherFgp41 with buffer (black trace) or buffer alone (red trace) was addedto a vesicle solution at 350 s. Fgp41-induced vesicle fusion wasevidenced by the fluorescence increase (ΔFFgp41) of the black trace. Ineither trace, Triton X-100 detergent was added at 750 s and solubilizedthe vesicles, with a resultant maximal fluorescence and fluorescenceincrease (ΔFmax). The spikes at 350 and 750 s were artifacts caused bytransient exposure to stray light. Assay parameters included vesicleswith a 4:1 POPC:POPG composition, a Fgp41:total lipid molar ratioof 0.02, pH 7.5, and 37 °C.
Biochemistry Article
dx.doi.org/10.1021/bi201292e |Biochemistry 2011, 50, 10013−1002610019

100 detergent, where Triton is commonly considered to induce100% lipid mixing.SSNMR of Membrane-Reconstituted Fgp41. Figure 8
displays S0, S1, and ΔS REDOR SSNMR spectra of membrane-reconstituted Fgp41 labeled with different amino acids. Manyof these spectra were deconvolved into a few Gaussian lineshapes (see Figure 8 and the Supporting Information). Table 1presents the best-fit peak chemical shifts, line widths, andintegrated intensities of the individual line shapes of the S0
spectra, and Table 2 presents the line shape parameters of theΔS spectra. All fits were excellent as judged by the closeagreement between the line shape sum and the experimentalintensity (see the Supporting Information). These fittings wereused to understand whether the N-helix and C-helix structuresof the six-helix bundle were retained in the membrane-associated Fgp41 and to assess the distribution of conforma-tions in the FP region.
Figure 8. REDOR 13CO NMR spectra of Fgp41 reconstituted in membranes. The labeled amino acids in the expression medium are shown. The leftpanels display S0 (blue) and S1 (red) spectra; the middle panels display the best-fit Gaussian deconvolutions of the S0 spectra, and the right panelsdisplay the ΔS ≡ S0 − S1 spectra. The REDOR dephasing time was either (a) 1 or (b−f) 2 ms, and the dominant contribution to each ΔS spectrumwas from residues with labeled 13CO groups that were directly bonded to labeled 15N atoms. These residues were (a) L33, L44, L54, L81, L134, andL149, (b) F8 and F11, (c) V7, (d) V2, (e) A15, and (f) G3. Each S0 or S1 spectrum was processed with 100 Hz Gaussian line broadening, and eachΔS spectrum was processed with (a and b) 100 or (c−f) 200 Hz line broadening. Polynomial baseline correction (typically fifth order) was appliedto each spectrum. Each S0 or S1 spectrum was the sum of (a) 93424, (b) 115610, (c) 109504, (d) 110736, (e) 165216, or (f) 103717 scans.
Biochemistry Article
dx.doi.org/10.1021/bi201292e |Biochemistry 2011, 50, 10013−1002610020

Table
1.AnalysisandDecon
volution
ofS 0
andS 1
Solid
-State
NMRSp
ectraof
Mem
brane-Recon
stituted
Fgp4
1
S 0spectraldeconvolutiona
fractio
nof
calculated
S 0intensity
b
Fgp41labeling
(ΔS/S 0)e
xp(integrated)c
peak
shift
(ppm
)dpeak
width
(ppm
)eintensity
(fractionof
total)
labeled
natural
abundance
Fgp41
natural
abundance
lipid
labeledin
N-
andC-helices
(ΔS/S 0)calcf
[1-13 C,15N]Leu
0.12
181.3
helix
2.8
0.15
0.86
0.07
0.07
0.68
0.15
178.5
2.8
0.60
175.3
β3.7
0.25
[1-13 C]Phe
with
[15 N
]Leu
0.15
183.2
helix
3.0
0.02
0.42
0.31
0.27
00.24
177.1
5.0
0.51
172.7
β3.5
0.47
[1-13 C]V
alwith
[15 N
]Phe
0.07
182.1
helix
2.7
0.02
0.69
0.19
0.12
0.43
0.07
177.7
3.9
0.76
173.1
β3.3
0.22
[1-13 C]V
alwith
[15 N
]Gly
0.08
178.6
helix
2.9
0.37
0.64
0.17
0.19
0.40
0.07
177.0
2.0
0.20
174.4
β4.9
0.43
[1-13 C]A
lawith
[15 N
]Gly
0.08
0.79
0.12
0.09
0.34
0.05
[1-13 C]G
lywith
[15 N
]Leu
0.11
0.77
0.15
0.08
0.14
0.06
aSpectraldeconvolutionwas
cond
uctedwith
threeGaussianlineshapes
whose
peak
shifts,linewidths,andintensities
wereindepend
ently
varieduntil
therewas
minimaldifferencebetweenthesum
ofthe
lineshapes
andtheexperim
entallineshape.
Forallcases,therewas
excellent
agreem
entbetweenthebest-fitdeconvolutionsum
lineshapeandtheexperim
entallineshape(see
theSupportin
gInform
ation).D
econ
volutio
nwas
notmeaningfulfor
the[1-13 C]A
laand[1-13 C]G
lysamples
becausetheS 0
spectrawerebroadandrelativelyfeaturelessandthedeconvolutions
weredominated
byaline
shapewith
an∼7ppm
linewidth.bSpectralintensities
werecalculated
with
thefollowingconsiderations:(1)100%
labelingof
theFgp41residues
correspond
ingto
thelabeledam
inoacid(s)with
noscramblingto
otheram
inoacid
types,(2)1.0relativeintensity
foreach
labeled
13CO,(3)
0.011relativeintensity
foreach
naturalabund
ance
13CO,(4)
theFgp41naturalabund
ance
signalbeingthesum
from
backbone
13CO
groups
andAsn,A
sp,G
ln,and
Glu
side
chain
13CO
groups,and
(5)thelipid
naturalabund
ance
signalcalculated
usingtheexperim
entalF
gp41:to
tallipid
molar
ratio
s.The
specific
ratio
ineach
samplewas
asfollows:[1-13 C,15N]Leu,0.011;[1-13 C]Phe
with
[15 N
]Leu,0
.012;[1-13 C]V
alwith
[15 N
]Phe,0.016;[1-13 C]V
alwith
[15 N
]Gly,0.009;[1-13 C]A
lawith
[15 N
]Gly,0
.013;and
[1-13 C]G
lywith
[15 N
]Leu,0.019.T
helabeled
13COfractio
ninN-and
C-helices
wasbasedon
theredandgreenregion
sinFigure1a.cThe
typicaluncertaintyof
(ΔS/S 0)e
xpwas
±0.02
asdeterm
ined
from
thestandard
deviationof
integralsof
region
sof
theS 0
andS 1
spectrathatcontainedno
iserather
than
signal.dThe
reason
sforassignmentof
peaksto
specificconformations
areprovided
inthetext.eFu
llwidth
athalf-maximallinewidth.f(Δ
S/S 0)calcvalues
werebasedon
(1)thefractio
nof
theS 0
signalfrom
labeled
13COgroups
directlybond
edto
labeled
15Natom
sand(2)an
S 1/S
0intensity
ratio
forthese
13CO
groups
of0.70
(1msdephasingtim
e)or
0.85
(2msdephasingtim
e).T
hese
ratio
swerebasedon
experim
entalR
EDORdata
ofcrystalline
aminoacid
samples
aswellassimulations.T
he1ms
dephasingtim
ewas
used
fortheFgp41samplelabeledwith
[1-13 C,15N]Leu
andthe2msdephasingtim
efortheotherFgp41samples.
Biochemistry Article
dx.doi.org/10.1021/bi201292e |Biochemistry 2011, 50, 10013−1002610021

Figure 8a displays the 13CO spectra of the [1-13C,15N]Leu-labeled sample. The S0 spectrum targeted the 24 Leu residuesin the Fgp41 sequence, and the ΔS spectrum targeted the L33,L44, L54, L81, L134, and L149 13CO groups, which are the N-terminal Leu residues in LL repeats. The 13CO signal was theonly discernible feature in the ΔS spectrum (see the SupportingInformation). Both the S0 and ΔS spectra had high signal-to-noise ratios and were fitted well to the sum of threecomponents. In both cases, the two higher shift componentscomprised >75% of the integrated intensity and were assignedto the helical conformation because their peak shifts were muchcloser to the characteristic shifts of helical Leu residues(Gaussian distribution of 178.5 ± 1.3 ppm) than to β-strandLeu residues (175.7 ± 1.5 ppm).43 The 13CO S0 spectrum hadcontributions from the labeled Fgp41 Leu residues, as well asnatural abundance sites in Fgp41 and lipids. Calculated relativefractional contributions are listed in Table 1 and show that theFgp41 Leu residues dominate the spectrum. Using an S1/S0intensity ratio of 0.3 for the N-terminal Leu residues of the LLpairs and a ratio of 1.0 for other 13CO groups (based on modelcompound studies and simulations), the (ΔS/S0)calc for thesample was 0.15 and correlated reasonably well with the (ΔS/S0)
exp of 0.12 ± 0.02.42
If the SHB structure were retained in membrane-associatedFgp41, then the fractional contribution to the S0
13CO intensityof Leu residues in the N- and C-helices would be 0.68. Thiscorrelated well with the experimental fractional S0 intensity of0.75 in the helical conformation and supports retention of SHBstructure upon membrane binding. Further support for thisstructure was the correlation between the experimental helicalfractional intensity of 0.92 in the ΔS spectrum and the locationof the six LL repeats in the N- and C-helices.Spectra of the remaining labeled samples provided
information about structure in the putative SHB region aswell as in the FP. Figure 8b displays spectra from a sample with[1-13C]Phe and [15N]Leu labeling. There are three Pheresidues in the sequence: F8 and F11 in the FP and F96,
which would be in the loop region of a SHB structure. Therewas ∼0.4 fractional contribution of the labeled Phe 13COgroups to the S0 spectrum and ∼0.3 contribution each fromnatural abundance 13CO groups in Fgp41 and the lipid. The S0spectrum was well-fitted to the sum of three line shapes. Thetwo line shapes with higher peak shifts comprised ∼0.5fractional contribution of the total intensity, and the shifts weregenerally consistent with helical protein conformation. Thepeak shift of the other line shape was consistent with β-strandprotein conformation and with lipid shifts. The labeled F8 andF11 13CO groups in the FP were directly bonded to labeled Leu15N atoms with an S1/S0 of ∼0.15 for a 2 ms dephasing time.42
The other 13CO groups had S1/S0 values of ∼1. (ΔS/S0)calc wasclose to (ΔS/S0)exp, and the ΔS spectrum was dominated bythe F8 and F11 13CO signals. The ΔS spectrum was well-fittedto two line shapes with the higher (lower) peak shiftsconsistent with helical (β-strand) Phe 13CO shift distributionsof 177.1 ± 1.4 ppm (174.3 ± 1.6 ppm).43 The lower ∼173 ppmexperimental peak shift matched well with the 173 ppm peakshifts measured for F8 and F11 of the membrane-associatedHFP fragment.26−28 This peptide has been shown to form smalloligomers with antiparallel β-sheet structure.30 For membrane-bound Fgp41, the ratio for F8 and F11 of helical to β-strand/sheet intensities was ∼1:2 and was consistent with two Fgp41populations with different FP conformations.Figure 8c displays the spectra and analysis for a sample
labeled with [1-13C]Val and [15N]Phe. The approach to theanalysis was the same as in the previous paragraph. The eightlabeled Val 13CO groups made a fractional contribution of ∼0.7to the S0 signal. The S0 spectrum was well-fitted to three lineshapes, and the two higher-shift line shapes comprised ∼0.8fraction of the total intensity and had shifts that correlated withthe helical rather than the β-strand Val 13CO distribution(177.7 ± 1.4 ppm vs 174.8 ± 1.4 ppm).43 The line shape withthe lowest peak shift correlated with β-strand/sheet con-formation. The high helical content was consistent with SHBstructure for membrane-bound Fgp41. The (ΔS/S0)calcmatched (ΔS/S0)exp. The ΔS spectrum was dominated by V7and was well-fitted to three line shapes that indicated a ratio ofhelical to β-strand/sheet populations of ∼2:1. This ΔSspectrum confirmed two Fgp41 populations with different FPconformations, while the difference in population ratio relativeto the Figure 8b ΔS spectrum may reflect the lower signal-to-noise ratio of the Figure 8c spectrum, sample-to-samplevariation, and/or conformational differences between V7 andF8 and F11.Figure 8d displays the spectra and analysis for a sample
labeled with [1-13C]Val and [15N]Gly. As with Figure 8c,analysis of the S0 spectrum of Figure 8d supported a dominanthelical conformation consistent with a six-helix bundlestructure. Comparison of the two spectra provided insightinto sample-to-sample variation and the robustness of the S0deconvolution. The (ΔS/S0)calc matched (ΔS/S0)exp. The ΔSspectrum was dominated by V2 and extended broadly over the170−180 ppm region, so that deconvolution was notmeaningful. As noted in the previous paragraph, this shiftrange includes the helical and β-strand/sheet shift distributions,and the ΔS spectrum was therefore consistent with a mixture ofFgp41 populations with helical and β-strand/sheet conforma-tions at V2 in the FP. We note that the V2 13CO signal of themembrane-associated HFP was also broader than signals fromresidues 6−12 in the interior hydrophobic region.26
Table 2. Deconvolution of ΔS Spectra of Membrane-Reconstituted Fgp41a
Fgp41 labelingpeak shift(ppm)b
peakwidth(ppm)c
intensity(fraction of
total)
[1-13C,15N]Leu 182.1helix
1.4 0.10178.3 3.1 0.82174.6 β 1.5 0.08
[1-13C]Phe with [15N]Leu 176.9 helix 4.9 0.37172.6 β 4.3 0.63
[1-13C]Val with [15N]Phe 181.8helix
3.3 0.12177.4 3.9 0.57172.2 β 4.2 0.31
aSpectral deconvolution was conducted with two or three Gaussianline shapes whose peak shifts, line widths, and intensities wereindependently varied until there was minimal difference between thesum of the line shapes and the experimental line shape. For all cases,there was excellent agreement between the best-fit deconvolution sumline shape and the experimental line shape (see the SupportingInformation). Deconvolution was not meaningful for the othersamples because the ΔS spectra were broad and relatively featureless.bThe reasons for assignment of peaks to specific conformations areprovided in the text. cFull width at half-maximal line width.
Biochemistry Article
dx.doi.org/10.1021/bi201292e |Biochemistry 2011, 50, 10013−1002610022

Panels e and f of Figure 8 display spectra from samples thatwere labeled with [1-13C]Ala and [15N]Gly or [1-13C]Gly and[15N]Leu. The analyses are presented together because of thesimilar results. The S0 spectra were broad and featureless overthe 170−185 ppm range, so that deconvolution was notmeaningful. This spectral breadth was understood byconsidering that although the fractional contribution of thelabeled 13CO groups to the total S0 intensity was ∼0.8, thelabeled contribution from N- and C-helices in a SHB structurewould be ∼0.25. Approximately half of the S0 intensity wouldbe from labeled 13CO groups in the FP and loop regions. Theearlier Figure 8a−d analyses supported a mixture of helical andβ-strand/sheet shifts for FP 13CO groups, and broad signals arealso expected from 13CO groups in the less-ordered loopregion. For the spectra in panels e and f of Figure 8, there wererelatively good agreements between (ΔS/S0)calc and (ΔS/S0)expand the ΔS spectra were dominated by the 13CO groups of A15and G3, respectively. These ΔS spectra extended over 170−180ppm, and as with the V2 ΔS spectrum, the breadth correlatedwith being near one end of the FP region and with the spectralbreadth observed for the corresponding residues in themembrane-associated HFP.26
Analysis of the SSNMR Spectra of Lyophilized WholeCells. Comparison of the ΔS spectrum of [1-13C,15N]Leu-labeled cells (Figure 2b) to the ΔS spectrum of the unlabeledcells (Figure 2c) shows a clear effect from using labeled Leu.The “labeled cell difference” S0 (S1) spectrum (Figure 3c) is thedifference between the S0 (S1) spectra of the labeled andunlabeled cells and shows only the contribution of the labeledLeu. Deconvolution was applied to the labeled cell difference S0spectrum and to the labeled cell ΔS spectrum. Both spectrawere well-fitted to the sum of three Gaussian line shapes (seeTable 3 and the Supporting Information) and were dominatedby the [1-13C,15N]Leu incorporated into the cell proteinproduced during the expression period. To assess the fractionof Fgp41 in this protein, we compared the deconvolutions of(1) the ΔS spectrum of labeled cells and the ΔS spectrum ofmembrane-reconstituted Fgp41 and (2) the S0 spectrum oflabeled cell difference and the S0 spectrum of membrane-reconstituted Fgp41. For either case, there were strikingsimilarities in the deconvolutions, including the peak chemicalshifts and the large fraction of the total intensity in the twohigh-shift peaks corresponding to the helical conformation.These similarities as well as the detection of large ΔS signalsprovide additional strong evidence that Fgp41 is thepredominant labeled protein in the cells. This result was usedto conservatively estimate that there was at least 3 mg of Fgp41
in the lyophilized labeled cell NMR sample. Other inputs forthis estimate were as follows. (1) The mass of Fgp41 in themembrane-reconstituted sample was ∼5 mg. (2) Themembrane and whole cell data were acquired on the samespectrometer and were the sums of approximately the samenumbers of scans. (3) For the membrane-reconstituted andwhole cell samples, the integrated 13CO intensities of the ΔSspectra were within 20% agreement and there was a similaragreement for the S0 spectra. There was ∼50 mg of total cellmass in the whole cell NMR sample, so the ratio of the mass ofFgp41 to the total dry cell mass was ∼0.05. There was ∼2 g ofdry cell mass/L of culture, so prior to solubilization andpurification, there was ∼100 mg of Fgp41/L of culture. Themuch smaller purified yield of ∼5 mg of Fgp41/L of culturepoints to solubilization and purification rather than expressionas the limiting factors in Fgp41 production.Because relatively harsh conditions were needed to solubilize
Fgp41 in the cells, it seems likely that most Fgp41 was ininclusion bodies. Detection of the predominant helicalconformation for the Leu residues in Fgp41 in the lyophilizedcells, including those in the N- and C-helices of a putative SHBstructure, suggests that this structure is retained in inclusionbodies.
■ DISCUSSION
To the best of our knowledge, earlier reports of bacterialproduction of large quantities of the ectodomain of HIV gp41that incorporated the FP have always included a N-terminalcarrier protein like glutathione S-transferase that wassubsequently cleaved. This study describes production ofFgp41 that has a much shorter six-residue C-terminal histidinetag rather than a N-terminal carrier protein. The ∼5 mg ofpurified yield Fgp41/L of culture is approximately half of thatof the highest reported yield with a carrier protein.16
Initial solubilization and purification attempts gave only 0.1mg of Fgp41/L of culture, and SSNMR was applied to detectwhether this poor yield was due to a very low level ofexpression. The successful approach included identifying anabundant amino acid in Fgp41 (24 Leu residues) that was thefirst amino acid of an abundant sequential pair (six LL repeats).The procedure included (1) inducing cells in minimal mediumwith either [1-13C,15N]Leu or unlabeled Leu, (2) cell pelletlyophilization, and (3) recording 13C REDOR SSNMR spectraof the lyophilized whole cells with a short dephasing time. Asexpected, the spectra of the labeled and unlabeled cells werevery similar in the aliphatic 13C shift region, but the labeled cellshad greater intensity in the 13CO region. The labeled cell −
Table 3. Deconvolution of Spectra of Lyophilized Cells Induced To Produce Fgp41a
sample/spectrumspectrumtype peak shift (ppm)b peak width (ppm)c intensity (fraction of total)
[1-13C,15N]Leu cells ΔS 182.1helix
2.2 0.03177.4 4.5 0.82173.1 β 3.2 0.15
[1-13C,15N]Leu cells − 0.75 × unlabeled cells S0 180.8helix
8.9 0.18177.6 5.6 0.69172.1 β 3.1 0.13
aSpectral deconvolution was conducted with three Gaussian line shapes whose peak shifts, line widths, and intensities were independently varieduntil there was minimal difference between the sum of the line shapes and the experimental line shape. For both cases, there was excellent agreementbetween the best-fit deconvolution sum line shape and experimental line shape (see the Supporting Information). bThe reasons for the assignmentof peaks to specific conformations are provided in the text. cFull width at half-maximal line width.
Biochemistry Article
dx.doi.org/10.1021/bi201292e |Biochemistry 2011, 50, 10013−1002610023

unlabeled cell difference spectra were therefore assigned to Leu13CO groups incorporated into protein produced during theexpression period. The (ΔS/S0)exp of the difference spectra wasclose to the (ΔS/S0)calc estimated for Fgp41 and providedstrong evidence that Fgp41 was expressed in large quantities inthe bacteria. Calibration with standard spectra led to theestimate of ∼100 mg of Fgp41/L of culture. The harshconditions needed to solubilize Fgp41 in the cells and the ∼5mg of purified Fgp41/L of culture provided evidence that mostFgp41 is in inclusion bodies in the bacteria. This approach todetection of recombinant protein in whole cells by SSNMR hasseveral strengths, including (1) small (∼50 mL) culturevolumes, (2) small (∼10 mg) quantities of isotopically labeledamino acids, and (3) a simple sample preparation protocolwithout protein solubilization or purification. The maindrawback might be the few days of SSNMR spectrometertime. Future studies with other proteins are needed to test thegenerality of the approach.Interpretation of the SSNMR spectra using this approach will
likely not be greatly affected by some “scrambling”, i.e.,conversion of the labeled amino acids into other amino acids.For example, transfer of the 15N from the labeled amino acid toother amino acids would likely result in a larger number oflabeled 13CO−15N sequential pairs and therefore larger ΔSsignals and more sensitive detection of the recombinantprotein. Support for minimal scrambling of the Fgp41 samplelabeled with [1-13C,15N]Leu included (1) expression at lowertemperature for a short 2 h duration, (2) (ΔS/S0)exp values forboth the whole cell and membrane-reconstituted samples thatwere close to the values calculated using models withoutscrambling, and (3) deconvolutions of the S0 and ΔS 13COspectra of these samples that agreed nearly quantitatively withthe expected secondary structure distributions of the 24 Leuresidues and the six N-terminal Leu residues in LL pairs,respectively (see Tables 1−3).44The CD spectra and melting curves of purified Fgp41
support thermostable SHB structure, and this structure wasretained upon membrane binding as evidenced by apredominant sharp (3 ppm) helical 13CO feature in the ΔSspectrum of Fgp41 produced with [1-13C,15N]Leu. This featurewas assigned to the sum of 13CO signals from six Leu residuesthat are in N- and C-helices in the SHB structure. The SHB wasalso observed for the membrane-associated FP-hairpinconstruct whose sequence was from an HIV clade differentfrom that of Fgp41 and for which 46 contiguous residuesincluding the native loop were replaced with six non-nativeresidues. By contrast, Fgp41 had the full native sequence of itsclade. The similar results for Fgp41 and FP-hairpin support theSHB as the final stable structure for membrane-associated gp41(Figure 1b).There are two Cys residues in the Fgp41 sequence that are
separated by five residues. These Cys residues are likely oneither side of the tip of the loop in the hairpin structure andtherefore positioned to form an intramolecular disulfide bond.4
For the laboratory strain HXB2 sequence, these Cys residuesare replaced with Ala residues (see the SupportingInformation). The unfolding temperature of the HXB2 hairpinstructure is 105 °C, which should be within a few degrees ofthat of Fgp41 (Figure 6).12,14 It is therefore unlikely that thedisulfide bond of Fgp41 contributes appreciably to thethermostability of the hairpin structure of Fgp41.Fgp41 induced negligible intervesicle lipid mixing at pH 7.5,
which correlated with the same result for FP-hairpin. gp41 in
the final SHB state may therefore be fusion-inactive at leastwith respect to lipid mixing that occurs early in either fusion ofmembranes of HIV and host cells or in gp41-mediated cell−cellfusion. This view is supported by other fusion data showingthat most membrane changes occur prior to formation of thefinal gp41 SHB state.8 For negatively charged vesicles, FP-hairpin and related SHB gp41 constructs induce lipid mixing atpH values much lower than pH 7 (e.g., pH 4), and the pH-dependent functional difference has been correlated withchanges in protein−membrane electrostatics.17 It is thereforelikely that Fgp41 will also induce lipid mixing at these lower pHvalues. Over the past 25 years, there have been a series ofexperimental studies by different groups to determine whetherHIV infects cells through direct fusion at the plasma membraneor through an endocytic mechanism.45,46 In our view, thepreponderance of data for either route supports HIV−cellfusion at pH ≈7 where SHB gp41 is fusion-inactive. There maybe some differences among enveloped viruses as there issignificant evidence of fusion activity of folded influenza virusfusion protein ectodomain FHA2.33,35
Relative to the sharp 3 ppm ΔS 13CO signal from six Leuresidues in the SHB, broader (4−10 ppm) ΔS 13CO signalswere observed from (typically) one residue in the FP. Thesebreadths indicate conformational heterogeneity in the FP.24,25
This point was further supported by the ΔS spectra of V7, F8,and F11, which were reasonably deconvolved into helical and β-sheet signals and indicated two populations of Fgp41 withdistinct FP conformations. Helical and β-sheet FP signals werealso observed for membrane-associated FP-hairpin sampleseven though there were differences between the Fgp41 and FP-hairpin samples, including (1) two of the 16 FP residues beingdifferent, (2) lipids being ester-linked (Fgp41) versus ether-linked (FP-hairpin), (3) membrane reconstitution being basedon detergent dialysis (Fgp41) versus simple mixing of proteinand vesicle solutions (FP-hairpin), and (4) unfrozen Fgp41versus frozen FP-hairpin samples.12 Detection of helical and β-sheet FP populations in both sample types strongly supportsthe existence of these populations in membrane-associatedgp41 in its final SHB state. In the future, it would be veryinteresting to study a larger gp41 construct that contains thetransmembrane domain and for which there may be closecontact between the FP and transmembrane domains.For most nonbacterial proteins produced in bacteria, a large
fraction of the protein in the cells is found in “inclusion bodies”,which are macroscopic noncrystalline solid aggregates.41,47,48
Inclusion body formation appears to be largely independent ofprotein sequence. There are few data about the structure(s) ofrecombinant protein molecules in inclusion bodies. In thisstudy, deconvolutions of the S0 and ΔS spectra of the[1-13C,15N]Leu-labeled inclusion body Fgp41 in cells resultedin line shapes with peak shifts and relative intensities similar tothose of membrane-associated Fgp41 with folded SHBstructure. It therefore seems likely that at least the SHB foldexists for most Fgp41 molecules in inclusion bodies. This is thesecond protein for which there is SSNMR evidence of a stablefold in inclusion bodies. This work highlights the potential ofSSNMR for probing protein structure and aggregation ininclusion bodies.MAS SSNMR structural studies of proteins are generally
conducted by one of two approaches: (1) uniform 13C and 15Nlabeling, unambiguous assignment of most cross-peaks inmultidimensional NMR spectra, and structural interpretation ofthe peak shifts and the cross-peak intensities of nuclei far apart
Biochemistry Article
dx.doi.org/10.1021/bi201292e |Biochemistry 2011, 50, 10013−1002610024
in the sequence or (2) specific (often residue-type or at leastamino acid-type) labeling and quantitative SSNMR measure-ments (e.g., shifts or dipolar couplings) to test specificstructural models.49−51 The choice of approach for a particularprotein depends on protein size and quantity as well as NMRline widths. Approach 1 is more feasible for smaller proteins,high protein concentrations, and narrow (<1 ppm) line widths.This study is an example of approach 2, which was appropriategiven the 162 residues, the ≈0.01 Fgp41:lipid ratio (withadditional dilution of Fgp41 in the sample from water), the 3−10 ppm 13CO line widths, and the possibility of FPconformational heterogeneity (shown to be true in thisstudy). The approach considered a model based on the existinghigh-resolution SHB structures of gp41 fragments and theextensive residue specific SSNMR data for membrane-associated HFP.
■ ASSOCIATED CONTENT
*S Supporting InformationFgp41 amino acid and DNA sequences and comparison to theHXB2 amino acid sequence, additional SDS−PAGE gels, fullΔS spectra of [1-13C,15N]Leu-labeled samples, and spectraldeconvolutions. This material is available free of charge via theInternet at http://pubs.acs.org.
■ AUTHOR INFORMATION
Corresponding Author*Phone: (517) 355-9715. Fax: (517) 353-1793. E-mail:[email protected].
FundingThe research was supported by National Institutes of HealthGrant A147153.
■ ACKNOWLEDGMENTSDr. William Wedemeyer is acknowledged for the gp41 cDNA.Dr. Jun Sun is acknowledged for Fgp41 vector construction. Dr.Lisa Lapidus is acknowledged for the CD spectrometer andfluorimeter. Dr. Kelly Sackett is acknowledged for assistancewith the lipid mixing assay.
■ ABBREVIATIONSBOG, n-octyl β-D-glucopyranoside; bTOG, n-octyl β-D-thioglucopyranoside; C8E5, pentaethylene glycol monooctylether; CD, circular dichroism; C-helix, C-terminal helix; ΔS, S0− S1; (ΔS/S0)calc, calculated ΔS/S0; (ΔS/S0)exp, experimentalΔS/S0; DTT, dithiothreitol; FP, fusion peptide; HEPES, 4-(2-hydroxyethyl)-1-piperazineethanesulfonic acid; HEPES/MES, 5mM HEPES and 10 mM MES (pH 7.4); HFP, HIV fusionpeptide; HIV-1, human immunodeficiency virus type 1; IPTG,isopropyl β-D-thiogalactopyranoside; LB, Luria-Bertani broth;LUV, large unilamellar vesicle; MAS, magic angle spinning;MES, 2-(N-morpholino)ethanesulfonic acid; MW, molecularweight; N-helix, N-terminal helix; N-NBD-PE, N-(7-nitro-2,1,3-benzoxadiazol-4-yl)phosphatidylethanolamine; N-Rh-PE, N-(lissamine Rhodamine B sulfonyl)phosphatidylethanolamine;POPC, 1-palmitoyl-2-oleoyl-sn-glycero-3-phosphocholine;POPG, 1-palmitoyl-2-oleoyl-sn-glycero-3-[phospho-rac-(1-glyc-erol)] (sodium salt); PHI, prehairpin intermediate; REDOR,rotational-echo double-resonance; SDS, sodium dodecylsulfate; SDS−PAGE, sodium dodecyl sulfate−polyacrylamidegel electrophoresis; SHB, six-helix bundle; SIV, simian
immunodeficiency virus; SSNMR, solid-state nuclear magneticresonance.
■ REFERENCES(1) White, J. M., Delos, S. E., Brecher, M., and Schornberg, K.
(2008) Structures and mechanisms of viral membrane fusion proteins:Multiple variations on a common theme. Crit. Rev. Biochem. Mol. Biol.43, 189−219.(2) Melikyan, G. B. (2008) Common principles and intermediates of
viral protein-mediated fusion: The HIV-1 paradigm. Retrovirology 5,111.(3) Chernomordik, L. V., Zimmerberg, J., and Kozlov, M. M. (2006)
Membranes of the world unite! J. Cell Biol. 175, 201−207.(4) Caffrey, M., Cai, M., Kaufman, J., Stahl, S. J., Wingfield, P. T.,
Covell, D. G., Gronenborn, A. M., and Clore, G. M. (1998) Three-dimensional solution structure of the 44 kDa ectodomain of SIV gp41.EMBO J. 17, 4572−4584.(5) Yang, Z. N., Mueser, T. C., Kaufman, J., Stahl, S. J., Wingfield, P.
T., and Hyde, C. C. (1999) The crystal structure of the SIV gp41ectodomain at 1.47 Å resolution. J. Struct. Biol. 126, 131−144.(6) Eckert, D. M., and Kim, P. S. (2001) Mechanisms of viral
membrane fusion and its inhibition. Annu. Rev. Biochem. 70, 777−810.(7) Buzon, V., Natrajan, G., Schibli, D., Campelo, F., Kozlov, M. M.,
and Weissenhorn, W. (2010) Crystal structure of HIV-1 gp41including both fusion peptide and membrane proximal externalregions. PLoS Pathog. 6, e1000880.(8) Markosyan, R. M., Cohen, F. S., and Melikyan, G. B. (2003)
HIV-1 envelope proteins complete their folding into six-helix bundlesimmediately after fusion pore formation. Mol. Biol. Cell 14, 926−938.(9) Freed, E. O., Delwart, E. L., Buchschacher, G. L. Jr., and
Panganiban, A. T. (1992) A mutation in the human immunodeficiencyvirus type 1 transmembrane glycoprotein gp41 dominantly interfereswith fusion and infectivity. Proc. Natl. Acad. Sci. U.S.A. 89, 70−74.(10) Yang, R., Prorok, M., Castellino, F. J., and Weliky, D. P. (2004)
A trimeric HIV-1 fusion peptide construct which does not self-associate in aqueous solution and which has 15-fold higher membranefusion rate. J. Am. Chem. Soc. 126, 14722−14723.(11) Sackett, K., Nethercott, M. J., Shai, Y., and Weliky, D. P. (2009)
Hairpin folding of HIV gp41 abrogates lipid mixing function atphysiologic pH and inhibits lipid mixing by exposed gp41 constructs.Biochemistry 48, 2714−2722.(12) Sackett, K., Nethercott, M. J., Epand, R. F., Epand, R. M.,
Kindra, D. R., Shai, Y., and Weliky, D. P. (2010) Comparative analysisof membrane-associated fusion peptide secondary structure and lipidmixing function of HIV gp41 constructs that model the early Pre-Hairpin Intermediate and final Hairpin conformations. J. Mol. Biol.397, 301−315.(13) Pan, J. H., Lai, C. B., Scott, W. R. P., and Straus, S. K. (2010)
Synthetic fusion peptides of tick-borne encephalitis virus as models formembrane fusion. Biochemistry 49, 287−296.(14) Lev, N., Fridmann-Sirkis, Y., Blank, L., Bitler, A., Epand, R. F.,
Epand, R. M., and Shai, Y. (2009) Conformational stability andmembrane interaction of the full-length ectodomain of HIV-1 gp41:Implication for mode of action. Biochemistry 48, 3166−3175.(15) Cheng, S. F., Chien, M. P., Lin, C. H., Chang, C. C., Lin, C. H.,
Liu, Y. T., and Chang, D. K. (2010) The fusion peptide domain is theprimary membrane-inserted region and enhances membrane inter-action of the ectodomain of HIV-1 gp41. Mol. Membr. Biol. 27, 31−44.(16) Lin, C. H., Lin, C. H., Chang, C. C., Wei, T. S., Cheng, S. F.,
Chen, S. S. L., and Chang, D. K. (2011) An efficient production andcharacterization of HIV-1 gp41 ectodomain with fusion peptide inEscherichia coli system. J. Biotechnol. 153, 48−55.(17) Sackett, K., TerBush, A., and Weliky, D. P. (2011) HIV gp41
six-helix bundle constructs induce rapid vesicle fusion at pH 3.5 andlittle fusion at pH 7.0: Understanding pH dependence of proteinaggregation, membrane binding, and electrostatics, and implicationsfor HIV-host cell fusion. Eur. Biophys. J. 40, 489−502.(18) Chang, D. K., Cheng, S. F., and Chien, W. J. (1997) The amino-
terminal fusion domain peptide of human immunodeficiency virus
Biochemistry Article
dx.doi.org/10.1021/bi201292e |Biochemistry 2011, 50, 10013−1002610025

type 1 gp41 inserts into the sodium dodecyl sulfate micelle primarily asa helix with a conserved glycine at the micelle-water interface. J. Virol.71, 6593−6602.(19) Morris, K. F., Gao, X. F., and Wong, T. C. (2004) The
interactions of the HIV gp41 fusion peptides with zwitterionicmembrane mimics determined by NMR spectroscopy. Biochim.Biophys. Acta 1667, 67−81.(20) Jaroniec, C. P., Kaufman, J. D., Stahl, S. J., Viard, M.,
Blumenthal, R., Wingfield, P. T., and Bax, A. (2005) Structure anddynamics of micelle-associated human immunodeficiency virus gp41fusion domain. Biochemistry 44, 16167−16180.(21) Li, Y. L., and Tamm, L. K. (2007) Structure and plasticity of the
human immunodeficiency virus gp41 fusion domain in lipid micellesand bilayers. Biophys. J. 93, 876−885.(22) Gabrys, C. M., and Weliky, D. P. (2007) Chemical shift
assignment and structural plasticity of a HIV fusion peptide derivativein dodecylphosphocholine micelles. Biochim. Biophys. Acta 1768,3225−3234.(23) Pereira, F. B., Goni, F. M., Muga, A., and Nieva, J. L. (1997)
Permeabilization and fusion of uncharged lipid vesicles induced by theHIV-1 fusion peptide adopting an extended conformation: Dose andsequence effects. Biophys. J. 73, 1977−1986.(24) Grasnick, D., Sternberg, U., Strandberg, E., Wadhwani, P., and
Ulrich, A. S. (2011) Irregular structure of the HIV fusion peptide inmembranes demonstrated by solid-state NMR and MD simulations.Eur. Biophys. J. 40, 529−543.(25) Tristram-Nagle, S., Chan, R., Kooijman, E., Uppamoochikkal,
P., Qiang, W., Weliky, D. P., and Nagle, J. F. (2010) HIV fusionpeptide penetrates, disorders, and softens T-cell membrane mimics. J.Mol. Biol. 402, 139−153.(26) Yang, J., Gabrys, C. M., and Weliky, D. P. (2001) Solid-state
nuclear magnetic resonance evidence for an extended β strandconformation of the membrane-bound HIV-1 fusion peptide.Biochemistry 40, 8126−8137.(27) Zheng, Z., Yang, R., Bodner, M. L., and Weliky, D. P. (2006)
Conformational flexibility and strand arrangements of the membrane-associated HIV fusion peptide trimer probed by solid-state NMRspectroscopy. Biochemistry 45, 12960−12975.(28) Qiang, W., Bodner, M. L., and Weliky, D. P. (2008) Solid-state
NMR spectroscopy of human immunodeficiency virus fusion peptidesassociated with host-cell-like membranes: 2D correlation spectra anddistance measurements support a fully extended conformation andmodels for specific antiparallel strand registries. J. Am. Chem. Soc. 130,5459−5471.(29) Qiang, W., and Weliky, D. P. (2009) HIV fusion peptide and its
cross-linked oligomers: Efficient syntheses, significance of the trimer infusion activity, correlation of β strand conformation with membranecholesterol, and proximity to lipid headgroups. Biochemistry 48, 289−301.(30) Schmick, S. D., and Weliky, D. P. (2010) Major antiparallel and
minor parallel β sheet populations detected in the membrane-associated human immunodeficiency virus fusion peptide. Biochemistry49, 10623−10635.(31) Brugger, B., Glass, B., Haberkant, P., Leibrecht, I., Wieland, F.
T., and Krasslich, H. G. (2006) The HIV lipidome: A raft with anunusual composition. Proc. Natl. Acad. Sci. U.S.A. 103, 2641−2646.(32) Sackett, K., Wexler-Cohen, Y., and Shai, Y. (2006) Character-
ization of the HIV N-terminal fusion peptide-containing region incontext of key gp41 fusion conformations. J. Biol. Chem. 281, 21755−21762.(33) Curtis-Fisk, J., Preston, C., Zheng, Z. X., Worden, R. M., and
Weliky, D. P. (2007) Solid-state NMR structural measurements on themembrane-associated influenza fusion protein ectodomain. J. Am.Chem. Soc. 129, 11320−11321.(34) Curtis-Fisk, J., Spencer, R. M., and Weliky, D. P. (2008)
Isotopically labeled expression in E. coli, purification, and refolding ofthe full ectodomain of the influenza virus membrane fusion protein.Protein Expression Purif. 61, 212−219.
(35) Kim, C. S., Epand, R. F., Leikina, E., Epand, R. M., andChernomordik, L. V. (2011) The final conformation of the completeectodomain of the HA2 subunit of influenza hemagglutinin can byitself drive low pH-dependent fusion. J. Biol. Chem. 286, 13226−13234.(36) Ratner, L., Haseltine, W., Patarca, R., Livak, K. J., Starcich, B.,
Josephs, S. F., Doran, E. R., Rafalski, J. A., Whitehorn, E. A.,Baumeister, K., Ivanoff, L., Petteway, S. R., Pearson, M. L.,Lautenberger, J. A., Papas, T. S., Ghrayeb, J., Chang, N. T., Gallo, R.C., and Wongstaal, F. (1985) Complete nucleotide sequence of theAIDS virus, HTLV-III. Nature 313, 277−284.(37) Painter, S. L., Biek, R., Holley, D. C., and Poss, M. (2003)
Envelope variants from women recently infected with clade A humanimmunodeficiency virus type 1 confer distinct phenotypes that arediscerned by competition and neutralization experiments. J. Virol. 77,8448−8461.(38) Pascual, R., Moreno, M. R., and Villalain, J. (2005) A peptide
pertaining to the loop segment of human immunodeficiency virusgp41 binds and interacts with model biomembranes: Implications forthe fusion mechanism. J. Virol. 79, 5142−5152.(39) Gullion, T., and Schaefer, J. (1989) Rotational-echo double-
resonance NMR. J. Magn. Reson. 81, 196−200.(40) Morcombe, C. R., and Zilm, K. W. (2003) Chemical shift
referencing in MAS solid state NMR. J. Magn. Reson. 162, 479−486.(41) Curtis-Fisk, J., Spencer, R. M., and Weliky, D. P. (2008) Native
conformation at specific residues in recombinant inclusion bodyprotein in whole cells determined with solid-state NMR spectroscopy.J. Am. Chem. Soc. 130, 12568−12569.(42) Yang, J. (2003) Ph.D. Thesis, Michigan State University, East
Lansing, MI.(43) Zhang, H. Y., Neal, S., and Wishart, D. S. (2003) RefDB: A
database of uniformly referenced protein chemical shifts. J. Biomol.NMR 25, 173−195.(44) Tong, K. I., Yamamoto, M., and Tanaka, T. (2008) A simple
method for amino acid selective isotope labeling of recombinantproteins in E. coli. J. Biomol. NMR 42, 59−67.(45) Grewe, C., Beck, A., and Gelderblom, H. R. (1990) HIV: Early
virus-cell interactions. J. AIDS 3, 965−74.(46) Miyauchi, K., Kim, Y., Latinovic, O., Morozov, V., and Melikyan,
G. B. (2009) HIV enters cells via endocytosis and dynamin-dependentfusion with endosomes. Cell 137, 433−444.(47) Wang, L. (2009) Towards revealing the structure of bacterial
inclusion bodies. Prion 3, 139−145.(48) Gatti-Lafranconi, P., Natalello, A., Ami, D., Doglia, S. M., and
Lotti, M. (2011) Concepts and tools to exploit the potential ofbacterial inclusion bodies in protein science and biotechnology. FEBSJ. 278, 2408−2418.(49) Tycko, R. (2006) Molecular structure of amyloid fibrils: Insights
from solid-state NMR. Q. Rev. Biophys. 39, 1−55.(50) McDermott, A. (2009) Structure and dynamics of membrane
proteins by magic angle spinning solid-state NMR. Annu. Rev. Biophys.38, 385−403.(51) Fowler, D. J., Weis, R. M., and Thompson, L. K. (2010) Kinase-
active signaling complexes of bacterial chemoreceptors do not containproposed receptor-receptor contacts observed in crystal structures.Biochemistry 49, 1425−1434.
Biochemistry Article
dx.doi.org/10.1021/bi201292e |Biochemistry 2011, 50, 10013−1002610026
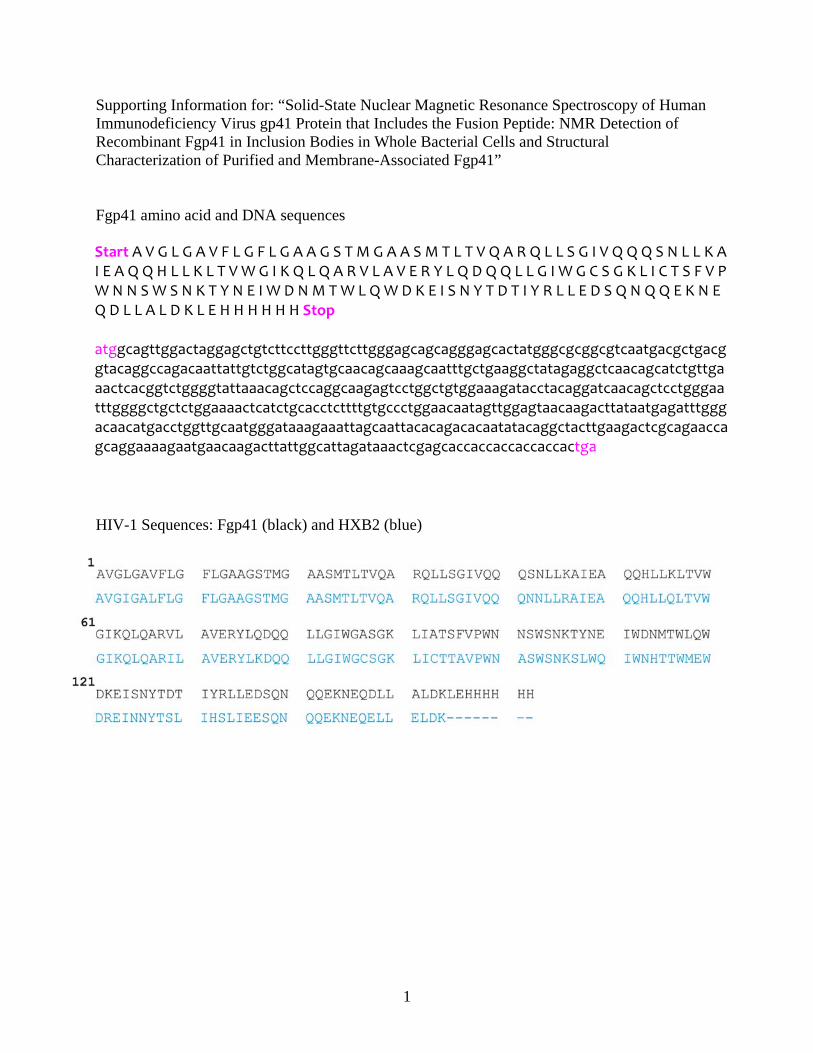
Supporting Information for: “Solid-State Nuclear Magnetic Resonance Spectroscopy of Human Immunodeficiency Virus gp41 Protein that Includes the Fusion Peptide: NMR Detection of Recombinant Fgp41 in Inclusion Bodies in Whole Bacterial Cells and Structural Characterization of Purified and Membrane-Associated Fgp41” Fgp41 amino acid and DNA sequences
Start A V G L G A V F L G F L G A A G S T M G A A S M T L T V Q A R Q L L S G I V Q Q Q S N L L K A I E A Q Q H L L K L T V W G I K Q L Q A R V L A V E R Y L Q D Q Q L L G I W G C S G K L I C T S F V P W N N S W S N K T Y N E I W D N M T W L Q W D K E I S N Y T D T I Y R L L E D S Q N Q Q E K N E Q D L L A L D K L E H H H H H H Stop atggcagttggactaggagctgtcttccttgggttcttgggagcagcagggagcactatgggcgcggcgtcaatgacgctgacggtacaggccagacaattattgtctggcatagtgcaacagcaaagcaatttgctgaaggctatagaggctcaacagcatctgttgaaactcacggtctggggtattaaacagctccaggcaagagtcctggctgtggaaagatacctacaggatcaacagctcctgggaatttggggctgctctggaaaactcatctgcacctcttttgtgccctggaacaatagttggagtaacaagacttataatgagatttgggacaacatgacctggttgcaatgggataaagaaattagcaattacacagacacaatatacaggctacttgaagactcgcagaaccagcaggaaaagaatgaacaagacttattggcattagataaactcgagcaccaccaccaccaccactga
HIV-1 Sequences: Fgp41 (black) and HXB2 (blue)
1
Representative SDS-PAGE of soluble cell lysates produced using buffers with different detergents or urea. For each buffer, the left and right lanes respectively correspond to 2 and 5 L aliquots of lysate. The ~19 kDa band apparent in some lanes is assigned to Fgp41. One example is circled in red in lane 4 for lysis in SDS. Bands that may be Fgp41 were also apparent for lyses in either urea or N-lauroylsarcosine but purifications of these lysates consistently yielded <1 mg Fgp41/L culture whereas purifications of SDS lysates yielded >1 mg Fgp41/L culture. Subsequent lyses were therefore done with SDS.
21 .5 kDa
14 .4 kDa
1 2 3 4 5 6 7 8 9
N-lauroy lsa rc osin eSDS UreaTrito n X-100
{ { { {
M W Stan da rd s
SDS-PAGE of soluble cell lysates produced using buffers with different [SDS].
14 .4 kDa
21 .5 kDa
M W Stan dard s0 0.5 1 3 5
Pe rc en t SDS in lys is bu ffer
2

3
4

5
![Helhedssyn på fisk og fiskevarer - orbit.dtu.dk pÃ¥ fisk og fiskevarer[1].pdf · Konklusion Konklusionen på revurderingen af fisk som fødevarer er, at fisk er sundt, og at det](https://img.pdfslide.us/doc/110x75/5e1cd6af7d00775d4b1efebd/helhedssyn-p-fisk-og-fiskevarer-orbitdtudk-pf-fisk-og-fiskevarer1pdf.jpg)