Embed Size (px)
Citation preview

Solid State Electrochemical Removal of Pollutants
K.K. Hansen
Department of Energy Conversion and Storage
Technical University of Denmark, DTU
e-mail: [email protected]

DTU Energy Conversion, Technical University of Denmark
Add Presentation Title in Footer via ”Insert”; ”Header & Footer”
Outline
• Introduction
• Motivation
• The idea
• History/literature
• Work at DTU
– Reduction of NOx
– Oxidation of C3H6
• Conclusion/Outlook
2 27-01-14

DTU Energy Conversion, Technical University of Denmark
Add Presentation Title in Footer via ”Insert”; ”Header & Footer”
3 27-01-14
Sources and main pollutants
• Many sources of flue gas and exhaust gas
• Major pollutants are:
• Particulate matter
• sulphur oxides
• nitrogen oxides
• carbon monoxide
• hydrocarbons

DTU Energy Conversion, Technical University of Denmark
Add Presentation Title in Footer via ”Insert”; ”Header & Footer”
4 27-01-14
Motivation
• Why are we pursuing this technology?
– Competitive (no noble metals, low fuel penalty, space requirements, highly effective)
– Expertice in functional ceramics and processing
– Expertice in electrochemistry
Kilde: Hamamoto, K. 2009

DTU Energy Conversion, Technical University of Denmark
Add Presentation Title in Footer via ”Insert”; ”Header & Footer”
Electrochemical removal of pollutants
• Current is used to drive the processes; no extra chemicals!
• Cathode
2NO + 4 e- → N2 + 2 O2-
2NO + 2 e- → N2O + O2-
O2 + 2 e- → 2 O2-
• Anode:
C + 2 O2- → CO2 + 4 e-
CO + O2- → CO2 + 2 e-
C3H6 + 9 O2- → 3CO2 + 3H2O + 18 e-
2 O2- → O2 + 4 e-
5 27-01-14

DTU Energy Conversion, Technical University of Denmark
Add Presentation Title in Footer via ”Insert”; ”Header & Footer”
Power consumption of an electrochemical reactor
6 27-01-14
P =U*I

DTU Energy Conversion, Technical University of Denmark
Add Presentation Title in Footer via ”Insert”; ”Header & Footer”
Literature
• Low current efficiency on noble metals
– Competing reduction of oxygen at cathode
• Addition of adsorption layer increases activity and current efficiency
– RuO2 on silver; 13% current efficiency (Iwayama et al)
– K/Pt/Al2O3 on NiO/Ni; 12% current efficiency (Hamamoto et al)
7 27-01-14

DTU Energy Conversion, Technical University of Denmark
Add Presentation Title in Footer via ”Insert”; ”Header & Footer”
8 27-01-14
Tubular reactor scheme Zoom on the sample position
Image of the whole test-set up
Test set-up
Electrochemical, Catalytic Activity and Structural Characterization
Catalytic activity; CLD, MS, GC
Electrochemical activity; EIS, CV
Cells: Electrolyte supported or porous cell stacks (self supported)
Temperature range: 300-500 oC
Gas compositions: 1000 ppm NO or 1000 ppm C3H6 + 10% O2
Experimental Setup/Conditions

DTU Energy Conversion, Technical University of Denmark
Add Presentation Title in Footer via ”Insert”; ”Header & Footer”
Ni-electrode (1000 ppm NO, 2% O2, -2.5V)
9 27-01-14
J. Shao, K.K. Hansen, J. Solid State Electrochem., 16 3331 (2012)

DTU Energy Conversion, Technical University of Denmark
Add Presentation Title in Footer via ”Insert”; ”Header & Footer”
K/Pt/Al2O3|Ag (0.1% NO, 10% O2, 400 oC)
10 27-01-14
-E / V
0.50 0.75 1.00 1.25 1.50 1.75
Convers
ion /
%
0
10
20
30
40
50
Curr
ent
eff
icie
ncy /
%
0
2
4
6
8
10
12
14
16
Conversion
Current effciency
J. Shao, K. Kammer Hansen, J. Electrochem. Soc., 160 H294 (2013)
DTU Energy Conversion, Technical University of Denmark
Add Presentation Title in Footer via ”Insert”; ”Header & Footer”
Power consumption (400 oC)
• P = U*I
–1.4 l diesel engine, 2500 rpm, 52 kW, 500 ppm NOx
–Power consumption: 2 kW
• Further reduction of power consumption needed.
• Area:
–16.3 m2, 400 cells, (20*20 cm2), length: 0.2 m
• Further increase of activity needed
27-01-14 11

DTU Energy Conversion, Technical University of Denmark
Add Presentation Title in Footer via ”Insert”; ”Header & Footer”
Different cell structures
12
CGO
LSM|CGO
LSM|CGO
Electrochemical cell
Infiltrated with BaO nano particles
Coated with Ba|Pt|Al2O3
adsorption layer
27-01-14 12

DTU Energy Conversion, Technical University of Denmark
Add Presentation Title in Footer via ”Insert”; ”Header & Footer”
Ba/Pt/Al2O3|LSM at 450 oC in 0.1% NO, 10% O2
13
DC Square wave
Significantly improved the NOx removal properties above 350 oC
27-01-14 13
J. Shao, K. Kammer Hansen, J. Mater. Chem. A, 1 7137 (2013)

DTU Energy Conversion, Technical University of Denmark
Add Presentation Title in Footer via ”Insert”; ”Header & Footer”
A Porous cell stack
27-01-14 14
Gas iii

DTU Energy Conversion, Technical University of Denmark
Add Presentation Title in Footer via ”Insert”; ”Header & Footer”
27-01-14 15
SEM of a 5 times Ba-infiltrated cell stack
DTU Energy Conversion, Technical University of Denmark
Add Presentation Title in Footer via ”Insert”; ”Header & Footer”
16 27-01-14
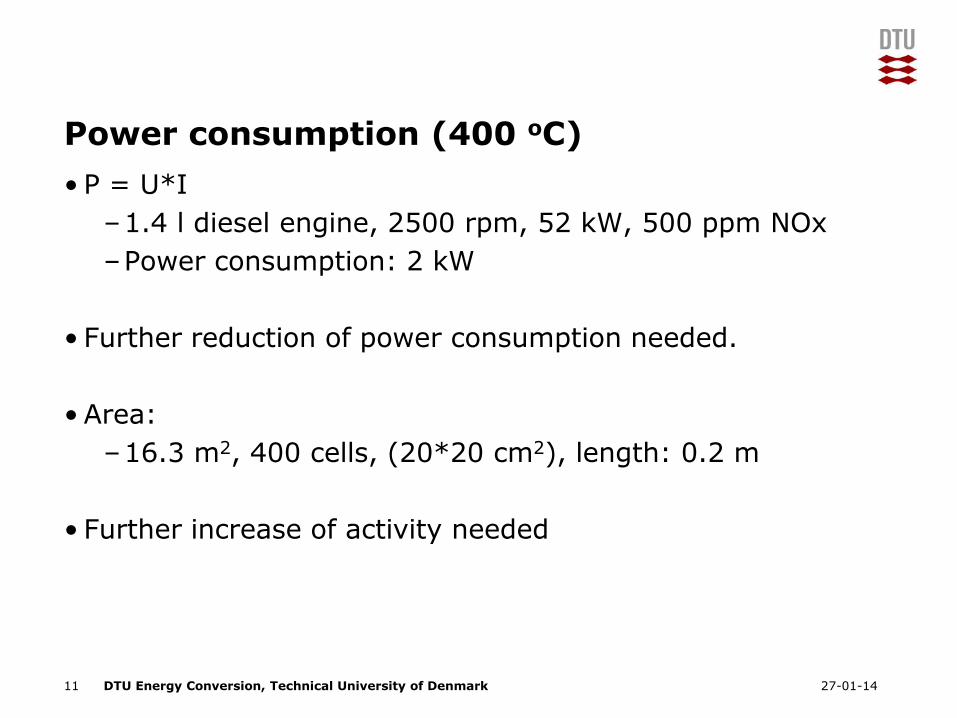
The use of a storage compound
LSM15
BaO
Anodic polarization
LSM15
Ba(NO3)2
Cathodic polarization
LSM15
BaO
N2
O2-
NO + O2

DTU Energy Conversion, Technical University of Denmark
Add Presentation Title in Footer via ”Insert”; ”Header & Footer”
Non-impregnated LSM15-CGO10 cell stack
0
200
400
600
800
1000
1200
1400
1600
1800
2000
0 100 200 300 400 500 600 700 800
Co
nc.
[pp
m]
Time [min]
NOx concentration
-3V -5V -7V -9V
Polarisation at 400 oC in 1000 ppm NO +10% O2
27-01-14 17

DTU Energy Conversion, Technical University of Denmark
Add Presentation Title in Footer via ”Insert”; ”Header & Footer”
BaO impregnated LSM15-CGO10 cell stack
0
500
1000
1500
2000
0 200 400 600 800 1000
Co
nc.
[pp
m]
Time [min]
NOx concentration
0
100
200
300
400
500
600
700
0 200 400 600 800 1000
Co
nc.
[pp
m]
Time [min]
N2 concentration
-3V
-3V -3V
-3V -5V -5V
-5V -5V
-7V -7V -9V
-7V -7V
-9V Polarisation NOx conversion Current efficiency
[%] [%]
-3V (a) 0 0
-5V (a) 15 6
-7V (a) 41 9
-9V (a) 61 8
-7V (b) 49 11
-5V (b) 21 9
-3V (b) 2 2
Polarisation at 400 oC in 1000 ppm NO +10% O2
27-01-14 18

DTU Energy Conversion, Technical University of Denmark
Add Presentation Title in Footer via ”Insert”; ”Header & Footer”
Infiltration of O-2 conductor: CGO10
350 400 450 500
0.03
0.04
0.05
0.06
0.07
0.08
0.09
0.10
0.11
0.12
r C3
H6 (m
ol(
s*g
))
Temperature (°C)
CGO10
-Tr
CGO10
-water
backbone
30 h polarization
2.7 % w/w loading (1 step)
1000 ppm C3H6 , 10% O2 , O.C.V
• it is possible to observe an increase of
reaction rate after 30 hrs of test;
• the CGO10 infiltration improve the
reaction rate towards propene oxidation
as measured at OCV;
200 400 600 800 1000
0.98
1.00
1.02
1.04
1.06
1.08
1.10
1.12
1.14
1.16
1.18
1.20
1.22
r/r 0
applied voltage (mV/cell)
backbone
CGO10
-Tr
CGO10
-waterT= 450ºC
200 400 600 800 1000
1.02
1.05
1.08
1.11
1.14
1.17
1.20
1.23
1.26
r/r 0
applied voltage (mV/cell)
backbone
CGO10-Tr
CGO10-water
Rate enhancement ratio (ρ)
26.4 %
T= 350ºC
48.7 %
37.2 %
27-01-14 19

DTU Energy Conversion, Technical University of Denmark
Add Presentation Title in Footer via ”Insert”; ”Header & Footer”
Activity of electrodes with Co substitution 3 % Co at the B-site (La0.85Sr0.15)0.99Co0.03Mn0.97O3-δ
Doping with Co on B-site gives much higher electrochemical activity and
reduces the polarisation resistance.
300 oC, 0.1% NO + 10% O
2 in Ar
E [V]
-5 -4 -3 -2 -1 0 1 2 3 4 5
I [A
cm
-2]
-0.003
-0.002
-0.001
0.000
0.001
0.002
0.003
LSM/CGO
LSMCo/CGO
400 oC, 0.1 % NO + 10 % O
2 in Ar
Z' [ cm2]
0 2000 4000 6000 8000 10000 12000 14000 16000 18000 20000
-Z''
[cm
2]
0
2000
4000
6000
8000
LSM/CGO
LSCoM/CGO
Temp Imax(LSCoM)/Imax(LSM)
300 °C 28
400°C 9
27-01-14 20

DTU Energy Conversion, Technical University of Denmark
Add Presentation Title in Footer via ”Insert”; ”Header & Footer”
Mg + Fe infiltration
27-01-14 21

DTU Energy Conversion, Technical University of Denmark
Add Presentation Title in Footer via ”Insert”; ”Header & Footer”
27-01-14 22
Catalytic Activity of La0.65Sr0.35MnO3+
0
20
40
60
80
100
150 200 250 300 350 400 450 500
NO to N2
NO to NO2
C3H
6 to CO
2
T / oC
Conver
sion /
%

DTU Energy Conversion, Technical University of Denmark
Add Presentation Title in Footer via ”Insert”; ”Header & Footer”
Formation of NO2
23 27-01-14
0
25
50
75
100
100 200 300 400 500 6000
1x10⁻⁶
2x10⁻⁶
3x10⁻⁶+propene
-propene
Calculated
T / oC
Am
ount
NO
2 f
orm
ed /
%
S

DTU Energy Conversion, Technical University of Denmark
Add Presentation Title in Footer via ”Insert”; ”Header & Footer”
NO2 reduction
24 27-01-14
73.8%
38.4%
73.8%
38.4%
7.4%
27.4%
7.4%
27.4%

DTU Energy Conversion, Technical University of Denmark
Add Presentation Title in Footer via ”Insert”; ”Header & Footer”
Conclusions
• NOx removal down to 300 oC
• CE at 400 oC: 15 %, with a silver based electrode
• Oxidation of propene shown possible
27-01-14 25
DTU Energy Conversion, Technical University of Denmark
Add Presentation Title in Footer via ”Insert”; ”Header & Footer”
The group
26 27-01-14
Kent Kammer Hansen Frederik Berg Nygaard
Kjeld Bøhm Andersen Rebecka Werchmeister
Marie Lund Traulsen Anja Zarah Friedberg Jing Shao Davide Ippolito Cristine Grings Schmidt
Janet Bentzen