Embed Size (px)
Citation preview
Solid-Phase On-Chip Nucleic Acid Hybridization Assays Using Spatial Profiles from Fluorescence Resonance
Energy Transfer by Immobilized Quantum Dots
by
Anthony Tavares
A thesis submitted in conformity with the requirements for the degree of Doctor of Philosophy
Department of Chemistry University of Toronto
© Copyright by Anthony Tavares 2014
ii
Solid-Phase On-Chip Nucleic Acid Hybridization Assays Using
Spatial Profiles from Fluorescence Resonance Energy Transfer
by Immobilized Quantum Dots
Anthony Tavares
Doctor of Philosophy
Department of Chemistry University of Toronto
2014
Abstract
The research that is presented herein explores the development of a solid-phase DNA
hybridization assay in an electrokinetically controlled biochip. Transduction of nucleic acid
hybridization is accomplished by fluorescence resonance energy transfer (FRET) from a layer of
immobilized quantum dots (QDs) in microfluidic channels. The chip assay platform was
assembled as a composite of glass and polydimethylsiloxane (PDMS), where the glass surface
was functionalized with immobilization chemistry to support the spontaneous assembly of QDs.
Probe oligonucleotides were subsequently conjugated to the immobilized QDs and hybridization
served as the selective interaction for target binding. Since the entire microchannel was
derivatized with the transduction element, hybridization of dye labeled oligonucleotides along
the channel length created well defined spatial profiles of FRET sensitized acceptor emission.
The length of the FRET spatial profiles was related to the quantity of nucleic acid delivered and
enabled quantitative transduction of tens of fmol amounts of target within minutes. This chip
based assay offered multiplexed analysis where the concurrent detection of two targets was
possible with a dynamic range spanning more than an order of magnitude. The robustness of the
assay was demonstrated by transduction of nucleic acid targets in a variety of complex matrices
iii
including sample solutions that contained an excess of genomic DNA and also serum proteins.
Furthermore, the assay offered excellent selectivity toward determination of the presence of a
single nucleotide polymorphism (SNP), with contrast ratios exceeding 100:1. A non-traditional
approach to SNP transduction was explored, where the size of the QD was found to impact the
stringency of interfacial hybridization. Detection of unlabeled target oligonucleotide using a
sandwich assay approach enabled transduction of oligonucleotides up to 40 nucleotides in length.
The research described herein advances the development of a selective interfacial transduction
strategy for the detection of nucleic acid markers such as might be characteristic of disease or
pathogens. The on-chip assay format is amenable to point-of-care analysis and can be combined
with nucleic acid amplification technologies for highly sensitive on demand DNA analysis.
iv
Acknowledgments
I would like to extend sincere gratitude to my supervisor Professor Ulrich J. Krull, whom I first
became inspired by during my second year of undergraduate studies. Thank you for unparalleled
guidance and support, not only toward my doctoral studies, but to all aspects of my professional
development.
I am also grateful to my doctoral advisory committee members R. Scott Prosser and Aaron R.
Wheeler, who have always offered outstanding advice and motivational discussion in committee
meetings. I would also like to thank Paul A. E. Piunno for countless discussions and mentorship,
and Warren C. W. Chan for useful discussion and guidance during my comprehensive
examination. Great thanks are extended to W. Russ Algar for mentorship, guidance, and actively
contributing to the work described herein.
Much of the work completed over the course of this thesis would not have been possible without
the help from the many talented employees at the University of Toronto. Dr. Ilya Gourevich and
Dr. Neil Coombs are thanked for assistance with SEM and Dr. Rana Sodhi is thanked for
acquisition of XPS measurements. Peter Mitrakos is also thanked for assistance with NMR and
MS. Extended thanks is also given to the Academic Workshop, UTM Stores, and
Microelectronics. Sincere gratitude must also be extended to Carmen Bryson for outstanding
administrative support to our research team.
I can’t express how fortunate I was to conduct my doctorate research in the chemical sensors
group. The presence of innovative and supportive graduate and undergraduate students during
my tenure at UTM has been an invaluable experience. Much of the work described herein could
not have been realized without outstanding contributions from M. Omair Noor, Eleonora
Petryayeva, and Uvaraj Uddayasankar both in research and discussion. These individuals along
with many former and current colleagues have provided such an enjoyable team environment
with special mention to: Lu Chen, Lori Chong, Rhys Crasto, Matthew DaCosta, Samer Doughan,
Laura Fedoryshin, Yi Han, David Hrovat, Qiang Ju, Connie Le, Melissa Massey, Max Prigozhin,
Philip Rolo, Anna Shahmuradyan, Ravi T. Shergill, Charles Vannoy, Misa Vujaklija, April
Wong, and Feng Zhou.

v
To my mom and dad, I am so grateful for your support throughout my entire academic career. I
would not be where I am today without your unparalleled guidance and motivation.
To my lovely wife, you bring out the best in me. Thank you for your unabated compassion,
patience, and support throughout my doctoral program.
vi
List of Abbreviations
A Acceptor - FRET EWOD Electrowetting-on-dielectric A488 Alexa Fluor 488 FC
FCS Fully complementary Fluorescence correlation spectroscopy
A594 Alexa Fluor 594 FISH fluorescence in situ hybridization A647 Alexa Fluor 647 FRET Fluorescence resonance energy
transfer At647 Atto 647 FWHM full-width-at-half-maximum ATPMS 3-aminopropyl trimethoxysilane GOPs 3-
glycidoxypropyltrimethoxysilane Au NP Gold Nanoparticle H-bond Hydrogen bond Av Avidin HDA Hexadecylamine BFHB Bifurcated hydrogen bond HOMO Highest occupied molecular
orbital BHQ-2 Black-hole quencher-2 IaB Iowa Black FQ BRET Bioluminescence resonance energy
transfer IRF Instrument response function
CAD Computer aided design LOC lab-on-a-chip CE Capillary electrophoresis LOD Limit of detection CF Cystic Fibrosis LUMO Lowest unoccupied molecular
orbital CRET Chemiluminescence resonance energy
transfer MAA mercaptoacetic acid
Cy3 Cyanine 3 MB Molecular beacon Cy5 Cyanine 5 MiRNA microRNA D Donor - FRET n-BPM N-base pair mismatch dA Adenine NC Noncomplementary DABCYL 4-((4-(dimethylamino)
phenyl)azo)benzoic acid NIR Near Infrared
dC Cytosine NP Nanoparticle dG Guanine NR Nanorod DHLA dihydrolipoic acid NW Nanowire DNA Deoxyribonucleic acid OHP
PC Outer Helmholtz plane Probe Conjugates
dNTPs Deoxynucleotide triphosphates PCR Polymerase chain reaction dsDNA Double stranded DNA PDMS Polydimethyl siloxane dT Thymine PEG Polyethylene glycol EB Ethidium Bromide PL Photoluminescence EDL Electrical double layer POC Point-of-care EOF electroosmotic flow QD Quantum Dot EPF electrophoretic force QD-PC Quantum dot-probe conjugate EWOD Electrowetting-on-dielectric QDXYZ QD with peak PL at XYZ

vii
RAHB Resonance-assisted hydrogen bonding REP Reporter oligonucleotide RLUC Renilla luciferase RNA Ribonucleic acid Sav Streptavidin SEM Scanning electron microscopy SMA Spinal muscular atrophy SMN Survival motor neuron SNP Single nucleotide polymorphism ssDNA Single stranded DNA TEG Triethylene glycol TEM Transmission electron microscopy TGT Target Tm Melt temperature of a DNA duplex TMS-S Hexamethyldisilathiane TOP trioctylphospine TOPO trioctylphosphine oxide UNL-TGT Unlabeled target Xmer An oligonucleotide that is "x" nucleobases
in length
viii
Table of Contents
Acknowledgments .......................................................................................................................... iv
List of Abbreviations ..................................................................................................................... vi
Table of Contents ......................................................................................................................... viii
List of Tables ................................................................................................................................ xii
List of Figures .............................................................................................................................. xiii
List of Appendices ..................................................................................................................... xxiii
Introduction ................................................................................................................................ 1 1
1.1 Nucleic Acid Bioassays and Biosensors ............................................................................. 1
1.2 Molecular Structure and Energetics of Deoxyribonucleic Acid ......................................... 3
1.2.1 Composition of Deoxyribonucleic Acid ................................................................. 3
1.2.2 Energetics of DNA Hybridization .......................................................................... 6
1.3 Fluorescence Spectroscopy ............................................................................................... 11
1.3.1 Jablonski Diagram ................................................................................................ 12
1.3.1.1 Absorption of Electromagnetic Radiation .............................................. 12
1.3.1.2 Radiative and Nonradiative Relaxation Mechanisms ............................. 16
1.3.2 Quantitative Fluorescence Measurements ............................................................ 18
1.3.2.1 Steady-state Fluorescence Measurements .............................................. 19
1.3.2.2 Time-resolved Fluorescence Measurements .......................................... 20
1.3.3 Fluorescence Resonance Energy Transfer ............................................................ 22
1.4 Semiconductor Quantum Dots .......................................................................................... 25
1.4.1 Quantum Dot Structure and Composition ............................................................. 26
1.4.1.1 Synthesis of Quantum Dots .................................................................... 28
1.4.2 Photophysics of Quantum Dots ............................................................................ 31

ix
1.4.2.1 Band Theory in Metals ........................................................................... 31
1.4.2.2 Quantum Confinement ........................................................................... 32
1.4.2.3 Optical Transitions in the Bandgap of CdSe Quantum Dots .................. 35
1.4.3 Quantum Dot Coatings and Bioconjugation ......................................................... 39
1.4.4 Quantum Dots as Donors in FRET ....................................................................... 41
1.4.5 Nucleic Acid Diagnostics Based on QD-FRET .................................................... 43
1.4.5.1 Hybridization Assays .............................................................................. 43
1.4.5.2 QD molecular beacons............................................................................ 45
1.4.5.3 Special cases with QD acceptors ............................................................ 48
1.5 Microfluidics as a Platform for Bioanalysis ..................................................................... 50
1.5.1 Soft Lithography for Rapid Device Prototyping ................................................... 52
1.5.2 Fluid Dynamics in Microchannels ........................................................................ 53
1.5.3 Electrokinetic Phenomena .................................................................................... 54
1.6 Contributions of this Thesis .............................................................................................. 58
On-Chip Transduction of Nucleic Acid Hybridization Using Spatial Profiles of 2Immobilized Quantum Dots and Fluorescence Resonance Energy Transfer ........................... 64
2.1 Introduction ....................................................................................................................... 64
2.2 Experimental Section ........................................................................................................ 66
2.2.1 Preparation of QD-Probe Conjugates and Solution Hybridization Experiments. . 66
2.2.2 Microfluidic Chip Preparation and In-Channel Assembly of QD-Probe Conjugates. ............................................................................................................ 67
2.2.3 On-Chip Hybridization Experiments. ................................................................... 69
2.2.4 Data Analysis. ....................................................................................................... 69
2.3 Results and Discussion ..................................................................................................... 70
2.3.1 Solution Hybridization Experiments. .................................................................... 70
2.3.2 In-Channel Assay Assembly and Hybridization Experiments. ............................. 73
2.3.3 Quantitative On-Chip Transduction. ..................................................................... 75

x
2.3.4 Assay Selectivity and Stringency. ......................................................................... 78
2.4 Conclusions ....................................................................................................................... 79
On-Chip Multiplexed Solid-Phase Nucleic Acid Hybridization Assay Using Spatial 3Profiles of Immobilized Quantum Dots and Fluorescence Resonance Energy Transfer ......... 81
3.1 Introduction ....................................................................................................................... 81
3.2 Methods and Materials ...................................................................................................... 83
3.2.1 Reagents ................................................................................................................ 83
3.2.2 Fabrication of Microfluidic Chips ........................................................................ 85
3.2.3 Assembly of the biorecognition interface ............................................................. 85
3.3 Results and Discussion ..................................................................................................... 86
3.3.1 The FRET Pairs ..................................................................................................... 86
3.3.2 Single-Color Hybridization Assays ...................................................................... 87
3.3.3 Selectivity ............................................................................................................. 90
3.3.4 Multiplexed Hybridization Assays: Two-Colour Immobilization of QDs ........... 91
3.3.5 Two-Color Multiplexed Hybridization Assays ..................................................... 94
3.4 Conclusions ..................................................................................................................... 100
Interfacial Nucleic Acid Hybridization on Streptavidin Coated Quantum Dots: Impact of 4Nanocrystal Size on the Sensitivity and Selectivity of Oligonucleotide Conjugates ............. 102
4.1 Introduction ..................................................................................................................... 102
4.2 Experimental Methods .................................................................................................... 105
4.2.1 Preparation of QD-SMN1 Probe Conjugates ...................................................... 105
4.2.2 Hybridization Experiments and FRET Efficiency .............................................. 106
4.2.3 Selectivity of Hybridization and SNP Resolution .............................................. 106
4.3 Results and Discussion ................................................................................................... 107
4.3.1 FRET Efficiency and Sensitivity ........................................................................ 107
4.3.2 Transduction of Single Nucleotide Polymorphisms ........................................... 111
4.3.3 Effect of Probe Number on Selectivity ............................................................... 113

xi
4.3.4 Effect of Ionic Strength on SNP Resolution ....................................................... 115
4.3.5 Toward SNP Resolution in Complex Matrices ................................................... 116
4.4 Conclusions ..................................................................................................................... 117
Transduction of Unlabeled Target Oligonucleotides and Resolution of Single Nucleotide 5Polymorphisms in an Electrokinetically Controlled Microfluidic Chip using Immobilized Quantum Dots and Fluorescence Resonance Energy Transfer .............................................. 119
5.1 Introduction ..................................................................................................................... 119
5.2 Experimental Methods .................................................................................................... 121
5.2.1 On-Chip Assay Assembly ................................................................................... 121
5.2.2 On-chip Hybridization and Assay Regeneration ................................................ 123
5.2.3 Unlabeled Target Hybridization Experiments. ................................................... 124
5.2.4 Data Analysis ...................................................................................................... 124
5.3 Results and Discussion ................................................................................................... 124
5.3.1 The Impact of QD Immobilization Density on Assay Sensitivity ...................... 124
5.3.2 On-chip SNP Resolution ..................................................................................... 126
5.3.3 Regeneration of the In-channel Assay ................................................................ 127
5.3.4 Transduction of Unlabeled Target ...................................................................... 128
5.3.5 Unlabeled SNP Transduction and Analyses in Complex Matrices .................... 131
5.4 Conclusions ..................................................................................................................... 133
Conclusions ............................................................................................................................ 134 6
6.1 Future Work .................................................................................................................... 135
Appendix 1 – Supporting Information for Chapter 2 .................................................................. 139
Appendix 2 – Supporting Information for Chapter 3 .................................................................. 152
Appendix 3 – Supporting Information for Chapter 4 .................................................................. 167
Appendix 4 – Supporting Information for Chapter 5 .................................................................. 174
Copyright Acknowledgements .................................................................................................... 180
References ................................................................................................................................... 181

xii
List of Tables
Table 1. Standard free energies and melt temperatures for a 10mer duplex at 0.11M [Na+] with
all possible permutations of a central 1BPM.21 ............................................................................ 10
Table 2. Oligonucleotide sequences ............................................................................................. 67
Table 3. Assembly Steps for the Solid Phase Microfluidic Assay ............................................... 68
Table 4. Oligonucleotide Sequences. ............................................................................................ 84
Table 5. Steps for the In-Channel Assembly of the Solid Phase Assay ....................................... 86
Table 6. Analytical figures of merit for the SMN1 and uidA TGTs in the single-color and two-
color assay formats. ...................................................................................................................... 97
Table 7. Oligonucleotide Sequences. .......................................................................................... 106
Table 8. PL lifetimes of the gSAv-QDs and rSAv-QD SMN1 PCs in response to increasing
amounts of Cy3, and A647 labeled FC TGTs. ............................................................................ 109
Table 9. Oligonucleotide Sequences. .......................................................................................... 122
Table 10. In-channel Assay Preparation ..................................................................................... 123
xiii
List of Figures
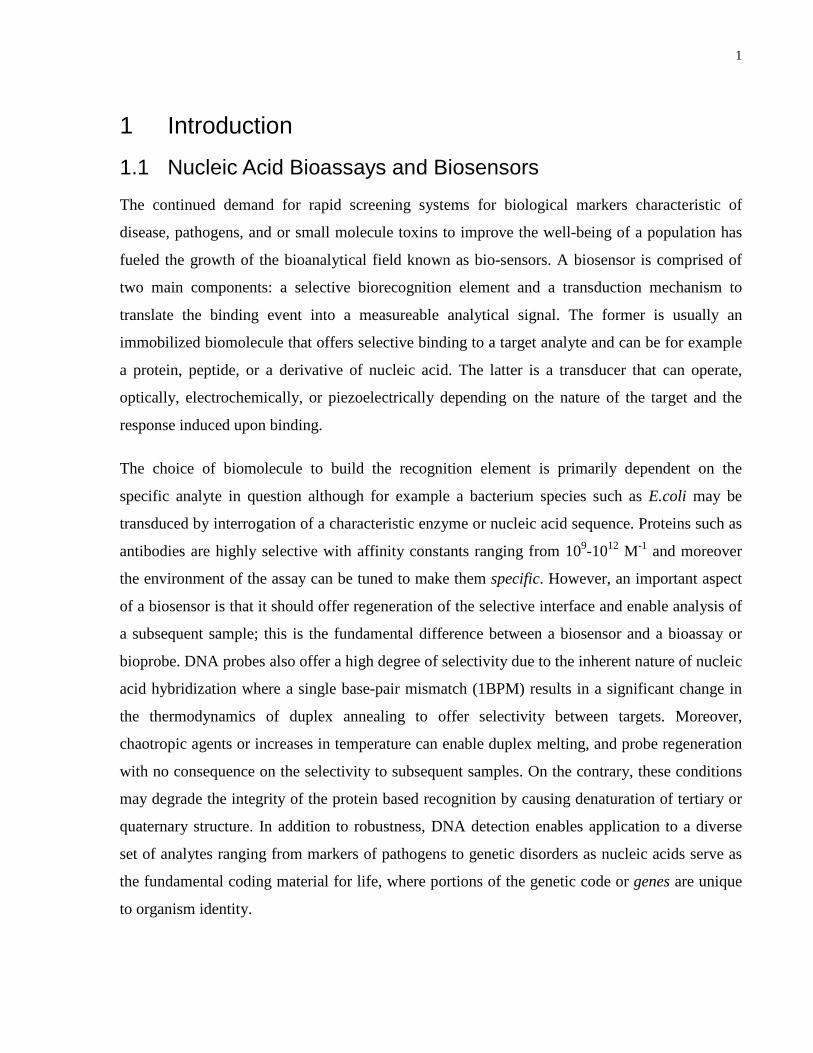
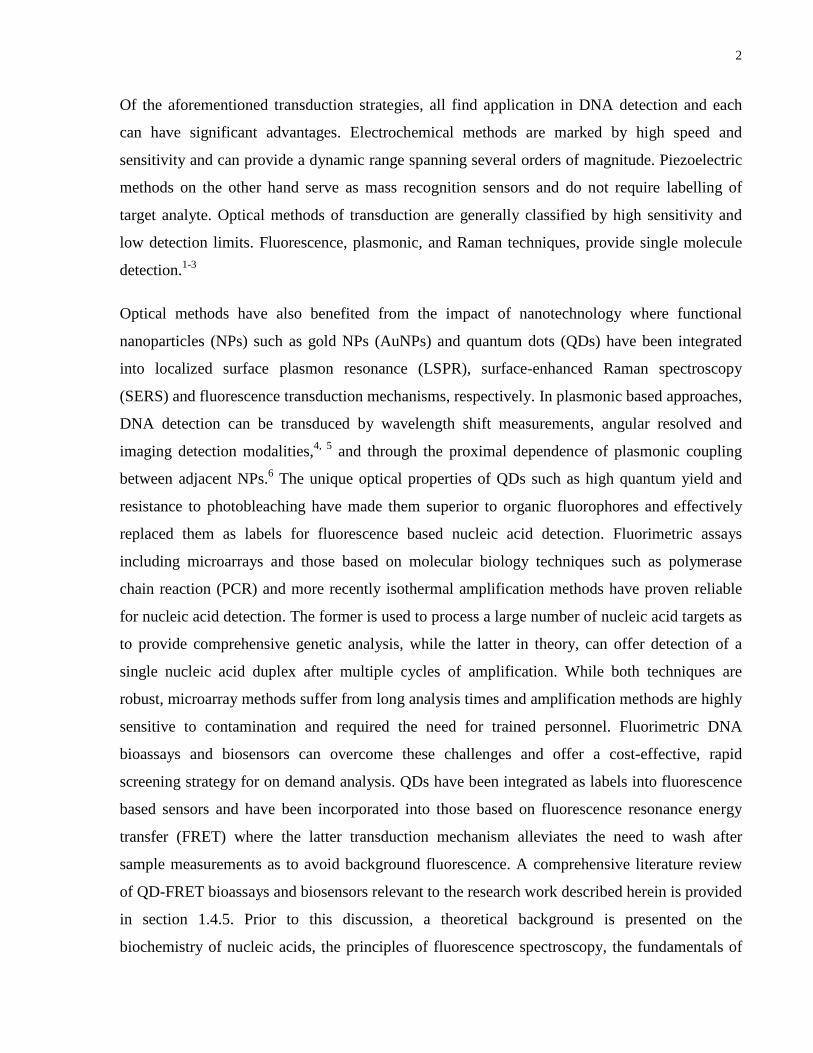
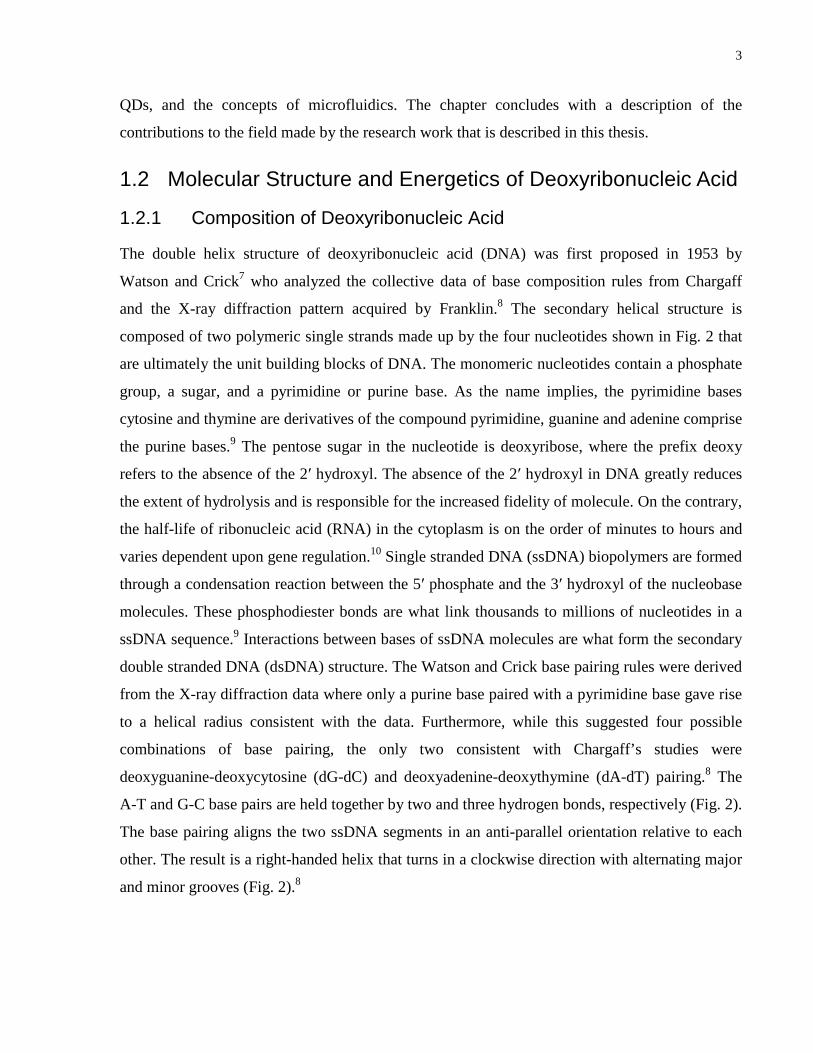
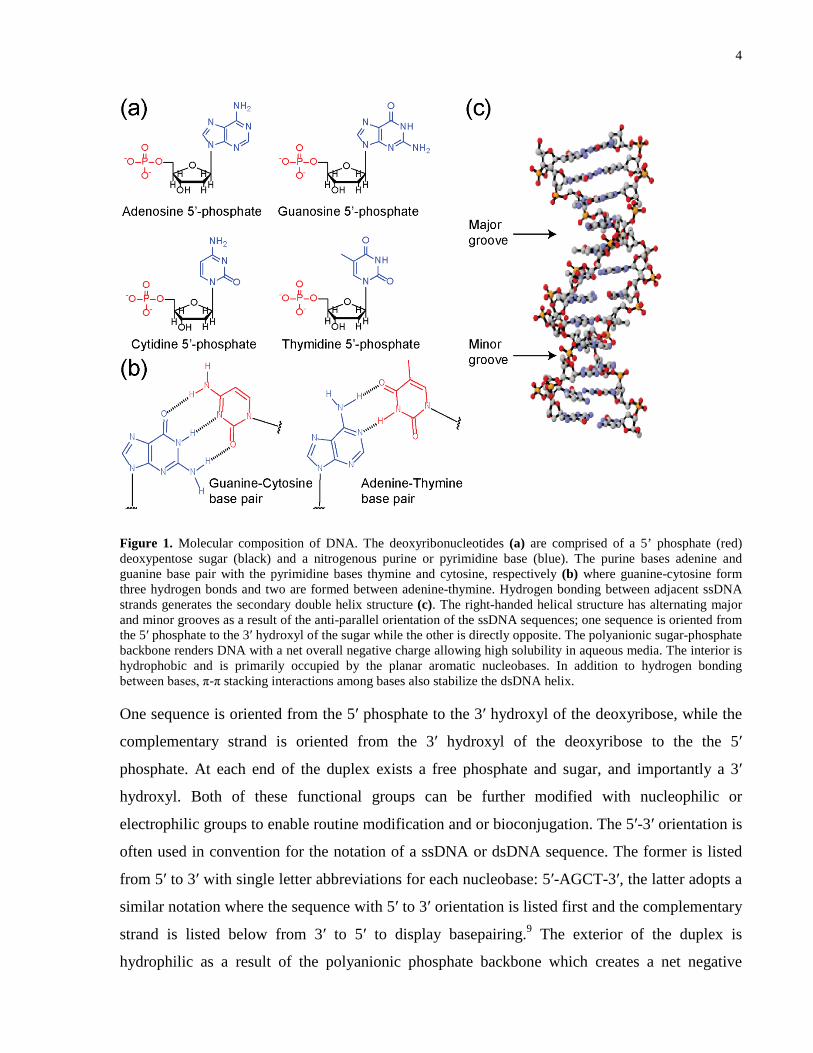
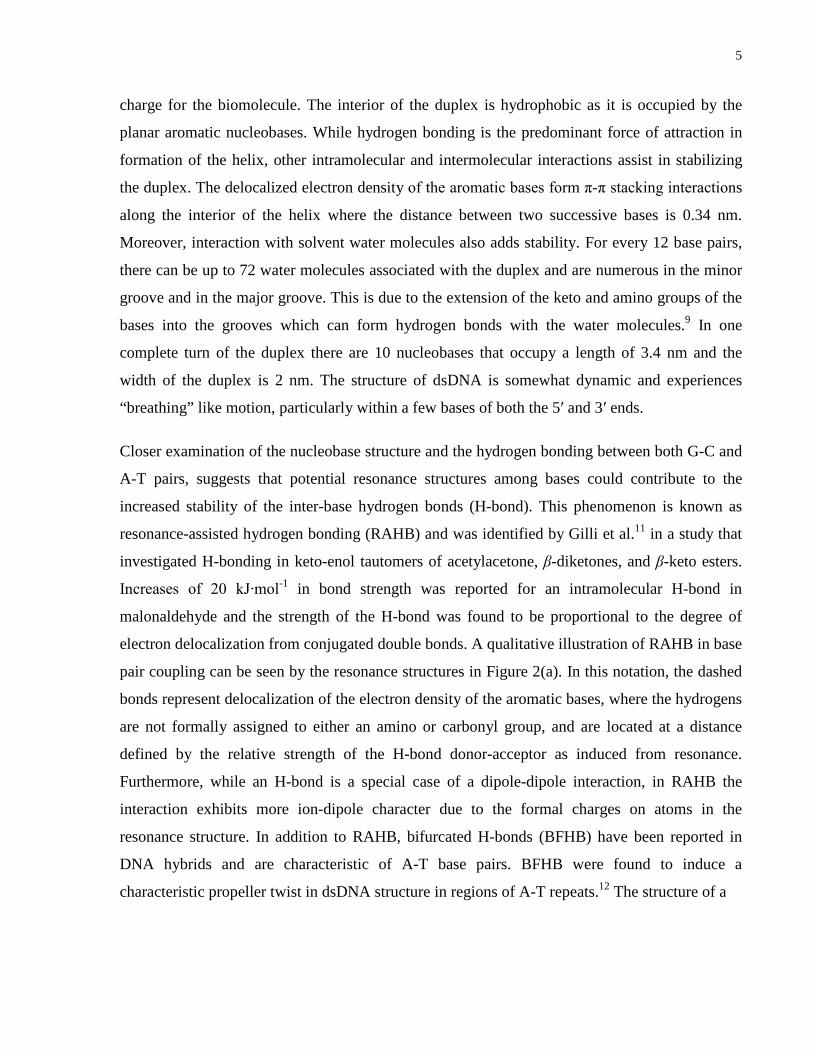
Figure 1. Molecular composition of DNA. The deoxyribonucleotides (a) are comprised of a 5’
phosphate (red) deoxypentose sugar (black) and a nitrogenous purine or pyrimidine base (blue).
The purine bases adenine and guanine base pair with the pyrimidine bases thymine and cytosine,
respectively (b) where guanine-cytosine form three hydrogen bonds and two are formed between
adenine-thymine. Hydrogen bonding between adjacent ssDNA strands generates the secondary
double helix structure (c). The right-handed helical structure has alternating major and minor
grooves as a result of the anti-parallel orientation of the ssDNA sequences; one sequence is
oriented from the 5ʹ phosphate to the 3ʹ hydroxyl of the sugar while the other is directly opposite.
The polyanionic sugar-phosphate backbone renders DNA with a net overall negative charge
allowing high solubility in aqueous media. The interior is hydrophobic and is primarily occupied
by the planar aromatic nucleobases. In addition to hydrogen bonding between bases, π-π stacking
interactions among bases also stabilize the dsDNA helix. ............................................................. 4
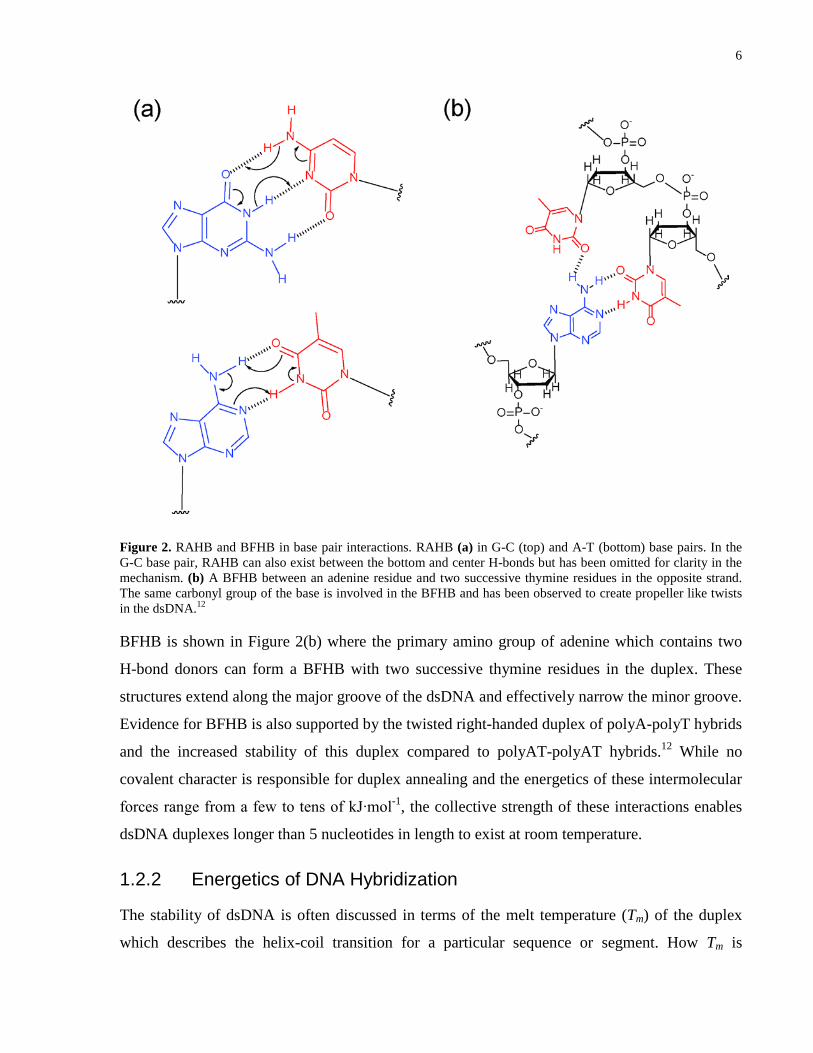
Figure 2. RAHB and BFHB in base pair interactions. RAHB (a) in G-C (top) and A-T (bottom)
base pairs. In the G-C base pair, RAHB can also exist between the bottom and center H-bonds
but has been omitted for clarity in the mechanism. (b) A BFHB between an adenine residue and
two successive thymine residues in the opposite strand. The same carbonyl group of the base is
involved in the BFHB and has been observed to create propeller like twists in the dsDNA.12 ...... 6
Figure 3. Jablonski diagram for absorption and luminescence.27 The electronic singlet states are
given by S0, S1, and S2 which refer to the ground state, and first and second excited states,
respectively. Vibrational energy levels are superimposed in each electronic potential well as
given by ν0 to ν5. The triplet state is given by T1, where the spin of the electron must first flip to
enter this state given that overlap exists between the singlet vibrational levels and those of the
triplet state. Electronic excitation of an electron from the ground state to one of the excited states
is facilitated by resonance absorption of a photon which occurs in 10-15s. The electron can reside
in any of the vibrational levels of either S1 or S2, where the electron rapidly (10-12s) decays by
vibrational relaxation due to collision with solvent to lowest vibrational level of the electronic
state. In addition to vibrational relaxation, other forms of nonradiative relaxation include internal
xiv
and external conversion. In the case of the former, the mechanism is thought to be a result of
overlap between vibrational energy levels of the excited state and ground state. The latter is due
to collisions with adjacent molecules of sufficient energy to cause deactivation of the excited
state. Fluorescence is defined as the radiative relaxation of the electron from the lowest
vibrational level of the S1 to any of the vibrational levels of S0. The timescale of fluorescence
ranges from 10-7 to 10-9 s and thus this is why vibrational relaxation processes dominate prior to
radiative decay. The presence of heavy atoms such as halides can cause spin-orbit coupling
interactions with the excited electron causing intersystem crossing of the electron into the triplet
state. The radiative relaxation from the triplet state back to the ground singlet state is known as
phosphorescence and occurs at a relatively slower rate compared to fluorescence (10-5 to 10 s)
since the spin of the electron must first flip prior to relaxation. ................................................... 13
Figure 4. Modified Jablonski diagram depicting the process of energy transfer (kET) from a
hypothetical donor molecule to a proximal acceptor. The coloured emission bands in donor
relaxation are identical to those in acceptor excitation to qualitatively display the spectral overlap
(J). The ground states and excited states are denoted by S0 and S1 respectively, where the
vibrational states of each electronic state are given by (ν0- ν4). Vibrational relaxation (bolded
arrows) is still faster than the rate of energy transfer from the donor, along with other forms of
nonradiative decay; these however have been omitted for clarity. ............................................... 23
Figure 5. QD composition and resultant nanostructures. (a) The size-tunable photoluminescence
of CdSe QDs as a result of illumination with a UV light. The blue vial on the left is characteristic
of QDs ca. 2 nm in diameter where the red sample on the far right is ca. 6 nm. (b) Structure of a
core-shell QD where the core is composed of CdSe and the shell of ZnS. The structure of CdSe
in the core adopts a wurtzite configuration, while the ZnS shell conforms to a zinc blende unit
cell. (c) Higher order zinc blende (i) and wurtzite (ii) structures displaying tens of unit cells to
illustrate the resultant shape of the CdS (iii) and CdSe (iv) QDs in the TEM images. (d) (i) TEM
image of alternate CdSe nanostructures: NRs and tetrapods, enhanced TEM images of an
individual NR (ii) and tetrapod (iii). Panel (a) reprinted with permission from ref. 32. Copyright
2008 American Chemical Society. Panel (c) adapted with permission from ref. 39. Copyright
1996 American Chemical Society. Panel (d) adapted with permission from ref. 40. Copyright
2000 American Chemical Society. ............................................................................................... 27
xv
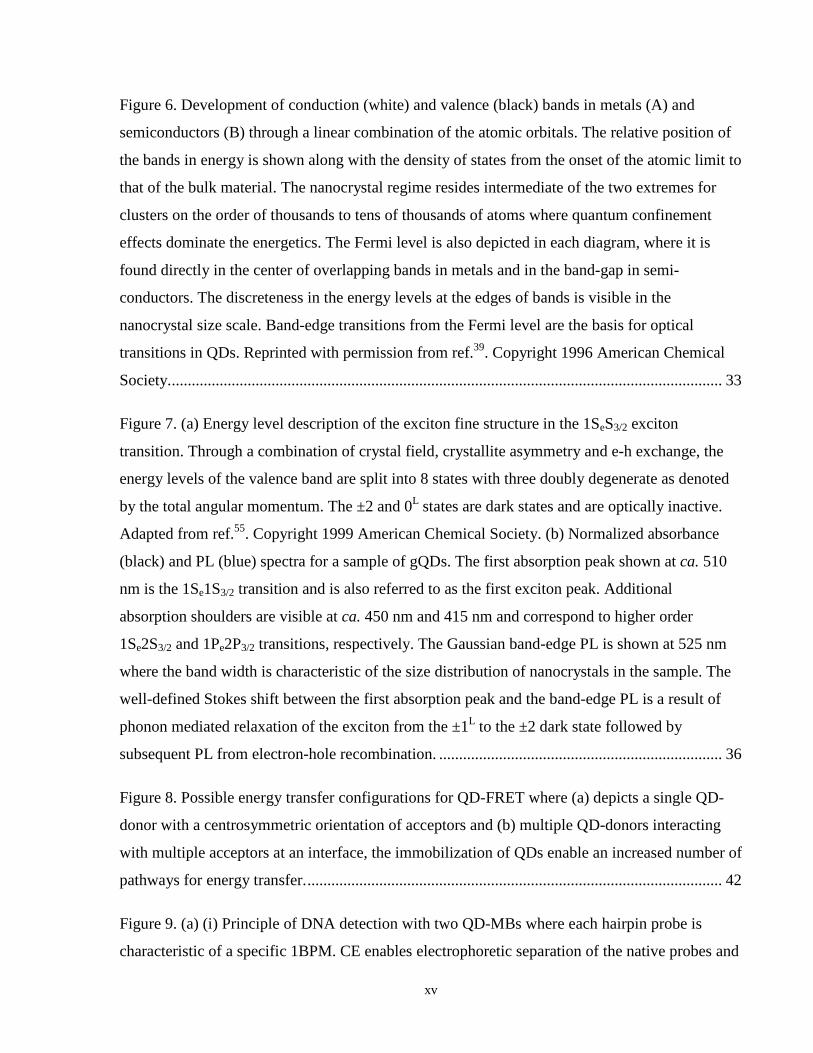
Figure 6. Development of conduction (white) and valence (black) bands in metals (A) and
semiconductors (B) through a linear combination of the atomic orbitals. The relative position of
the bands in energy is shown along with the density of states from the onset of the atomic limit to
that of the bulk material. The nanocrystal regime resides intermediate of the two extremes for
clusters on the order of thousands to tens of thousands of atoms where quantum confinement
effects dominate the energetics. The Fermi level is also depicted in each diagram, where it is
found directly in the center of overlapping bands in metals and in the band-gap in semi-
conductors. The discreteness in the energy levels at the edges of bands is visible in the
nanocrystal size scale. Band-edge transitions from the Fermi level are the basis for optical
transitions in QDs. Reprinted with permission from ref.39. Copyright 1996 American Chemical
Society. .......................................................................................................................................... 33
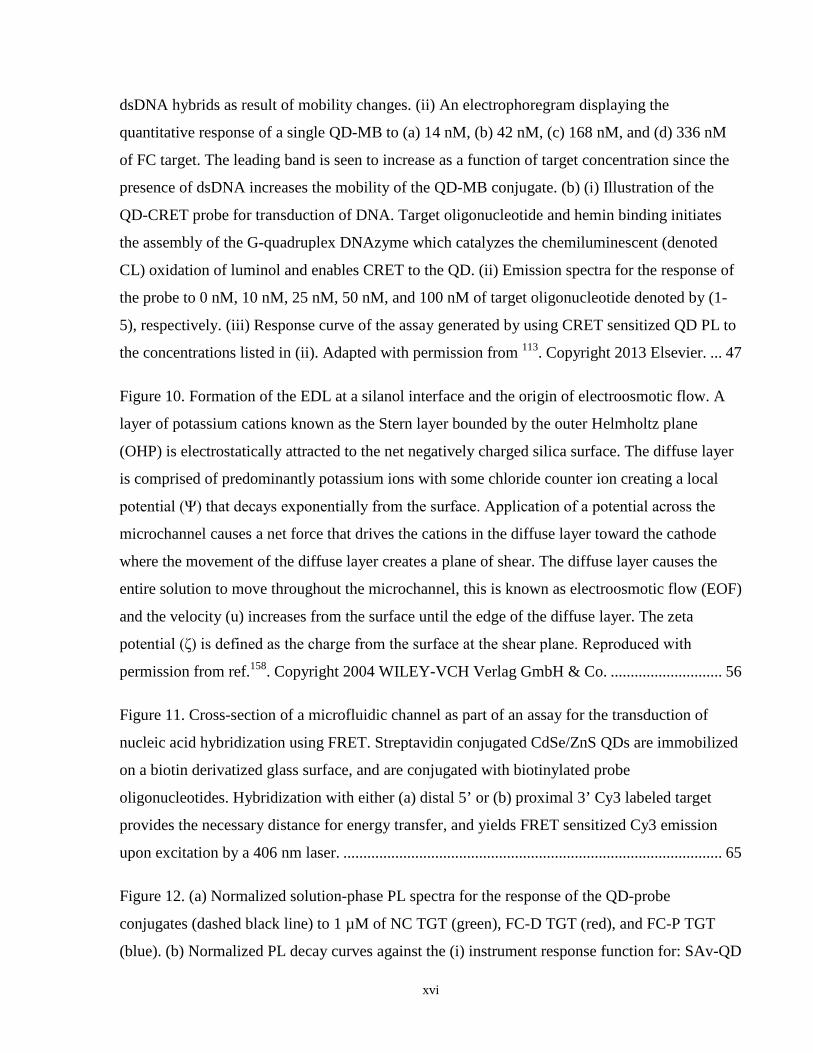
Figure 7. (a) Energy level description of the exciton fine structure in the 1SeS3/2 exciton
transition. Through a combination of crystal field, crystallite asymmetry and e-h exchange, the
energy levels of the valence band are split into 8 states with three doubly degenerate as denoted
by the total angular momentum. The ±2 and 0L states are dark states and are optically inactive.
Adapted from ref.55. Copyright 1999 American Chemical Society. (b) Normalized absorbance
(black) and PL (blue) spectra for a sample of gQDs. The first absorption peak shown at ca. 510
nm is the 1Se1S3/2 transition and is also referred to as the first exciton peak. Additional
absorption shoulders are visible at ca. 450 nm and 415 nm and correspond to higher order
1Se2S3/2 and 1Pe2P3/2 transitions, respectively. The Gaussian band-edge PL is shown at 525 nm
where the band width is characteristic of the size distribution of nanocrystals in the sample. The
well-defined Stokes shift between the first absorption peak and the band-edge PL is a result of
phonon mediated relaxation of the exciton from the ±1L to the ±2 dark state followed by
subsequent PL from electron-hole recombination. ....................................................................... 36
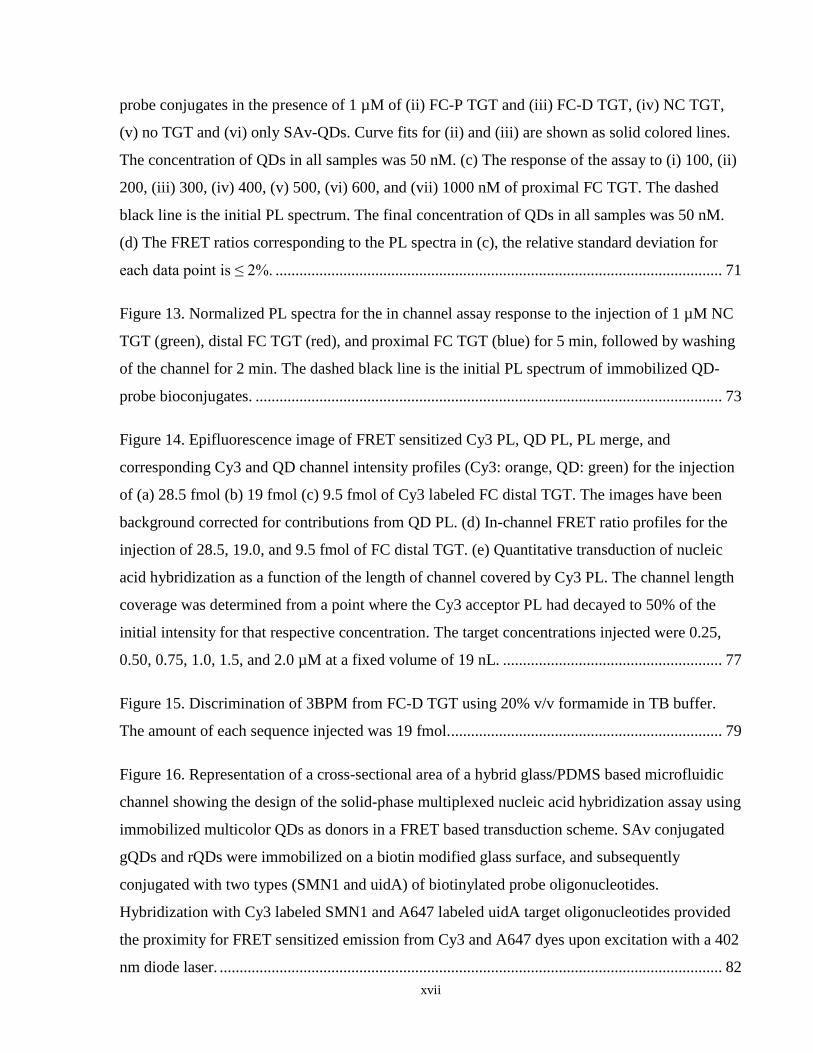
Figure 8. Possible energy transfer configurations for QD-FRET where (a) depicts a single QD-
donor with a centrosymmetric orientation of acceptors and (b) multiple QD-donors interacting
with multiple acceptors at an interface, the immobilization of QDs enable an increased number of
pathways for energy transfer. ........................................................................................................ 42
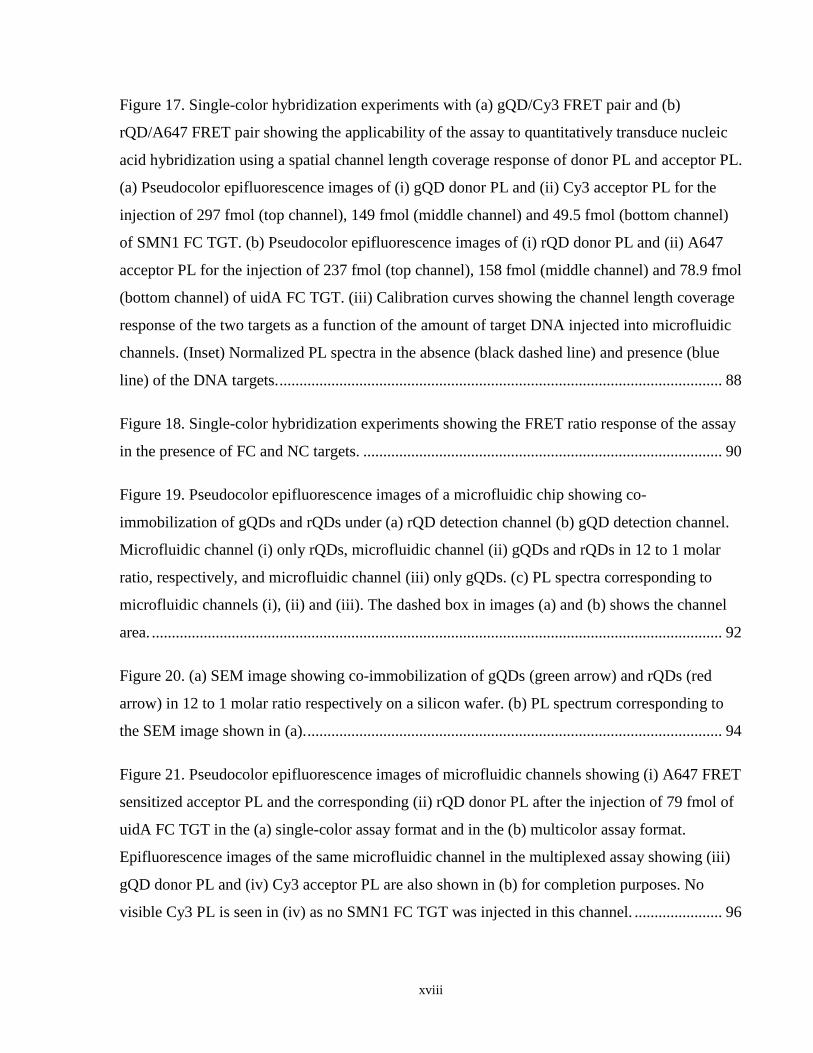
Figure 9. (a) (i) Principle of DNA detection with two QD-MBs where each hairpin probe is
characteristic of a specific 1BPM. CE enables electrophoretic separation of the native probes and
xvi
dsDNA hybrids as result of mobility changes. (ii) An electrophoregram displaying the
quantitative response of a single QD-MB to (a) 14 nM, (b) 42 nM, (c) 168 nM, and (d) 336 nM
of FC target. The leading band is seen to increase as a function of target concentration since the
presence of dsDNA increases the mobility of the QD-MB conjugate. (b) (i) Illustration of the
QD-CRET probe for transduction of DNA. Target oligonucleotide and hemin binding initiates
the assembly of the G-quadruplex DNAzyme which catalyzes the chemiluminescent (denoted
CL) oxidation of luminol and enables CRET to the QD. (ii) Emission spectra for the response of
the probe to 0 nM, 10 nM, 25 nM, 50 nM, and 100 nM of target oligonucleotide denoted by (1-
5), respectively. (iii) Response curve of the assay generated by using CRET sensitized QD PL to
the concentrations listed in (ii). Adapted with permission from 113. Copyright 2013 Elsevier. ... 47
Figure 10. Formation of the EDL at a silanol interface and the origin of electroosmotic flow. A
layer of potassium cations known as the Stern layer bounded by the outer Helmholtz plane
(OHP) is electrostatically attracted to the net negatively charged silica surface. The diffuse layer
is comprised of predominantly potassium ions with some chloride counter ion creating a local
potential (Ψ) that decays exponentially from the surface. Application of a potential across the
microchannel causes a net force that drives the cations in the diffuse layer toward the cathode
where the movement of the diffuse layer creates a plane of shear. The diffuse layer causes the
entire solution to move throughout the microchannel, this is known as electroosmotic flow (EOF)
and the velocity (u) increases from the surface until the edge of the diffuse layer. The zeta
potential (ζ) is defined as the charge from the surface at the shear plane. Reproduced with
permission from ref.158. Copyright 2004 WILEY-VCH Verlag GmbH & Co. ............................ 56
Figure 11. Cross-section of a microfluidic channel as part of an assay for the transduction of
nucleic acid hybridization using FRET. Streptavidin conjugated CdSe/ZnS QDs are immobilized
on a biotin derivatized glass surface, and are conjugated with biotinylated probe
oligonucleotides. Hybridization with either (a) distal 5’ or (b) proximal 3’ Cy3 labeled target
provides the necessary distance for energy transfer, and yields FRET sensitized Cy3 emission
upon excitation by a 406 nm laser. ............................................................................................... 65
Figure 12. (a) Normalized solution-phase PL spectra for the response of the QD-probe
conjugates (dashed black line) to 1 µM of NC TGT (green), FC-D TGT (red), and FC-P TGT
(blue). (b) Normalized PL decay curves against the (i) instrument response function for: SAv-QD
xvii
probe conjugates in the presence of 1 µM of (ii) FC-P TGT and (iii) FC-D TGT, (iv) NC TGT,
(v) no TGT and (vi) only SAv-QDs. Curve fits for (ii) and (iii) are shown as solid colored lines.
The concentration of QDs in all samples was 50 nM. (c) The response of the assay to (i) 100, (ii)
200, (iii) 300, (iv) 400, (v) 500, (vi) 600, and (vii) 1000 nM of proximal FC TGT. The dashed
black line is the initial PL spectrum. The final concentration of QDs in all samples was 50 nM.
(d) The FRET ratios corresponding to the PL spectra in (c), the relative standard deviation for
each data point is ≤ 2%. ................................................................................................................ 71
Figure 13. Normalized PL spectra for the in channel assay response to the injection of 1 µM NC
TGT (green), distal FC TGT (red), and proximal FC TGT (blue) for 5 min, followed by washing
of the channel for 2 min. The dashed black line is the initial PL spectrum of immobilized QD-
probe bioconjugates. ..................................................................................................................... 73
Figure 14. Epifluorescence image of FRET sensitized Cy3 PL, QD PL, PL merge, and
corresponding Cy3 and QD channel intensity profiles (Cy3: orange, QD: green) for the injection
of (a) 28.5 fmol (b) 19 fmol (c) 9.5 fmol of Cy3 labeled FC distal TGT. The images have been
background corrected for contributions from QD PL. (d) In-channel FRET ratio profiles for the
injection of 28.5, 19.0, and 9.5 fmol of FC distal TGT. (e) Quantitative transduction of nucleic
acid hybridization as a function of the length of channel covered by Cy3 PL. The channel length
coverage was determined from a point where the Cy3 acceptor PL had decayed to 50% of the
initial intensity for that respective concentration. The target concentrations injected were 0.25,
0.50, 0.75, 1.0, 1.5, and 2.0 µM at a fixed volume of 19 nL. ....................................................... 77
Figure 15. Discrimination of 3BPM from FC-D TGT using 20% v/v formamide in TB buffer.
The amount of each sequence injected was 19 fmol. .................................................................... 79
Figure 16. Representation of a cross-sectional area of a hybrid glass/PDMS based microfluidic
channel showing the design of the solid-phase multiplexed nucleic acid hybridization assay using
immobilized multicolor QDs as donors in a FRET based transduction scheme. SAv conjugated
gQDs and rQDs were immobilized on a biotin modified glass surface, and subsequently
conjugated with two types (SMN1 and uidA) of biotinylated probe oligonucleotides.
Hybridization with Cy3 labeled SMN1 and A647 labeled uidA target oligonucleotides provided
the proximity for FRET sensitized emission from Cy3 and A647 dyes upon excitation with a 402
nm diode laser. .............................................................................................................................. 82
xviii
Figure 17. Single-color hybridization experiments with (a) gQD/Cy3 FRET pair and (b)
rQD/A647 FRET pair showing the applicability of the assay to quantitatively transduce nucleic
acid hybridization using a spatial channel length coverage response of donor PL and acceptor PL.
(a) Pseudocolor epifluorescence images of (i) gQD donor PL and (ii) Cy3 acceptor PL for the
injection of 297 fmol (top channel), 149 fmol (middle channel) and 49.5 fmol (bottom channel)
of SMN1 FC TGT. (b) Pseudocolor epifluorescence images of (i) rQD donor PL and (ii) A647
acceptor PL for the injection of 237 fmol (top channel), 158 fmol (middle channel) and 78.9 fmol
(bottom channel) of uidA FC TGT. (iii) Calibration curves showing the channel length coverage
response of the two targets as a function of the amount of target DNA injected into microfluidic
channels. (Inset) Normalized PL spectra in the absence (black dashed line) and presence (blue
line) of the DNA targets. ............................................................................................................... 88
Figure 18. Single-color hybridization experiments showing the FRET ratio response of the assay
in the presence of FC and NC targets. .......................................................................................... 90
Figure 19. Pseudocolor epifluorescence images of a microfluidic chip showing co-
immobilization of gQDs and rQDs under (a) rQD detection channel (b) gQD detection channel.
Microfluidic channel (i) only rQDs, microfluidic channel (ii) gQDs and rQDs in 12 to 1 molar
ratio, respectively, and microfluidic channel (iii) only gQDs. (c) PL spectra corresponding to
microfluidic channels (i), (ii) and (iii). The dashed box in images (a) and (b) shows the channel
area. ............................................................................................................................................... 92
Figure 20. (a) SEM image showing co-immobilization of gQDs (green arrow) and rQDs (red
arrow) in 12 to 1 molar ratio respectively on a silicon wafer. (b) PL spectrum corresponding to
the SEM image shown in (a). ........................................................................................................ 94
Figure 21. Pseudocolor epifluorescence images of microfluidic channels showing (i) A647 FRET
sensitized acceptor PL and the corresponding (ii) rQD donor PL after the injection of 79 fmol of
uidA FC TGT in the (a) single-color assay format and in the (b) multicolor assay format.
Epifluorescence images of the same microfluidic channel in the multiplexed assay showing (iii)
gQD donor PL and (iv) Cy3 acceptor PL are also shown in (b) for completion purposes. No
visible Cy3 PL is seen in (iv) as no SMN1 FC TGT was injected in this channel. ...................... 96
xix
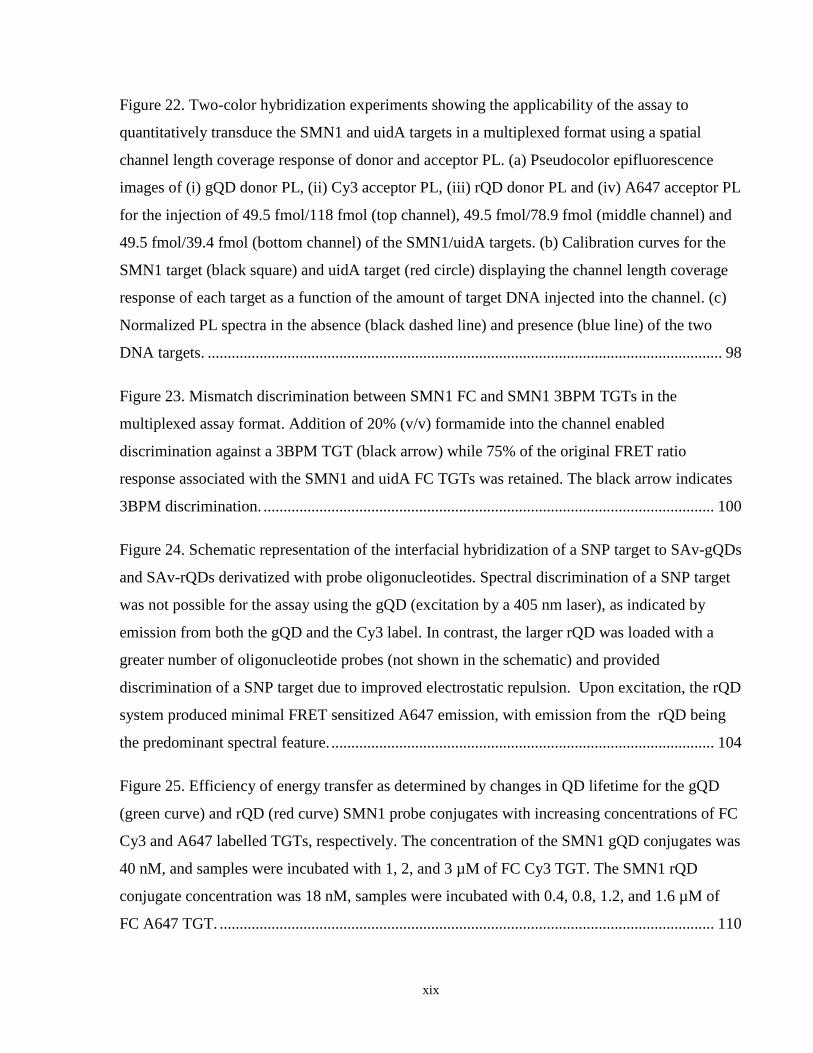
Figure 22. Two-color hybridization experiments showing the applicability of the assay to
quantitatively transduce the SMN1 and uidA targets in a multiplexed format using a spatial
channel length coverage response of donor and acceptor PL. (a) Pseudocolor epifluorescence
images of (i) gQD donor PL, (ii) Cy3 acceptor PL, (iii) rQD donor PL and (iv) A647 acceptor PL
for the injection of 49.5 fmol/118 fmol (top channel), 49.5 fmol/78.9 fmol (middle channel) and
49.5 fmol/39.4 fmol (bottom channel) of the SMN1/uidA targets. (b) Calibration curves for the
SMN1 target (black square) and uidA target (red circle) displaying the channel length coverage
response of each target as a function of the amount of target DNA injected into the channel. (c)
Normalized PL spectra in the absence (black dashed line) and presence (blue line) of the two
DNA targets. ................................................................................................................................. 98
Figure 23. Mismatch discrimination between SMN1 FC and SMN1 3BPM TGTs in the
multiplexed assay format. Addition of 20% (v/v) formamide into the channel enabled
discrimination against a 3BPM TGT (black arrow) while 75% of the original FRET ratio
response associated with the SMN1 and uidA FC TGTs was retained. The black arrow indicates
3BPM discrimination. ................................................................................................................. 100
Figure 24. Schematic representation of the interfacial hybridization of a SNP target to SAv-gQDs
and SAv-rQDs derivatized with probe oligonucleotides. Spectral discrimination of a SNP target
was not possible for the assay using the gQD (excitation by a 405 nm laser), as indicated by
emission from both the gQD and the Cy3 label. In contrast, the larger rQD was loaded with a
greater number of oligonucleotide probes (not shown in the schematic) and provided
discrimination of a SNP target due to improved electrostatic repulsion. Upon excitation, the rQD
system produced minimal FRET sensitized A647 emission, with emission from the rQD being
the predominant spectral feature. ................................................................................................ 104
Figure 25. Efficiency of energy transfer as determined by changes in QD lifetime for the gQD
(green curve) and rQD (red curve) SMN1 probe conjugates with increasing concentrations of FC
Cy3 and A647 labelled TGTs, respectively. The concentration of the SMN1 gQD conjugates was
40 nM, and samples were incubated with 1, 2, and 3 µM of FC Cy3 TGT. The SMN1 rQD
conjugate concentration was 18 nM, samples were incubated with 0.4, 0.8, 1.2, and 1.6 µM of
FC A647 TGT. ............................................................................................................................ 110
xx
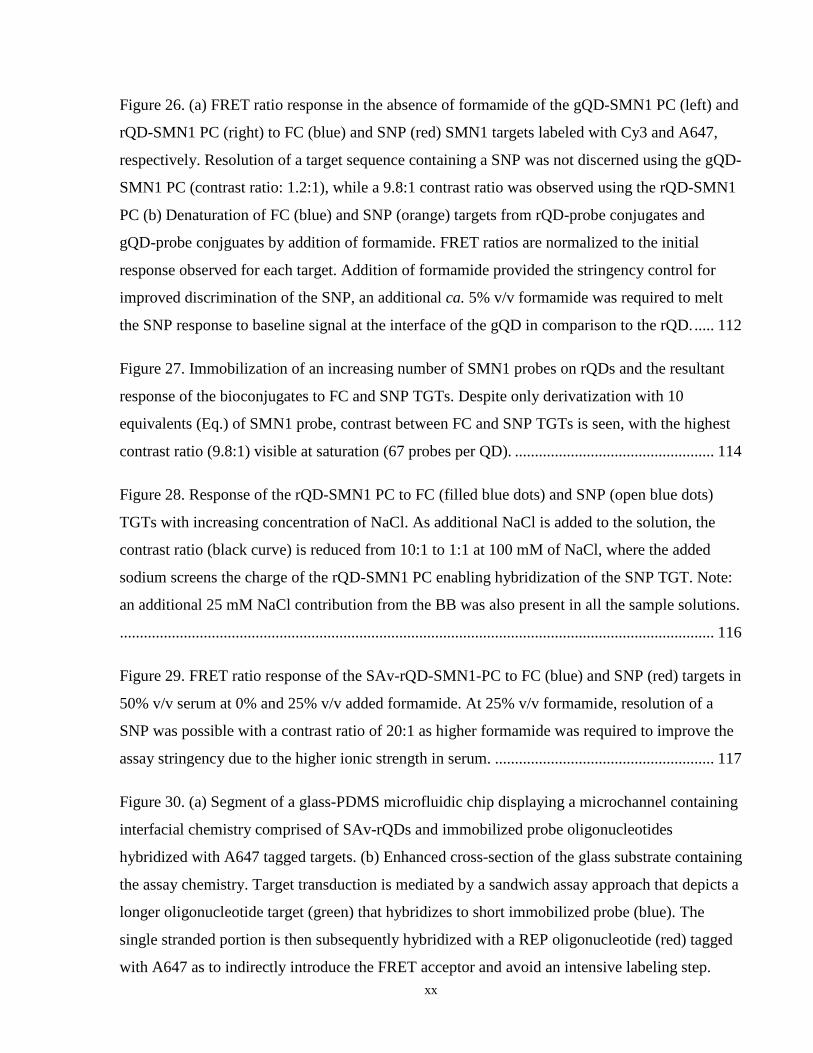
Figure 26. (a) FRET ratio response in the absence of formamide of the gQD-SMN1 PC (left) and
rQD-SMN1 PC (right) to FC (blue) and SNP (red) SMN1 targets labeled with Cy3 and A647,
respectively. Resolution of a target sequence containing a SNP was not discerned using the gQD-
SMN1 PC (contrast ratio: 1.2:1), while a 9.8:1 contrast ratio was observed using the rQD-SMN1
PC (b) Denaturation of FC (blue) and SNP (orange) targets from rQD-probe conjugates and
gQD-probe conjguates by addition of formamide. FRET ratios are normalized to the initial
response observed for each target. Addition of formamide provided the stringency control for
improved discrimination of the SNP, an additional ca. 5% v/v formamide was required to melt
the SNP response to baseline signal at the interface of the gQD in comparison to the rQD. ..... 112
Figure 27. Immobilization of an increasing number of SMN1 probes on rQDs and the resultant
response of the bioconjugates to FC and SNP TGTs. Despite only derivatization with 10
equivalents (Eq.) of SMN1 probe, contrast between FC and SNP TGTs is seen, with the highest
contrast ratio (9.8:1) visible at saturation (67 probes per QD). .................................................. 114
Figure 28. Response of the rQD-SMN1 PC to FC (filled blue dots) and SNP (open blue dots)
TGTs with increasing concentration of NaCl. As additional NaCl is added to the solution, the
contrast ratio (black curve) is reduced from 10:1 to 1:1 at 100 mM of NaCl, where the added
sodium screens the charge of the rQD-SMN1 PC enabling hybridization of the SNP TGT. Note:
an additional 25 mM NaCl contribution from the BB was also present in all the sample solutions.
..................................................................................................................................................... 116
Figure 29. FRET ratio response of the SAv-rQD-SMN1-PC to FC (blue) and SNP (red) targets in
50% v/v serum at 0% and 25% v/v added formamide. At 25% v/v formamide, resolution of a
SNP was possible with a contrast ratio of 20:1 as higher formamide was required to improve the
assay stringency due to the higher ionic strength in serum. ....................................................... 117
Figure 30. (a) Segment of a glass-PDMS microfluidic chip displaying a microchannel containing
interfacial chemistry comprised of SAv-rQDs and immobilized probe oligonucleotides
hybridized with A647 tagged targets. (b) Enhanced cross-section of the glass substrate containing
the assay chemistry. Target transduction is mediated by a sandwich assay approach that depicts a
longer oligonucleotide target (green) that hybridizes to short immobilized probe (blue). The
single stranded portion is then subsequently hybridized with a REP oligonucleotide (red) tagged
with A647 as to indirectly introduce the FRET acceptor and avoid an intensive labeling step.
xxi
FRET sensitized A647 signal target hybridization and with increased stringency conditions, SNP
resolution was also possible in this format. The same biotin-SAv interaction was utilized for both
QD immobilization and probe bioconjugation as highlighted by the circular inset at the bottom of
the figure. .................................................................................................................................... 120
Figure 31. SEM images of in-channel immobilized (a) SAv-gQDs (b) SAv-rQDs on planar
biotinylated glass slides (PDMS had been removed to expose the glass). EOF deposition of both
types of QDs displayed homogeneous immobilization and no multilayer formation. ............... 125
Figure 32. Response of the rQD-A647 in-channel assay to FC (blue) and SNP (red) targets in BB
with 0% and 5% v/v formamide (F). After hybridization with FC and SNP targets, injection of
5% v/v F in BB is sufficient to denature the SNP, with the signal from the SNP target being
reduced to the background level within experimental precision. ............................................... 126
Figure 33. Regeneration of the in-channel assay after a first cycle of hybridization using 20 %
v/v formamide in BB at an applied field of 167 V∙cm-1. T denotes a target injection and R
denotes a regeneration cycle. The final data point is the resulting FRET response after injection
of NC TGT. ................................................................................................................................. 128
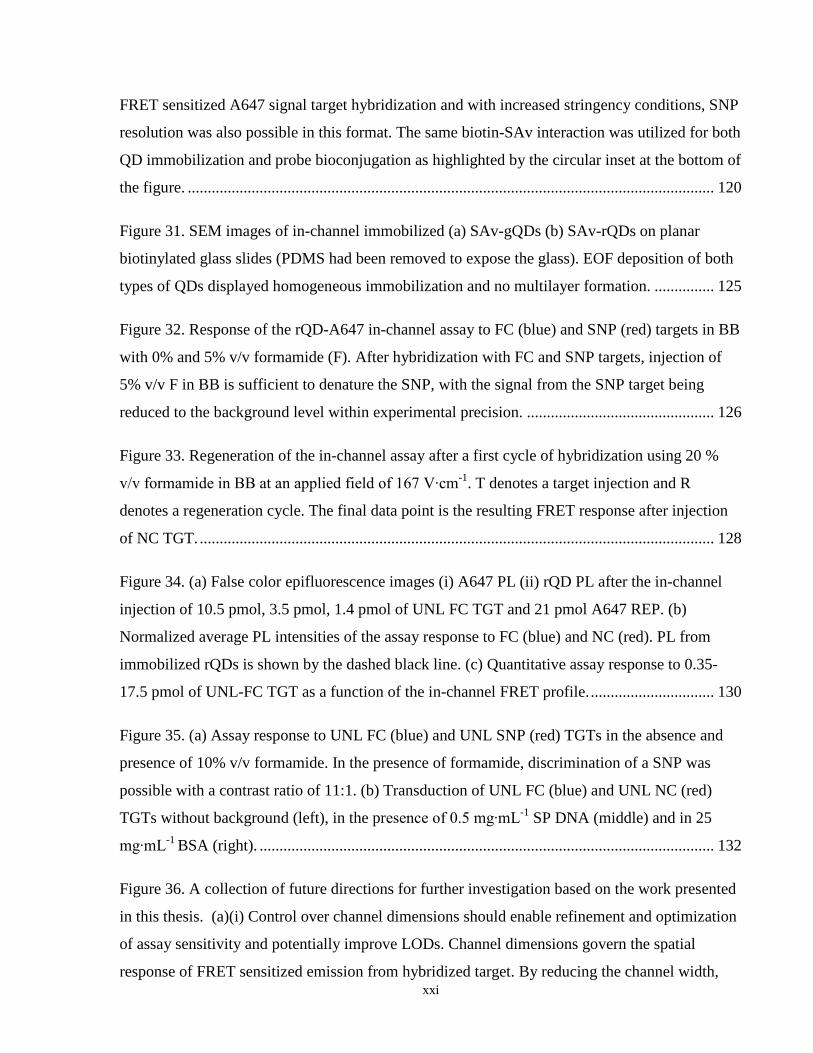
Figure 34. (a) False color epifluorescence images (i) A647 PL (ii) rQD PL after the in-channel
injection of 10.5 pmol, 3.5 pmol, 1.4 pmol of UNL FC TGT and 21 pmol A647 REP. (b)
Normalized average PL intensities of the assay response to FC (blue) and NC (red). PL from
immobilized rQDs is shown by the dashed black line. (c) Quantitative assay response to 0.35-
17.5 pmol of UNL-FC TGT as a function of the in-channel FRET profile. ............................... 130
Figure 35. (a) Assay response to UNL FC (blue) and UNL SNP (red) TGTs in the absence and
presence of 10% v/v formamide. In the presence of formamide, discrimination of a SNP was
possible with a contrast ratio of 11:1. (b) Transduction of UNL FC (blue) and UNL NC (red)
TGTs without background (left), in the presence of 0.5 mg∙mL-1 SP DNA (middle) and in 25
mg∙mL-1 BSA (right). .................................................................................................................. 132
Figure 36. A collection of future directions for further investigation based on the work presented
in this thesis. (a)(i) Control over channel dimensions should enable refinement and optimization
of assay sensitivity and potentially improve LODs. Channel dimensions govern the spatial
response of FRET sensitized emission from hybridized target. By reducing the channel width,
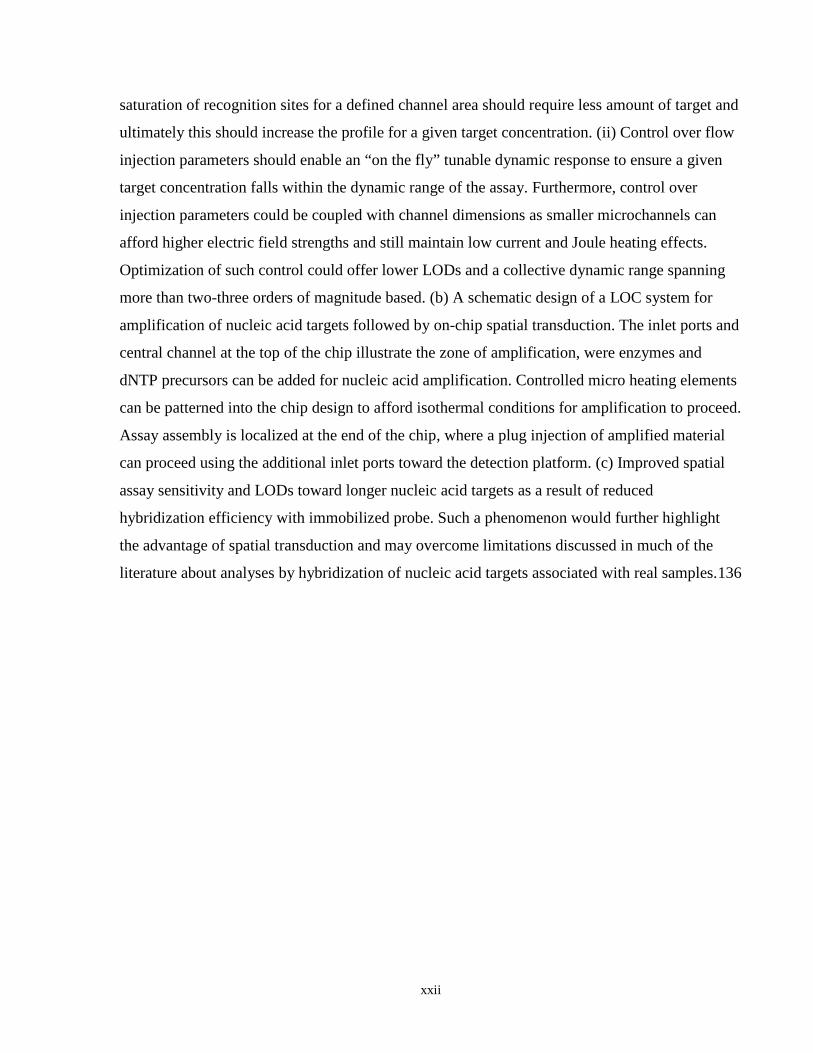
xxii
saturation of recognition sites for a defined channel area should require less amount of target and
ultimately this should increase the profile for a given target concentration. (ii) Control over flow
injection parameters should enable an “on the fly” tunable dynamic response to ensure a given
target concentration falls within the dynamic range of the assay. Furthermore, control over
injection parameters could be coupled with channel dimensions as smaller microchannels can
afford higher electric field strengths and still maintain low current and Joule heating effects.
Optimization of such control could offer lower LODs and a collective dynamic range spanning
more than two-three orders of magnitude based. (b) A schematic design of a LOC system for
amplification of nucleic acid targets followed by on-chip spatial transduction. The inlet ports and
central channel at the top of the chip illustrate the zone of amplification, were enzymes and
dNTP precursors can be added for nucleic acid amplification. Controlled micro heating elements
can be patterned into the chip design to afford isothermal conditions for amplification to proceed.
Assay assembly is localized at the end of the chip, where a plug injection of amplified material
can proceed using the additional inlet ports toward the detection platform. (c) Improved spatial
assay sensitivity and LODs toward longer nucleic acid targets as a result of reduced
hybridization efficiency with immobilized probe. Such a phenomenon would further highlight
the advantage of spatial transduction and may overcome limitations discussed in much of the
literature about analyses by hybridization of nucleic acid targets associated with real samples. 136

xxiii
List of Appendices
Appendix 1 – Supporting Information for Chapter 2…………………………………………..139
Appendix 2 – Supporting Information for Chapter 3…………………………………………..151
Appendix 3 – Supporting Information for Chapter 4…………………………………………..166
Appendix 4 – Supporting Information for Chapter 5…………………………………………..173
1
Introduction 1
1.1 Nucleic Acid Bioassays and Biosensors
The continued demand for rapid screening systems for biological markers characteristic of
disease, pathogens, and or small molecule toxins to improve the well-being of a population has
fueled the growth of the bioanalytical field known as bio-sensors. A biosensor is comprised of
two main components: a selective biorecognition element and a transduction mechanism to
translate the binding event into a measureable analytical signal. The former is usually an
immobilized biomolecule that offers selective binding to a target analyte and can be for example
a protein, peptide, or a derivative of nucleic acid. The latter is a transducer that can operate,
optically, electrochemically, or piezoelectrically depending on the nature of the target and the
response induced upon binding.
The choice of biomolecule to build the recognition element is primarily dependent on the
specific analyte in question although for example a bacterium species such as E.coli may be
transduced by interrogation of a characteristic enzyme or nucleic acid sequence. Proteins such as
antibodies are highly selective with affinity constants ranging from 109-1012 M-1 and moreover
the environment of the assay can be tuned to make them specific. However, an important aspect
of a biosensor is that it should offer regeneration of the selective interface and enable analysis of
a subsequent sample; this is the fundamental difference between a biosensor and a bioassay or
bioprobe. DNA probes also offer a high degree of selectivity due to the inherent nature of nucleic
acid hybridization where a single base-pair mismatch (1BPM) results in a significant change in
the thermodynamics of duplex annealing to offer selectivity between targets. Moreover,
chaotropic agents or increases in temperature can enable duplex melting, and probe regeneration
with no consequence on the selectivity to subsequent samples. On the contrary, these conditions
may degrade the integrity of the protein based recognition by causing denaturation of tertiary or
quaternary structure. In addition to robustness, DNA detection enables application to a diverse
set of analytes ranging from markers of pathogens to genetic disorders as nucleic acids serve as
the fundamental coding material for life, where portions of the genetic code or genes are unique
to organism identity.
2
Of the aforementioned transduction strategies, all find application in DNA detection and each
can have significant advantages. Electrochemical methods are marked by high speed and
sensitivity and can provide a dynamic range spanning several orders of magnitude. Piezoelectric
methods on the other hand serve as mass recognition sensors and do not require labelling of
target analyte. Optical methods of transduction are generally classified by high sensitivity and
low detection limits. Fluorescence, plasmonic, and Raman techniques, provide single molecule
detection.1-3
Optical methods have also benefited from the impact of nanotechnology where functional
nanoparticles (NPs) such as gold NPs (AuNPs) and quantum dots (QDs) have been integrated
into localized surface plasmon resonance (LSPR), surface-enhanced Raman spectroscopy
(SERS) and fluorescence transduction mechanisms, respectively. In plasmonic based approaches,
DNA detection can be transduced by wavelength shift measurements, angular resolved and
imaging detection modalities,4, 5 and through the proximal dependence of plasmonic coupling
between adjacent NPs.6 The unique optical properties of QDs such as high quantum yield and
resistance to photobleaching have made them superior to organic fluorophores and effectively
replaced them as labels for fluorescence based nucleic acid detection. Fluorimetric assays
including microarrays and those based on molecular biology techniques such as polymerase
chain reaction (PCR) and more recently isothermal amplification methods have proven reliable
for nucleic acid detection. The former is used to process a large number of nucleic acid targets as
to provide comprehensive genetic analysis, while the latter in theory, can offer detection of a
single nucleic acid duplex after multiple cycles of amplification. While both techniques are
robust, microarray methods suffer from long analysis times and amplification methods are highly
sensitive to contamination and required the need for trained personnel. Fluorimetric DNA
bioassays and biosensors can overcome these challenges and offer a cost-effective, rapid
screening strategy for on demand analysis. QDs have been integrated as labels into fluorescence
based sensors and have been incorporated into those based on fluorescence resonance energy
transfer (FRET) where the latter transduction mechanism alleviates the need to wash after
sample measurements as to avoid background fluorescence. A comprehensive literature review
of QD-FRET bioassays and biosensors relevant to the research work described herein is provided
in section 1.4.5. Prior to this discussion, a theoretical background is presented on the
biochemistry of nucleic acids, the principles of fluorescence spectroscopy, the fundamentals of
3
QDs, and the concepts of microfluidics. The chapter concludes with a description of the
contributions to the field made by the research work that is described in this thesis.
1.2 Molecular Structure and Energetics of Deoxyribonucleic Acid
1.2.1 Composition of Deoxyribonucleic Acid
The double helix structure of deoxyribonucleic acid (DNA) was first proposed in 1953 by
Watson and Crick7 who analyzed the collective data of base composition rules from Chargaff
and the X-ray diffraction pattern acquired by Franklin.8 The secondary helical structure is
composed of two polymeric single strands made up by the four nucleotides shown in Fig. 2 that
are ultimately the unit building blocks of DNA. The monomeric nucleotides contain a phosphate
group, a sugar, and a pyrimidine or purine base. As the name implies, the pyrimidine bases
cytosine and thymine are derivatives of the compound pyrimidine, guanine and adenine comprise
the purine bases.9 The pentose sugar in the nucleotide is deoxyribose, where the prefix deoxy
refers to the absence of the 2ʹ hydroxyl. The absence of the 2ʹ hydroxyl in DNA greatly reduces
the extent of hydrolysis and is responsible for the increased fidelity of molecule. On the contrary,
the half-life of ribonucleic acid (RNA) in the cytoplasm is on the order of minutes to hours and
varies dependent upon gene regulation.10 Single stranded DNA (ssDNA) biopolymers are formed
through a condensation reaction between the 5ʹ phosphate and the 3ʹ hydroxyl of the nucleobase
molecules. These phosphodiester bonds are what link thousands to millions of nucleotides in a
ssDNA sequence.9 Interactions between bases of ssDNA molecules are what form the secondary
double stranded DNA (dsDNA) structure. The Watson and Crick base pairing rules were derived
from the X-ray diffraction data where only a purine base paired with a pyrimidine base gave rise
to a helical radius consistent with the data. Furthermore, while this suggested four possible
combinations of base pairing, the only two consistent with Chargaff’s studies were
deoxyguanine-deoxycytosine (dG-dC) and deoxyadenine-deoxythymine (dA-dT) pairing.8 The
A-T and G-C base pairs are held together by two and three hydrogen bonds, respectively (Fig. 2).
The base pairing aligns the two ssDNA segments in an anti-parallel orientation relative to each
other. The result is a right-handed helix that turns in a clockwise direction with alternating major
and minor grooves (Fig. 2).8
4
Figure 1. Molecular composition of DNA. The deoxyribonucleotides (a) are comprised of a 5’ phosphate (red) deoxypentose sugar (black) and a nitrogenous purine or pyrimidine base (blue). The purine bases adenine and guanine base pair with the pyrimidine bases thymine and cytosine, respectively (b) where guanine-cytosine form three hydrogen bonds and two are formed between adenine-thymine. Hydrogen bonding between adjacent ssDNA strands generates the secondary double helix structure (c). The right-handed helical structure has alternating major and minor grooves as a result of the anti-parallel orientation of the ssDNA sequences; one sequence is oriented from the 5ʹ phosphate to the 3ʹ hydroxyl of the sugar while the other is directly opposite. The polyanionic sugar-phosphate backbone renders DNA with a net overall negative charge allowing high solubility in aqueous media. The interior is hydrophobic and is primarily occupied by the planar aromatic nucleobases. In addition to hydrogen bonding between bases, π-π stacking interactions among bases also stabilize the dsDNA helix.
One sequence is oriented from the 5ʹ phosphate to the 3ʹ hydroxyl of the deoxyribose, while the
complementary strand is oriented from the 3ʹ hydroxyl of the deoxyribose to the the 5ʹ
phosphate. At each end of the duplex exists a free phosphate and sugar, and importantly a 3ʹ
hydroxyl. Both of these functional groups can be further modified with nucleophilic or
electrophilic groups to enable routine modification and or bioconjugation. The 5ʹ-3ʹ orientation is
often used in convention for the notation of a ssDNA or dsDNA sequence. The former is listed
from 5ʹ to 3ʹ with single letter abbreviations for each nucleobase: 5ʹ-AGCT-3ʹ, the latter adopts a
similar notation where the sequence with 5ʹ to 3ʹ orientation is listed first and the complementary
strand is listed below from 3ʹ to 5ʹ to display basepairing.9 The exterior of the duplex is
hydrophilic as a result of the polyanionic phosphate backbone which creates a net negative
5
charge for the biomolecule. The interior of the duplex is hydrophobic as it is occupied by the
planar aromatic nucleobases. While hydrogen bonding is the predominant force of attraction in
formation of the helix, other intramolecular and intermolecular interactions assist in stabilizing
the duplex. The delocalized electron density of the aromatic bases form π-π stacking interactions
along the interior of the helix where the distance between two successive bases is 0.34 nm.
Moreover, interaction with solvent water molecules also adds stability. For every 12 base pairs,
there can be up to 72 water molecules associated with the duplex and are numerous in the minor
groove and in the major groove. This is due to the extension of the keto and amino groups of the
bases into the grooves which can form hydrogen bonds with the water molecules.9 In one
complete turn of the duplex there are 10 nucleobases that occupy a length of 3.4 nm and the
width of the duplex is 2 nm. The structure of dsDNA is somewhat dynamic and experiences
“breathing” like motion, particularly within a few bases of both the 5ʹ and 3ʹ ends.
Closer examination of the nucleobase structure and the hydrogen bonding between both G-C and
A-T pairs, suggests that potential resonance structures among bases could contribute to the
increased stability of the inter-base hydrogen bonds (H-bond). This phenomenon is known as
resonance-assisted hydrogen bonding (RAHB) and was identified by Gilli et al.11 in a study that
investigated H-bonding in keto-enol tautomers of acetylacetone, β-diketones, and β-keto esters.
Increases of 20 kJ∙mol-1 in bond strength was reported for an intramolecular H-bond in
malonaldehyde and the strength of the H-bond was found to be proportional to the degree of
electron delocalization from conjugated double bonds. A qualitative illustration of RAHB in base
pair coupling can be seen by the resonance structures in Figure 2(a). In this notation, the dashed
bonds represent delocalization of the electron density of the aromatic bases, where the hydrogens
are not formally assigned to either an amino or carbonyl group, and are located at a distance
defined by the relative strength of the H-bond donor-acceptor as induced from resonance.
Furthermore, while an H-bond is a special case of a dipole-dipole interaction, in RAHB the
interaction exhibits more ion-dipole character due to the formal charges on atoms in the
resonance structure. In addition to RAHB, bifurcated H-bonds (BFHB) have been reported in
DNA hybrids and are characteristic of A-T base pairs. BFHB were found to induce a
characteristic propeller twist in dsDNA structure in regions of A-T repeats.12 The structure of a
6
Figure 2. RAHB and BFHB in base pair interactions. RAHB (a) in G-C (top) and A-T (bottom) base pairs. In the G-C base pair, RAHB can also exist between the bottom and center H-bonds but has been omitted for clarity in the mechanism. (b) A BFHB between an adenine residue and two successive thymine residues in the opposite strand. The same carbonyl group of the base is involved in the BFHB and has been observed to create propeller like twists in the dsDNA.12
BFHB is shown in Figure 2(b) where the primary amino group of adenine which contains two
H-bond donors can form a BFHB with two successive thymine residues in the duplex. These
structures extend along the major groove of the dsDNA and effectively narrow the minor groove.
Evidence for BFHB is also supported by the twisted right-handed duplex of polyA-polyT hybrids
and the increased stability of this duplex compared to polyAT-polyAT hybrids.12 While no
covalent character is responsible for duplex annealing and the energetics of these intermolecular
forces range from a few to tens of kJ∙mol-1, the collective strength of these interactions enables
dsDNA duplexes longer than 5 nucleotides in length to exist at room temperature.
1.2.2 Energetics of DNA Hybridization
The stability of dsDNA is often discussed in terms of the melt temperature (Tm) of the duplex
which describes the helix-coil transition for a particular sequence or segment. How Tm is
7
calculated varies for DNA-DNA, RNA-RNA, and DNA-RNA polynucleotide hybrids.13 For
polynucleotide sequences on the order of hundreds of base pairs, Tm (ºC) is described by Eqn. 1
which considers DNA-DNA polynucleotide hybrids.
𝑇𝑚 = 81.5 + 16.6 �log10 �[Na+]
1 + 0.7[Na+]�� + 0.7(% G + C) −
500𝑛
− 𝑃 (1)
For a polynucleotide duplex, Tm is defined as the temperature at which 50% of the bases pairs
have been separated and result in loops or separated ends in the duplex.13 Tm is a function of the
intrinsic makeup of the sequence as seen in Eqn. 1, where a higher percentage of guanine and
cytosine residues (% G + C) and a longer duplex length in nucleotides (n) afford higher stability.
Given that three H-bonds form between a single G-C base pair, it is apparent how a higher G + C
content leads to an increased Tm. The percentage of mismatch in the duplex (P) refers to
positions of energetically unfavorable base pairs, which can be one or more of all other
permutations of base pairs other than determined by the aforementioned Watson and Crick rules.
Details of the impact of mismatch percentage and location on duplex stability are discussed at
the end of this section. In addition to the characteristics of the duplex, the effect of the local
environment on hybridization is also prominent, where the local concentration of sodium ([Na])
influences duplex stability. The contribution from ionic strength can be understood by discussion
of the proposed kinetic model of hybridization which proceeds first by nucleation of the two
ssDNA sequences, followed by rapid zippering of the strands via base pairing to form the double
helix.13 At neutral pH and under most physiologically relevant buffers, the phosphate backbone
of the oligonucleotide is completely ionized. This creates a barrier to hybridization as nucleation
of two polyanionic structures is highly unfavorable at low ionic strength. Addition of cations
such as sodium, potassium or magnesium suppressed the Debye length of each negatively
charged phosphate and screens the overall effective charge. This improves hybridization
efficiency and also affords a higher Tm to the resultant duplex.
While Eqn. 1 is sufficient for predicting the stability of polynucleotide duplexes it is not
applicable in describing the hybridization of oligonucleotides. First and foremost, Tm for an
oligonucleotide duplex is defined as the temperature at which 50% of the duplexes are separated
into ssDNA coils and is dependent on the total strand concentration (C) since hybridization is
intermolecular and reaches equilibrium.13 In order to describe the Tm for an oligonucleotide a
8
nearest neighbor model14 is considered which includes the collective standard free energy (ΔGº)
and enthalpy (ΔHº) of all nucleotides in the duplex as shown by Eqn. 2.13
𝑇𝑚 =𝑇°∆𝐻°
�∆𝐻° − ∆𝐺° + 𝑅𝑇°ln (𝐶/4)�+ 16.6 �log10 �
[Na+]1 + 0.7[Na+]
�� − 269.3 (2)
It is important to note that in Eqn. 2 both ΔHº and ΔGº are temperature independent and for a
self-complementary oligonucleotide duplex, the denominator of the first term is changed slightly
to C/2. Using the first fraction in Eqn. 2, a semi-quantitative description of the spontaneity of
oligonucleotide hybridization can be provided by considering the collective contributions to ΔGº
and ΔHº from N nearest-neighbor (nn) interactions and dangling ends (e) as given by Eqn. 3 and
Eqn. 4, respectively.13
∆𝐺° = � (𝑁𝑛𝑛 ∙ ∆𝐺°𝑛𝑛) + ∆𝐺°𝑖𝑛𝑛
+ ∆𝐺°𝑒 (3)
∆𝐻° = � (𝑁𝑛𝑛 ∙ ∆𝐻°𝑛𝑛) + ∆𝐻°𝑃𝑛𝑛
+ ∆𝐻°𝑒 (4)
Contributions from dangling ends are relevant for PCR, where primers may be designed to
amplify an internal segment of a larger dsDNA sequence. In Eqn. 3 the standard free energy of
initiation (ΔGºi) refers to the primary nucleation event resulting in formation of the first base-
pair(s) and is +2.2 kcal∙mol-1.13 A positive term for ΔGºi is expected because of the loss of
translational entropy of each ssDNA segment in formation of a relatively more ordered rigid
duplex.15 Standard free energies of nearest neighbor interactions range from -0.9 to -3.4
kcal∙mol-1, which is expected for the rapid zippering of the remaining base pairs in the duplex.15
The enthalpies of nearest neighbor and dangling ends are +8.0 kcal∙mol-1 and -8.0 kcal∙mol-1,
respectively where the free energy of a dangling end is -1 kcal∙mol-1.13 The standard entropy
change for a nearest neighbor interaction is -24.9 cal∙mol-1∙k-1.15 A qualitative description of the
process can be understood by weighing both enthalpic and entropic contributions. Considering
two ssDNA coils solvated in solution, enthalpic interactions exist between solvent water and the
sugar-phosphate backbone. H-bonding with amino and carbonyl groups of the nucleobases also
exist, however solvation of the entire planar aromatic structure creates an ordered network of H-
bonded water. Nucleation followed by rapid zippering of the base pairs creates new H-bonds
after those with solvent have been broken and ultimately ΔHº remains relatively unchanged.
9
Considering entropic contributions, while a loss in translation energy is expected for each
ssDNA, displacement of ordered water around the nucleobases to bulk solution after
hybridization is entropically favorable. For an oligonucleotide 20 residues long (20mer) and 50%
G-C content, Eqn. 2 predicts a Tm of 70 ºC for 1.0 µM of ssDNA at a [Na+] of 1.0 M.13 The level
of theory described by Eqn. 1 and Eqn. 2 has enabled creation of a web interface that allows
routine computation of Tm for a desired duplex in a variety of environments.16 Such an interface
is not only extremely valuable to probe selection, but also to primer design for PCR.
Experimental determination of Tm is also possible through UV-visible absorbance measurements
as a function of increasing temperature where the resultant plot is commonly referred to as a melt
curve. The nucleobases of ssDNA exhibit strong absorbance in the short UV region with an
absorbance maximum at 260 nm.9 In dsDNA, the delocalized electrons of the bases form π-π
stacking interactions and as a result, coupling between neighboring transient dipoles also takes
place. As a consequence, absorbance at 260 nm decreases and the resonant transition exhibits a
hypochromic shift toward 200 nm. This allows one to monitor the increased absorptivity at 260
nm as the duplex-coil transition takes place, where increases between 20-30% are common9.
While dsDNA exhibits hypochromism, the integrated area across the entire UV absorbance band
remains unchanged.15
Earlier discussion on factors influencing Tm for an oligonucleotide duplex has shown that
destabilization can be induced through intrinsic sequence characteristics and by control over the
external environment, where ionic strength is a significant factor. The presence of base pair
mismatches (BPM) also cause reductions in Tm as shown in Eqn. 1, where for polynucleotides
ΔTm is 1 ºC for a 1% sequence mismatch.13 In the case of an oligonucleotide duplex, a 1BPM
causes a greater degree of destabilization since the dsDNA is on the order of tens of base pairs in
length and two nearest neighbor contributions are effectively lost. For a 20mer, a single BPM
can cause a reduction in Tm of up to 5 ºC.13 Theoretical and experimental investigations by
Allawi and SantaLucia have made a significant contribution toward understanding the
destabilization of duplexes by intrinsic mismatches.17-21 Considering a 10mer oligonucleotide
duplex, the experimentally determined standard free energies and melt temperatures are
summarized in Table 1, along with resultant effects of a central 1BPM.21
10
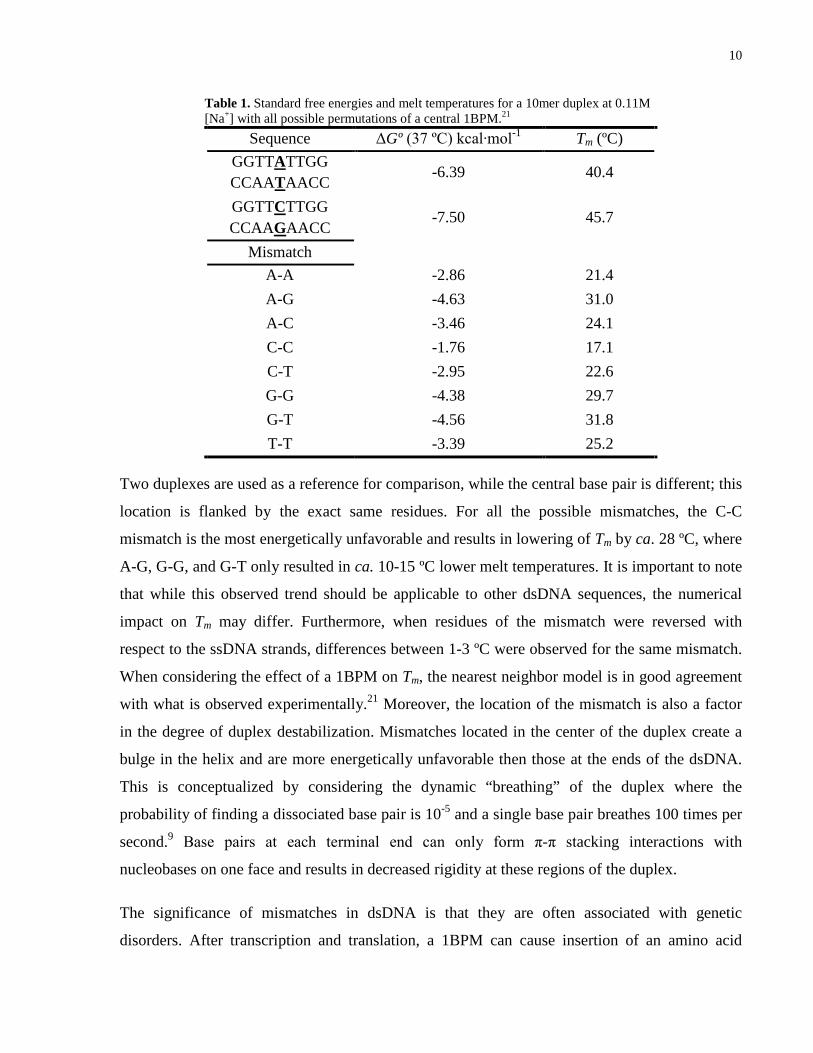
Table 1. Standard free energies and melt temperatures for a 10mer duplex at 0.11M [Na+] with all possible permutations of a central 1BPM.21
Sequence ΔGº (37 ºC) kcal∙mol-1 Tm (ºC) GGTTATTGG CCAATAACC
-6.39 40.4
GGTTCTTGG CCAAGAACC
-7.50 45.7
Mismatch A-A -2.86 21.4 A-G -4.63 31.0 A-C -3.46 24.1 C-C -1.76 17.1 C-T -2.95 22.6 G-G -4.38 29.7 G-T -4.56 31.8 T-T -3.39 25.2
Two duplexes are used as a reference for comparison, while the central base pair is different; this
location is flanked by the exact same residues. For all the possible mismatches, the C-C
mismatch is the most energetically unfavorable and results in lowering of Tm by ca. 28 ºC, where
A-G, G-G, and G-T only resulted in ca. 10-15 ºC lower melt temperatures. It is important to note
that while this observed trend should be applicable to other dsDNA sequences, the numerical
impact on Tm may differ. Furthermore, when residues of the mismatch were reversed with
respect to the ssDNA strands, differences between 1-3 ºC were observed for the same mismatch.
When considering the effect of a 1BPM on Tm, the nearest neighbor model is in good agreement
with what is observed experimentally.21 Moreover, the location of the mismatch is also a factor
in the degree of duplex destabilization. Mismatches located in the center of the duplex create a
bulge in the helix and are more energetically unfavorable then those at the ends of the dsDNA.
This is conceptualized by considering the dynamic “breathing” of the duplex where the
probability of finding a dissociated base pair is 10-5 and a single base pair breathes 100 times per
second.9 Base pairs at each terminal end can only form π-π stacking interactions with
nucleobases on one face and results in decreased rigidity at these regions of the duplex.
The significance of mismatches in dsDNA is that they are often associated with genetic
disorders. After transcription and translation, a 1BPM can cause insertion of an amino acid
11
residue that can generate a misfolded and dysfunctional protein. While there are proofreading
mechanisms in DNA replication, constant exposure to mutagens can still elicit base pair
mutations.8 Common causes are: insertion of an incorrect nucleotide during replication and
deletion or insertion of extra nucleotide(s). In the case of the autosomal recessive disorder spinal
muscular atrophy (SMA), deletions of base segments and resultant mismatches on the survival
motor neuron (SMN) gene are responsible for the disease.22 Mismatch variations or single
nucleotide polymorphisms (SNPs) are responsible for expression of the diseased state. SMA is
second only to cystic fibrosis for the cause of death in newborns.22 The SMN1 and SMN2 genes
encode similar proteins where only dysfunctional SMN1 protein leads to the diseased state. This
is often a result of conversion of SMN1 exon 7 to SMN2 and the resultant protein encoded by
SMN2 is inadequate to prevent disease progression.23 The relative amounts of SMN1 and SMN2
are ultimately responsible for the diseased state. In cystic fibrosis (CF), a three base pair deletion
and subsequent loss of phenylalanine at position 508 in the CF transmembrane protein receptor is
responsible for at least 70% of patient cases.24 Base mismatches offer a unique opportunity to
build inherent selectivity into oligonucleotide probe sequences since the energetic differences
relative to the perfectly matched sequence can enable resolution of healthy vs. diseased states.
Other external factors can also be controlled to destabilize dsDNA in addition to temperature and
ionic strength. Solutions at both pH extremes and chaotropic additives such as formamide and
urea can cause a lowering of Tm. These organic agents act by disrupting the intermolecular forces
of attraction that stabilize the duplex both internally and externally. Formamide for example
contains both H-bond donors and acceptors and can effectively interact with nucleobases in the
hydrophobic interior and along the major and minor grooves displacing solvated water
molecules. For every 1% v/v formamide, the Tm of an oligonucleotide is lowered by 0.6 ºC.25
The stability of DNA in various forms is remarkable, and the selectivity of hybridization is
attractive to exploit for building selective chemistry for assay development. Given the many
external factors that influence hybridization, one can further tune the stringency of the assay to
specifically transduce a hybridization event for a desired nucleic acid target.
1.3 Fluorescence Spectroscopy Luminescence is defined as the emission of a photon from a compound through transitions
between electronically excited states.26 Fluorescence and phosphorescence are two forms of
12
luminescence that are often classified as photoluminescence (PL) since they are caused by
absorption of a photon.27 Additional forms of luminescence include chemiluminescence and
bioluminescence. The former involves emission of a photon due to a chemical reaction while the
latter is similar but specific to an enzyme-substrate reaction. Fluorescence and phosphorescence
are both luminescent forms of excited state relaxation but differ in that phosphorescence requires
spin of the electron to flip prior to relaxation.27 The following section is dedicated to discussion
of fluorescence with a brief description of phosphorescence. Prior to discussion of luminescent
processes, it is necessary to describe the fundamentals of the absorption of electromagnetic
radiation. Both processes can be explained simultaneously by considering the pioneering work of
Alexander Jablonski, where a Jablonski diagram is used to illustrate the processes of molecular
absorbance and luminescence.
1.3.1 Jablonski Diagram
Professor Alexander Jablonski is regarded as a pioneer in fluorescence spectroscopy from his
contributions in understanding anisotropic fluorescence measurements.26 A Jablonski diagram as
shown in Fig. 4 is often used to qualitatively describe molecular absorption and excited state
processes such as luminescence. The diagram is a simplified representation of the wavefunctions
or orbitals occupied by electrons in a molecule as denoted by S0, S1, S2, and T1 which refer to the
singlet ground state, first excited state, second excited state, and triplet state, respectively.27 The
orbitals are positioned on a relative energy scale and as a function of the separation distance
between neighboring atomic nuclei. Since the overall energy of a molecule is the collective sum
of the contributions from electronic, vibrational, rotational, and translational energy, vibrational
energy levels of each electronic state are also illustrated and denoted by ν0 - ν5. Rotational energy
levels are in fact superimposed on each vibrational state but are omitted as the energy associated
with transitions between these levels is relatively small.
1.3.1.1 Absorption of Electromagnetic Radiation
Absorption of a photon by an atom or molecule, proceeds by promotion of an electron in the
highest occupied molecular orbital (HOMO) to the lowest unoccupied molecular orbital
(LUMO) in the atom or molecule. Absorption occurs when the energy of the incoming photon
matches the difference in energy between the HOMO and the LUMO; the energy of the photon
(Ephoton) is in resonance with the energy of the electronic transition.28 Absorption is shown in
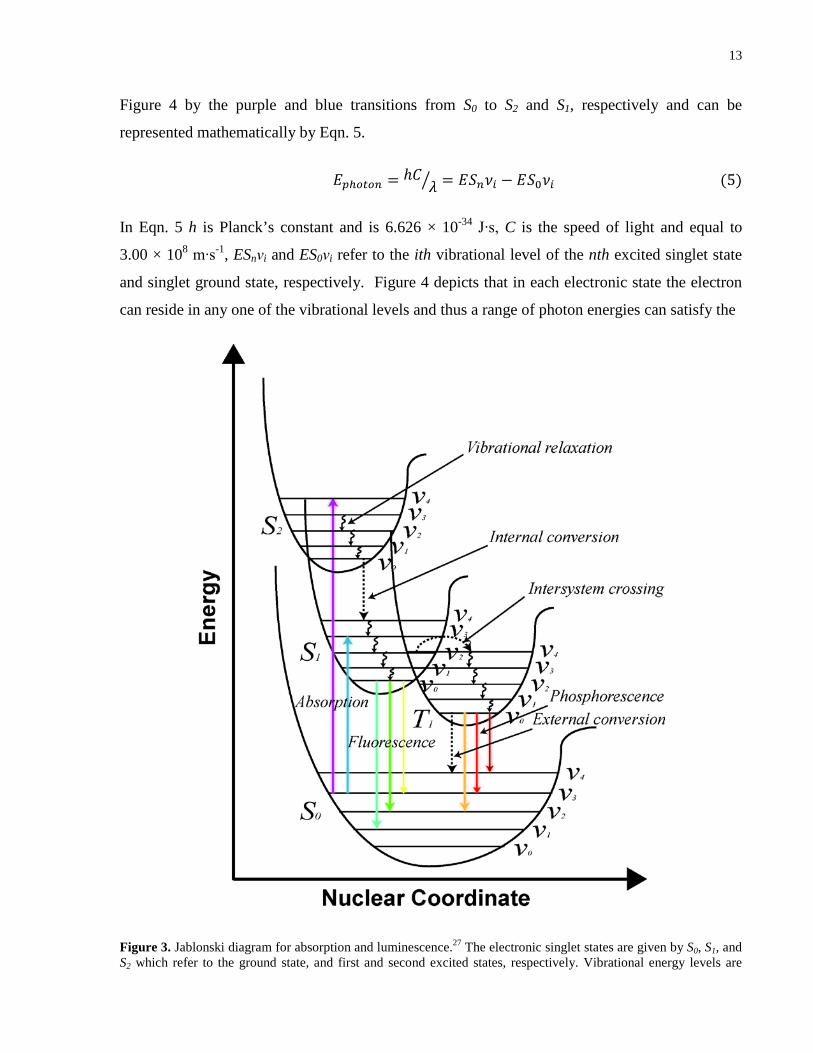
13
Figure 4 by the purple and blue transitions from S0 to S2 and S1, respectively and can be
represented mathematically by Eqn. 5.
𝐸𝑝ℎ𝑜𝑡𝑜𝑛 = ℎ𝐶𝜆� = 𝐸𝑆𝑛𝜈𝑖 − 𝐸𝑆0𝜈𝑖 (5)
In Eqn. 5 h is Planck’s constant and is 6.626 × 10⁻³⁴ J∙s, C is the speed of light and equal to
3.00 × 10⁸ m∙s-1, ESnνi and ES0νi refer to the ith vibrational level of the nth excited singlet state
and singlet ground state, respectively. Figure 4 depicts that in each electronic state the electron
can reside in any one of the vibrational levels and thus a range of photon energies can satisfy the
Figure 3. Jablonski diagram for absorption and luminescence.27 The electronic singlet states are given by S0, S1, and S2 which refer to the ground state, and first and second excited states, respectively. Vibrational energy levels are

14
superimposed in each electronic potential well as given by ν0 to ν5. The triplet state is given by T1, where the spin of the electron must first flip to enter this state given that overlap exists between the singlet vibrational levels and those of the triplet state. Electronic excitation of an electron from the ground state to one of the excited states is facilitated by resonance absorption of a photon which occurs in 10-15s. The electron can reside in any of the vibrational levels of either S1 or S2, where the electron rapidly (10-12s) decays by vibrational relaxation due to collision with solvent to lowest vibrational level of the electronic state. In addition to vibrational relaxation, other forms of nonradiative relaxation include internal and external conversion. In the case of the former, the mechanism is thought to be a result of overlap between vibrational energy levels of the excited state and ground state. The latter is due to collisions with adjacent molecules of sufficient energy to cause deactivation of the excited state. Fluorescence is defined as the radiative relaxation of the electron from the lowest vibrational level of the S1 to any of the vibrational levels of S0. The timescale of fluorescence ranges from 10-7 to 10-9 s and thus this is why vibrational relaxation processes dominate prior to radiative decay. The presence of heavy atoms such as halides can cause spin-orbit coupling interactions with the excited electron causing intersystem crossing of the electron into the triplet state. The radiative relaxation from the triplet state back to the ground singlet state is known as phosphorescence and occurs at a relatively slower rate compared to fluorescence (10-5 to 10 s) since the spin of the electron must first flip prior to relaxation.
resonance condition in Eqn. 5. While the electrons will mostly reside in the lowest vibrational
level of the ground state as described by the equilibrium bond length29, the population of
vibrational states is a function of the average available kinetic energy as described by Boltzmann
statistics. Discussion of molecular partition functions is beyond the scope of this chapter and the
average available kinetic energy to a molecule is often approximated by kT, where k is
Boltzmann’s constant and is equal to 1.38 × 10⁻²³ J∙k-1 and T is the temperature in Kelvin.
Electronic transitions are governed by quantum mechanical selection rules, where transitions that
result in a nonzero value of the transition dipole moment are allowed and the electric field of the
photon must be aligned with the transient dipole of the molecule.29 Electronic transitions also
result in changes to the vibrational and rotational states of the molecule. The change in the
vibrational state during a transition can be described using the Born-Oppenheimer approximation
– which states that since the proton is heavier than the electron by a factor of ca. 2000, the
charge of the electron moves quickly in response to slower nuclear harmonic motion. The
significant difference in time scales enables one to describe the wave function as two
components where one is dependent on the position of the electrons and the other on the position
of the nuclei.29 The wave function for the transition can then be expressed as a product of the
both electronic and vibrational contributions. The result is that for a transient dipole in the
molecule, an overlap exists between the vibrational wave functions of both the ground and
excited states. The magnitude of the square of the wave function in this notion represents the
probability vibrational-electronic transition. For this transient dipole, the magnitude of this
square is known as the Franck-Condon factor which is a quantitative measure of the intensity for
this transition as given by Eqn. 6.29
15
𝑆2 = ���𝜙𝑓𝑣𝑖𝑏𝑟𝑎𝑡𝑖𝑜𝑛𝑎𝑙� 𝜙𝑖𝑣𝑖𝑏𝑟𝑎𝑡𝑖𝑜𝑛𝑎𝑙𝑑𝜏�2
(6)
The wave function for the vibrational level of the excited and ground states are given by ϕf and
ϕi, respectively. Eqn. 6 describes the selection rule for vibrational transitions in electronic states
and is the basis for the Franck-Condon principle, which states that electronic transitions are
vertical lines on energy diagrams as a function of the relative distance between nuclei. As seen
by the Jablonski diagram in Figure 3, absorption is represented as a vertical transition since the
timescale of an electronic transition is much faster than nuclear motion where absorption takes
place on the order of 10-15 s.
The appearance of absorption spectra of molecules differs substantially from those of individual
component atoms as a result of vibrational fine structure in electronic transitions of molecules. In
atoms, only a few photons can satisfy the resonance condition for electronic transition due to the
absence of vibration where the energy of an atom of the summation of contributions from
translational and rotational energies. This results in absorption spectra with discrete, narrow
spectral line widths. For molecular absorption, spectra contain broad absorption bands from the
collective contributions of rotational and vibrational states and appear as a continuum across a
range of photon wavelengths. Since a molecule can contain many tens of atoms, a myriad of
rotational and translation energies can exist and effectively overlap in energy, this leads to the
continuous broad absorption profile with minimal vibrational fine structure.29 Absorption bands
of many polyatomic molecules typically exist in the UV-visible region of the electromagnetic
spectrum. This characteristic absorption window arises from the nature of the bonding in the
molecule where functional groups with delocalized electrons give rise to these transitions. Most
organic compounds that consist of planar, aromatic or polycyclic conjugated systems of
π electrons exhibit transitions in the UV-visible region. The functional groups of these organic
compounds which can include, alkenes, carbonyls, and or cyano structures that have similar
absorbance regions across different molecules are often termed chromophores.29 Rather than
referring to individual substituents, molecules that exhibit UV-Visible absorption are often
abbreviated as chromophores. As previously mentioned, electronic transitions take place from
the HOMO to the LUMO and for delocalized electrons in p or various sp hybridized orbitals,
these are often π-π* transitions from bonding to anti-bonding character. In anti-bonding orbitals,
16
electron density is shifted outside the equilibrium bond length and in some molecules radical
excited states can result. Additional transitions include σ-σ* which are higher energy and often
found in alkanes due to the lack of π-bonding.29
Absorption of incident photons by a chromophore can be related to its concentration in solution;
this is known as the Beer-Lambert law.28 The concentration dependence of absorption can be
described by considering a cuvette containing an absorbing molecule at concentration C. As light
with intensity P0 passes through the chromophore solution absorption proceeds over the width or
path length of the cuvette b where the intensity of the light is now reduced to P. Since the
transmittance of the light can be described as a relative ratio of the measured power against the
incident power on the cuvette, the transmittance can then be related to the absorbance A with a
logarithmic dependence as given by Eqn. 7.28
𝐴 = log𝑃0 𝑃� = 𝜀𝑏𝐶 (7)
A proportionality constant denoted by ε, is referred to as the molar absorptivity coefficient and is
a measure of the molecules ability to absorb at a given wavelength. Epsilon has units of
L∙mol-1∙cm-1 and thus the absorbance is a unitless measurement, although it is sometimes referred
to in units of optical density.28 The molar absorptivity is a combination of the transition
probability P and the cross-sectional area A in cm2 as shown by Eqn. 8.27
𝜀 = 8.7 × 10¹⁹𝑃𝐴 (8)
For many organic chromophores, ε ranges from 104-105 L∙mol-1∙cm-1 at the maximum
wavelength of absorption. These range of wavelengths are characteristic of allowed electronic
transitions where absorption coefficients less than two orders of magnitude lower are often
characteristic of forbidden transitions.27
1.3.1.2 Radiative and Nonradiative Relaxation Mechanisms
If the molecule resides at an excited state energy, many pathways exist to return the electron
back into a ground state orbital. The length of the excited state lifetime can range between
10-7-10-9 s for singlet excited state transitions. In the singlet excited state, the electron spin does
not change and rather remains paired with the additional electron in the ground state molecular
17
orbital. This is due to the Pauli exclusion principle which states that no two electrons may have
the same four quantum numbers.27 Figure 4 also shows that absorption can cause transitions into
the second excited singlet state and relaxation directly back to the ground state is often sidelined
by other efficient nonradiative relaxation processes. Vibrational relaxation is a form of
nonradiative decay that involves thermal equilibration of the molecule with surrounding solvent
and vibrational deactivation is a result of collision with these solvent molecules.26 The time scale
for vibrational relaxation is on the order of 10-12 s and occurs almost instantaneously in
comparison to the lifetime of the excited singlet state. Since transitions result in the electron
occupying any one of the vibrational states of the excited state, vibrational relaxation
immediately shifts the electron to the lowest vibrational energy level of the excited state.
Relaxation of the electron from this energy level to any one of the vibrational levels of the
ground state and produces the simultaneous emission of a photon is known as fluorescence.27
Fluorescence lifetimes are on the order of 10-8 s and are much longer lived than vibrational
deactivation.26 The resultant energy dissipated by vibrational relaxation causes longer
wavelength fluorescence emission where this bathochromic shift is commonly referred to as the
Stokes shift. Another form of nonradiative relaxation is the process of internal conversion which
returns the molecule to the ground state without any subsequent photon emission. While the
mechanisms are unclear, an intermolecular deactivation process is proposed.27 Internal
conversion is a probable pathway for relaxation when overlap exists between vibrational energy
levels of different excited states. For internal conversion from the excited state to the ground
state, the mechanism is still unknown but its existence is evident in chromophores that do not
fluoresce.27 External conversion as shown by the transition in Figure 4 from the excited triplet
state to the ground state is due to collision of the excited state molecule with solvent and other
adjacent molecules. Collisions are of sufficient energy to cause deactivation of the excited state,
where evidence of external conversion is marked by the influence of solvent on fluorescence.27
Also known as solvatochromism, depending on the nature of the solvent and the intermolecular
forces involved in solvation, solvent molecules can rearrange to stabilize the transient dipole.
Solvatochromic effects on fluorophores result in changes in the appearance of the emission
spectrum since the energetics of the excited state are influenced. The interested reader is referred
elsewhere for an in depth discussion on solvatochromic effects of fluorescence.26 For fluorescent
nanocrystals the effect is not as pronounced and mainly results in nonradiative relaxation of the
exciton. As mentioned previously, radical mediated excited states can also exist and often lead to
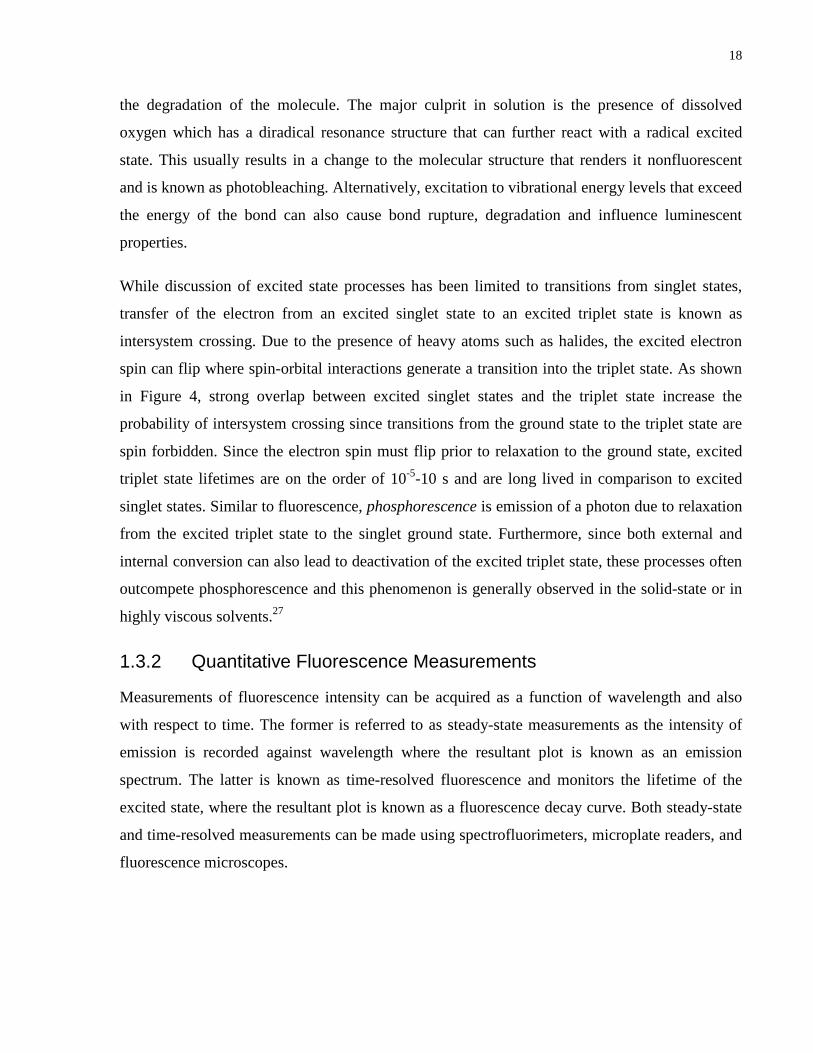
18
the degradation of the molecule. The major culprit in solution is the presence of dissolved
oxygen which has a diradical resonance structure that can further react with a radical excited
state. This usually results in a change to the molecular structure that renders it nonfluorescent
and is known as photobleaching. Alternatively, excitation to vibrational energy levels that exceed
the energy of the bond can also cause bond rupture, degradation and influence luminescent
properties.
While discussion of excited state processes has been limited to transitions from singlet states,
transfer of the electron from an excited singlet state to an excited triplet state is known as
intersystem crossing. Due to the presence of heavy atoms such as halides, the excited electron
spin can flip where spin-orbital interactions generate a transition into the triplet state. As shown
in Figure 4, strong overlap between excited singlet states and the triplet state increase the
probability of intersystem crossing since transitions from the ground state to the triplet state are
spin forbidden. Since the electron spin must flip prior to relaxation to the ground state, excited
triplet state lifetimes are on the order of 10-5-10 s and are long lived in comparison to excited
singlet states. Similar to fluorescence, phosphorescence is emission of a photon due to relaxation
from the excited triplet state to the singlet ground state. Furthermore, since both external and
internal conversion can also lead to deactivation of the excited triplet state, these processes often
outcompete phosphorescence and this phenomenon is generally observed in the solid-state or in
highly viscous solvents.27
1.3.2 Quantitative Fluorescence Measurements
Measurements of fluorescence intensity can be acquired as a function of wavelength and also
with respect to time. The former is referred to as steady-state measurements as the intensity of
emission is recorded against wavelength where the resultant plot is known as an emission
spectrum. The latter is known as time-resolved fluorescence and monitors the lifetime of the
excited state, where the resultant plot is known as a fluorescence decay curve. Both steady-state
and time-resolved measurements can be made using spectrofluorimeters, microplate readers, and
fluorescence microscopes.
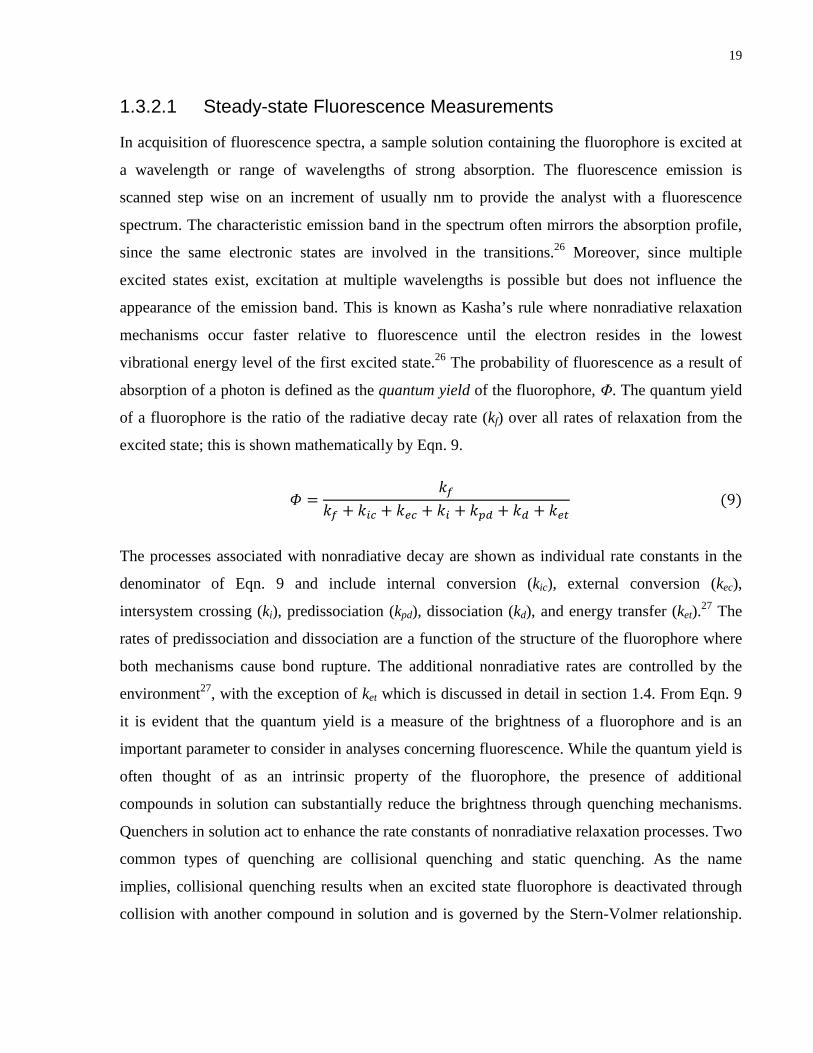
19
1.3.2.1 Steady-state Fluorescence Measurements
In acquisition of fluorescence spectra, a sample solution containing the fluorophore is excited at
a wavelength or range of wavelengths of strong absorption. The fluorescence emission is
scanned step wise on an increment of usually nm to provide the analyst with a fluorescence
spectrum. The characteristic emission band in the spectrum often mirrors the absorption profile,
since the same electronic states are involved in the transitions.26 Moreover, since multiple
excited states exist, excitation at multiple wavelengths is possible but does not influence the
appearance of the emission band. This is known as Kasha’s rule where nonradiative relaxation
mechanisms occur faster relative to fluorescence until the electron resides in the lowest
vibrational energy level of the first excited state.26 The probability of fluorescence as a result of
absorption of a photon is defined as the quantum yield of the fluorophore, Φ. The quantum yield
of a fluorophore is the ratio of the radiative decay rate (kf) over all rates of relaxation from the
excited state; this is shown mathematically by Eqn. 9.
𝛷 =𝑘𝑓
𝑘𝑓 + 𝑘𝑖𝑐 + 𝑘𝑒𝑐 + 𝑘𝑖 + 𝑘𝑝𝑑 + 𝑘𝑑 + 𝑘𝑒𝑡 (9)
The processes associated with nonradiative decay are shown as individual rate constants in the
denominator of Eqn. 9 and include internal conversion (kic), external conversion (kec),
intersystem crossing (ki), predissociation (kpd), dissociation (kd), and energy transfer (ket).27 The
rates of predissociation and dissociation are a function of the structure of the fluorophore where
both mechanisms cause bond rupture. The additional nonradiative rates are controlled by the
environment27, with the exception of ket which is discussed in detail in section 1.4. From Eqn. 9
it is evident that the quantum yield is a measure of the brightness of a fluorophore and is an
important parameter to consider in analyses concerning fluorescence. While the quantum yield is
often thought of as an intrinsic property of the fluorophore, the presence of additional
compounds in solution can substantially reduce the brightness through quenching mechanisms.
Quenchers in solution act to enhance the rate constants of nonradiative relaxation processes. Two
common types of quenching are collisional quenching and static quenching. As the name
implies, collisional quenching results when an excited state fluorophore is deactivated through
collision with another compound in solution and is governed by the Stern-Volmer relationship.

20
In static quenching, the fluorophore forms a nonfluorescent complex with a molecule that
immediately deactivates the excited state.26
Fluorescence emission can also be related to the concentration of the fluorophore in a manner
similar to absorption, and incorporates the Beer-Lambert law. The intensity of fluorescence (F)
is proportional to the incident power (P0) of excitation light as given by Eqn. 10.
𝐹 = 𝐾′(𝑃0 − 𝑃) (10)
The resultant light transmitted after excitation is given by P where the fluorescence intensity
emitted is determined by the quantum yield K’. Recalling that Beer’s law for absorption can be
written as a relative ratio of the intensity of incident and transmitted light through a known path
length, substitution into Eqn. 10 gives Eqn. 11. Expanding the exponential term in Eqn. 11 as
Maclaurin series gives rise to Eqn. 12.27
𝐹 = 𝐾′𝑃0(1 − 10𝜀𝑏𝐶) (11)
𝐹 = 2.3𝐾′𝜀𝑏𝐶𝑃0 (12)
In Eqn. 12, only the first term is considered after expansion of the Maclaurin series as the second
and third terms correspond to higher order two-photon and three-photon excitation. In
conventional fluorescence instruments, the probability of these excitation processes are low and
often require high frequency pulsed laser sources. Furthermore, dropping the high order terms
only introduces a relative error of 0.13%.27
1.3.2.2 Time-resolved Fluorescence Measurements
Measurements of fluorescence can also be done as a function of time after the initial excitation
process. Through time-resolved measurements the average time the fluorophore spends in the
excited state can be determined where this is known as the fluorescence lifetime.26 The
fluorescence lifetime (τ) is given by Eqn. 13, and is expressed as the inverse of the sum of the
rates of radiative and nonradiative relaxation.
𝜏 =1
𝑘𝑓 + ∑𝑘𝑛𝑟 (13)
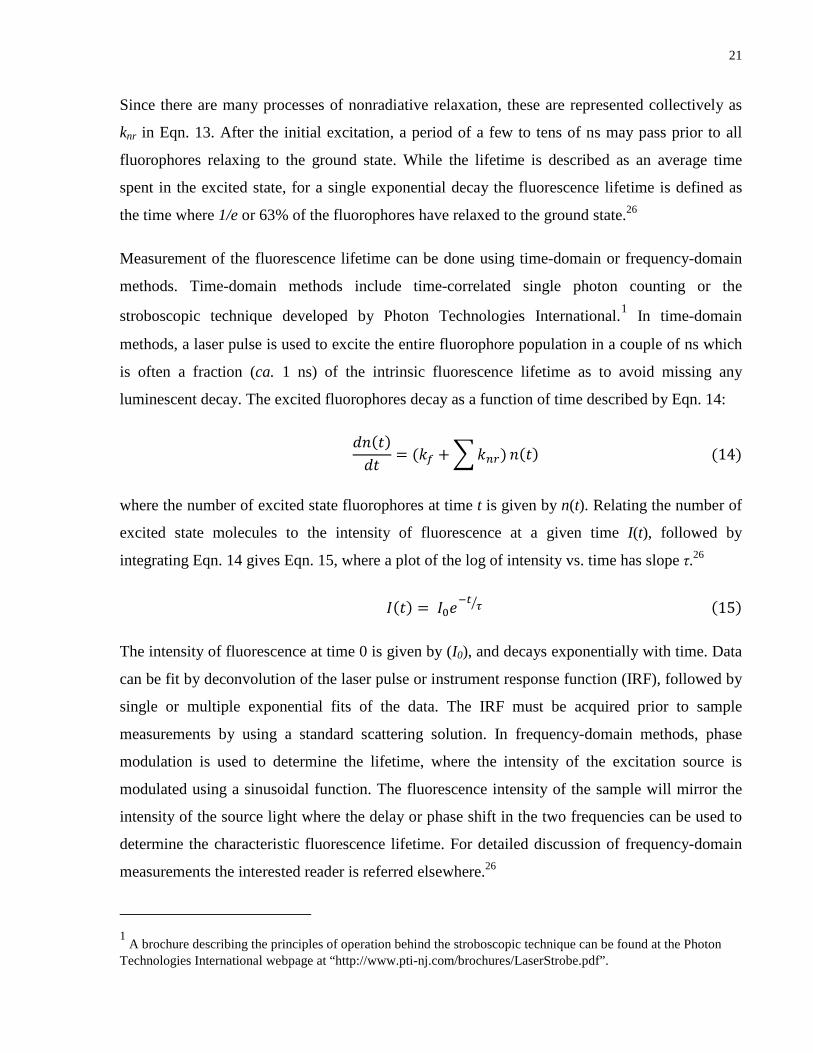
21
Since there are many processes of nonradiative relaxation, these are represented collectively as
knr in Eqn. 13. After the initial excitation, a period of a few to tens of ns may pass prior to all
fluorophores relaxing to the ground state. While the lifetime is described as an average time
spent in the excited state, for a single exponential decay the fluorescence lifetime is defined as
the time where 1/e or 63% of the fluorophores have relaxed to the ground state.26
Measurement of the fluorescence lifetime can be done using time-domain or frequency-domain
methods. Time-domain methods include time-correlated single photon counting or the
stroboscopic technique developed by Photon Technologies International.1 In time-domain
methods, a laser pulse is used to excite the entire fluorophore population in a couple of ns which
is often a fraction (ca. 1 ns) of the intrinsic fluorescence lifetime as to avoid missing any
luminescent decay. The excited fluorophores decay as a function of time described by Eqn. 14:
𝑑𝑛(𝑡)𝑑𝑡
= (𝑘𝑓 + �𝑘𝑛𝑟)𝑛(𝑡) (14)
where the number of excited state fluorophores at time t is given by n(t). Relating the number of
excited state molecules to the intensity of fluorescence at a given time I(t), followed by
integrating Eqn. 14 gives Eqn. 15, where a plot of the log of intensity vs. time has slope τ.26
𝐼(𝑡) = 𝐼0𝑒−𝑡 𝜏� (15)
The intensity of fluorescence at time 0 is given by (I0), and decays exponentially with time. Data
can be fit by deconvolution of the laser pulse or instrument response function (IRF), followed by
single or multiple exponential fits of the data. The IRF must be acquired prior to sample
measurements by using a standard scattering solution. In frequency-domain methods, phase
modulation is used to determine the lifetime, where the intensity of the excitation source is
modulated using a sinusoidal function. The fluorescence intensity of the sample will mirror the
intensity of the source light where the delay or phase shift in the two frequencies can be used to
determine the characteristic fluorescence lifetime. For detailed discussion of frequency-domain
measurements the interested reader is referred elsewhere.26
1 A brochure describing the principles of operation behind the stroboscopic technique can be found at the Photon Technologies International webpage at “http://www.pti-nj.com/brochures/LaserStrobe.pdf”.
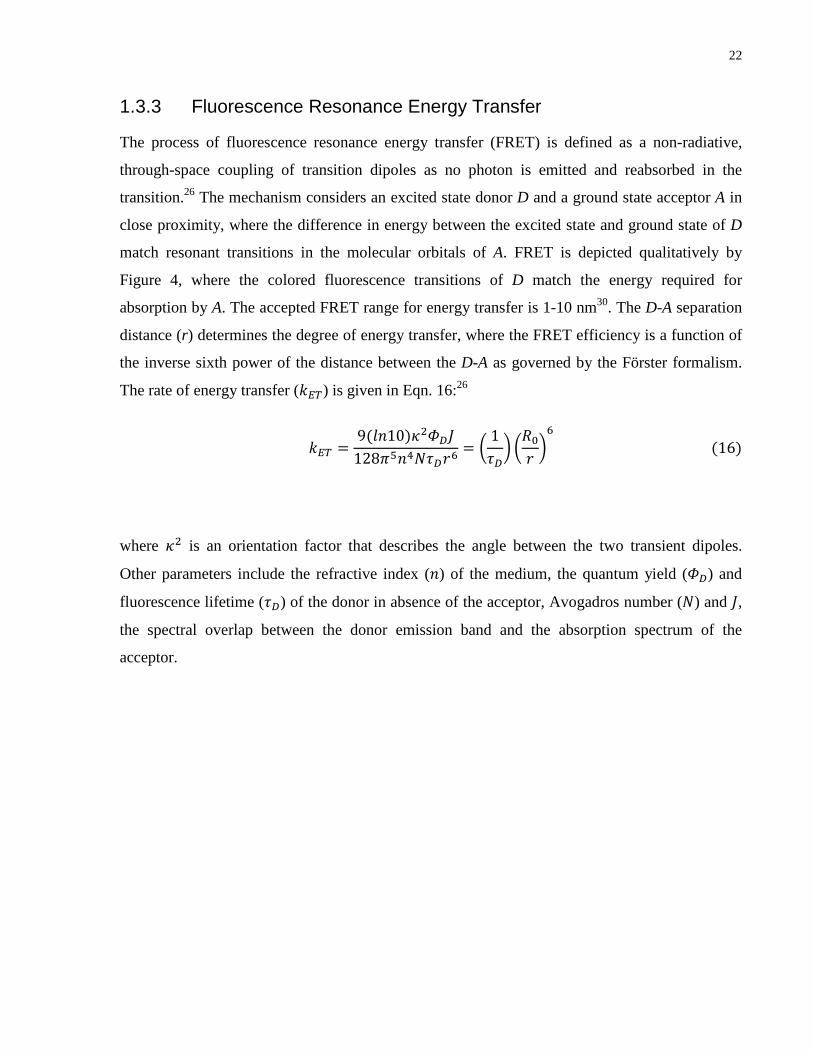
22
1.3.3 Fluorescence Resonance Energy Transfer
The process of fluorescence resonance energy transfer (FRET) is defined as a non-radiative,
through-space coupling of transition dipoles as no photon is emitted and reabsorbed in the
transition.26 The mechanism considers an excited state donor D and a ground state acceptor A in
close proximity, where the difference in energy between the excited state and ground state of D
match resonant transitions in the molecular orbitals of A. FRET is depicted qualitatively by
Figure 4, where the colored fluorescence transitions of D match the energy required for
absorption by A. The accepted FRET range for energy transfer is 1-10 nm30. The D-A separation
distance (r) determines the degree of energy transfer, where the FRET efficiency is a function of
the inverse sixth power of the distance between the D-A as governed by the Förster formalism.
The rate of energy transfer (𝑘𝐸𝑇) is given in Eqn. 16:26
𝑘𝐸𝑇 =9(𝑙𝑛10)𝜅2𝛷𝐷𝐽
128𝜋5𝑛4𝑁𝜏𝐷𝑟6= �
1𝜏𝐷� �𝑅0𝑟�6
(16)
where 𝜅2 is an orientation factor that describes the angle between the two transient dipoles.
Other parameters include the refractive index (𝑛) of the medium, the quantum yield (𝛷𝐷) and
fluorescence lifetime (𝜏𝐷) of the donor in absence of the acceptor, Avogadros number (𝑁) and 𝐽,
the spectral overlap between the donor emission band and the absorption spectrum of the
acceptor.
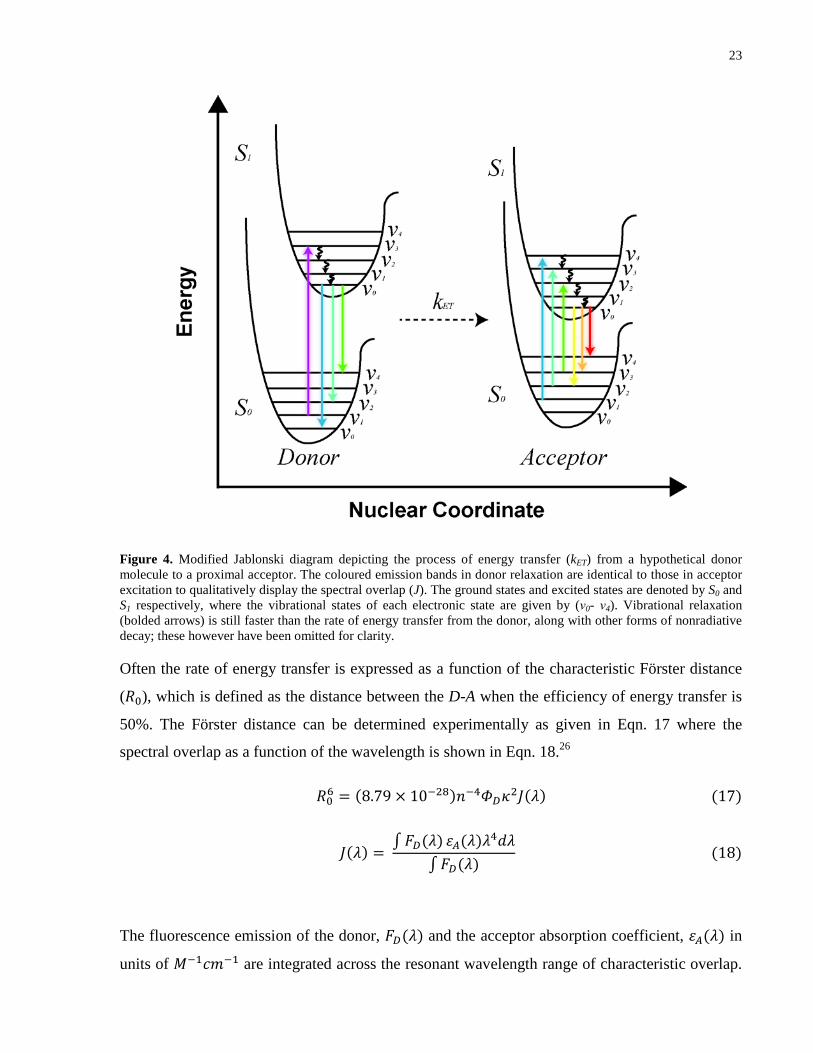
23
Figure 4. Modified Jablonski diagram depicting the process of energy transfer (kET) from a hypothetical donor molecule to a proximal acceptor. The coloured emission bands in donor relaxation are identical to those in acceptor excitation to qualitatively display the spectral overlap (J). The ground states and excited states are denoted by S0 and S1 respectively, where the vibrational states of each electronic state are given by (ν0- ν4). Vibrational relaxation (bolded arrows) is still faster than the rate of energy transfer from the donor, along with other forms of nonradiative decay; these however have been omitted for clarity.
Often the rate of energy transfer is expressed as a function of the characteristic Förster distance
(𝑅0), which is defined as the distance between the D-A when the efficiency of energy transfer is
50%. The Förster distance can be determined experimentally as given in Eqn. 17 where the
spectral overlap as a function of the wavelength is shown in Eqn. 18.26
𝑅06 = (8.79 × 10⁻²⁸)𝑛−4𝛷𝐷𝜅2𝐽(𝜆) (17)
𝐽(𝜆) = ∫𝐹𝐷(𝜆) 𝜀𝐴(𝜆)𝜆4𝑑𝜆
∫𝐹𝐷(𝜆) (18)
The fluorescence emission of the donor, 𝐹𝐷(𝜆) and the acceptor absorption coefficient, 𝜀𝐴(𝜆) in
units of 𝑀−1𝑐𝑚−1 are integrated across the resonant wavelength range of characteristic overlap.
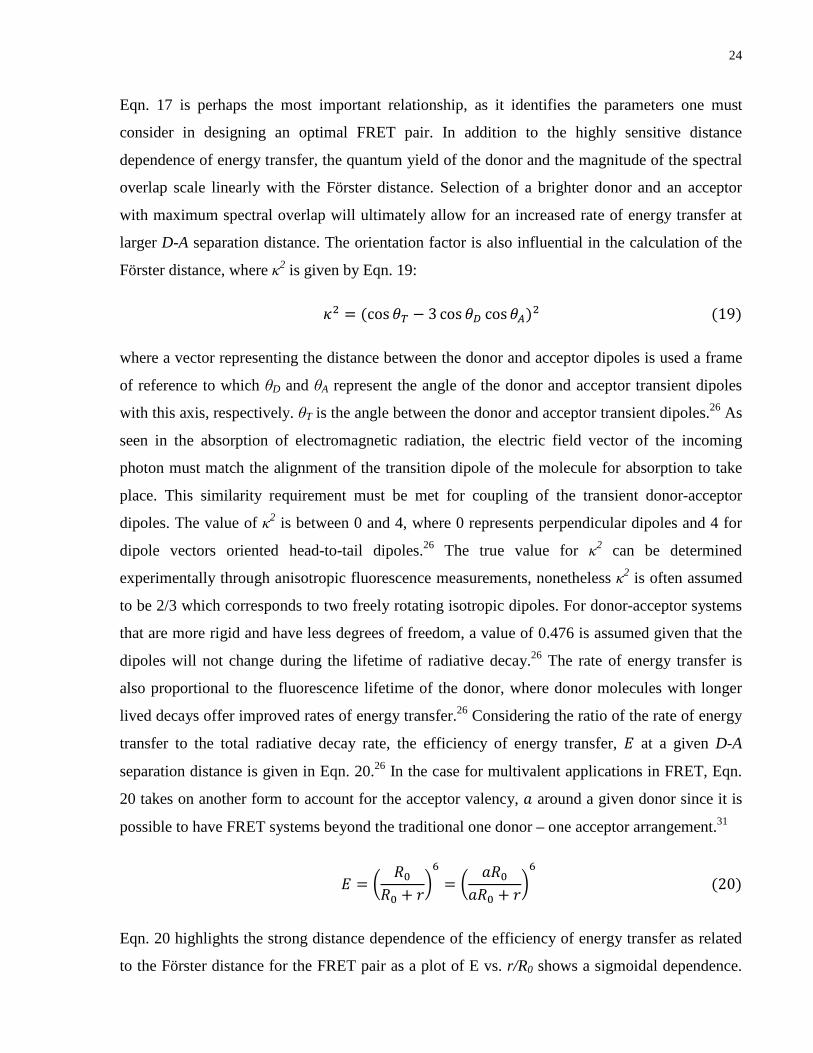
24
Eqn. 17 is perhaps the most important relationship, as it identifies the parameters one must
consider in designing an optimal FRET pair. In addition to the highly sensitive distance
dependence of energy transfer, the quantum yield of the donor and the magnitude of the spectral
overlap scale linearly with the Förster distance. Selection of a brighter donor and an acceptor
with maximum spectral overlap will ultimately allow for an increased rate of energy transfer at
larger D-A separation distance. The orientation factor is also influential in the calculation of the
Förster distance, where κ2 is given by Eqn. 19:
𝜅2 = (cos 𝜃𝑇 − 3 cos 𝜃𝐷 cos𝜃𝐴)2 (19)
where a vector representing the distance between the donor and acceptor dipoles is used a frame
of reference to which θD and θA represent the angle of the donor and acceptor transient dipoles
with this axis, respectively. θT is the angle between the donor and acceptor transient dipoles.26 As
seen in the absorption of electromagnetic radiation, the electric field vector of the incoming
photon must match the alignment of the transition dipole of the molecule for absorption to take
place. This similarity requirement must be met for coupling of the transient donor-acceptor
dipoles. The value of κ2 is between 0 and 4, where 0 represents perpendicular dipoles and 4 for
dipole vectors oriented head-to-tail dipoles.26 The true value for κ2 can be determined
experimentally through anisotropic fluorescence measurements, nonetheless κ2 is often assumed
to be 2/3 which corresponds to two freely rotating isotropic dipoles. For donor-acceptor systems
that are more rigid and have less degrees of freedom, a value of 0.476 is assumed given that the
dipoles will not change during the lifetime of radiative decay.26 The rate of energy transfer is
also proportional to the fluorescence lifetime of the donor, where donor molecules with longer
lived decays offer improved rates of energy transfer.26 Considering the ratio of the rate of energy
transfer to the total radiative decay rate, the efficiency of energy transfer, 𝐸 at a given D-A
separation distance is given in Eqn. 20.26 In the case for multivalent applications in FRET, Eqn.
20 takes on another form to account for the acceptor valency, 𝑎 around a given donor since it is
possible to have FRET systems beyond the traditional one donor – one acceptor arrangement.31
𝐸 = �𝑅0
𝑅0 + 𝑟�6
= �𝑎𝑅0
𝑎𝑅0 + 𝑟�6
(20)
Eqn. 20 highlights the strong distance dependence of the efficiency of energy transfer as related
to the Förster distance for the FRET pair as a plot of E vs. r/R0 shows a sigmoidal dependence.

25
When r < R0, efficiencies rapidly increase to unity where at 0.5R0, the FRET efficiency reaches
0.985. At r > R0, energy transfer efficiencies rapidly decrease to 0, where at 2R0 the efficiency is
0.015.26 As an increased number of acceptors are added around a single donor, more pathways
exist for energy transfer. The sigmoidal dependence in Eqn. 20 shifts toward higher FRET
efficiencies for larger ratios of r/R0.
FRET efficiencies can be determined through both steady state and time-resolved fluorescence
measurements. The former evaluates the change in magnitude of the donor emission spectrum,
while the latter investigates the change in the luminescent lifetime of the donor. This is shown
mathematically by Eqn. 2126:
𝐸 = 1 −𝐹𝐷𝐴𝐹𝐷
= 1 −𝜏𝐷𝐴𝜏𝐷
(21)
where the integrated fluorescence spectrum of the donor in the presence and absence of the
acceptor are given by FDA and FD, respectively. For time-resolved measurements the ratio of the
donor lifetime in the presence (τDA) and absence (τD) of the acceptor is used. In steady state
measurements, it may be necessary to first perform deconvolution on the FRET emission
spectrum if the acceptor is luminescent so as to ensure that only the donor emission band is being
integrated in Eqn. 21. For this reason, time-resolved fluorescence measurements offer a greater
convenience since the lifetime of the emission can be monitored at a single wavelength that can
be selected to minimize overlap or crosstalk from the acceptor luminescence band.
1.4 Semiconductor Quantum Dots Quantum dots (QDs) are semiconductor colloidal nanocrystals composed of 103-104 atoms and
are often referred to as artificial atoms. The discovery and emergence of QDs is highlighted in a
perspective in ACS Nano written by A. P. Alivisatos32, one of the major contributors toward the
discovery. In brief, over three decades ago L. Brus and S. Ijima at Bell Laboratories initiated
research that would shape the field of nanotechnology by introducing the carbon nanotube and
the colloidal QD. Continued work by Brus focused on controlling the size and shape distribution
of QDs and identifying suitable materials to provide for more stable nanocrystals. These goals
were realized when A. P. Alivisatos, M. G. Bawendi and M. Steigerwald joined the team.32
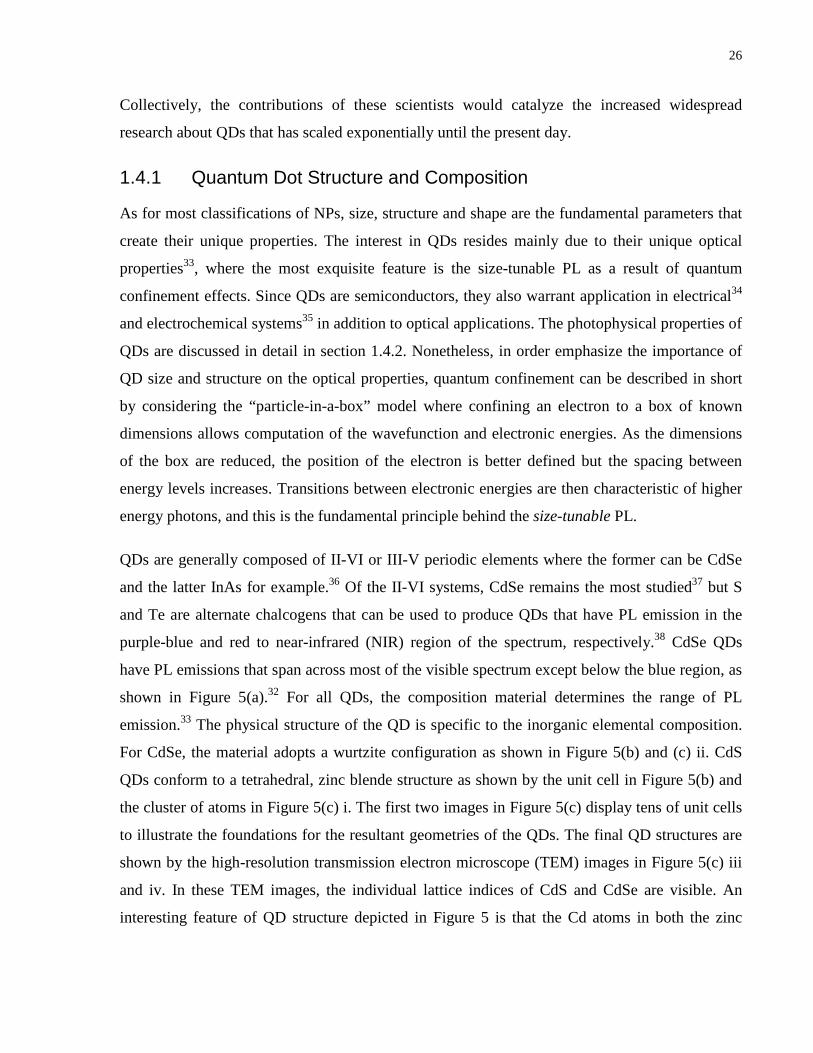
26
Collectively, the contributions of these scientists would catalyze the increased widespread
research about QDs that has scaled exponentially until the present day.
1.4.1 Quantum Dot Structure and Composition
As for most classifications of NPs, size, structure and shape are the fundamental parameters that
create their unique properties. The interest in QDs resides mainly due to their unique optical
properties33, where the most exquisite feature is the size-tunable PL as a result of quantum
confinement effects. Since QDs are semiconductors, they also warrant application in electrical34
and electrochemical systems35 in addition to optical applications. The photophysical properties of
QDs are discussed in detail in section 1.4.2. Nonetheless, in order emphasize the importance of
QD size and structure on the optical properties, quantum confinement can be described in short
by considering the “particle-in-a-box” model where confining an electron to a box of known
dimensions allows computation of the wavefunction and electronic energies. As the dimensions
of the box are reduced, the position of the electron is better defined but the spacing between
energy levels increases. Transitions between electronic energies are then characteristic of higher
energy photons, and this is the fundamental principle behind the size-tunable PL.
QDs are generally composed of II-VI or III-V periodic elements where the former can be CdSe
and the latter InAs for example.36 Of the II-VI systems, CdSe remains the most studied37 but S
and Te are alternate chalcogens that can be used to produce QDs that have PL emission in the
purple-blue and red to near-infrared (NIR) region of the spectrum, respectively.38 CdSe QDs
have PL emissions that span across most of the visible spectrum except below the blue region, as
shown in Figure 5(a).32 For all QDs, the composition material determines the range of PL
emission.33 The physical structure of the QD is specific to the inorganic elemental composition.
For CdSe, the material adopts a wurtzite configuration as shown in Figure 5(b) and (c) ii. CdS
QDs conform to a tetrahedral, zinc blende structure as shown by the unit cell in Figure 5(b) and
the cluster of atoms in Figure 5(c) i. The first two images in Figure 5(c) display tens of unit cells
to illustrate the foundations for the resultant geometries of the QDs. The final QD structures are
shown by the high-resolution transmission electron microscope (TEM) images in Figure 5(c) iii
and iv. In these TEM images, the individual lattice indices of CdS and CdSe are visible. An
interesting feature of QD structure depicted in Figure 5 is that the Cd atoms in both the zinc
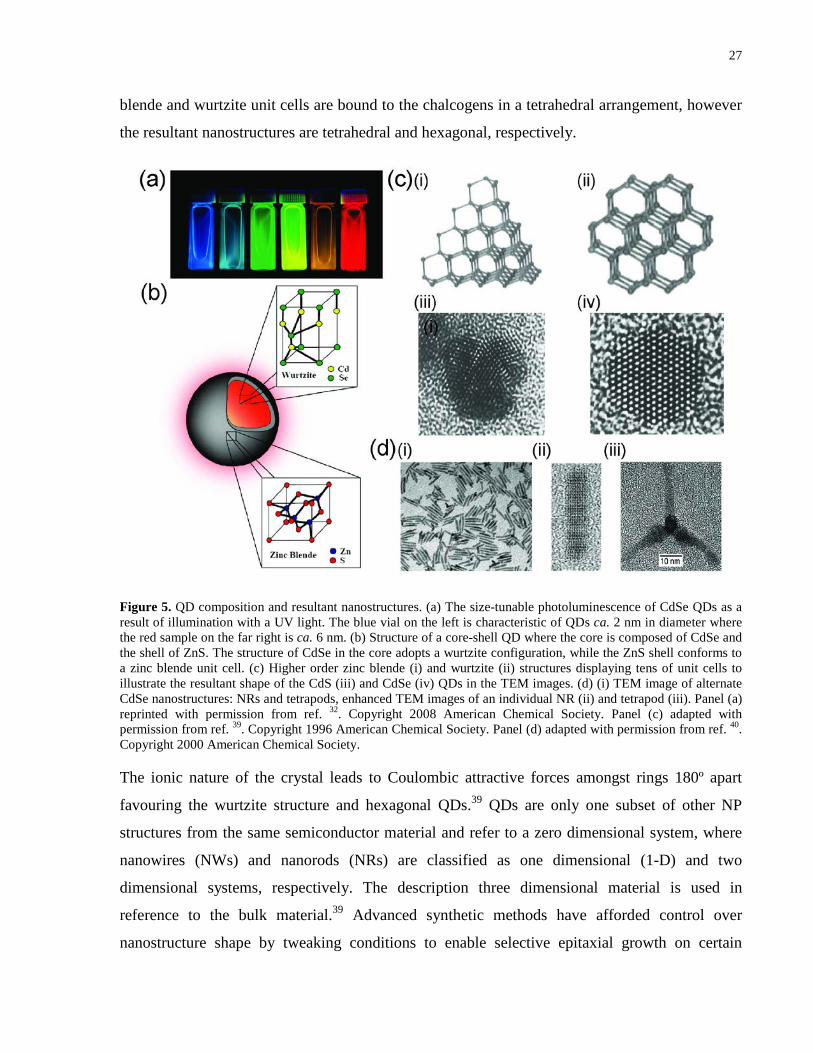
27
blende and wurtzite unit cells are bound to the chalcogens in a tetrahedral arrangement, however
the resultant nanostructures are tetrahedral and hexagonal, respectively.
Figure 5. QD composition and resultant nanostructures. (a) The size-tunable photoluminescence of CdSe QDs as a result of illumination with a UV light. The blue vial on the left is characteristic of QDs ca. 2 nm in diameter where the red sample on the far right is ca. 6 nm. (b) Structure of a core-shell QD where the core is composed of CdSe and the shell of ZnS. The structure of CdSe in the core adopts a wurtzite configuration, while the ZnS shell conforms to a zinc blende unit cell. (c) Higher order zinc blende (i) and wurtzite (ii) structures displaying tens of unit cells to illustrate the resultant shape of the CdS (iii) and CdSe (iv) QDs in the TEM images. (d) (i) TEM image of alternate CdSe nanostructures: NRs and tetrapods, enhanced TEM images of an individual NR (ii) and tetrapod (iii). Panel (a) reprinted with permission from ref. 32. Copyright 2008 American Chemical Society. Panel (c) adapted with permission from ref. 39. Copyright 1996 American Chemical Society. Panel (d) adapted with permission from ref. 40. Copyright 2000 American Chemical Society.
The ionic nature of the crystal leads to Coulombic attractive forces amongst rings 180º apart
favouring the wurtzite structure and hexagonal QDs.39 QDs are only one subset of other NP
structures from the same semiconductor material and refer to a zero dimensional system, where
nanowires (NWs) and nanorods (NRs) are classified as one dimensional (1-D) and two
dimensional systems, respectively. The description three dimensional material is used in
reference to the bulk material.39 Advanced synthetic methods have afforded control over
nanostructure shape by tweaking conditions to enable selective epitaxial growth on certain
28
crystal facets to produce NPs with high aspect ratios. The preferential binding of ligands to
specific facets has enabled differential growth kinetics to afford the synthesis of CdSe NWs,
NRs, and tetrapods as shown by Figure 5(d).40, 41 Discussion of QDs up to this point has only
introduced the idea of the QD being comprised of a single inorganic crystallite although the QD
structure shown in Figure 5(b) is a core-shell composite of CdSe and ZnS. While the chemistry
and size of the core nanocrystal is responsible for the unique optical properties of the QD,
encapsulation of the core with a shell of a similar material can act to passivate the core QDs from
oxidation and degradation. Furthermore, a shell material of higher bandgap energy acts to
confine the electronic wavefunction of the core and enhances the quantum yield of the
nanocrystal, where improvements of 5-fold in quantum yield have been reported.42 Criteria for
shell selection include minimizing mismatches in lattice parameters since the capping material is
forced to grow on facets of a crystal structure foreign to the bulk structure. For ZnS, the lattice
mismatch with CdSe is 12%, while that of ZnSe is 7%.37 CdS shells43 have also offered
passivation of the core, but for toxicity considerations the presence of Cd atoms at the QD
interface are of concern. Alternate QD compositions include ternary alloy QDs such as CdTeSe
which differ from binary nanocrystals in that luminescence is no longer controlled by size and
rather the ratio of Te to Se in the alloy. The composition based tuning of PL emission arises from
the principle that the effective exciton mass in the alloy is less than in the binary materials.44
Group VI materials such as C and Si have also been used in the synthesis of QDs.45, 46 While
these materials are likely less toxic due to composition, Si is an indirect bandgap semiconductor
with weak optical transitions in the bulk material since optical transitions are momentum
forbidden.47 Although quantum size effects improve the probability of transitions and enhance
luminescence, the fundamental nature of the semiconductor is still evident in the nanocrystal
structure.48
1.4.1.1 Synthesis of Quantum Dots
The protocol described herein is for the synthesis of CdSe core and CdSe/ZnS core-shell
nanocrystals, although experimental design is similar for all types of nanocrystals. The reaction
proceeds as a precipitation of the inorganic precursors at high temperature in coordinating
solvent. In the earliest reports of the synthesis of high quality QDs, dimethylcadmium and
selenium shot initiated the nucleation and the growth of the core nanocrystals via thermal
decomposition.37, 38, 42 These syntheses involved heating and degassing trioctylphosphine oxide
29
(TOPO) under an inert gas at ca. 300-320 ºC. Selenium shot is first dissolved in
trioctylphosphine (TOP) to form the TOPSe chalconide precursor followed by the simultaneous
injection of TOPSe and Cd(CH3)2 into the vigorously stirred hot matrix. At these temperatures,
the precursors decompose and cause a homogenous precipitation of CdSe seed crystals.38 The
temperature is maintained above 300 ºC to afford growth of the crystallites to the desired sizes.
The growth time is relatively short; on the order of seconds-to-minutes depending on the desired
size range of the QDs and the temperature of the reaction. The precipitation is initiated as a broad
distribution of different sized crystallites, where focusing of the population to a Gaussian
distribution takes place as the nanocrystals grow to larger sizes. For smaller sized CdSe
nanocrystals, distributions as measured by the full-width-at-half-maximum (FWHM) of the PL
emission band are ca. 30-35 nm while larger QDs have peak PL FWHM between 25-30 nm. The
focusing of size distributions as governed by the kinetics of the reaction have been described
elsewhere.49 In the growth phase of the reaction, smaller unstable nanocrystals join to form larger
crystallites. This phenomenon is known as Ostwald ripening and is in part responsible for the
narrowing of QD size distributions during the reaction.37 To obtain QDs with desired PL
emission, the reaction can be quenched one of two ways. Aliquots may be removed during the
growth phase at time intervals and immediately injected to a large volume of nonflammable
solvent such as chloroform. If the entire batch is desired for a single QD sample, then a copious
amount of cooled TOP can be injected into the reaction mixture to stop the crystallite growth. To
improve the size distributions of QD samples, size-selective precipitation techniques can be
integrated during core purification.38 Core QDs are often purified by centrifugation and stored in
toluene or butanol at 4 ºC. The pyrophoric nature of the Cd(CH3)2 carbene requires that synthetic
preparation be conducted under inert conditions and requires use of a glovebox. More recent
synthetic procedures have utilized more stable, oxidized forms of cadmium such as CdO and
cadmium acetylacetonate.50, 51 A typical procedure involved heating and degassing CdO in a
mixture of TOPO, hexadecylamine (HDA), and stearic or oleic acid under inert conditions. HDA
acts as an additional coordination ligand while stearic acid aids in dissolution of the CdO
crystals. The mixture is often degassed multiple times followed by purging with N2 or Ar until
the white opaque mixture becomes transparent. At this point the TOPSe is rapidly injected into
the Cd precursor to facilitation nucleation of the crystallites.50
30
The core CdSe QDs are capped with ZnS in a separate step although similar to the core
synthesis. Cores are initially synthesized with Cd in slight excess (1.3×) to afford Cd rich cores
that are primed initially with S to initiate ZnS shell growth. The formation of a CdS monolayer
prior to growth of a ZnS is in attempt to minimize the discontinuity between the core and shell
by minimizing the lattice mismatch between the two crystal (discussed in detail later). The CdSe
QDs dissolved in chloroform are dispensed into a solution of TOP/TOPO degassed in a three-
neck flask at temperatures greater than 150 ºC. Shell precursors include diethylzinc and
hexamethyldisilathiane (TMS-S) which are first dissolved in TOP and then mixed together. The
precursor mixture is then added drop wise with vigorous stirring to the dispersed solutions of
core QDs. The temperature is maintained at ca. 200 ºC to afford annealing of the shell precursors
to the cores while maintaining a steady but slow addition so as to not begin precipitation of ZnS
QDs. After addition of the shell precursor solutions, the mixture is further stirred overnight to
afford homogenous shell coating.37 Alternate routes for shell formation include one pot
synthesis, where core QD growth is quenched by injection of cold TOP followed by equilibration
of the solution temperature to ca. 250 ºC. The Zn and S precursors are then injected drop wise
and in sequential aliquots to avoid precipitation of ZnS QDs at the higher temperature.42 Both
routes are viable and have reported the synthesis of highly luminescent CdSe/ZnS QDs. As
described earlier shell structures are melded to those of the core regardless of the preferred unit
cell. Shells are also grown with Zn in slight excess (1.2×) to afford coordination of the
stabilization ligands. The long aliphatic carbon chains of the coordination solvent prevent
nanocrystal aggregation in nonpolar media by steric occlusion. In a comprehensive study by
Dabbousi et al.37 1.4 atomic layers of ZnS afforded the strongest luminescent CdSe/ZnS core-
shell QDs. Incomplete atomic layers often results from the nucleation of the shell material as
islands on the nanocrystal interface and often causes inhomogeneous growth of the shell around
the core. Additional growth of shell resulted in decreased PL intensities as the ZnS begins to
grow with bulk lattice parameters. Incoherent growth of ZnS around the CdSe core results at
increased shell thickness, leading to strain induced dislocations in the structure that afford
nonradiative recombination of the exciton.37 Alloyed QDs with a gradient transition to pure shell
materials have alleviated the detrimental effects to QD PL from thick shells by minimizing
lattice mismatches.52 To determine the concentration of QDs in the synthesized sample, a study
by the Peng group investigated the scaling of the position of first absorption peak with the size of
the QD.53 In this work, the molar extinction coefficients were determined by fitting the energy of

31
the bandgap as described by the first exciton peak with the diameter of the nanocrystal to a
power function.53
1.4.2 Photophysics of Quantum Dots
For most NPs, the characteristic size, shape, and structure define the unique physical properties.
Of these parameters it is predominantly the size-scale of QDs that enables quantum confinement
effects to govern the intrinsic size-tunable PL that has afforded the integration of QDs into many
optical applications. To understand the fundamental principles of QD photophysics, it is
necessary to first introduce the concept of bonding in metals and semiconductor materials.
1.4.2.1 Band Theory in Metals
The term band theory refers to the bonding in bulk metals where the molecular orbitals are
described as continuous bands. The origin of bands can be explained by considering a 1-D solid
of an infinite line of bonded atoms.54 Considering that each atom has a single S orbital available
for bonding, the joining of two atoms by a single bond creates one bonding and one antibonding
molecular orbital. Considering a bonded sequence of N atoms, N molecular orbitals are created
where the bonding orbitals reside at a lower energy than the antibonding orbitals. While the
molecular orbitals appear as a continuous band, they exist as N individual orbitals where the
energy spacing between neighboring orbitals is infinitely small. For transition metals and
elements with P orbitals, both an S band and P band exist, where the energy difference between
the two bands is known as the band-gap. For most metals, the P band is also continuous and is
the origin of conductivity.54 The S band and P band are often referred to as the valence band and
conduction band, respectively.
In the description of conductors, semiconductors, and insulators it is the positions of bands and
the relative occupancy of electrons in each band that determine the level of conductivity in the
material. Considering an alkali metal where each atom contributes one bonding electron, N
electrons will occupy the aforementioned bands. The occupancy of electrons is temperature
dependent, where at 0 K the electrons will reside in ½N molecular orbitals because electrons are
Fermions and cannot all reside in the lowest energy level. For such a system, the HOMO is often
referred to as the Fermi level. As the temperature is increased, thermal energy is transferred to
the systems and electrons can be excited to higher energy levels, specifically those that reside in

32
the Fermi level as they are the most mobile. The population, P of the molecular orbitals by
electrons is described by the Fermi-Dirac distribution (Eqn. 22), which is a modified form of the
Boltzmann distribution that takes into account the Pauli Exclusion Principle.54
𝑃 =1
�𝑒𝐸−𝜇𝑘𝐵𝑇 − 1�
(22)
In Eqn. 22, E and µ, represent energy and chemical potential, respectively, where the latter is
equal to the energy at P = 0.5, kB is the Boltzmann constant and T is the temperature in Kelvin.
The distribution resembles an exponential decay with increasing energy, where increasing the
temperature shifts the distribution to higher energy levels with a larger exponential tail.54 For a
conductor, overlap between the conduction and valence band exists with the Fermi level residing
at a position between the areas of overlap. As a consequence of the overlap and position of the
Fermi level, the available energy as described by kBT is sufficient to promote electrons into the
continuum of molecular orbitals of the conduction band and is the nature of electrical
conductivity in most metals. For an insulator or dielectric material, the Fermi level resides in the
valence band and the bandgap energy is significantly larger compared to kBT and prevents
transitions of electrons into the conduction band. In semiconductors, the Fermi level is
positioned between the valence band and conduction band where the energy difference between
the conduction band and the Fermi level is small compared to kBT. As the temperature is
increased, the tail-end of the Fermi-Dirac distribution extends across the band-gap where
electrons populate the conduction band and holes are left in the valence band. It is the mobility of
the electrons and holes that provide for conductivity in a semiconductor.54
1.4.2.2 Quantum Confinement
The size-tunable PL exhibited by QDs is due to quantum confinement effects that dominate as a
result of NP size scale and the intrinsic spacing of energy levels. Confinement effects become
prominent when the radius of the NP is on the order of the characteristic Bohr-exciton radius for
the material, which is the preferred separation distance of the electron-hole pair or exciton; for
CdSe this is ca. 5.6 nm.55 The discreteness of energy levels of clusters on the order of 103-104
atoms lies intermediate between that of the bulk and atomic limits as shown in Figure 6.39 For
nanostructures of these size dimensions, the interior molecular composition is similar to the bulk
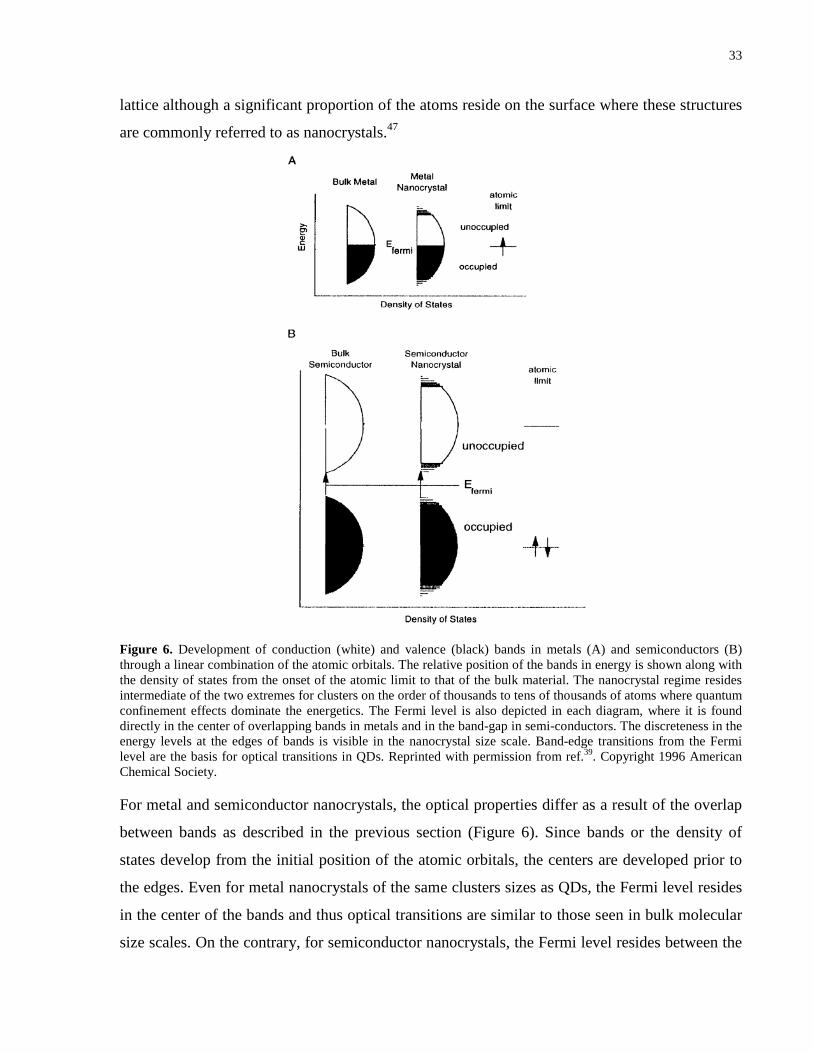
33
lattice although a significant proportion of the atoms reside on the surface where these structures
are commonly referred to as nanocrystals.47
Figure 6. Development of conduction (white) and valence (black) bands in metals (A) and semiconductors (B) through a linear combination of the atomic orbitals. The relative position of the bands in energy is shown along with the density of states from the onset of the atomic limit to that of the bulk material. The nanocrystal regime resides intermediate of the two extremes for clusters on the order of thousands to tens of thousands of atoms where quantum confinement effects dominate the energetics. The Fermi level is also depicted in each diagram, where it is found directly in the center of overlapping bands in metals and in the band-gap in semi-conductors. The discreteness in the energy levels at the edges of bands is visible in the nanocrystal size scale. Band-edge transitions from the Fermi level are the basis for optical transitions in QDs. Reprinted with permission from ref.39. Copyright 1996 American Chemical Society.
For metal and semiconductor nanocrystals, the optical properties differ as a result of the overlap
between bands as described in the previous section (Figure 6). Since bands or the density of
states develop from the initial position of the atomic orbitals, the centers are developed prior to
the edges. Even for metal nanocrystals of the same clusters sizes as QDs, the Fermi level resides
in the center of the bands and thus optical transitions are similar to those seen in bulk molecular
size scales. On the contrary, for semiconductor nanocrystals, the Fermi level resides between the
34
valence band and conduction band, where optical transitions across the band-gap are referred to
as band-edge transitions. As the size of the nanocrystal increases, bands become wider and the
energy of resonant transitions across the band-gap decreases.39 As the size of the cluster
approaches quantum confined regimes, the band-gap energy dramatically changes, where for
CdSe QDs the band gap energy can vary from 2.4 eV to 1.7 eV, where resonant transitions are
characteristic of green and red photons, respectively. Furthermore, smaller sized nanocrystals
have high oscillator strength as a result of less developed band edges as described by the
relationship between position (x) and momentum (p) as given by Eqn. 23.
∆𝑝∆𝑥 ≥ ħ2� (23)
Considering free vs. confined particles in a crystal material, the energy of the free particle and
the crystal momentum (ħk) can be described, where ħ is equal to Planck’s constant over 2π.
However, the position of this free particle is uncertain. As the size of the nanocrystal decreases,
the particle becomes confined and more is known about position. At the same time, the energy
may still be known but the uncertainty in momentum has now increased substantially. A
superposition of bulk wavevector (k) states is used to describe the energy of the system where the
relationship between energy and momentum can be explained as a first approximation by
considering the quadratic dependence of energy on k (Eqn. 24).39 In Eqn. 24 m, is the effective
mass or reduced mass of the electron which is inversely proportional to the width of the band.39
𝐸 = ħ𝑘2
2𝑚� (24)
From these relationships, the energy dependence on band width or the size of the crystallite
scales as 1/r2 as described by the particle-in-the-sphere model where r, is the radius of the
nanocrystal which is approximated as a sphere.39, 55 This description is sufficient for larger QDs
but the model breaks down in describing smaller QDs.39 For smaller nanocrystals it is necessary
to consider the tight binding model that is used to describe the self-assembly of atoms in
crystallites, the electron eigenvalues describing the energy as a function of k is given by Eqn.
25,39, 56 where k = 2π/λ and α is the energy associated with the linear combination of atomic
orbitals and β is the width of the resultant band.
𝐸 = 𝛼 + 2𝛽 cos(𝑘𝑎) (25)
35
The distance between neighbouring atoms in the linear chain is given by a. For discrete
eigenvalues in nanocrystals, the wavevectors have nodes at the ends of the crystal. For high
energy molecular orbitals, more nodes exist within the crystal and can reside on atomic nuclei.
The wavefunctions of the electron are essentially standing waves where the electron
simultaneously senses both ends of the nanocrystal.56
1.4.2.3 Optical Transitions in the Bandgap of CdSe Quantum Dots
The relationship between the energy of molecular orbitals and nanocrystal size clearly illustrates
how quantum confinement effects provide for the size-tuneable PL seen in QDs. Nonetheless to
explain the specific energy of transitions seen in both the absorption and PL spectra of CdSe
QDs, it necessary to describe the formation of the CdSe band gap from the atomic molecular
orbitals. For CdSe the LUMO consists of Cd 5s atomic orbitals (conduction band) and the
HOMO is comprised of Se 4p orbitals (valence band) that are 3-fold spatially degenerate.55 The
transitions across the bandgap consider both the wave functions of the electron (e) and hole (h).
In this description, only the total angular momentum J, where J = L + S (orbital + spin) is
considered a good description of the molecular orbitals when the total Hamiltonian of the hole is
used.56 Furthermore, the strong spin-orbit coupling in CdSe and the crystal field splitting from
the wurtzite unit cell splits the Se 4p HOMO.55 While the band gap energy associated with the
first excitonic transition can be described using Eqn. 24, it is insufficient in explaining the
additional absorption shoulders seen throughout the spectrum and the excitation independent
Stokes shift and PL emission. Further splitting of the HOMO levels is due to the e-h exchange or
“mixing” of the wavefunctions. The quantum confined wavefunction of the exciton is shown by
Eqn. 26:
𝐸(𝑟) = 𝐸𝑏 +ħ2𝜋2
2𝑟2�
1𝑚𝑒
+1𝑚ℎ
� −1.8𝑒2
𝜀∞𝑟 (26)
where the band gap energy of the bulk material is given by Eb and me and mh are the masses of
the electron and hole, respectively, and ε is the dielectric constant of the material.56 In Eqn. 26
the Coulombic interactions between the electron and hole are considered, where in confined
nanocrystals the overlap between wavefunctions increases as a function of decreasing r. The
splitting of the valence band is shown in Figure 7(a). These transitions are collectively referred to
as the exciton fine structure of the band-edge transition. The band-edge absorption is the lowest
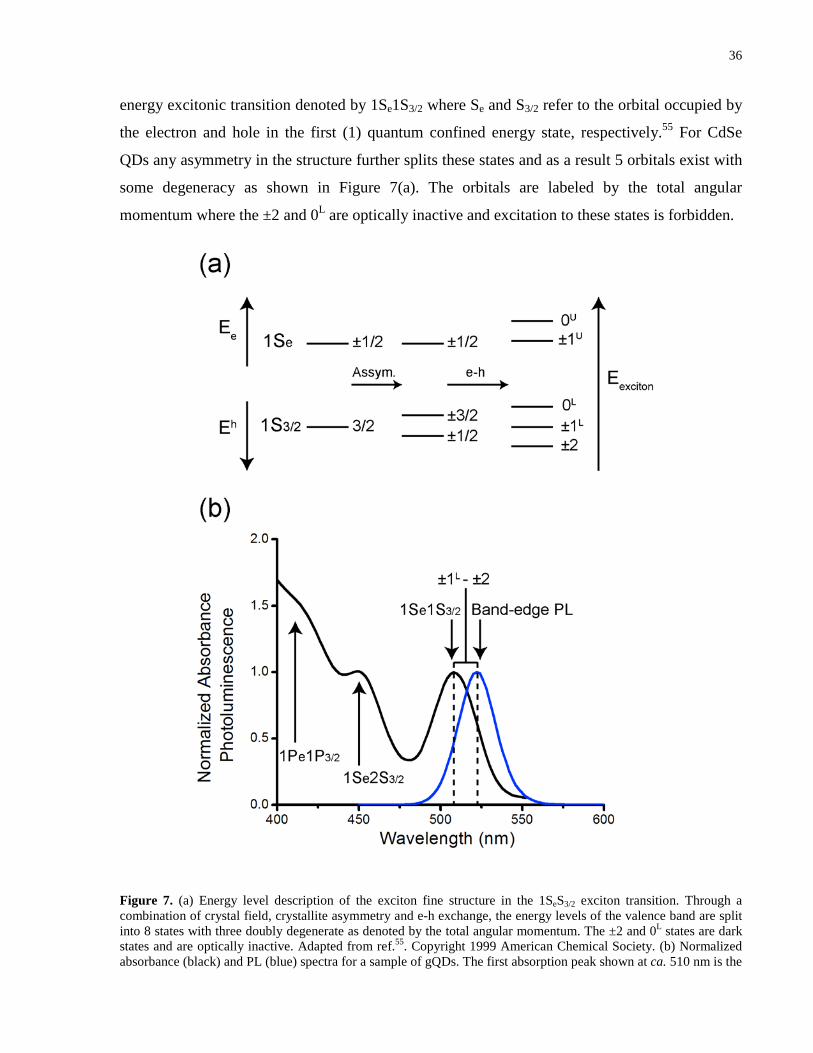
36
energy excitonic transition denoted by 1Se1S3/2 where Se and S3/2 refer to the orbital occupied by
the electron and hole in the first (1) quantum confined energy state, respectively.55 For CdSe
QDs any asymmetry in the structure further splits these states and as a result 5 orbitals exist with
some degeneracy as shown in Figure 7(a). The orbitals are labeled by the total angular
momentum where the ±2 and 0L are optically inactive and excitation to these states is forbidden.
Figure 7. (a) Energy level description of the exciton fine structure in the 1SeS3/2 exciton transition. Through a combination of crystal field, crystallite asymmetry and e-h exchange, the energy levels of the valence band are split into 8 states with three doubly degenerate as denoted by the total angular momentum. The ±2 and 0L states are dark states and are optically inactive. Adapted from ref.55. Copyright 1999 American Chemical Society. (b) Normalized absorbance (black) and PL (blue) spectra for a sample of gQDs. The first absorption peak shown at ca. 510 nm is the
37
1Se1S3/2 transition and is also referred to as the first exciton peak. Additional absorption shoulders are visible at ca. 450 nm and 415 nm and correspond to higher order 1Se2S3/2 and 1Pe2P3/2 transitions, respectively. The Gaussian band-edge PL is shown at 525 nm where the band width is characteristic of the size distribution of nanocrystals in the sample. The well-defined Stokes shift between the first absorption peak and the band-edge PL is a result of phonon mediated relaxation of the exciton from the ±1L to the ±2 dark state followed by subsequent PL from electron-hole recombination.
The U and L superscripts indicate upper and lower energy orbitals, respectively.57 Transitions
through band-edge excitation cause occupancy of the ±1 which is the predominant optically
active excitonic state.55 Recall that in discussion of molecular fluorescence, the Stokes shift
results from efficient vibrational relaxation after excitation and the appearance of the
fluorescence spectrum is independent of the excitation wavelength. For optical transitions in
QDs, similar vibrational deactivation takes place and is attributed to longitudinal optical (LO)
phonons; quantized vibrations in the crystal lattice.57 Furthermore, the PL emission is a result of
a population of different sized nanocrystals with distinct band gap energies. In experiments
probing the resonant PL Stokes shift, QDs were excited on the red end of the first exciton
transition and exhibited narrow PL emission at 10 K.57 A Stokes shift of the zero LO phonon line
was observed. The exciton fine structure and the splitting of energy levels in the valence band
sufficiently explained this phenomenon. While the ±1L optically active resonant transition was
excited, thermal relaxation of the exciton to the dark ±2 state accounts for the Stokes shift seen in
the QD PL from the first absorption peak. Furthermore, luminescence from the ±2 state proceeds
through phonon based electron-hole recombination or a spin-flip relaxation mechanism.57
Moreover, the Stokes shift is also size-dependent, and increases with decreasing QD size even at
excitation wavelengths higher in energy that the first absorption peak. Stokes shifts have ranged
between ca. 100 meV to 25 meV for small to large CdSe QDs and the explanation is two-fold.
Firstly, the probability for an optical transition is directly proportional to the nanocrystal volume
where the larger crystallites have higher excitation probability. The resulting PL emission
maximum is dominated by this region of the nanocrystal distribution and since the band gap
energy of these particles of the ensemble is relatively lower, a distribution based Stokes shift is
inevitable. Secondly, the confinement induced mixing of energy levels in the valence band
results in concentration of oscillator strength in the higher optically allowed transitions. This
stems from the superposition of bulk k states in the quantum confined regime. For smaller
nanocrystals, the exciton fine structure reduces to the higher energy bright states. Phonon
mediated relaxation returns the exciton to the dark state followed by subsequent PL emission.
The difference in energy between the higher bright state and the dark state is relatively larger and
38
translates into a more pronounced Stokes shift for smaller QDs.57 In the blue end of the
excitation spectrum shown in Fig. 8 (b), additional absorption shoulders are present and are
referred to as the subsequent second and third exciton peaks. These distinct features are
characteristic of the excitonic transitions 1Se2S3/2 and 1Pe1P3/2, listed in order of increasing
energy.58 Additional excitonic transitions can be seen in the full absorption spectrum with
increasing ε until ca. 300 nm, although these are less pronounced for smaller QDs as a result of
higher oscillator strength; for detailed discussion the reader is referred elsewhere.58 It is
important to note that the k states throughout the CdSe nanocrystal are all in phase as the dipoles
from each individual unit cell are aligned. Since the wavelength of the incident photon is much
larger than the nanocrystal dimensions, it causes alignment of all transition dipoles such that the
overall excitation process has no change in k; this is referred to as a direct band gap material.39
Recall that the width of the PL band of QDs is an indication of the polydispersity in the sample.
While the PL emission can be modeled by a Gaussian distribution it is sometimes asymmetric or
tailed depending on the kinetics during the synthesis. As in molecular fluorescence, the PL
emission band has an intrinsic line width and considering the single molecule spectroscopy of
QDs, the FWHM is ca. 13 nm.59 Luminescence in QDs has been suggested to occur from the ±2
dark state after phonon mediated relaxations within bands and the radiative recombination of the
exciton was thought to be influenced by the surface of the nanocrystal. Radiative relaxation was
confirmed to be independent of the surface ligands and evidence for this theoretically and
experimentally was described in a study by Kuno et al.60 Since transitions from the dark exciton
ground state are dipole forbidden this can describe the longer PL lifetime seen in QDs where
recombination from the optically active states is ca. 100 times faster.60 Despite changing surface
ligand composition, no direct effect on the electron-hole recombination mechanism was noted,
and it was concluded that an internal exciton mediated relaxation explained the band-edge PL
emission. Moreover it was noted that surface defect sites in the crystal enhanced nonradiative
relaxation rates and resulted in band gap emission.60 Band gap emission is characteristic of a
broad PL peak that is bathochromic relative to the band-edge PL. Defect sites at the surface of
the nanocrystal result in orbitals of energy intermediate of that of the band gap energy where
radiative recombination of the electron-hole at these states cause this broad red shifted PL
emission to appear.
39
The above discussion of optical transitions has been tailored to core CdSe QDs. While as a first
approximation the quantum confined k states are said to have nodes at the surface of the
nanocrystal, this applies only for a particle confined to a box with an infinite potential well. For
QDs the appropriate model considers a particle inside a box with barriers of finite potential.
Computing the expected Hamiltonian for this system reveals that a small percentage of the
wavefunction lies outside the box as the electron effectively can tunnel through the barrier.
Considering the probability distribution of finding the electron outside the box, the percentage
decreases with an increasing energy barrier.29 The resultant implications on QD PL are negative
as the exciton can sample the nanocrystal interface, enhancing nonradiative or unfavorable
radiative decay rates. These principles illustrate how a few atomic layers of a material of higher
band gap (e.g. ZnS) results in improvement of the rate of band-edge PL by confining the exciton
in the core of QD. Furthermore, the shell also protects the core from oxidation and or
degradation by chemical agents which can also introduce defect sites into the crystallites as to
create “trap” states that promote nonradiative relaxation of the exciton. While cores can be
isolated without defect sites introduced from the synthesis, to preserve the integrity of the core
structure it is critical that the QDs are capped immediately to prevent degradation. Shell
passivation also does not influence the mechanisms of radiative electron-hole recombination but
the chemistry of the shell and the intrinsic band gap has consequences on the location of the
exciton within the nanocrystal. The chemistry and energetics of CdSe/ZnS renders them as type I
QDs. In type 1 QDs the band gap energies between the core and shell have the valence band and
conduction band of the core material residing between the valence band and conduction band of
the shell. For type II QDs, the differences in band gap energy are offset between the core and the
shell, where the valence and conduction bands of the core material are shifted higher or lower in
energy than those of the shell. Exciton confinement is different in these materials where each
charge carrier is localized to either the core or shell.61 The reduced confinement of the exciton
allows for tuned emission well into the NIR region.62
1.4.3 Quantum Dot Coatings and Bioconjugation
The impact of QDs in nanotechnology, and in bioanalytical analyses, could not have been
realized without functional coatings to provide water solubility. The first translation of QDs from
hydrophobic media into aqueous buffers utilized mercapto-alkyl carboxylic acid ligands.63 The
bifunctional nature of these ligands provided water solubility through chelation of the native Zn
40
atoms at the QD interface by thiol coordination. The carboxylic acid terminus ionized at
physiological pH conditions to provide colliodal stability through repulsion since all nanocrystals
have a net negative charge. The reaction is termed a ligand-exchange as the native hydrophobic
alkane terminated phospine and phosphine oxide ligands are displaced from the QD surface. The
exchange is driven by the higher affinity and bond strength of the Zn-S coordinate bond. Other
chelating ligands include amines which also bind more strongly than the native phosphorus
based ligands used in synthesis. Alternate strategies have incorporated the native hydrophobic
ligands to impart aqueous solubility where the nanocrystals are overcoated with an amphilic
polymer or block co-polymer.64, 65 The structure is typically based on a polyacrylic acid oligomer
backbone and 25-30% of the carboxylic acid backbones are derivatized with alkane chains
varying from 12-18 carbons. These alkane chains intercalate with the native hydrophobic ligands
on the surface of the QDs through van der Waals interactions and the polar carboxylic acids
reside at the termini. Upon phase transfer to aqueous media, the carboxylic acids provide the
solubility and colloidal stability while the QD remains encapsulated in a relatively hydrophobic
environment. Since the surface of the nanocrystal is not in direct contact with the aqueous
solvent, these QDs generally have higher quantum yields. While these two coatings strategies are
widely used, a multitude of ligands with a myriad of terminal function groups have been
described in the literature. For thiol based ligands, monodentate and bidentate ligands based on
lipoic acid have been appended with polyethylene glycol (PEG) and PEG derivatives with
amino, carboxyl, or alcohol terminal groups.66-68 Mixtures of PEG ligands have also been
reported, where a percentage are terminated with biotin to facilitate assembly of avidin
derivatives.68 Moreover, similar PEG derivatives can be tagged to the amphiphilic polymer
backbone using standard carbodiimide chemistry to afford a stable amide linkage.64 Zwitterionic
coatings have also been reported and offer the ability to ameliorate nonselective adsorption of
biomolecules to the surface of the QDs.69, 70 QDs can be purchased commerically with different
surface ligands and tethered bioconjugates. Life Technologies offers a variety of CdSe/ZnS QDs
from hydrophobic post-synthesis nanocrystals to aqueous QDs functionalized with streptavidin
(SAv).71 Coating chemistries are also important from the standpoint of in vivo toxicity, where
cytotoxicity has been linked to Cd2+ ion leaching from the core under continuous UV
illumination and subsequent core oxidation.72 While greener and heavy metal free QDs exist,
designing biocompatible coatings that allow rapid excretion of QDs and that prevent
bioaccumulation may still afford use of these nanocrystals in vivo.

41
Self-assembly of biomolecules on QDs has relied on a variety of surface ligands to facilitate
tethering. Recent reviews have highlighted the myriad of bioconjugation strategies that have
facilitated the use of QDs in bioanalyses.73, 74 More recently, efforts toward orthogonal coupling
strategies have accelerated to enable the selective and simultaneous immobilization of different
classes of biomolecules at the QD interface.74, 75
1.4.4 Quantum Dots as Donors in FRET
The predominant role of QDs in FRET-based assays has been that of energy donors, 76, 77
although configurations where QDs are energy acceptors are described in section 1.4.5.3. Several
of the unique optical properties of QDs make them excellent donors for FRET configurations.
These include high quantum yield, long PL lifetimes, broad absorption spectra and narrow,
symmetric, size-tunable emission.63, 68 Here, some of their key advantages are summarized in the
context of Eqn. 27 which was initially introduced in section 1.3.1.
(27)
In recap, E is FRET efficiency, R0 is the Förster distance (characteristic of a donor-acceptor
pair), r is the donor-acceptor separation distance, a is the number of acceptors interacting with a
QD donor, ΦD is the QY of the donor, J(λ) is the spectral overlap integral, and C is a constant
collecting several parameters generally assumed to be constant.
• The potentially high QY, ΦD, of QD donors helps to maximize energy transfer rates.
• The size-tunable QD PL permits optimization of the overlap, J(λ), with the acceptor
absorption spectrum to improve energy transfer rates while the narrow PL bandwidth
minimizes crosstalk with acceptor emission.
• The surface area of the QD permits the assembly of multiple (equivalent) acceptors, a,
per donor, increasing the net rate of energy transfer from the QD donor.
• The broad absorption spectrum and large effective Stokes shift of QDs permits judicious
selection of donor excitation wavelength to minimize direct excitation of acceptors. Since
acceptor molecules must be in their electronic ground state to function as an acceptor, the
absence of direct excitation maximizes acceptor efficacy (anominal ≈ aeffective).
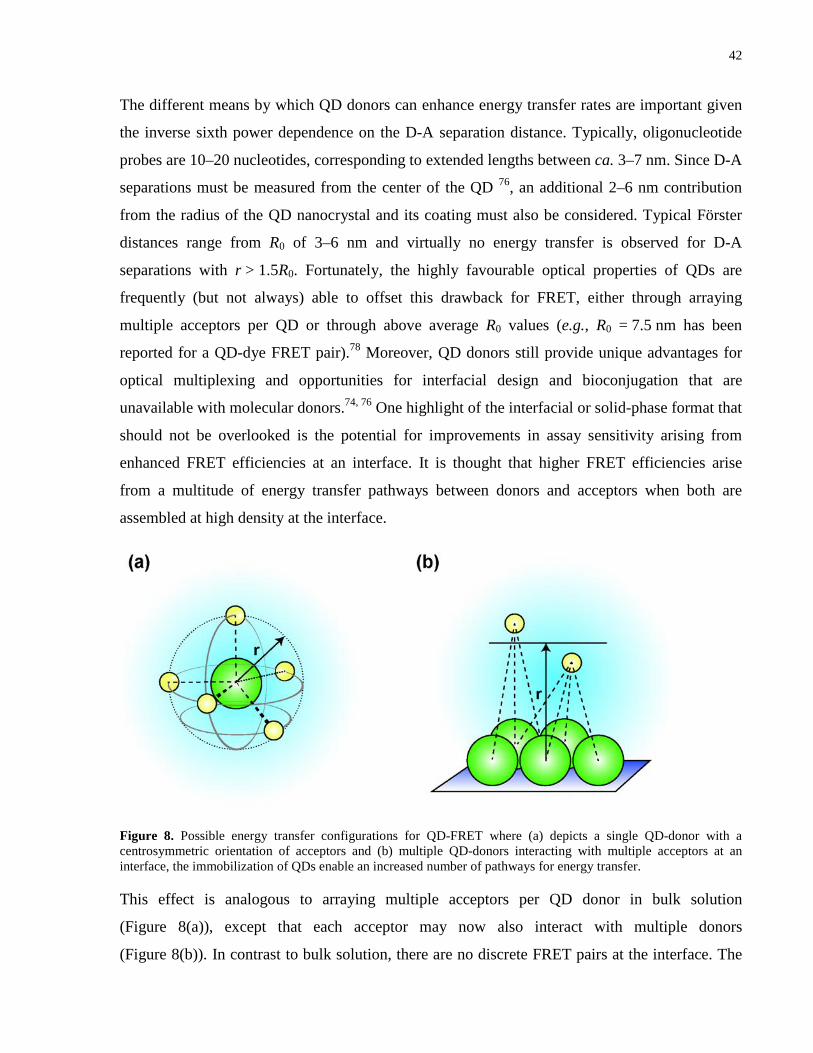
42
The different means by which QD donors can enhance energy transfer rates are important given
the inverse sixth power dependence on the D-A separation distance. Typically, oligonucleotide
probes are 10–20 nucleotides, corresponding to extended lengths between ca. 3–7 nm. Since D-A
separations must be measured from the center of the QD 76, an additional 2–6 nm contribution
from the radius of the QD nanocrystal and its coating must also be considered. Typical Förster
distances range from R0 of 3–6 nm and virtually no energy transfer is observed for D-A
separations with r > 1.5R0. Fortunately, the highly favourable optical properties of QDs are
frequently (but not always) able to offset this drawback for FRET, either through arraying
multiple acceptors per QD or through above average R0 values (e.g., R0 = 7.5 nm has been
reported for a QD-dye FRET pair).78 Moreover, QD donors still provide unique advantages for
optical multiplexing and opportunities for interfacial design and bioconjugation that are
unavailable with molecular donors.74, 76 One highlight of the interfacial or solid-phase format that
should not be overlooked is the potential for improvements in assay sensitivity arising from
enhanced FRET efficiencies at an interface. It is thought that higher FRET efficiencies arise
from a multitude of energy transfer pathways between donors and acceptors when both are
assembled at high density at the interface.
Figure 8. Possible energy transfer configurations for QD-FRET where (a) depicts a single QD-donor with a centrosymmetric orientation of acceptors and (b) multiple QD-donors interacting with multiple acceptors at an interface, the immobilization of QDs enable an increased number of pathways for energy transfer.
This effect is analogous to arraying multiple acceptors per QD donor in bulk solution
(Figure 8(a)), except that each acceptor may now also interact with multiple donors
(Figure 8(b)). In contrast to bulk solution, there are no discrete FRET pairs at the interface. The
43
multitude of FRET pathways appears to be sufficient to more than compensate for the loss of
acceptor-accessible QD surface area upon immobilization (due to occlusion by the solid substrate
and, presumably, neighbouring QDs) 79-81.
Given an appreciation for the optical properties of QDs and how these properties benefit FRET,
it is worthwhile to briefly consider how an assay may be built around the combination of QDs
and FRET. Indeed, QD-FRET assays have been reported for a myriad of analytes ranging from
metabolites 82-84 and other small molecules 85, 86 to enzymes 87, 88 and other proteins 89, 90 to
nucleic acids. Recent reviews have highlighted the more general use of QDs in bioanalysis 31, 76,
91. These developments have been aided by the refinement and expansion of methods for
functionalizing and bioconjugating QDs.92 The basic blueprint for building an assay around a QD
with FRET signaling (abbreviated QD-FRET) is as follows:
1) The core QD nanocrystal with the desired optical properties is passivated and protected
with a thin shell of higher bandgap semiconductor. In most assay applications to date,
CdSe/ZnS core/shell QDs have been utilized.
2) The surface of the QD is modified with a bifunctional ligand or polymer that imparts
aqueous stability and provides reactive groups for covalent bioconjugation or an
accessible interface for self-assembly of derivatized biomolecules.
3) The QD is conjugated with a probe capable of selectively interacting with the biological
target of interest. This probe is typically but not always a biomolecule itself.
4) A fluorescent dye or other suitable acceptor for pairing with the QD donor is directly or
indirectly associated with the above biomolecular interaction such that FRET is turned
‘on’ or ‘off’ in the presence or absence of target (or vice versa).
1.4.5 Nucleic Acid Diagnostics Based on QD-FRET
1.4.5.1 Hybridization Assays
One of the first and most successful of QD-FRET strategies for DNA detection was reported by
Zhang et al., who developed a method based on the analysis of single QD-nanosensors 93. In this
method, streptavidin (SAv)-coated QDs were used as a scaffold for assembling a “sandwich” of
biotinylated capture oligonucleotide probes and Cyanine 5 (Cy5) acceptor-labeled reporter
oligonucleotides in the presence of DNA targets. Only in the presence of target DNA was energy
44
transfer from the SAv-QD605 to the Cy5 possible. Photon bursts from FRET-sensitized Cy5 PL
were used to transduce hybridization events, with the number of these bursts correlated to the
amount of target. Up to 54 duplexes could be self-assembled onto an individual QD, giving rise
to substantial energy transfer efficiencies despite the large separation between QD donor and
Cy5 acceptor. In an oligonucleotide ligation assay with clinical samples, the nanosensor was able
to detect as little as 50 copies of a gene with a point mutation characteristic of ovarian cancer 93.
To permit measurement of single QDs, these assays were conducted under capillary microfluidic
flow, which was later found to enhance energy transfer efficiency when compared to analyses in
bulk solution 94. The average donor-acceptor separation distance decreased by ca. 20% (from
12.0 nm to 9.6 nm) as a result of flow-induced deformation of the dsDNA-QD conjugates,
resulting in higher assay sensitivity 95. Zhang et al. have also used single QD-FRET nanosensors
for the detection of microRNA (miRNA) after two-step isothermal exponential amplification
reaction. 96 The first step in this assay was amplification of the target miRNA to complementary
oligonucleotides, which served as a primer to produce a target oligonucleotide in the second step.
As above, the oligonucleotide target hybridized with probe and reporter oligo sequences tagged
with biotin and Cy5 (i.e., sandwich assay), respectively, and was captured by the SAv-QD605.
FRET-sensitized Cy5 PL was used to quantify the miRNA with an LOD of 0.1 aM 96. Zhang et
al. have further shown that multiplexed DNA detection is possible in a single QD-FRET format
by using three-colour fluorescence coincidence detection 97. Biotinylated capture probes
complementary to the HIV-1 and HIV-2 genes were annealed to their respective target
sequences, and REPs labeled with Alexa Fluor 488 (A488; for HIV-1) and Alexa Fluor 647
(A647; for HIV-2) were added to the mixture along with SAv-QD605 to capture the dsDNA.
Single QDs were interrogated under capillary microfluidic flow using a 488 nm laser for
excitation. Coincident photon bursts from the QDs, A488 (direct excitation) and A647 (FRET-
sensitized) PL provided the signals to transduce the presence of HIV-1 and HIV-2 target genes 97.
In addition to single-particle methods, ensemble compatible QD-FRET hybridization assays have
been described by our group98, 99 and many others 100-104. For example, Zhou et al. have reported
an ensemble QD-FRET assay for nucleic acid detection using QD553 coated with a 2:1 mixture of
11-mercaptoundecyl-tri(ethylene glycol) alcohol and 11-mercaptoundecyl-tri(ethylene glycol)
acetic acid ligands 105. The latter ligands were conjugated with amine-terminated probe
45
oligonucleotides via carbodiimide activation, while the tri(ethylene glycol) (TEG) alcohol
surface prevented the nonspecific adsorption of non-complementary (NC) targets. Hybridization
with Alexa Fluor 594 (A594) labeled targets gave rise to FRET-sensitized A594 PL upon
excitation of the QD. To avoid labeling targets with fluorescent dye, it was possible to use
ethidium bromide (EB) as a FRET acceptor for the QD donor 98, 105. EB selectively intercalates
into dsDNA and exhibits a large fluorescence enhancement 106. Hybridization of QD-probe
conjugates with unlabeled fully complementary (FC) targets permitted intercalation of EB into
the duplex, creating the necessary proximity for energy transfer from the QD and the necessary
environment for EB fluorescence. Quantitative transduction of oligonucleotide targets was
possible with a LOD of 1 nM 105. More recently, Zhang and Zhou have described an
oligonucleotide hybridization assay where the QD and intercalated EB acted as dual FRET
donors for dye-labeled targets 107. Energy transfer from the QD to an Atto 647 (At647) acceptor
label on DNA targets was enhanced when EB was added to the system. Despite the relatively
small spectral overlap between the QD550 and At647, a sub-nanomolar LOD was possible
because EB molecules intercalated at multiple sites along the dsDNA were able to serve as relay
sites for higher overall energy transfer efficiency 107.
1.4.5.2 QD molecular beacons
Molecular beacons (MBs) are perhaps the best known FRET technology for nucleic acid
detection 108. As such, the potential of QD-based MBs has been widely investigated. One of the
first QD-MBs, reported by Kim et al., utilized mercaptoacetic acid (MAA)-coated QDs
conjugated with 25 nt hairpins labeled with 4-((4-(dimethylamino)phenyl)azo)benzoic acid
(DABCYL) quencher 109. Molecular modeling suggested center-center separation distances of
3.3 nm and 5 nm between QD and dye for two hairpin conformations, giving rise to FRET
efficiencies of 54% and 9%, respectively. A minimal increase in QD PL was observed upon
exposure to NC target whereas a 6-fold increase was observed upon exposure to FC target,
indicating that the hairpin sequence retained its function on the surface of QDs. In comparison to
a MB based on molecular dyes, the QD-MB offered a 3-fold improvement in the spectral overlap
integral and superior resistance to photobleaching 109. However, the primary obstacle to use of
the QD-MBs was the larger donor-acceptor separation imposed by the dimensions of the
nanocrystal, which limited the maximum energy transfer efficiency.
46
In a study by Cady et al., the effect of oligonucleotide hairpin conjugation chemistry on the
analytical performance of QD-MBs was evaluated 110. Commercially available SAv-QDs and
carboxyl QD donors were paired with Black Hole Quencher-2 (BHQ-2), Iowa black FQ (IaB),
and 1.4 nm Au NPs as energy acceptors. Carboxyl QDs exhibited a larger relative increase in PL
upon addition of target DNA than SAv-QDs, where the quenching efficiency in the hairpin
conformation was limited by the dimensions of both the nanocrystal and the SAv layer 110. To
some degree, the extra distance imposed by the SAv layer can be compensated by arraying
multiple hairpins around a QD. For example, Kim et al. have reported QD-MBs with 12–15
biotinylated BHQ-2-labeled hairpin probes per QD (QD525, QD565, or QD605), although the FRET
efficiency only reached 35% 111. Alternatively, Li et al. have shown that electrophoretic
separation of QD-MB constructs after hybridization can greatly reduce the background signal
associated with incomplete QD quenching from QD-MBs in the native hairpin state 111.
Multiplexed analysis of two targets differing by a 1BPM was possible, with detection limits as
low 14 nM, (Figure 9(a)) using capillary electrophoresis in conjunction with a two-colour QD-
MB system comprised of QD585 and QD650 with hairpin oligonucleotides terminated with BHQ-2 112.
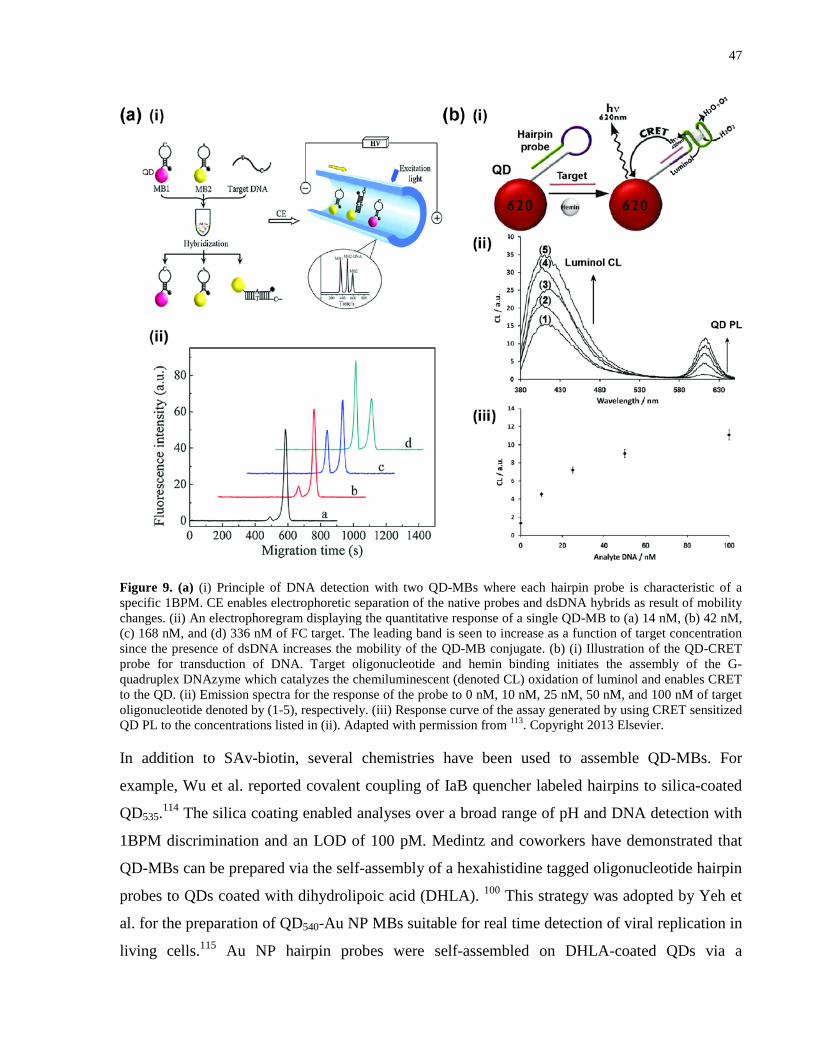
47
Figure 9. (a) (i) Principle of DNA detection with two QD-MBs where each hairpin probe is characteristic of a specific 1BPM. CE enables electrophoretic separation of the native probes and dsDNA hybrids as result of mobility changes. (ii) An electrophoregram displaying the quantitative response of a single QD-MB to (a) 14 nM, (b) 42 nM, (c) 168 nM, and (d) 336 nM of FC target. The leading band is seen to increase as a function of target concentration since the presence of dsDNA increases the mobility of the QD-MB conjugate. (b) (i) Illustration of the QD-CRET probe for transduction of DNA. Target oligonucleotide and hemin binding initiates the assembly of the G-quadruplex DNAzyme which catalyzes the chemiluminescent (denoted CL) oxidation of luminol and enables CRET to the QD. (ii) Emission spectra for the response of the probe to 0 nM, 10 nM, 25 nM, 50 nM, and 100 nM of target oligonucleotide denoted by (1-5), respectively. (iii) Response curve of the assay generated by using CRET sensitized QD PL to the concentrations listed in (ii). Adapted with permission from 113. Copyright 2013 Elsevier.
In addition to SAv-biotin, several chemistries have been used to assemble QD-MBs. For
example, Wu et al. reported covalent coupling of IaB quencher labeled hairpins to silica-coated
QD535.114 The silica coating enabled analyses over a broad range of pH and DNA detection with
1BPM discrimination and an LOD of 100 pM. Medintz and coworkers have demonstrated that
QD-MBs can be prepared via the self-assembly of a hexahistidine tagged oligonucleotide hairpin
probes to QDs coated with dihydrolipoic acid (DHLA). 100 This strategy was adopted by Yeh et
al. for the preparation of QD540-Au NP MBs suitable for real time detection of viral replication in
living cells.115 Au NP hairpin probes were self-assembled on DHLA-coated QDs via a
48
hexahistidine tag. QD PL quenching efficiencies up to 91% were noted when six hairpin probes
were immobilized per QD. Upon addition of complementary target, a >7-fold increase in QD PL
was observed. TAT, the cell-penetrating peptide derived from HIV-1, was used to facilitate
intracellular delivery of QD-MBs. QD PL was visible within cells 1 h post-delivery and it was
possible to monitor spreading of the virus to adjacent cells in the media 115. Wu et al. used an
alternate method of self-assembly to prepare QD-MBs for the detection of β-Lactamase genes in
E. coli by fluorescence in situ hybridization (FISH).116 Thiol terminated hairpin oligonucleotides
labeled with BHQ-2 were self-assembled on MAA-coated QDs, resulting in 74% quenching of
QD PL. Analogous to MBs prepared via polyhistidine self-assembly, the relatively high
quenching efficiency was a result of the compactness of the ligand coating and the direct binding
of the hairpin to the QD. Upon addition of target oligonucleotides, a ca. 4-fold increase in QD PL
resulted. The QD-MBs were successfully applied within bacterial cells and specifically targeted
transcribed β-Lactamase genes. Although adsorption of the MBs to the outer cell membrane was
observed, the adsorbed QD-MBs offered minimal background since the PL was quenched. This
non-interference is in contrast to the use of non-hairpin QD-oligonucleotide probes, which
yielded high background signals when adsorbed. 116
With an eye toward possible in vivo applications, Liu et al. took advantage of the large two-
photon absorption cross-section of QDs to demonstrate interrogation of QD-MBs using two-
photon excitation with a NIR source 117. This approach is attractive for the in vivo detection of
nucleic acids since the QD-MBs do not require a reporter probe (cf. sandwich assays), and since
NIR excitation largely eliminates autofluorescence background from biological samples while
offering greater tissue penetration.
1.4.5.3 Special cases with QD acceptors
There are limited reports on the use of QDs as acceptors in FRET-based assays because there are
only a few select types of luminophore that can effectively donate energy to a QD acceptor.31
This challenge arises from the broad absorption spectrum of a QD since any wavelength suitable
for excitation of a potential donor for a nominal QD acceptor will also directly excite the QD.
The use of luminescent lanthanide complexes with long excited state lifetimes (10–5–10–3 s) as
FRET donors, in conjunction with time-gated PL measurements, permits effective use of QDs as
FRET acceptors, as reviewed elsewhere 118. Another possible mechanism of using QDs as
49
acceptors is to avoid optical excitation altogether. That is, by generating an excited state donor
via chemiluminescence, electrochemiluminescence or bioluminescence. In the absence of optical
interrogation, QDs remain in their ground state and are excellent acceptors. These processes are
referred to as CRET and bioluminescence resonance energy transfer (BRET), respectively.
Willner’s group has developed QD-CRET sensors for DNA detection based on the hemin/G-
quadruplex horseradish peroxidase (HRP) mimicking DNAzyme 113. This DNAzyme catalyzes
the oxidation of luminol by H2O2 with concomitant chemiluminescence in the blue region of the
spectrum (max. PL at 430 nm), providing large overlap with the absorption spectrum of QDs.
Thiol-terminated oligonucleotides incorporating the G-quadruplex sequence were self-assembled
on glutathione (GSH)-coated QDs and the addition of hydrogen peroxide, hemin, and luminol
resulted in localization of the chemiluminescent reaction to the QD with efficient CRET from the
excited state luminol oxidation product to the QD as displayed in Figure 9(b). While DNAzymes
have mainly found utility as labels that are capable of providing signal amplification, this CRET
scheme had the advantage of significantly reducing background signals arising from the catalysis
of luminol by hemin. Since the analytical signal from CRET is distance dependent, there is little
energy transfer from the chemiluminescence of luminol that diffuses through solution 113.
Multiplexed detection of nucleic acid targets was demonstrated by immobilizing three different
nucleic acid hairpin probes on QD490, QD560, and QD620, respectively. The probes were designed
such that the stem duplex contained the DNAzyme sequence while the loop structure was
complementary to the target sequence. This configuration enabled formation of the hemin/G-
quadruplex structure and evolution of CRET only in the presence of the target nucleic acid
sequence. Nanomolar LODs were reported and the inherent selectivity of the hairpin probes
permitted parallel analysis of nucleic acid targets 113. More recent work by the Willner group has
shown that the aforementioned QD-CRET DNAzyme can be used in photoelectrochemical
schemes for DNA detection and for following the activity of DNA machines 119, 120.
Deo’s group has reported QD-BRET-based assays for nucleic acid detection 121, 122. Renilla
luciferase (Rluc), which catalyzes of the oxidation of coelenterazine with blue bioluminescent
emission (max. PL at 485 nm), was used as the donor. In one format, nucleic acid probes were
immobilized on QD705 while target was tagged with Rluc 121. Hybridization provided the
necessary proximity for BRET from Rluc to the QD705 upon addition of coelenterazine. A
competitive binding assay format was used in practice so that target endogenous to a sample
50
would not need to be labeled with Rluc, but would complete with Rluc-labeled exogenous target.
Progressive increases in the Rluc/QD (485 nm/705 nm) PL intensity ratio with increasing
amounts of target permitted quantitative transduction. The LOD was as low as 4 pmol (~20 nM)
and the assay was amenable to analyses in complex matrices 121. Further work by the same group
has included a QD-BRET sandwich assay with Rluc-labeled REP sequences 122. A 15 nt spacer
between the target sequence segments where probe and REP hybridized was found to improve
BRET due to reduced steric hindrance between Rluc and the QD. Using the BRET sensitized PL
as the analytical signal, a dynamic range greater than two orders of magnitude was realized and
as little as 0.54 pmol (~3.5 nM) of target oligonucleotide could be detected. Discrimination
against 1BPMs was demonstrated and the robustness of the assay was demonstrated by detecting
nucleic acid targets in E. coli cell extract 122.
1.5 Microfluidics as a Platform for Bioanalysis
Microfluidics is defined as a technology used to manipulate fluids on the order of nL to aL in
channel frameworks that are on the order of tens to hundreds of micrometers in dimension.123
Such miniaturized fluidic platforms have garnered much interest from the analytical community
for sample manipulation and the building of lab-on-a-chip (LOC) integrated analysis devices.
The current impact of microfluidics was realized by widespread interest from four scientific
fields: the microanalytical community set the foundation, application in molecular biology,
biodefence sensors, and microelectronics provided the momentum.123 With the largest impact on
the area of separation science, microfluidic technologies and more specifically capillary
electrophoresis (CE) systems enabled high resolution separations with speed suitable for high
throughput analysis. For molecular biology, nucleic acid analysis techniques such as PCR and
genomic sequencing methods were well suited to miniaturization.124, 125 The US department of
defense also stimulated the growth of the field into the chemical and biosensor field to provide
on-demand sensors for transduction of chemical and biological warfare agents. The success of
photolithographic techniques in microchip fabrication immediately translated to microfabrication
of fluidic systems based on glass or silicon based materials.123 Currently soft lithography
techniques have dominated the device fabrication and are discussed in Section 1.5.1. Nonetheless
photolithographic techniques are still required for microfluidic master fabrications used in soft
lithography.
51
Microfluidic systems can be classified under three different fluid handling methods – channel,
droplet, and digital microfluidics. The naming system identifies the way the fluids are
manipulated, while the former two are conducted in channels as the name suggests, fluid streams
are continuous and in droplet form126, respectively. However droplet fluid handling bridges into
the third type of microfluidic technology which involves manipulation of microliter droplets on a
Teflon surface with sequential patterned electrodes.127, 128 Application of voltages to the
microelectrodes enables droplet movement over the dielectric.129 All types of fluidic systems are
advantageous from the stand point of LOC bioanalyses. Microfluidic systems are attractive since
they are low cost, portable, require reduced sample and reagent volumes, are amenable to POC
diagnostics, and offer faster reaction kinetics. Furthermore, each specific classification has
additional advantages, channel-based systems offer laminar flow and under electrokinetic
control, plug based sample dispensing is possible.123 For droplet-based flow, rapid kinetics are
afforded in each droplet “reactor” and pneumatic assisted methods for droplet splitting and
fusion offer greater sample manipulation.126 For digital microfluidics, electrowetting-on-
dielectric (EWOD) droplet manipulation offers complete automation and full realization of the
LOC concept.129 All fluidic handling methods have found great utility as platforms for bioassays
and biosensors. The interest in fluidic platforms for bioanalysis is exemplified by the continuous
emergence of LOC biosensors and bioassays in the literature for the transduction of peptides,130
nucleic acids,131-133 small molecule toxins,134, 135 bacteria species,136 cancer cells,137 and protein
markers.138, 139 Moreover, chip based platforms are amenable to optical,137 electrochemical,140
and piezoelectric141 transduction methods offering greater versatility to biosensor design.
Although some challenges with optical based transduction are the requirement for excitation and
detection hardware along with band sorting filters or monochromators, recent advances in
integrating waveguides on-chip have facilitated optical detection in LOC bioassays.142 In recent
work, paper based fluidic systems have also become attractive from the standpoint of cost, ease-
of-use and the use of active wicking of materials to avoid the requirement of external pumps or
power supplies.143 The impact of chip based diagnostics have been highlighted in recent
reviews,144, 145 although the advances of microfluidics into many diverse fields owes much
tribute to the robust prototyping offered by soft lithography methods.
52
1.5.1 Soft Lithography for Rapid Device Prototyping
Much of the early foundations of microfluidics utilized the well-established methods of
photolithography, where chips were fabricated entirely of silicon or glass. While these chips are
robust and are fabricated with excellent precision, the cost of fabrication along with the need for
a cleanroom facility limits the throughput of prototype fabrication.146 Furthermore, for many
diagnostic assays, reusability may not be possible which further increases costs. Polymer
prototypes alleviate these issues as they are casted by molding or embossing techniques rather
than etching protocols with highly reactive and toxic solutions such as hydrofluoric acid. The
only disadvantage of these materials is the limited applicable solvents for compatibility while
channels comprised of glass can tolerate most organic solvents.147 However, the impact of this
challenge is minimized for bioanalytical applications which mainly require aqueous buffer
solutions. A multitude of suitable polymer materials exist for device fabrication, these include:
polyurethanes, polyphenol-formaldehydes, polyimides, and siloxane rubbers.148 Perhaps the most
commonly used material is poly(dimethylsiloxane) (PDMS).149 The interest in this material
arises from the many advantages it can offer that enable use of PDMS microfluidic devices for a
variety of applications.147 First and foremost, PDMS can replicate molds with micrometer
precision and this is an ideal characteristic for microfabrication. PDMS cures at temperatures of
ca. 100 ºC, is optically transparent well into the short UV wavelength range (280 nm), is
biocompatible, non-toxic and can be used to culture cells, and the crosslinked form affords a
reversible deformable modulus that is easily lifted from the template design. While the cured
polymer is hydrophobic in nature, it is easily rendered hydrophilic through oxidation either by
treatment with extremely alkaline solution or by oxygen/air plasma oxidation. This amphiphilic
control of surface patterning enables either reversible or irreversible sealing with hydrophobic or
hydrophilic planar surfaces, respectively. The elastomeric nature of PDMS also enables it
conform to smooth surfaces.147
The chemistry of PDMS has been extensively characterized and developed to enable facile
fabrication of polymer molds. PDMS is readily available commercially from Dow Corning and is
supplied as a two component kit. A prepolymer elastomer and curing agent are combined in a
10:1 ratio and mixed vigorously to initiate crosslinking of the elastomer. Crosslinking proceeds
via a Pt0 catalyzed hydrosilylation reaction to build the carbon-silicon framework of the cured
PDMS. The elastomer is supplied as a vinyl-terminated siloxane monomer while the curing agent
53
contains a Pt0 complex mixed in with copolymers of a mixture of siloxanes, but importantly
hydrosiloxanes.148 Initial reports of Pt0 catalyzed hydrosilylation utilized cyclic olefin-Pt
complexes that proceeded through formation of Pt colloids to afford siloxane polymer growth.150
Refining of the ligands of the Pt catalyst have afforded cross-couplings that avoid formation of
colloidal Pt in hydrosilylation reactions.151 Nonetheless, both reported methods offer efficient,
high yield, hydrosilylation at room temperature. The mechanism first requires coordination of the
olefin to the Pt center along with the hydrosiloxane. Formation of the new Si-C bond at the Pt
center generates H2 where cessation of this evolved gas offers a qualitative indication that the
reaction is complete. If left at room temperature the solution will naturally cure on after a few
hours. Pouring of the mixture on a template and baking at 100 ºC offers formation of cured
PDMS stamps within 20 min that are ready for device assembly. Soft lithography techniques all
require microfluidic master molds that are fabricated using traditional photolithographic
techniques in clean room facilities. These templates are fabricated using photocurable epoxy
materials (SU-8-5) that are spin coated on planar glass slides at micron thicknesses.147
Photomasks with microchannel designs enable generation of positive photo reliefs after film
development. The use of computer aided design (CAD) programs can produce high quality
photomasks with micron resolution that enable the user to draft any microchannel template.147
CAD programs for photomask design and photolithographic techniques are a convenient
approach to robust microfluidic masters that can offer reproducible PDMS stamps for months at
a time. More recently, advances in 3D-printer technology have afforded the development on
fully functional microfluidic systems and offer a more convenient approach to in-house template
and microfluidic master design.152, 153
1.5.2 Fluid Dynamics in Microchannels
In addition to the advantages microfluidic systems provide as platforms for bioassays and
biosensors, fluid dynamics in channel offer interesting phenomena such as laminar flow.123 The
two common fluid driving forces are hydrodynamic and electrokinetic methods. The former is
characterized by parabolic shape flow.154 The latter offers flat “plug” like fluid profiles and is
described in detail in section 1.5.3. In both forms of solution transport, microfluidic phenomena
exist and are often characterized by dimensionless numbers used to describe fluid flow.155 Two
of the fundamental parameters in describing fluid dynamics are the density (ρ) and shear
viscosity (η) or resistance to flow. The dimensionless Reynolds number (Re) which is defined as
54
the ratio of inertial to viscous forces is used to describe fluid flow in microchannels. The
Reynolds number is given by Eqn. 28 where U0 and L0 are the fluid velocity and a length scale of
force density, respectively.155
𝑅𝑒 =𝜌𝑈0𝐿0𝜂
(28)
For a Newtonian fluid, its flow velocity is governed by Navier-Stokes theory; derivations can be
found elsewhere. In microfluidics the Reynolds number is low and often below 10, inertial forces
negligible and viscous forces dominant the flow profile. At low Reynolds number, the nonlinear
component of the Navier-Stokes equation can be ignored and the fluid velocity is described by
Stokes flow. In this description, the fluid flow is laminar and flows linearly throughout the
microchannel with no turbulence. Inertial forces become significant when the Reynolds number
exceeds 2000 and turbulent flow results.155 In laminar flow, delivery of solution and more
importantly analyte to areas perpendicular to the plane of flow is dominated by diffusional mass
transport. Diffusion is the major driving force of mixing in laminar flow regimes and the
relationship between convection and diffusion is described by the Peclet number as shown by
Eqn. 29, where w is the width of the channel and D is the diffusivity of the molecule.155
𝑃𝑒 =𝑈0𝑤𝐷
The Peclet number is also dimensionless and can be understood by considering a T-shape
microchannel junction where two independent fluid streams meet at the junction point. The
Peclet number describes effectively the number of channel widths required for the two solutions
to completely mix. The desired fluid dynamics in microchannels are ultimately application based
where laminar and turbulent flows have each found specific niches.155, 156
1.5.3 Electrokinetic Phenomena
Alternate fluid driving forces in microchannels include electrokinetic flow, which is defined as
the coupling of electric current and fluid dynamics in a solution containing electrolyte.157
Requirements for electrokinetic fluid transport include a charged interface, since it is the
electrical double layer (EDL) and more importantly the Debye layer that is responsible for
driving fluid flow and an electrolyte solution. Since the microfluidic channels introduced thus far
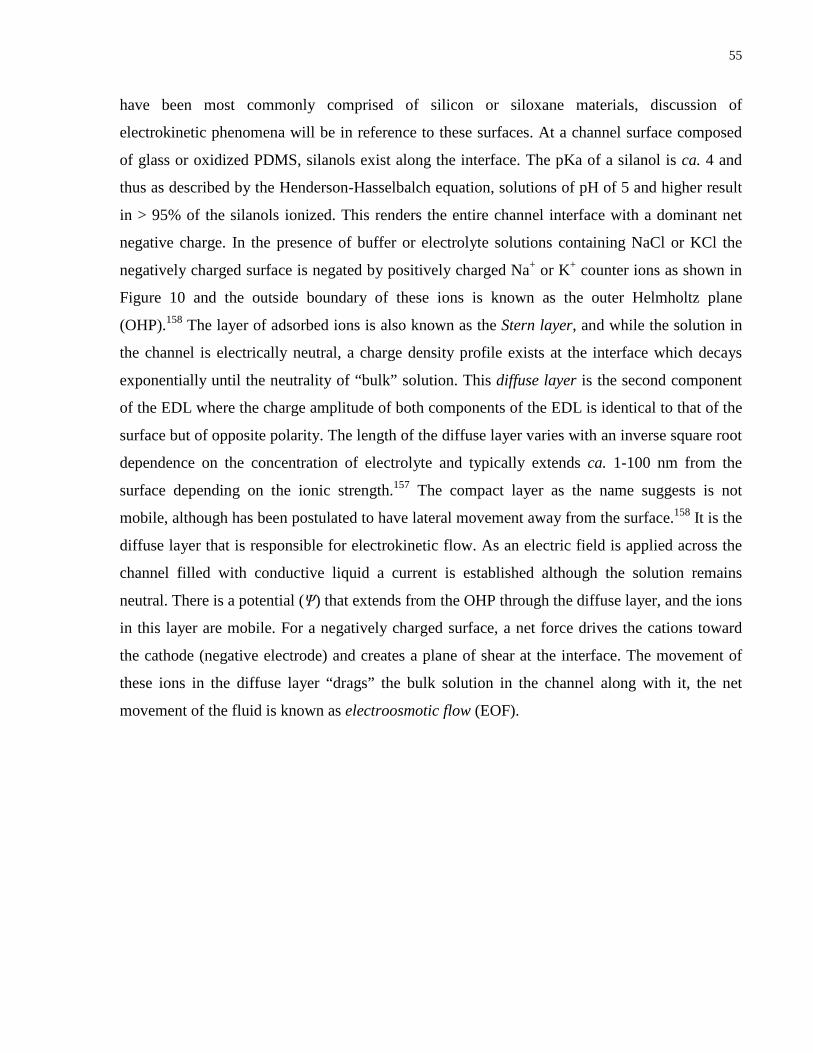
55
have been most commonly comprised of silicon or siloxane materials, discussion of
electrokinetic phenomena will be in reference to these surfaces. At a channel surface composed
of glass or oxidized PDMS, silanols exist along the interface. The pKa of a silanol is ca. 4 and
thus as described by the Henderson-Hasselbalch equation, solutions of pH of 5 and higher result
in > 95% of the silanols ionized. This renders the entire channel interface with a dominant net
negative charge. In the presence of buffer or electrolyte solutions containing NaCl or KCl the
negatively charged surface is negated by positively charged Na+ or K+ counter ions as shown in
Figure 10 and the outside boundary of these ions is known as the outer Helmholtz plane
(OHP).158 The layer of adsorbed ions is also known as the Stern layer, and while the solution in
the channel is electrically neutral, a charge density profile exists at the interface which decays
exponentially until the neutrality of “bulk” solution. This diffuse layer is the second component
of the EDL where the charge amplitude of both components of the EDL is identical to that of the
surface but of opposite polarity. The length of the diffuse layer varies with an inverse square root
dependence on the concentration of electrolyte and typically extends ca. 1-100 nm from the
surface depending on the ionic strength.157 The compact layer as the name suggests is not
mobile, although has been postulated to have lateral movement away from the surface.158 It is the
diffuse layer that is responsible for electrokinetic flow. As an electric field is applied across the
channel filled with conductive liquid a current is established although the solution remains
neutral. There is a potential (Ψ) that extends from the OHP through the diffuse layer, and the ions
in this layer are mobile. For a negatively charged surface, a net force drives the cations toward
the cathode (negative electrode) and creates a plane of shear at the interface. The movement of
these ions in the diffuse layer “drags” the bulk solution in the channel along with it, the net
movement of the fluid is known as electroosmotic flow (EOF).
56
Figure 10. Formation of the EDL at a silanol interface and the origin of electroosmotic flow. A layer of potassium cations known as the Stern layer bounded by the outer Helmholtz plane (OHP) is electrostatically attracted to the net negatively charged silica surface. The diffuse layer is comprised of predominantly potassium ions with some chloride counter ion creating a local potential (Ψ) that decays exponentially from the surface. Application of a potential across the microchannel causes a net force that drives the cations in the diffuse layer toward the cathode where the movement of the diffuse layer creates a plane of shear. The diffuse layer causes the entire solution to move throughout the microchannel, this is known as electroosmotic flow (EOF) and the velocity (u) increases from the surface until the edge of the diffuse layer. The zeta potential (ζ) is defined as the charge from the surface at the shear plane. Reproduced with permission from ref.158. Copyright 2004 WILEY-VCH Verlag GmbH & Co.
The EOF velocity (u) increases from the surface to the edge of the diffuse layer, where the
charge at the plane of shear is known as the zeta potential (ζ). The EOF velocity at an applied
external electric field (E) is given by the Smoluchowski equation (Eqn. 30), where ε and ε0 are
the relative dielectric constant and the permittivity of vacuum respectively and µ is solution
viscosity.159
𝑢 = 𝜀𝜀0ζ𝜇
𝐸 (30)
The EOF velocity is directly proportional to the applied field strength and the zeta potential.
While the former can be controlled using a power supply, the latter is influenced by both the pH
and ionic strength and is described in detail elsewhere.158 Since the zeta potential of the interface
57
is directly a combination of the degree of ionization and the abundance of electrolyte, an intricate
balance is required. A high enough pH facilities suitable surface silanol ionization and sufficient
electrolyte provides conductivity and a diffuse layer. At low ionic strength, the solution is poorly
conductive, and at high electrolyte concentrations the surface charge is significantly screened
and there is increased local Joule heating of the fluid in the presence of an applied field. Since
the fluid adjacent to the interface is responsible for the net force that drives fluid movement, the
fluid front appears as a flat profile in comparison to the parabolic flow dynamics in
hydrodynamic flow. This characteristic of EOF has enabled higher resolution separations by
minimizing band overlap. Moreover stacking of bands in channel has afforded high sensitivity
using fluorimetric detectors.160, 161 The relative size of the EDL in comparison to the channel
dimensions can be perceived as the thickness of a layer of paint on the walls of a rectangular
room. Because of this contrast, the fluid appears to “slip” along the channel surface as the EOF
velocity at the interface is effectively zero.157 Furthermore, it is important to note that the zeta
potential at the channel interface is independent of the channel dimensions and thus reproducible
experimental methods for determining the zeta potential can be applied to many microfluidic
systems. One such method involves monitoring the slope of the current-time relationship in EOF
and the resultant modified form of the Smoluchowski equation.159 A capillary or microchannel
along with one inlet reservoir is filled with a buffer solution of known ionic strength. A second
buffer of slightly higher ionic strength ca. 5 % is placed in the opposite reservoir and a potential
is applied across the channel. EOF will carry the higher ionic strength buffer into the channel and
the current will increase until the entire channel is equilibrated with buffer and then will remain
constant. Since the difference in ionic strength between buffers is small, the slope is linear. The
slope of the current-time (mIT) relationship can be related to the average EOF velocity and the
zeta potential of the microchannel as shown by Eqn. 31.159
ζ =𝜇𝑚𝐼𝑇𝐿
𝜀𝜀0𝐸2𝐴𝑐𝑟𝑜𝑠𝑠(𝜆𝑏2 − 𝜆𝑏1) (31)
In Eqn. 31, L is the length of the microchannel and Across is the cross-sectional area. The
difference in bulk conductivity between the higher ionic strength buffer and that of the lower is
given by λb2 - λb2. This method offers higher accuracy as it avoids ambiguity introduced in
determining exactly when buffer is displaced in the microchannel.159
58
In electrokinetics, EOF is not the only driving force for analyte migration in capillaries or
microchannels. Charged analytes also experience an acting electrophoretic force (EPF) attracting
them to oppositely charged electrodes. The migration velocity (v) for a charged analyte is given
by Eqn. 32, where µe is the characteristic electrophoretic mobility and is indirectly proportional
to frictional forces and directly proportional to the charge of the analyte.27
𝑣 = µe𝐸 (32)
EPF and EOF may act cooperatively or oppositely, and the resultant net mobility is a
combination of these processes. Treatment of a channel wall with NaOH and plasma oxidation
can provide for high EOF velocity where all analytes and bulk solution travel via EOF.
Alternatively, conditions can be selected to have weak EOF, and then EPF and EOF can allow
for movement of analytes across the microchannel in different directions. For cathodic EOF
using negatively charged surfaces of microchannels, positively charged analytes may have
increased mobility as EOF and EPF vectors are aligned. On the contrary, for negatively charged
analytes the EPF migration opposes the direction of EOF. Surface derivatization methods
including silane chemistry and photo mediated modifications162, 163 can pattern the surface with
positively charged functional groups such as amines and reverse the direction of EOF toward the
anodic reservoir. Alternative methods for EOF manipulation include dynamic coating with
charged polymers. Polybrene is one example of a positively charged polymer and can be added
to buffers in small percentages to reverse the direction of EOF without the need for surface
modification in the microchannel.164 In CE applications EOF is often unfavorable as analyte
separation is facilitated by charge or differences in frictional forces.27 Methods to eliminate EOF
in situ are similar to those that reverse direction. Neutral surfactant polymers such as
poly(vinylpyrrolidone) (PVP) can be incorporated as 1% v/v additives to buffers to dynamically
coat the walls of the microchannel. Since this prevents formation of the EDL, EOF is suppressed
to insignificant levels.165
1.6 Contributions of this Thesis This thesis is organized into a total of six chapters including this introductory chapter and a
conclusion. The research contributions are organized over four chapters in the order in which the
studies were conducted. The foundation of this work was built by earlier members of Krull’s
team. In particular the contributions from Erickson and Krull166, 167 in the advantages offered by
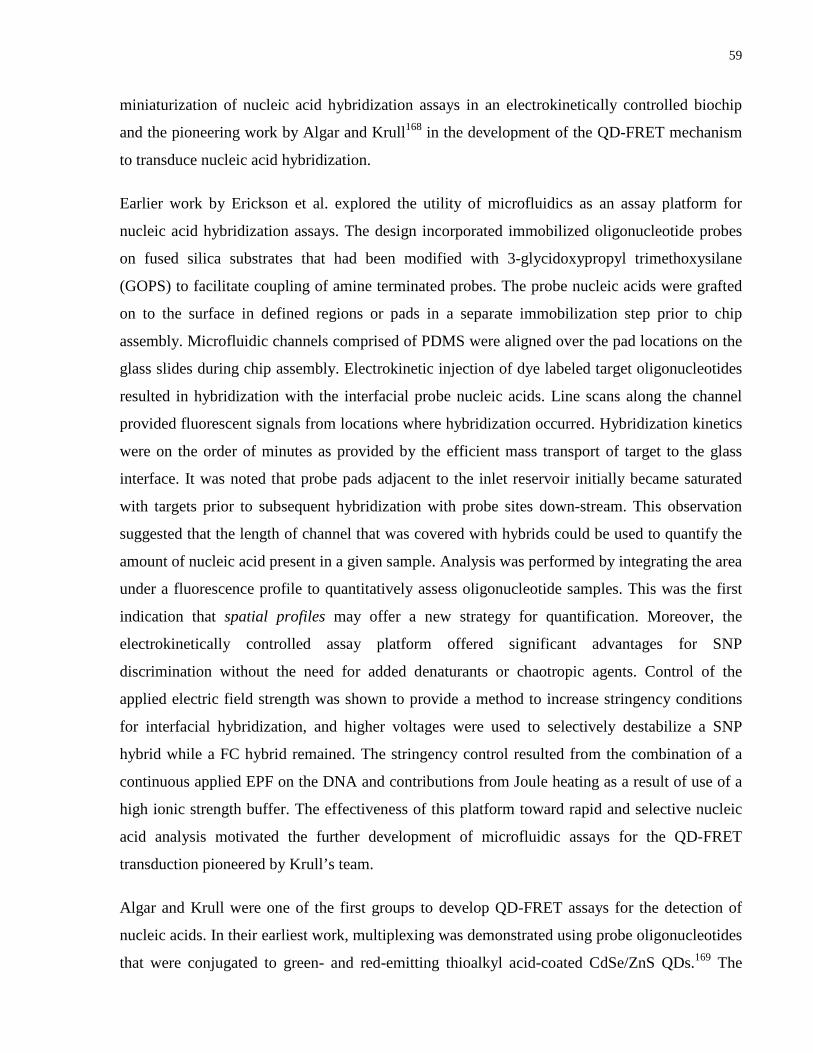
59
miniaturization of nucleic acid hybridization assays in an electrokinetically controlled biochip
and the pioneering work by Algar and Krull168 in the development of the QD-FRET mechanism
to transduce nucleic acid hybridization.
Earlier work by Erickson et al. explored the utility of microfluidics as an assay platform for
nucleic acid hybridization assays. The design incorporated immobilized oligonucleotide probes
on fused silica substrates that had been modified with 3-glycidoxypropyl trimethoxysilane
(GOPS) to facilitate coupling of amine terminated probes. The probe nucleic acids were grafted
on to the surface in defined regions or pads in a separate immobilization step prior to chip
assembly. Microfluidic channels comprised of PDMS were aligned over the pad locations on the
glass slides during chip assembly. Electrokinetic injection of dye labeled target oligonucleotides
resulted in hybridization with the interfacial probe nucleic acids. Line scans along the channel
provided fluorescent signals from locations where hybridization occurred. Hybridization kinetics
were on the order of minutes as provided by the efficient mass transport of target to the glass
interface. It was noted that probe pads adjacent to the inlet reservoir initially became saturated
with targets prior to subsequent hybridization with probe sites down-stream. This observation
suggested that the length of channel that was covered with hybrids could be used to quantify the
amount of nucleic acid present in a given sample. Analysis was performed by integrating the area
under a fluorescence profile to quantitatively assess oligonucleotide samples. This was the first
indication that spatial profiles may offer a new strategy for quantification. Moreover, the
electrokinetically controlled assay platform offered significant advantages for SNP
discrimination without the need for added denaturants or chaotropic agents. Control of the
applied electric field strength was shown to provide a method to increase stringency conditions
for interfacial hybridization, and higher voltages were used to selectively destabilize a SNP
hybrid while a FC hybrid remained. The stringency control resulted from the combination of a
continuous applied EPF on the DNA and contributions from Joule heating as a result of use of a
high ionic strength buffer. The effectiveness of this platform toward rapid and selective nucleic
acid analysis motivated the further development of microfluidic assays for the QD-FRET
transduction pioneered by Krull’s team.
Algar and Krull were one of the first groups to develop QD-FRET assays for the detection of
nucleic acids. In their earliest work, multiplexing was demonstrated using probe oligonucleotides
that were conjugated to green- and red-emitting thioalkyl acid-coated CdSe/ZnS QDs.169 The
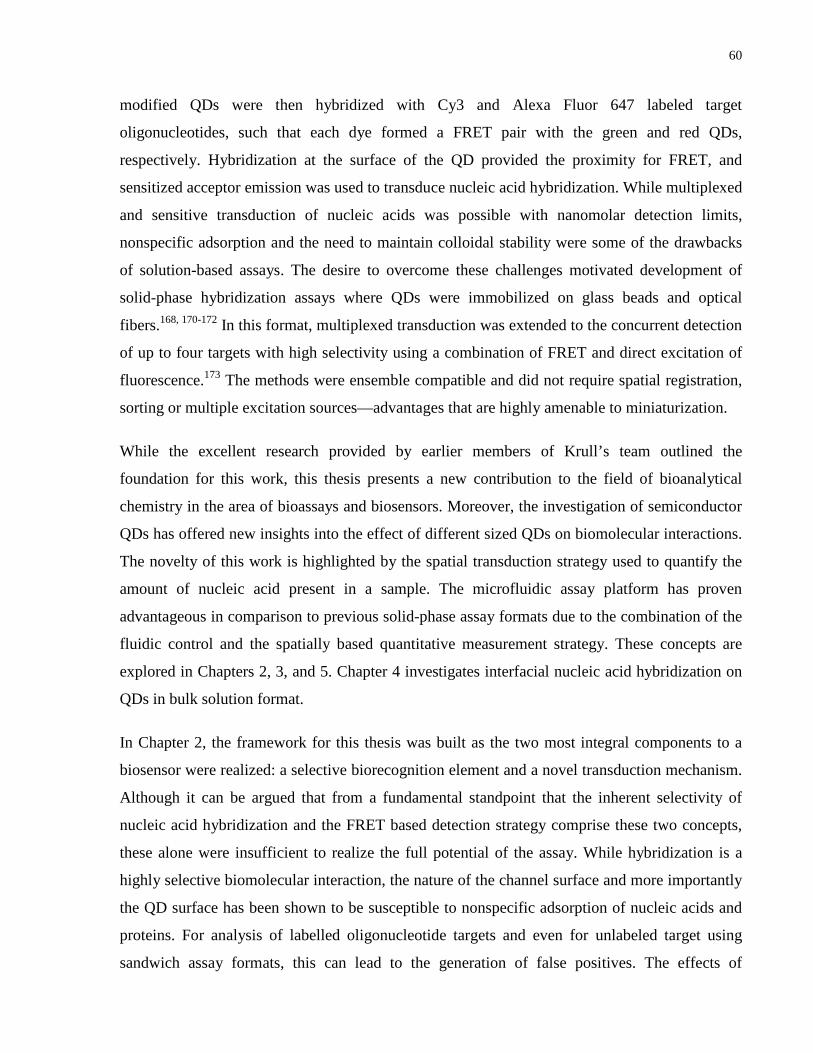
60
modified QDs were then hybridized with Cy3 and Alexa Fluor 647 labeled target
oligonucleotides, such that each dye formed a FRET pair with the green and red QDs,
respectively. Hybridization at the surface of the QD provided the proximity for FRET, and
sensitized acceptor emission was used to transduce nucleic acid hybridization. While multiplexed
and sensitive transduction of nucleic acids was possible with nanomolar detection limits,
nonspecific adsorption and the need to maintain colloidal stability were some of the drawbacks
of solution-based assays. The desire to overcome these challenges motivated development of
solid-phase hybridization assays where QDs were immobilized on glass beads and optical
fibers.168, 170-172 In this format, multiplexed transduction was extended to the concurrent detection
of up to four targets with high selectivity using a combination of FRET and direct excitation of
fluorescence.173 The methods were ensemble compatible and did not require spatial registration,
sorting or multiple excitation sources—advantages that are highly amenable to miniaturization.
While the excellent research provided by earlier members of Krull’s team outlined the
foundation for this work, this thesis presents a new contribution to the field of bioanalytical
chemistry in the area of bioassays and biosensors. Moreover, the investigation of semiconductor
QDs has offered new insights into the effect of different sized QDs on biomolecular interactions.
The novelty of this work is highlighted by the spatial transduction strategy used to quantify the
amount of nucleic acid present in a sample. The microfluidic assay platform has proven
advantageous in comparison to previous solid-phase assay formats due to the combination of the
fluidic control and the spatially based quantitative measurement strategy. These concepts are
explored in Chapters 2, 3, and 5. Chapter 4 investigates interfacial nucleic acid hybridization on
QDs in bulk solution format.
In Chapter 2, the framework for this thesis was built as the two most integral components to a
biosensor were realized: a selective biorecognition element and a novel transduction mechanism.
Although it can be argued that from a fundamental standpoint that the inherent selectivity of
nucleic acid hybridization and the FRET based detection strategy comprise these two concepts,
these alone were insufficient to realize the full potential of the assay. While hybridization is a
highly selective biomolecular interaction, the nature of the channel surface and more importantly
the QD surface has been shown to be susceptible to nonspecific adsorption of nucleic acids and
proteins. For analysis of labelled oligonucleotide targets and even for unlabeled target using
sandwich assay formats, this can lead to the generation of false positives. The effects of
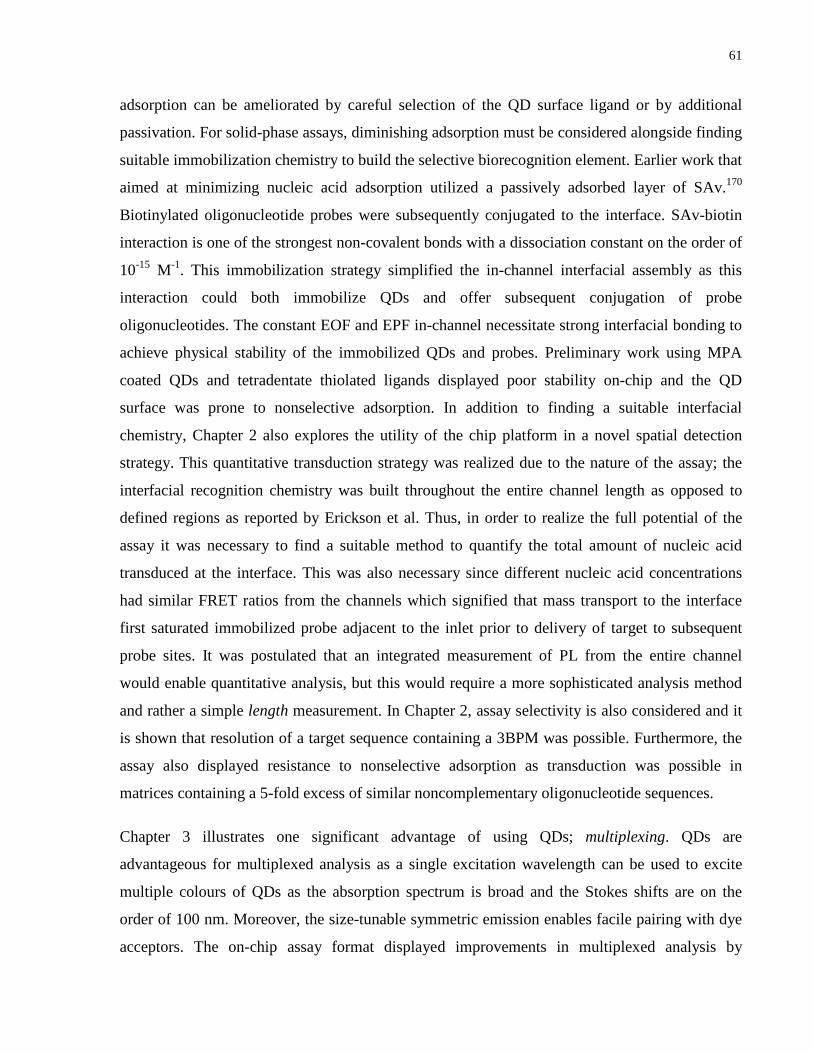
61
adsorption can be ameliorated by careful selection of the QD surface ligand or by additional
passivation. For solid-phase assays, diminishing adsorption must be considered alongside finding
suitable immobilization chemistry to build the selective biorecognition element. Earlier work that
aimed at minimizing nucleic acid adsorption utilized a passively adsorbed layer of SAv.170
Biotinylated oligonucleotide probes were subsequently conjugated to the interface. SAv-biotin
interaction is one of the strongest non-covalent bonds with a dissociation constant on the order of
10-15 M-1. This immobilization strategy simplified the in-channel interfacial assembly as this
interaction could both immobilize QDs and offer subsequent conjugation of probe
oligonucleotides. The constant EOF and EPF in-channel necessitate strong interfacial bonding to
achieve physical stability of the immobilized QDs and probes. Preliminary work using MPA
coated QDs and tetradentate thiolated ligands displayed poor stability on-chip and the QD
surface was prone to nonselective adsorption. In addition to finding a suitable interfacial
chemistry, Chapter 2 also explores the utility of the chip platform in a novel spatial detection
strategy. This quantitative transduction strategy was realized due to the nature of the assay; the
interfacial recognition chemistry was built throughout the entire channel length as opposed to
defined regions as reported by Erickson et al. Thus, in order to realize the full potential of the
assay it was necessary to find a suitable method to quantify the total amount of nucleic acid
transduced at the interface. This was also necessary since different nucleic acid concentrations
had similar FRET ratios from the channels which signified that mass transport to the interface
first saturated immobilized probe adjacent to the inlet prior to delivery of target to subsequent
probe sites. It was postulated that an integrated measurement of PL from the entire channel
would enable quantitative analysis, but this would require a more sophisticated analysis method
and rather a simple length measurement. In Chapter 2, assay selectivity is also considered and it
is shown that resolution of a target sequence containing a 3BPM was possible. Furthermore, the
assay also displayed resistance to nonselective adsorption as transduction was possible in
matrices containing a 5-fold excess of similar noncomplementary oligonucleotide sequences.
Chapter 3 illustrates one significant advantage of using QDs; multiplexing. QDs are
advantageous for multiplexed analysis as a single excitation wavelength can be used to excite
multiple colours of QDs as the absorption spectrum is broad and the Stokes shifts are on the
order of 100 nm. Moreover, the size-tunable symmetric emission enables facile pairing with dye
acceptors. The on-chip assay format displayed improvements in multiplexed analysis by
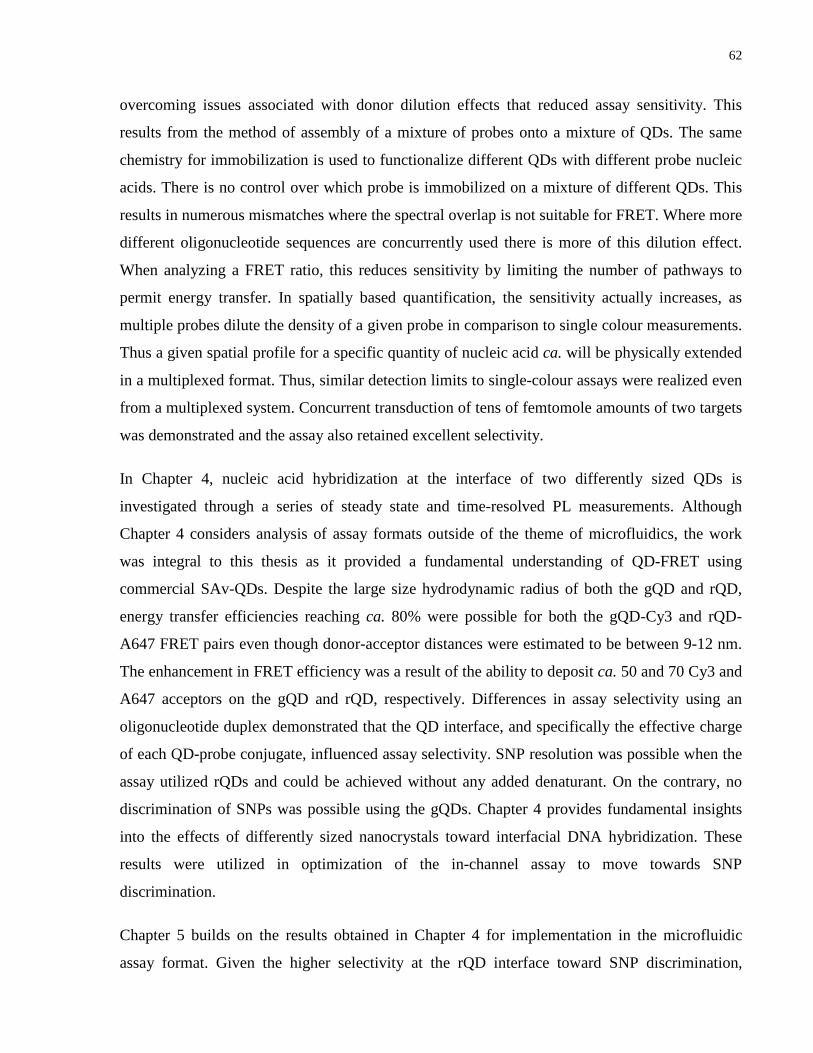
62
overcoming issues associated with donor dilution effects that reduced assay sensitivity. This
results from the method of assembly of a mixture of probes onto a mixture of QDs. The same
chemistry for immobilization is used to functionalize different QDs with different probe nucleic
acids. There is no control over which probe is immobilized on a mixture of different QDs. This
results in numerous mismatches where the spectral overlap is not suitable for FRET. Where more
different oligonucleotide sequences are concurrently used there is more of this dilution effect.
When analyzing a FRET ratio, this reduces sensitivity by limiting the number of pathways to
permit energy transfer. In spatially based quantification, the sensitivity actually increases, as
multiple probes dilute the density of a given probe in comparison to single colour measurements.
Thus a given spatial profile for a specific quantity of nucleic acid ca. will be physically extended
in a multiplexed format. Thus, similar detection limits to single-colour assays were realized even
from a multiplexed system. Concurrent transduction of tens of femtomole amounts of two targets
was demonstrated and the assay also retained excellent selectivity.
In Chapter 4, nucleic acid hybridization at the interface of two differently sized QDs is
investigated through a series of steady state and time-resolved PL measurements. Although
Chapter 4 considers analysis of assay formats outside of the theme of microfluidics, the work
was integral to this thesis as it provided a fundamental understanding of QD-FRET using
commercial SAv-QDs. Despite the large size hydrodynamic radius of both the gQD and rQD,
energy transfer efficiencies reaching ca. 80% were possible for both the gQD-Cy3 and rQD-
A647 FRET pairs even though donor-acceptor distances were estimated to be between 9-12 nm.
The enhancement in FRET efficiency was a result of the ability to deposit ca. 50 and 70 Cy3 and
A647 acceptors on the gQD and rQD, respectively. Differences in assay selectivity using an
oligonucleotide duplex demonstrated that the QD interface, and specifically the effective charge
of each QD-probe conjugate, influenced assay selectivity. SNP resolution was possible when the
assay utilized rQDs and could be achieved without any added denaturant. On the contrary, no
discrimination of SNPs was possible using the gQDs. Chapter 4 provides fundamental insights
into the effects of differently sized nanocrystals toward interfacial DNA hybridization. These
results were utilized in optimization of the in-channel assay to move towards SNP
discrimination.
Chapter 5 builds on the results obtained in Chapter 4 for implementation in the microfluidic
assay format. Given the higher selectivity at the rQD interface toward SNP discrimination,
63
assembly of the on-chip assay made use of rQDs. SNP resolution was possible with contrast
ratios exceeding two-orders of magnitude. Moreover, less formamide was required to melt the
SNP duplex on-chip due to the higher stringency of hybridization in the presence of an applied
electric field. Assay regeneration was also possible enabling three cycles of transduction prior to
degradation of the interfacial chemistry. Chapter 5 also explores the applicability of the on-chip
assay for analyses of real nucleic acid samples as might be encountered in clinical or pathogen
analysis. The work presented in Chapters 2-4 considered transduction of short, dye labeled
nucleic acid targets. Although such analytes are integral to assay development and optimization,
these oligonucleotides are not representative of real-world samples. Most nucleic acid targets of
interest such as mRNA or genomic DNA are often greater than ca. 100 bases in length. Many
ensemble assays including the one described herein, require amplification steps prior to
transduction and target strands are not intrinsically labeled with fluorescent dye. To demonstrate
application of the solid-phase QD-FRET assay to real sample analysis, a sandwich assay
approach was implemented in-channel. Short nucleic acid probes were first hybridized to a
longer nucleic acid target generating a duplex with an overhang. A reporter oligonucleotide
tagged with A647 subsequently hybridized with the overhang enabling FRET from the
immobilized QD. Despite the larger donor-acceptor distance, the spatial measurement
demonstrated no loss in sensitivity or detection limits. This can be understood by considering
that even a weak FRET signal above background can be translated to a spatial measurement.
Furthermore, the lower hybridization efficiency of the longer targets to the short immobilized
probes resulted in longer spatial profiles, resulting in the improvement of sensitivity. SNP
discrimination was also possible in this format, and was achieved in assays done using complex
matrices consisting of a large excess of salmon sperm DNA and BSA. Integration of highly
efficient isothermal amplification methods with the on-chip transduction is demonstrated in
Chapter 5 and may ultimately provide a robust, POC assay platform for on-demand nucleic acid
diagnostics.
64
On-Chip Transduction of Nucleic Acid Hybridization 2Using Spatial Profiles of Immobilized Quantum Dots and Fluorescence Resonance Energy Transfer
The results and data presented herein have been published and can be found in the citation
below. The interfacial assay chemistry and chip-based assembly was designed and optimized by
AJT. Solution based FRET experiments and initial selectivity experiments were designed,
analyzed and interpreted by AJT. MON’s expertise in microfluidics enabled outstanding
contribution to design, interpretation and analysis in quantitative hybridization experiments.
MON also contributed toward optimization of conditions for 3BPM selectivity along with
interpretation of the data. CHV is thanked for collecting data in complex matrices and WRA’s
contributions to quantitative data analysis in spatial based transduction and FRET modelling
were invaluable.
Tavares, A.J.; Noor, M.O.; Vannoy, C.H.; Algar, W.R.; Krull, U.J., Anal. Chem. 2011,
84, 312-319.
2.1 Introduction The success of solid-phase QD-FRET assays on glass beads and optical fibers motivated efforts
toward miniaturization of such assays into an electrokinetically controlled microfluidic chip. Fast
reaction kinetics, minimal reagent consumption, robustness, and portability are some of the
advantages microfluidics offers towards bioanalysis. Given that the QD-FRET transduction
mechanism for nucleic acid hybridization was amenable to miniaturization, this offered ease of
integration of assays with the chip based format. The initial challenge was finding a suitable
immobilization chemistry to offer a selective and stable interfacial recognition element in the
presence of EOF and EPF.
In Chapter 2, a solid-phase strategy for the transduction of nucleic acid hybridization using
immobilized QDs and FRET in an electrokinetically controlled microfluidic chip is described. A
schematic of the design is displayed in Figure 11. Commercial streptavidin coated green-emitting
CdSe/ZnS QDs (peak PL ca. 525 nm) were delivered into microfluidic channels by
electroosmotic flow (EOF). The glass surface of a glass-polydimethylsiloxane (PDMS)
microfluidic chip was derivatized with biotin for immobilization of QDs by the streptavidin-
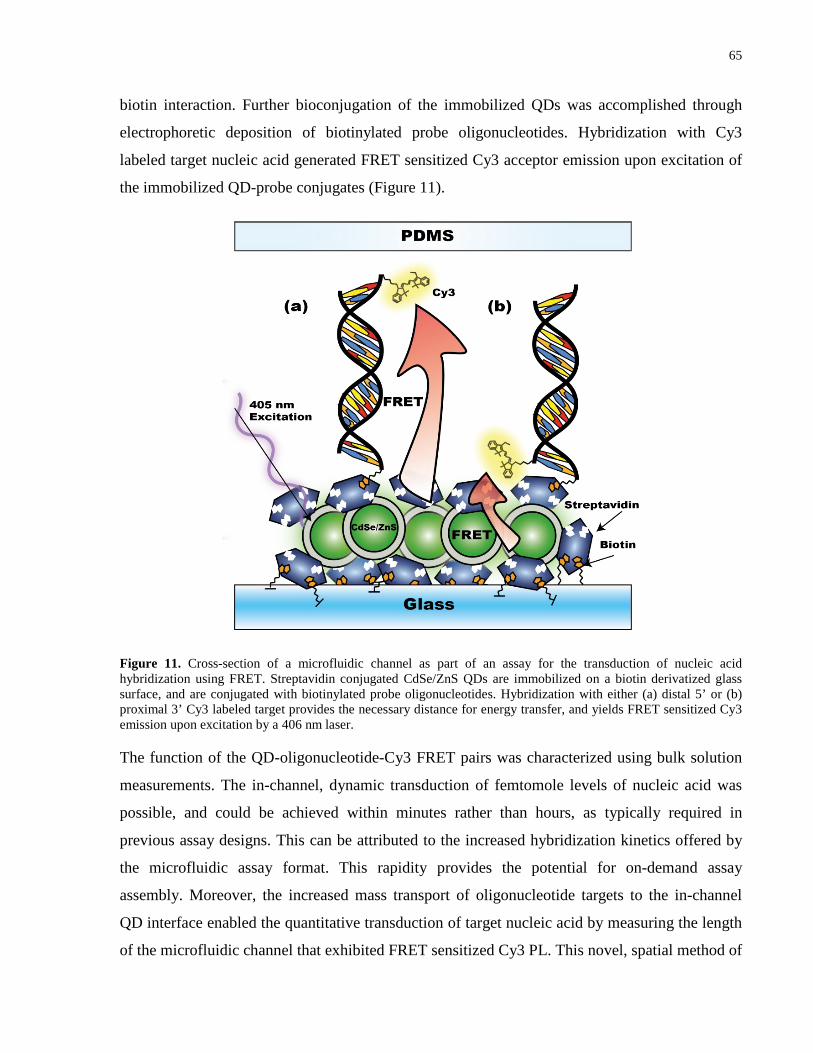
65
biotin interaction. Further bioconjugation of the immobilized QDs was accomplished through
electrophoretic deposition of biotinylated probe oligonucleotides. Hybridization with Cy3
labeled target nucleic acid generated FRET sensitized Cy3 acceptor emission upon excitation of
the immobilized QD-probe conjugates (Figure 11).
Figure 11. Cross-section of a microfluidic channel as part of an assay for the transduction of nucleic acid hybridization using FRET. Streptavidin conjugated CdSe/ZnS QDs are immobilized on a biotin derivatized glass surface, and are conjugated with biotinylated probe oligonucleotides. Hybridization with either (a) distal 5’ or (b) proximal 3’ Cy3 labeled target provides the necessary distance for energy transfer, and yields FRET sensitized Cy3 emission upon excitation by a 406 nm laser.
The function of the QD-oligonucleotide-Cy3 FRET pairs was characterized using bulk solution
measurements. The in-channel, dynamic transduction of femtomole levels of nucleic acid was
possible, and could be achieved within minutes rather than hours, as typically required in
previous assay designs. This can be attributed to the increased hybridization kinetics offered by
the microfluidic assay format. This rapidity provides the potential for on-demand assay
assembly. Moreover, the increased mass transport of oligonucleotide targets to the in-channel
QD interface enabled the quantitative transduction of target nucleic acid by measuring the length
of the microfluidic channel that exhibited FRET sensitized Cy3 PL. This novel, spatial method of
66
concentration analysis is in contrast to virtually all other QD and FRET methods, which rely
solely on PL intensities for quantification.
2.2 Experimental Section Detailed experimental procedures, materials and reagents, buffers, and a description of the
instrumentation used are given in Appendix 1.
2.2.1 Preparation of QD-Probe Conjugates and Solution Hybridization Experiments.
Oligonucleotide sequences used in the assay are listed in Table 2. The SMN1 sequence is
diagnostic of spinal muscular atrophy. Streptavidin (SAv) coated QDs (SAv-QDs) were mixed
with a 10-fold excess of biotinylated SMN1 probe in tris-borate (TB) buffer, agitated using a
vortex mixer, and placed on a shaker for 2-3 h. The SAv-QD-probe conjugates were purified
from excess oligonucleotides by centrifugation twice using an Amicon Ultra-0.5, Ultracel-50
Membrane, 50 kDa centrifugal filter (Millipore Corporation, Billerica, MA) at 8000 RPM. These
were then resuspended in TB buffer. Purified SAv-QD-probe conjugates were mixed with fully
complementary target oligonucleotides labeled with Cy3 at either the 3’ or 5’ end, which are
referred to throughout the text as FC-P TGT (i.e., proximal) and FC-D TGT (distal),
respectively. The solutions were agitated using a vortex mixer and placed on a shaker for 24 h;
the final concentration of QDs in the hybridization samples was 50 nM. The PL of the samples
was measured at both 12 and 24 h, and no changes in FRET intensities were visible after 12 h
within experimental precision. For all steady-state measurements, the samples were excited at
406 nm and the resulting PL was scanned from 450 - 700 nm.
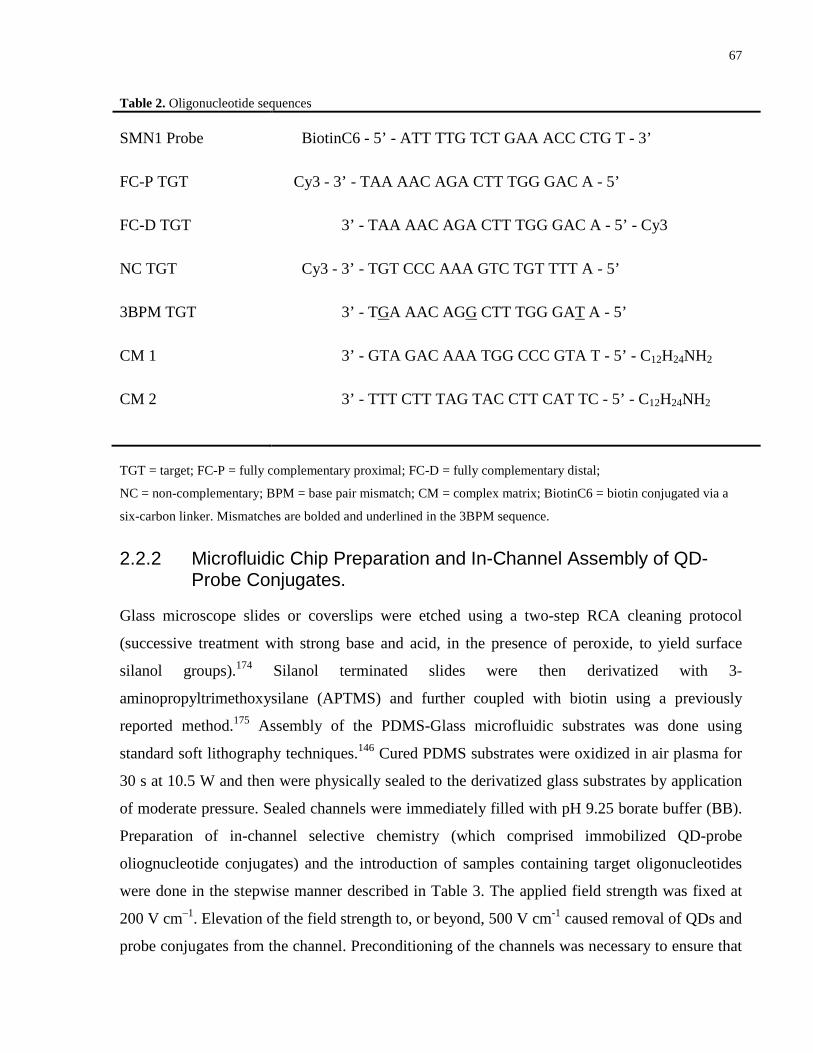
67
Table 2. Oligonucleotide sequences
SMN1 Probe
FC-P TGT
FC-D TGT
NC TGT
3BPM TGT
CM 1
CM 2
BiotinC6 - 5’ - ATT TTG TCT GAA ACC CTG T - 3’
Cy3 - 3’ - TAA AAC AGA CTT TGG GAC A - 5’
3’ - TAA AAC AGA CTT TGG GAC A - 5’ - Cy3
Cy3 - 3’ - TGT CCC AAA GTC TGT TTT A - 5’
3’ - TGA AAC AGG CTT TGG GAT A - 5’
3’ - GTA GAC AAA TGG CCC GTA T - 5’ - C12H24NH2
3’ - TTT CTT TAG TAC CTT CAT TC - 5’ - C12H24NH2
TGT = target; FC-P = fully complementary proximal; FC-D = fully complementary distal;
NC = non-complementary; BPM = base pair mismatch; CM = complex matrix; BiotinC6 = biotin conjugated via a
six-carbon linker. Mismatches are bolded and underlined in the 3BPM sequence.
2.2.2 Microfluidic Chip Preparation and In-Channel Assembly of QD-Probe Conjugates.
Glass microscope slides or coverslips were etched using a two-step RCA cleaning protocol
(successive treatment with strong base and acid, in the presence of peroxide, to yield surface
silanol groups).174 Silanol terminated slides were then derivatized with 3-
aminopropyltrimethoxysilane (APTMS) and further coupled with biotin using a previously
reported method.175 Assembly of the PDMS-Glass microfluidic substrates was done using
standard soft lithography techniques.146 Cured PDMS substrates were oxidized in air plasma for
30 s at 10.5 W and then were physically sealed to the derivatized glass substrates by application
of moderate pressure. Sealed channels were immediately filled with pH 9.25 borate buffer (BB).
Preparation of in-channel selective chemistry (which comprised immobilized QD-probe
oliognucleotide conjugates) and the introduction of samples containing target oligonucleotides
were done in the stepwise manner described in Table 3. The applied field strength was fixed at
200 V cm–1. Elevation of the field strength to, or beyond, 500 V cm-1 caused removal of QDs and
probe conjugates from the channel. Preconditioning of the channels was necessary to ensure that
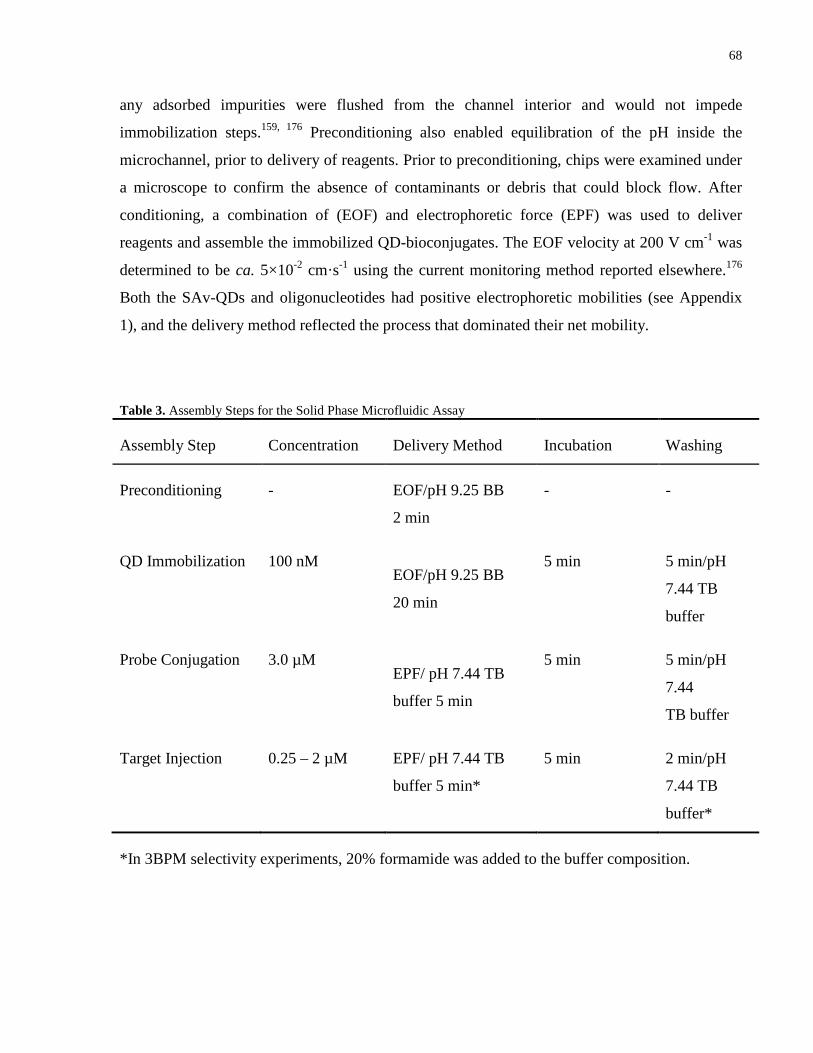
68
any adsorbed impurities were flushed from the channel interior and would not impede
immobilization steps.159, 176 Preconditioning also enabled equilibration of the pH inside the
microchannel, prior to delivery of reagents. Prior to preconditioning, chips were examined under
a microscope to confirm the absence of contaminants or debris that could block flow. After
conditioning, a combination of (EOF) and electrophoretic force (EPF) was used to deliver
reagents and assemble the immobilized QD-bioconjugates. The EOF velocity at 200 V cm-1 was
determined to be ca. 5×10⁻² cm·s-1 using the current monitoring method reported elsewhere.176
Both the SAv-QDs and oligonucleotides had positive electrophoretic mobilities (see Appendix
1), and the delivery method reflected the process that dominated their net mobility.
Table 3. Assembly Steps for the Solid Phase Microfluidic Assay
Assembly Step Concentration Delivery Method Incubation Washing
Preconditioning - EOF/pH 9.25 BB
2 min
- -
QD Immobilization 100 nM EOF/pH 9.25 BB
20 min
5 min 5 min/pH
7.44 TB
buffer
Probe Conjugation 3.0 µM EPF/ pH 7.44 TB
buffer 5 min
5 min 5 min/pH
7.44
TB buffer
Target Injection 0.25 – 2 µM EPF/ pH 7.44 TB
buffer 5 min*
5 min 2 min/pH
7.44 TB
buffer*
*In 3BPM selectivity experiments, 20% formamide was added to the buffer composition.
69
2.2.3 On-Chip Hybridization Experiments.
Conditions for target delivery are listed in Table 3. Field strengths were maintained at
200 V cm–1. In experiments that investigated the selective discrimination of FC and 3BPM
targets, the targets oligonucleotides were in TB buffer containing 20% v/v formamide. In these
cases, preconditioning of the channels was also done using 20% formamide in TB buffer.
For experiments that investigated the quantification of hybridization, both the applied field and
injection time were kept constant, and each concentration was measured in triplicate. The length
of a fluorescent region in a channel at any given concentration was measured from the edge of
the inlet reservoir to the position where the FRET sensitized acceptor PL signal dropped below a
threshold of 50% of the maximum Cy3 PL signal (alternative analyses are discussed later). To
determine the amount of oligonucleotide target injected, the electrophoretic mobility of the target
sequence was first calculated; Cy3 PL was monitored at a fixed point at the end of the
microfluidic channel (initially only background signal), and the amount of time needed for the
target sequence to travel the specified length (indicated by a sudden increase in signal) was
recorded as a function of applied voltage. The net mobility of the FC-D TGT was determined to
be 8.4 × 10⁻⁴ cm2 V–1 min–1. The electrophoretic mobility, concentration of the target, and the
total time for injection was then used to estimate the amount of target oligonucleotide injected.
The injection volume was estimated to be 19 nL for an injection time of 5 min under the applied
field of 200 V cm–1.
2.2.4 Data Analysis.
PL spectra from solution and on-chip experiments were background subtracted, normalized to
the peak QD PL, and a FRET ratio was calculated for each spectrum. The details of these
calculations can be found in the Appendix 1. Calculations of the spectral overlap integral and
Förster distance are also described therein. Epifluorescence images were all background
subtracted, false-colored, and the contrast optimized for viewing. These image processing steps
were not applied to the raw numerical data that was extracted from the original images and used
for quantitative analysis.
70
2.3 Results and Discussion
2.3.1 Solution Hybridization Experiments.
Prior to use in the proposed microfluidic assay format, the QD-Cy3 FRET pair was first
characterized using steady state and time resolved PL measurements in bulk solution. The
spectral overlap of the QD-Cy3 FRET pair was determined to be 3.03 × 10⁻¹⁰ mol–1 cm6 (see
Appendix 1, Eqns. A1.1-1.2, Figure A1.3), and this value is consistent with previously reported
values for similar QD donors paired with Cy3.169 The Förster distance was calculated to be
4.6 nm, which is ca. 1-1.5 nm larger than values we have previously reported for ligand-coated
QD donors and Cy3 acceptor FRET pair.169 This is ascribed to the larger quantum yield of the
polymer coated QDs.177
In order to gain insight into sensitivity and selectivity, the FRET efficiency and resistance of the
SAv-QDs to the nonspecific adsorption of nucleic acids was evaluated using solution based
measurements. In previous studies, the nonspecific adsorption of nucleic acids on thioalkyl acid
coated QDs was a prominent issue.178 This was extensively characterized, and the phenomenon
was found to be consistent with a process driven by hydrogen bonding between the nucleobases
and neutral carboxylic acid groups associated with the QD surface coating.178, 179 This issue was
resolved by physisorption of a layer of NeutrAvidin and bovine serum albumin.170 Given that the
QDs used in this study were coated with SAv, it was expected that the adsorption of NC
oligonucleotides should be minimal. However, this was not guaranteed since the SAv was
coupled to the carboxylic acid groups of an underlying amphiphilic polymer coating on the QDs.
Depending on the orientation and surface coverage of the protein on the QD, accessible
carboxylic acid groups could potentially promote nonspecific adsorption. SAv-QDs were
conjugated with nucleic acid probes and incubated with excesses of NC, FC-P, and FC-D TGTs
labeled with Cy3. The resulting PL spectra (normalized to the QD emission) are displayed in
Figure 12(a). No significant nonspecific adsorption of NC TGT was visible above the QD PL.
This result was consistent with previous observations that a layer of avidin can passivate the QD
surface.93, 168 Quantitatively analyzing the data in Figure 12(a), the FRET ratios (see Eqn. A1.5)
were 0.01, 0.1 and 0.49 for the NC, FC-D, and FC-P TGTs, respectively. Greater FRET
efficiency was noted for hybridization of the FC-P TGT compared to the FC-D TGT. This was
expected a priori since the probe sequence was conjugated to the SAv-QDs via a 5’ biotinylated
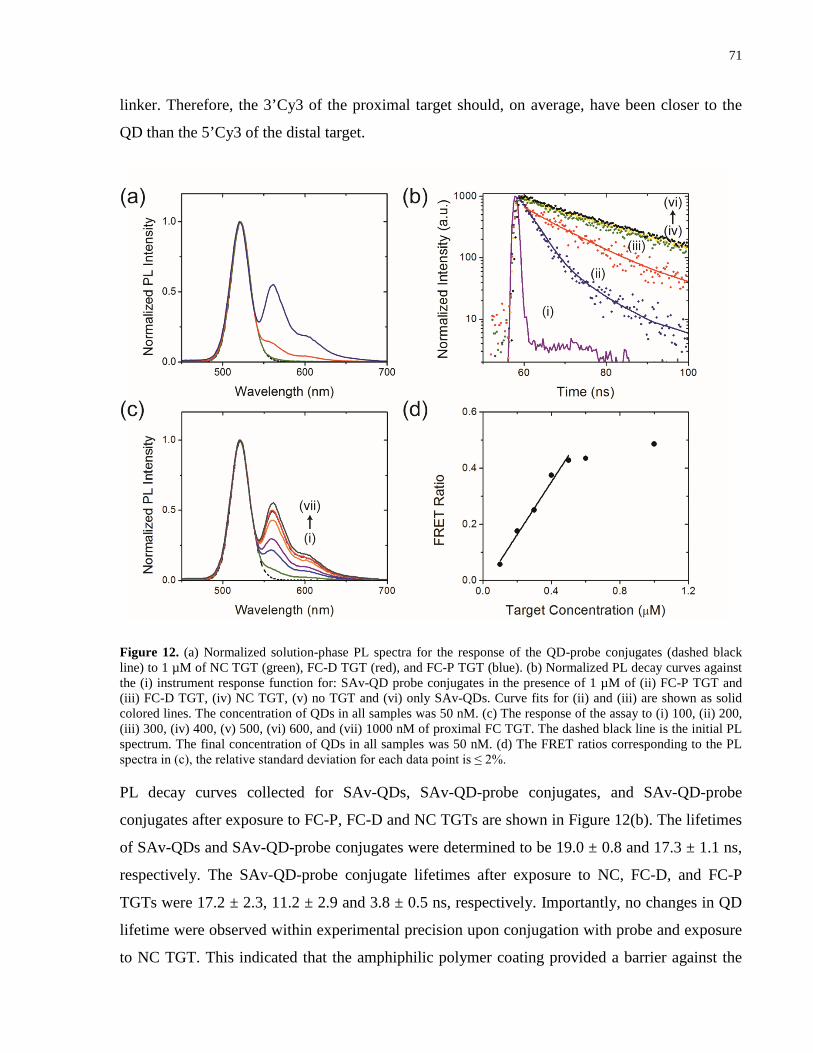
71
linker. Therefore, the 3’Cy3 of the proximal target should, on average, have been closer to the
QD than the 5’Cy3 of the distal target.
Figure 12. (a) Normalized solution-phase PL spectra for the response of the QD-probe conjugates (dashed black line) to 1 µM of NC TGT (green), FC-D TGT (red), and FC-P TGT (blue). (b) Normalized PL decay curves against the (i) instrument response function for: SAv-QD probe conjugates in the presence of 1 µM of (ii) FC-P TGT and (iii) FC-D TGT, (iv) NC TGT, (v) no TGT and (vi) only SAv-QDs. Curve fits for (ii) and (iii) are shown as solid colored lines. The concentration of QDs in all samples was 50 nM. (c) The response of the assay to (i) 100, (ii) 200, (iii) 300, (iv) 400, (v) 500, (vi) 600, and (vii) 1000 nM of proximal FC TGT. The dashed black line is the initial PL spectrum. The final concentration of QDs in all samples was 50 nM. (d) The FRET ratios corresponding to the PL spectra in (c), the relative standard deviation for each data point is ≤ 2%.
PL decay curves collected for SAv-QDs, SAv-QD-probe conjugates, and SAv-QD-probe
conjugates after exposure to FC-P, FC-D and NC TGTs are shown in Figure 12(b). The lifetimes
of SAv-QDs and SAv-QD-probe conjugates were determined to be 19.0 ± 0.8 and 17.3 ± 1.1 ns,
respectively. The SAv-QD-probe conjugate lifetimes after exposure to NC, FC-D, and FC-P
TGTs were 17.2 ± 2.3, 11.2 ± 2.9 and 3.8 ± 0.5 ns, respectively. Importantly, no changes in QD
lifetime were observed within experimental precision upon conjugation with probe and exposure
to NC TGT. This indicated that the amphiphilic polymer coating provided a barrier against the
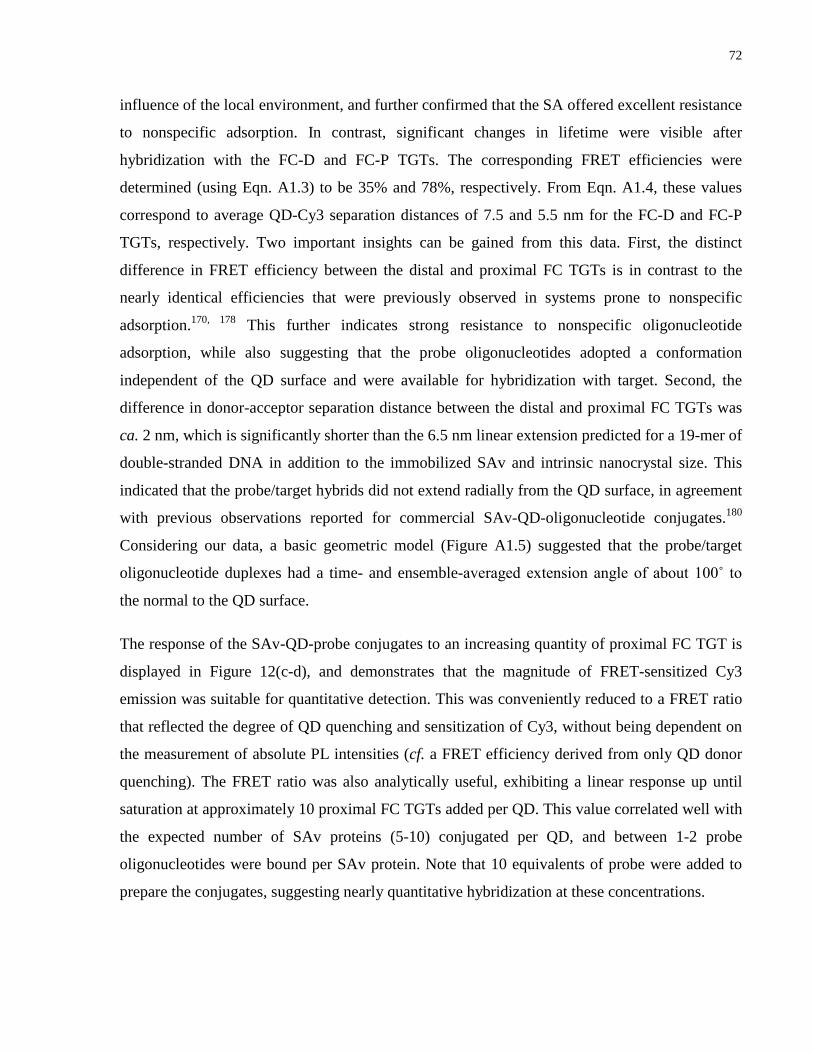
72
influence of the local environment, and further confirmed that the SA offered excellent resistance
to nonspecific adsorption. In contrast, significant changes in lifetime were visible after
hybridization with the FC-D and FC-P TGTs. The corresponding FRET efficiencies were
determined (using Eqn. A1.3) to be 35% and 78%, respectively. From Eqn. A1.4, these values
correspond to average QD-Cy3 separation distances of 7.5 and 5.5 nm for the FC-D and FC-P
TGTs, respectively. Two important insights can be gained from this data. First, the distinct
difference in FRET efficiency between the distal and proximal FC TGTs is in contrast to the
nearly identical efficiencies that were previously observed in systems prone to nonspecific
adsorption.170, 178 This further indicates strong resistance to nonspecific oligonucleotide
adsorption, while also suggesting that the probe oligonucleotides adopted a conformation
independent of the QD surface and were available for hybridization with target. Second, the
difference in donor-acceptor separation distance between the distal and proximal FC TGTs was
ca. 2 nm, which is significantly shorter than the 6.5 nm linear extension predicted for a 19-mer of
double-stranded DNA in addition to the immobilized SAv and intrinsic nanocrystal size. This
indicated that the probe/target hybrids did not extend radially from the QD surface, in agreement
with previous observations reported for commercial SAv-QD-oligonucleotide conjugates.180
Considering our data, a basic geometric model (Figure A1.5) suggested that the probe/target
oligonucleotide duplexes had a time- and ensemble-averaged extension angle of about 100˚ to
the normal to the QD surface.
The response of the SAv-QD-probe conjugates to an increasing quantity of proximal FC TGT is
displayed in Figure 12(c-d), and demonstrates that the magnitude of FRET-sensitized Cy3
emission was suitable for quantitative detection. This was conveniently reduced to a FRET ratio
that reflected the degree of QD quenching and sensitization of Cy3, without being dependent on
the measurement of absolute PL intensities (cf. a FRET efficiency derived from only QD donor
quenching). The FRET ratio was also analytically useful, exhibiting a linear response up until
saturation at approximately 10 proximal FC TGTs added per QD. This value correlated well with
the expected number of SAv proteins (5-10) conjugated per QD, and between 1-2 probe
oligonucleotides were bound per SAv protein. Note that 10 equivalents of probe were added to
prepare the conjugates, suggesting nearly quantitative hybridization at these concentrations.
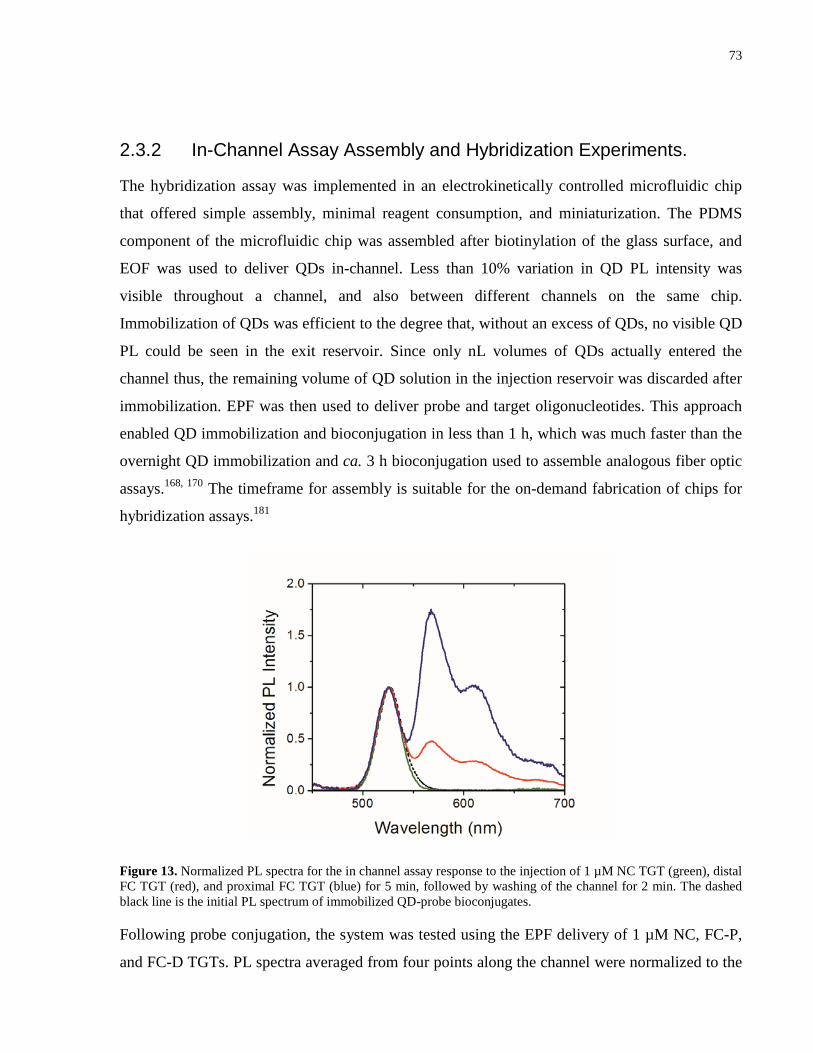
73
2.3.2 In-Channel Assay Assembly and Hybridization Experiments.
The hybridization assay was implemented in an electrokinetically controlled microfluidic chip
that offered simple assembly, minimal reagent consumption, and miniaturization. The PDMS
component of the microfluidic chip was assembled after biotinylation of the glass surface, and
EOF was used to deliver QDs in-channel. Less than 10% variation in QD PL intensity was
visible throughout a channel, and also between different channels on the same chip.
Immobilization of QDs was efficient to the degree that, without an excess of QDs, no visible QD
PL could be seen in the exit reservoir. Since only nL volumes of QDs actually entered the
channel thus, the remaining volume of QD solution in the injection reservoir was discarded after
immobilization. EPF was then used to deliver probe and target oligonucleotides. This approach
enabled QD immobilization and bioconjugation in less than 1 h, which was much faster than the
overnight QD immobilization and ca. 3 h bioconjugation used to assemble analogous fiber optic
assays.168, 170 The timeframe for assembly is suitable for the on-demand fabrication of chips for
hybridization assays.181
Figure 13. Normalized PL spectra for the in channel assay response to the injection of 1 µM NC TGT (green), distal FC TGT (red), and proximal FC TGT (blue) for 5 min, followed by washing of the channel for 2 min. The dashed black line is the initial PL spectrum of immobilized QD-probe bioconjugates.
Following probe conjugation, the system was tested using the EPF delivery of 1 µM NC, FC-P,
and FC-D TGTs. PL spectra averaged from four points along the channel were normalized to the
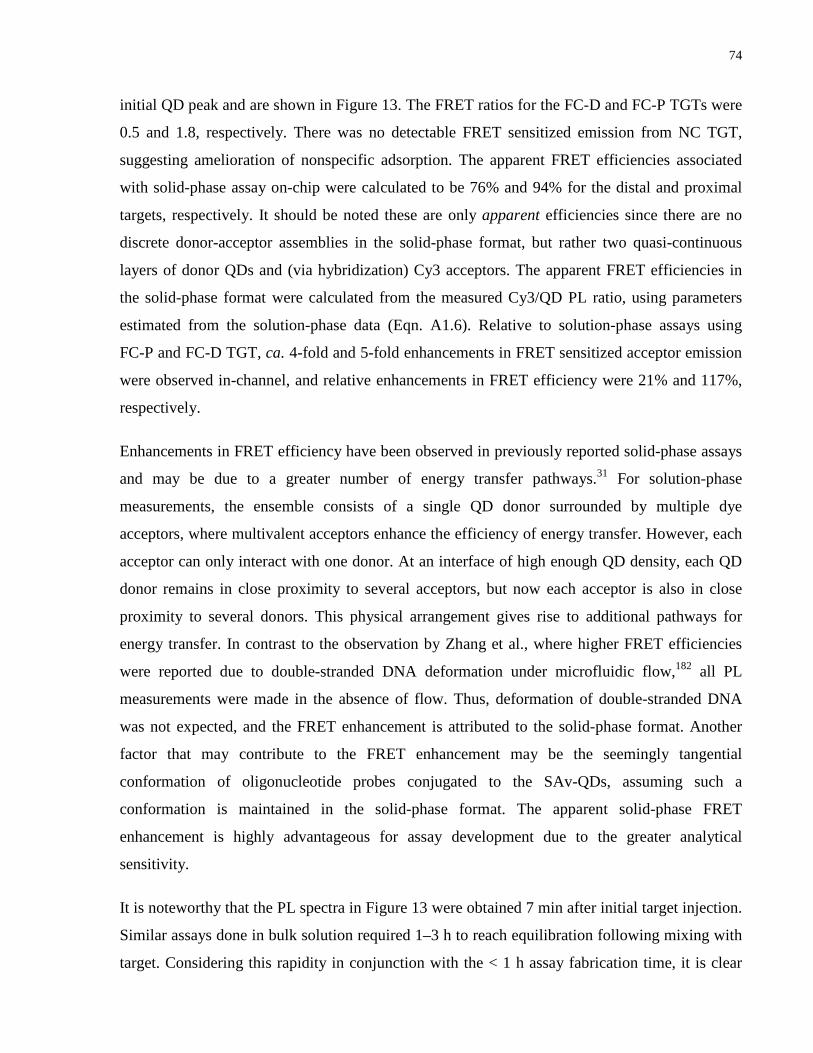
74
initial QD peak and are shown in Figure 13. The FRET ratios for the FC-D and FC-P TGTs were
0.5 and 1.8, respectively. There was no detectable FRET sensitized emission from NC TGT,
suggesting amelioration of nonspecific adsorption. The apparent FRET efficiencies associated
with solid-phase assay on-chip were calculated to be 76% and 94% for the distal and proximal
targets, respectively. It should be noted these are only apparent efficiencies since there are no
discrete donor-acceptor assemblies in the solid-phase format, but rather two quasi-continuous
layers of donor QDs and (via hybridization) Cy3 acceptors. The apparent FRET efficiencies in
the solid-phase format were calculated from the measured Cy3/QD PL ratio, using parameters
estimated from the solution-phase data (Eqn. A1.6). Relative to solution-phase assays using
FC-P and FC-D TGT, ca. 4-fold and 5-fold enhancements in FRET sensitized acceptor emission
were observed in-channel, and relative enhancements in FRET efficiency were 21% and 117%,
respectively.
Enhancements in FRET efficiency have been observed in previously reported solid-phase assays
and may be due to a greater number of energy transfer pathways.31 For solution-phase
measurements, the ensemble consists of a single QD donor surrounded by multiple dye
acceptors, where multivalent acceptors enhance the efficiency of energy transfer. However, each
acceptor can only interact with one donor. At an interface of high enough QD density, each QD
donor remains in close proximity to several acceptors, but now each acceptor is also in close
proximity to several donors. This physical arrangement gives rise to additional pathways for
energy transfer. In contrast to the observation by Zhang et al., where higher FRET efficiencies
were reported due to double-stranded DNA deformation under microfluidic flow,182 all PL
measurements were made in the absence of flow. Thus, deformation of double-stranded DNA
was not expected, and the FRET enhancement is attributed to the solid-phase format. Another
factor that may contribute to the FRET enhancement may be the seemingly tangential
conformation of oligonucleotide probes conjugated to the SAv-QDs, assuming such a
conformation is maintained in the solid-phase format. The apparent solid-phase FRET
enhancement is highly advantageous for assay development due to the greater analytical
sensitivity.
It is noteworthy that the PL spectra in Figure 13 were obtained 7 min after initial target injection.
Similar assays done in bulk solution required 1–3 h to reach equilibration following mixing with
target. Considering this rapidity in conjunction with the < 1 h assay fabrication time, it is clear
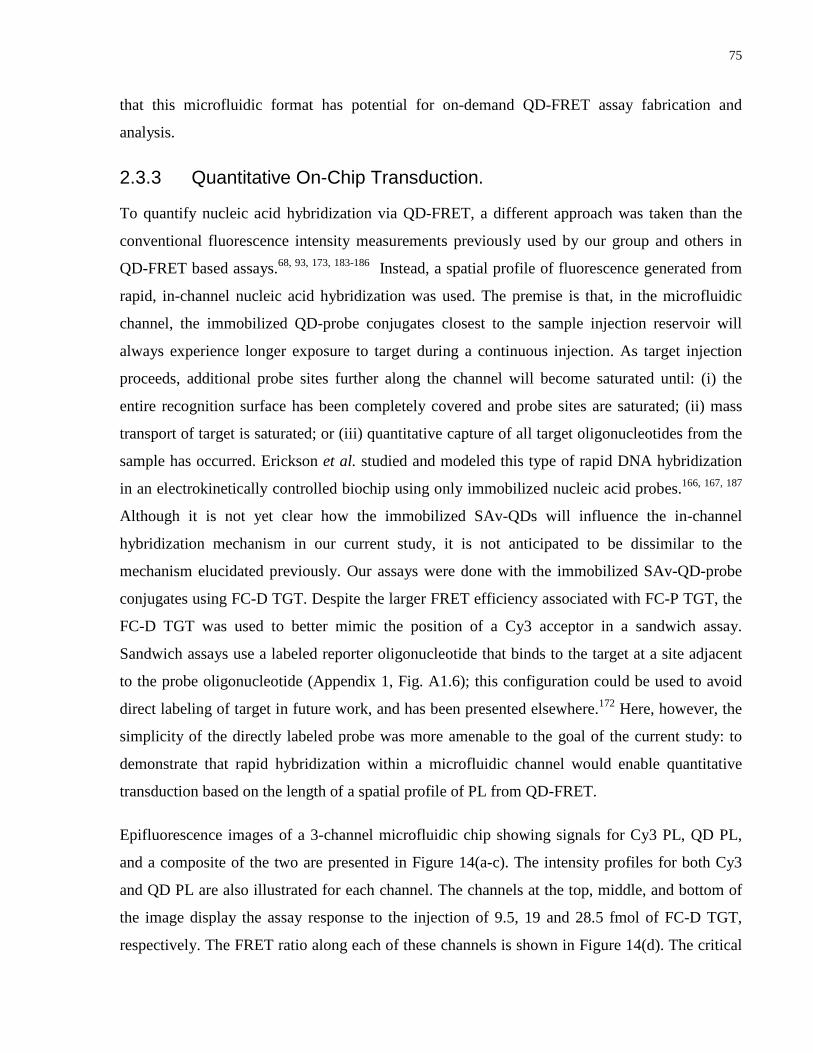
75
that this microfluidic format has potential for on-demand QD-FRET assay fabrication and
analysis.
2.3.3 Quantitative On-Chip Transduction.
To quantify nucleic acid hybridization via QD-FRET, a different approach was taken than the
conventional fluorescence intensity measurements previously used by our group and others in
QD-FRET based assays.68, 93, 173, 183-186 Instead, a spatial profile of fluorescence generated from
rapid, in-channel nucleic acid hybridization was used. The premise is that, in the microfluidic
channel, the immobilized QD-probe conjugates closest to the sample injection reservoir will
always experience longer exposure to target during a continuous injection. As target injection
proceeds, additional probe sites further along the channel will become saturated until: (i) the
entire recognition surface has been completely covered and probe sites are saturated; (ii) mass
transport of target is saturated; or (iii) quantitative capture of all target oligonucleotides from the
sample has occurred. Erickson et al. studied and modeled this type of rapid DNA hybridization
in an electrokinetically controlled biochip using only immobilized nucleic acid probes.166, 167, 187
Although it is not yet clear how the immobilized SAv-QDs will influence the in-channel
hybridization mechanism in our current study, it is not anticipated to be dissimilar to the
mechanism elucidated previously. Our assays were done with the immobilized SAv-QD-probe
conjugates using FC-D TGT. Despite the larger FRET efficiency associated with FC-P TGT, the
FC-D TGT was used to better mimic the position of a Cy3 acceptor in a sandwich assay.
Sandwich assays use a labeled reporter oligonucleotide that binds to the target at a site adjacent
to the probe oligonucleotide (Appendix 1, Fig. A1.6); this configuration could be used to avoid
direct labeling of target in future work, and has been presented elsewhere.172 Here, however, the
simplicity of the directly labeled probe was more amenable to the goal of the current study: to
demonstrate that rapid hybridization within a microfluidic channel would enable quantitative
transduction based on the length of a spatial profile of PL from QD-FRET.
Epifluorescence images of a 3-channel microfluidic chip showing signals for Cy3 PL, QD PL,
and a composite of the two are presented in Figure 14(a-c). The intensity profiles for both Cy3
and QD PL are also illustrated for each channel. The channels at the top, middle, and bottom of
the image display the assay response to the injection of 9.5, 19 and 28.5 fmol of FC-D TGT,
respectively. The FRET ratio along each of these channels is shown in Figure 14(d). The critical
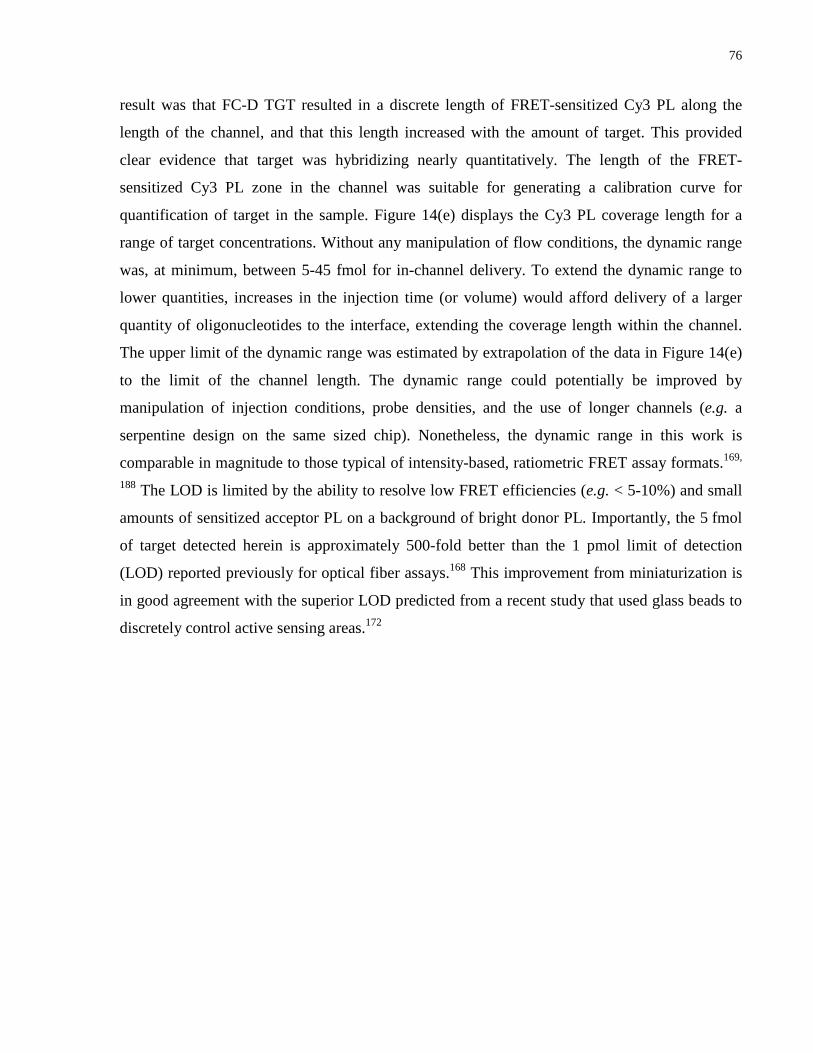
76
result was that FC-D TGT resulted in a discrete length of FRET-sensitized Cy3 PL along the
length of the channel, and that this length increased with the amount of target. This provided
clear evidence that target was hybridizing nearly quantitatively. The length of the FRET-
sensitized Cy3 PL zone in the channel was suitable for generating a calibration curve for
quantification of target in the sample. Figure 14(e) displays the Cy3 PL coverage length for a
range of target concentrations. Without any manipulation of flow conditions, the dynamic range
was, at minimum, between 5-45 fmol for in-channel delivery. To extend the dynamic range to
lower quantities, increases in the injection time (or volume) would afford delivery of a larger
quantity of oligonucleotides to the interface, extending the coverage length within the channel.
The upper limit of the dynamic range was estimated by extrapolation of the data in Figure 14(e)
to the limit of the channel length. The dynamic range could potentially be improved by
manipulation of injection conditions, probe densities, and the use of longer channels (e.g. a
serpentine design on the same sized chip). Nonetheless, the dynamic range in this work is
comparable in magnitude to those typical of intensity-based, ratiometric FRET assay formats.169,
188 The LOD is limited by the ability to resolve low FRET efficiencies (e.g. < 5-10%) and small
amounts of sensitized acceptor PL on a background of bright donor PL. Importantly, the 5 fmol
of target detected herein is approximately 500-fold better than the 1 pmol limit of detection
(LOD) reported previously for optical fiber assays.168 This improvement from miniaturization is
in good agreement with the superior LOD predicted from a recent study that used glass beads to
discretely control active sensing areas.172
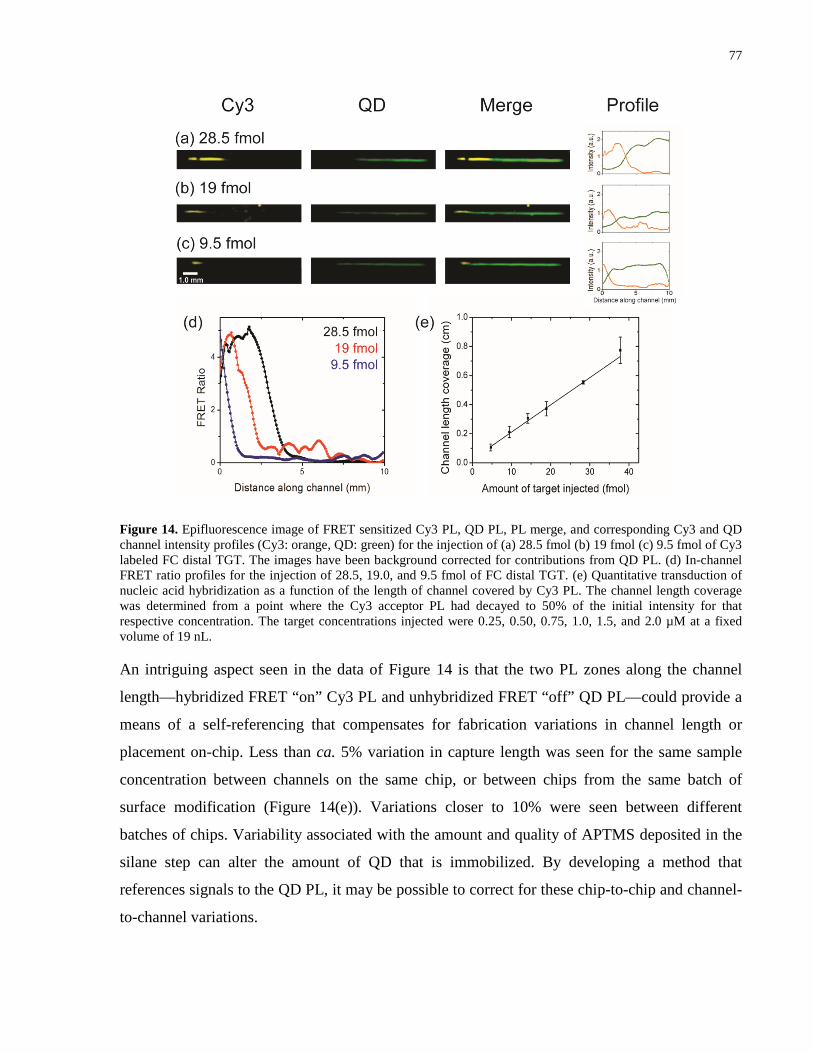
77
Figure 14. Epifluorescence image of FRET sensitized Cy3 PL, QD PL, PL merge, and corresponding Cy3 and QD channel intensity profiles (Cy3: orange, QD: green) for the injection of (a) 28.5 fmol (b) 19 fmol (c) 9.5 fmol of Cy3 labeled FC distal TGT. The images have been background corrected for contributions from QD PL. (d) In-channel FRET ratio profiles for the injection of 28.5, 19.0, and 9.5 fmol of FC distal TGT. (e) Quantitative transduction of nucleic acid hybridization as a function of the length of channel covered by Cy3 PL. The channel length coverage was determined from a point where the Cy3 acceptor PL had decayed to 50% of the initial intensity for that respective concentration. The target concentrations injected were 0.25, 0.50, 0.75, 1.0, 1.5, and 2.0 µM at a fixed volume of 19 nL.
An intriguing aspect seen in the data of Figure 14 is that the two PL zones along the channel
length—hybridized FRET “on” Cy3 PL and unhybridized FRET “off” QD PL—could provide a
means of a self-referencing that compensates for fabrication variations in channel length or
placement on-chip. Less than ca. 5% variation in capture length was seen for the same sample
concentration between channels on the same chip, or between chips from the same batch of
surface modification (Figure 14(e)). Variations closer to 10% were seen between different
batches of chips. Variability associated with the amount and quality of APTMS deposited in the
silane step can alter the amount of QD that is immobilized. By developing a method that
references signals to the QD PL, it may be possible to correct for these chip-to-chip and channel-
to-channel variations.
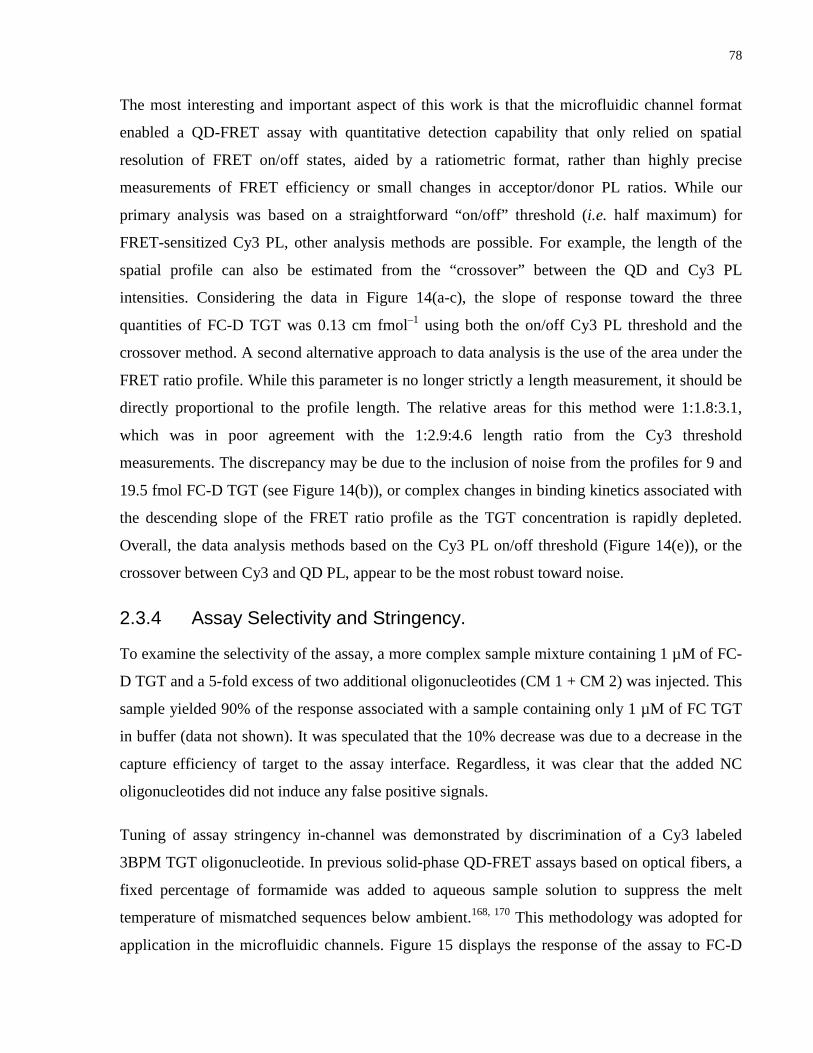
78
The most interesting and important aspect of this work is that the microfluidic channel format
enabled a QD-FRET assay with quantitative detection capability that only relied on spatial
resolution of FRET on/off states, aided by a ratiometric format, rather than highly precise
measurements of FRET efficiency or small changes in acceptor/donor PL ratios. While our
primary analysis was based on a straightforward “on/off” threshold (i.e. half maximum) for
FRET-sensitized Cy3 PL, other analysis methods are possible. For example, the length of the
spatial profile can also be estimated from the “crossover” between the QD and Cy3 PL
intensities. Considering the data in Figure 14(a-c), the slope of response toward the three
quantities of FC-D TGT was 0.13 cm fmol–1 using both the on/off Cy3 PL threshold and the
crossover method. A second alternative approach to data analysis is the use of the area under the
FRET ratio profile. While this parameter is no longer strictly a length measurement, it should be
directly proportional to the profile length. The relative areas for this method were 1:1.8:3.1,
which was in poor agreement with the 1:2.9:4.6 length ratio from the Cy3 threshold
measurements. The discrepancy may be due to the inclusion of noise from the profiles for 9 and
19.5 fmol FC-D TGT (see Figure 14(b)), or complex changes in binding kinetics associated with
the descending slope of the FRET ratio profile as the TGT concentration is rapidly depleted.
Overall, the data analysis methods based on the Cy3 PL on/off threshold (Figure 14(e)), or the
crossover between Cy3 and QD PL, appear to be the most robust toward noise.
2.3.4 Assay Selectivity and Stringency.
To examine the selectivity of the assay, a more complex sample mixture containing 1 µM of FC-
D TGT and a 5-fold excess of two additional oligonucleotides (CM 1 + CM 2) was injected. This
sample yielded 90% of the response associated with a sample containing only 1 µM of FC TGT
in buffer (data not shown). It was speculated that the 10% decrease was due to a decrease in the
capture efficiency of target to the assay interface. Regardless, it was clear that the added NC
oligonucleotides did not induce any false positive signals.
Tuning of assay stringency in-channel was demonstrated by discrimination of a Cy3 labeled
3BPM TGT oligonucleotide. In previous solid-phase QD-FRET assays based on optical fibers, a
fixed percentage of formamide was added to aqueous sample solution to suppress the melt
temperature of mismatched sequences below ambient.168, 170 This methodology was adopted for
application in the microfluidic channels. Figure 15 displays the response of the assay to FC-D
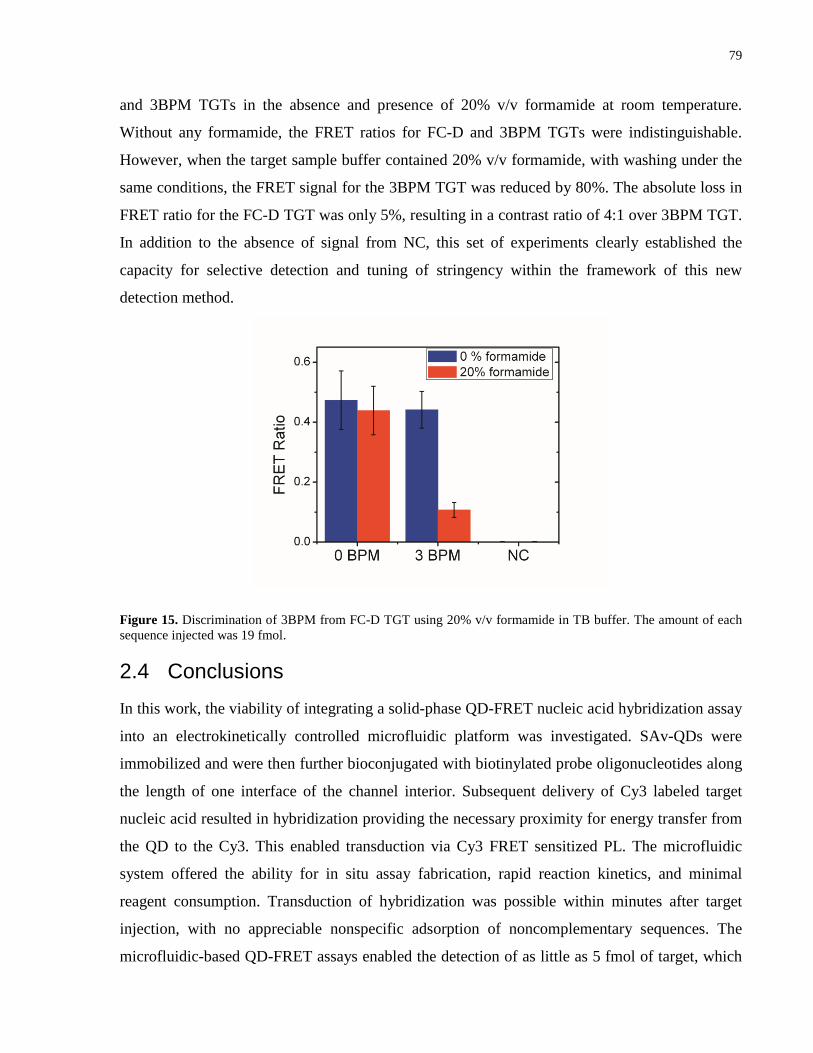
79
and 3BPM TGTs in the absence and presence of 20% v/v formamide at room temperature.
Without any formamide, the FRET ratios for FC-D and 3BPM TGTs were indistinguishable.
However, when the target sample buffer contained 20% v/v formamide, with washing under the
same conditions, the FRET signal for the 3BPM TGT was reduced by 80%. The absolute loss in
FRET ratio for the FC-D TGT was only 5%, resulting in a contrast ratio of 4:1 over 3BPM TGT.
In addition to the absence of signal from NC, this set of experiments clearly established the
capacity for selective detection and tuning of stringency within the framework of this new
detection method.
Figure 15. Discrimination of 3BPM from FC-D TGT using 20% v/v formamide in TB buffer. The amount of each sequence injected was 19 fmol.
2.4 Conclusions In this work, the viability of integrating a solid-phase QD-FRET nucleic acid hybridization assay
into an electrokinetically controlled microfluidic platform was investigated. SAv-QDs were
immobilized and were then further bioconjugated with biotinylated probe oligonucleotides along
the length of one interface of the channel interior. Subsequent delivery of Cy3 labeled target
nucleic acid resulted in hybridization providing the necessary proximity for energy transfer from
the QD to the Cy3. This enabled transduction via Cy3 FRET sensitized PL. The microfluidic
system offered the ability for in situ assay fabrication, rapid reaction kinetics, and minimal
reagent consumption. Transduction of hybridization was possible within minutes after target
injection, with no appreciable nonspecific adsorption of noncomplementary sequences. The
microfluidic-based QD-FRET assays enabled the detection of as little as 5 fmol of target, which
80
was a 500-fold improvement from previous solid-phase assays developed by our group.
Concurrently, detection times of these assays were reduced from hours to minutes. The
robustness of the assay was further tested in a complex matrix containing a 5-fold excess of two
additional sequences and recovery of up to 90% of target relative to a purified sample was
demonstrated. Discrimination against a sequence containing a 3BPM was possible with a
contrast ratio of 4:1. Hybridization kinetics were sufficiently rapid that transport of target
oligonucleotides to the interface enabled the quantitative capture of target by measuring the
length of the FRET-sensitized PL zone within the channel interior. Further optimization of this
novel quantitative hybridization method should enable spatial and multiparametric detection of
nucleic acids in future studies. This work provides an important foundation for the future
development of solid-phase QD-FRET hybridization assays with microfluidics that are well
suited to multiplexing formats.
81
On-Chip Multiplexed Solid-Phase Nucleic Acid 3Hybridization Assay Using Spatial Profiles of Immobilized Quantum Dots and Fluorescence Resonance Energy Transfer
The data presented in Chapter 3 has been published prior to formatting this thesis and can be
found in the citation below. While the first report of this work was developed by AJT, MON
designed and optimized the in-channel assay toward multiplexed analysis in all aspects from QD
immobilization density, FRET pairs, and conditions for concurrent target transduction. AJT and
MON designed, analyzed and interpreted all single-colour quantitative hybridization experiments
in-channel. MON designed and analyzed all selectivity experiments. MON and AJT developed
and interpreted solution hybridization experiments to determine differences in QD probe loading
capacities as to provide insight into differences in spatial responses from the two targets.
Noor, M.O.; Tavares, A.J.; Krull, U.J., Anal. Chim. Acta 2013, 788, 148-157.
3.1 Introduction
Building on Chapter 2 where a solid-phase nucleic acid hybridization method using a novel
spatial detection strategy was presented, the work was extended to immobilize a mixture of QDs
to acheive multiplexing capacity. Earlier solid-phase assays reported by our group demonstrated
detection of up to four targets in a given sample using a single excitation source. It was
postulated that immobilization of two colours of QDs on a microfluidic chip would provide for
multiplexed detection using the spatial detection method for quantification.
Only a limited number of studies have reported the integration of QD-based multiplexed solid-
phase assays within microfluidic systems 189, 190. Typically QDs have been used as labels, and the
fluidic network offers containment of sample solution to achieve proximity with selective
chemistry that is immobilized on the surface of microsphere beads. For example, Jokerst and
coworkers 190 reported on the implementation of sandwich-based multiplexed immunoassay
within a microfluidic chip using multicolor QDs as labels for the detection of three cancer
markers. The selective chemistry was immobilized on agarose beads and captured within a chip
using microstructures, where the spatial registration of the agarose beads provided multiplexing
capability. In another example, Hu and coworkers 189 used microfluidics for surface patterning of
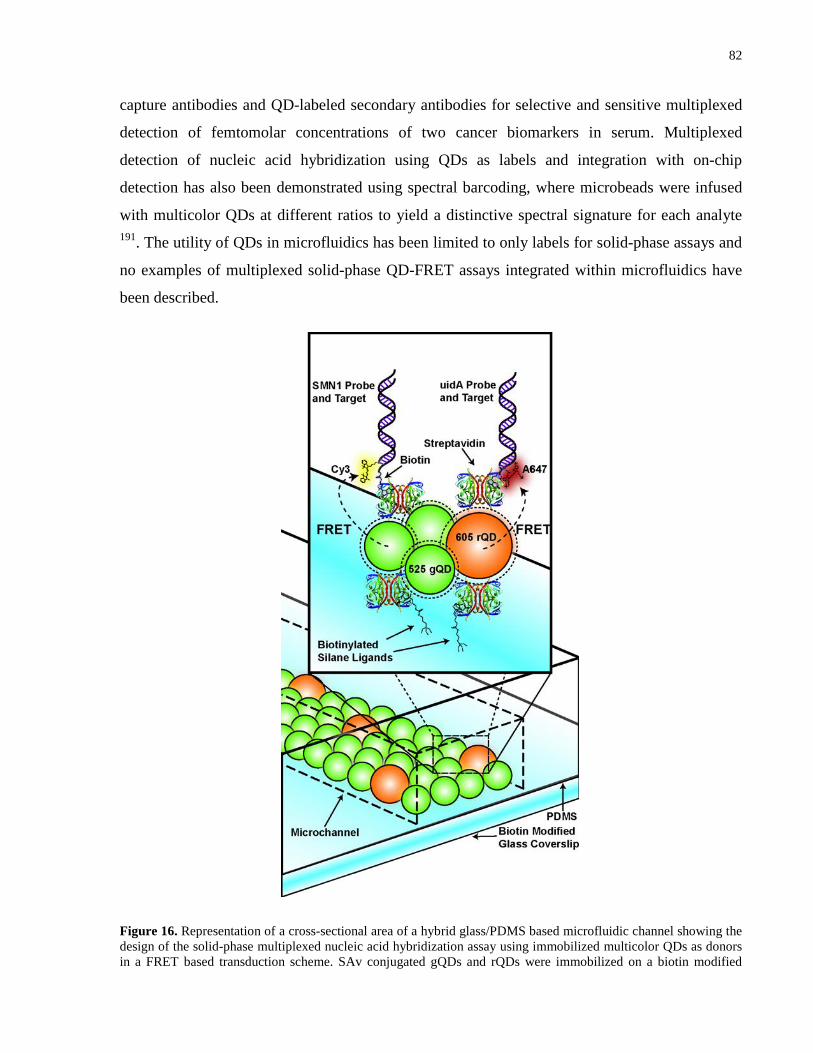
82
capture antibodies and QD-labeled secondary antibodies for selective and sensitive multiplexed
detection of femtomolar concentrations of two cancer biomarkers in serum. Multiplexed
detection of nucleic acid hybridization using QDs as labels and integration with on-chip
detection has also been demonstrated using spectral barcoding, where microbeads were infused
with multicolor QDs at different ratios to yield a distinctive spectral signature for each analyte 191. The utility of QDs in microfluidics has been limited to only labels for solid-phase assays and
no examples of multiplexed solid-phase QD-FRET assays integrated within microfluidics have
been described.
Figure 16. Representation of a cross-sectional area of a hybrid glass/PDMS based microfluidic channel showing the design of the solid-phase multiplexed nucleic acid hybridization assay using immobilized multicolor QDs as donors in a FRET based transduction scheme. SAv conjugated gQDs and rQDs were immobilized on a biotin modified
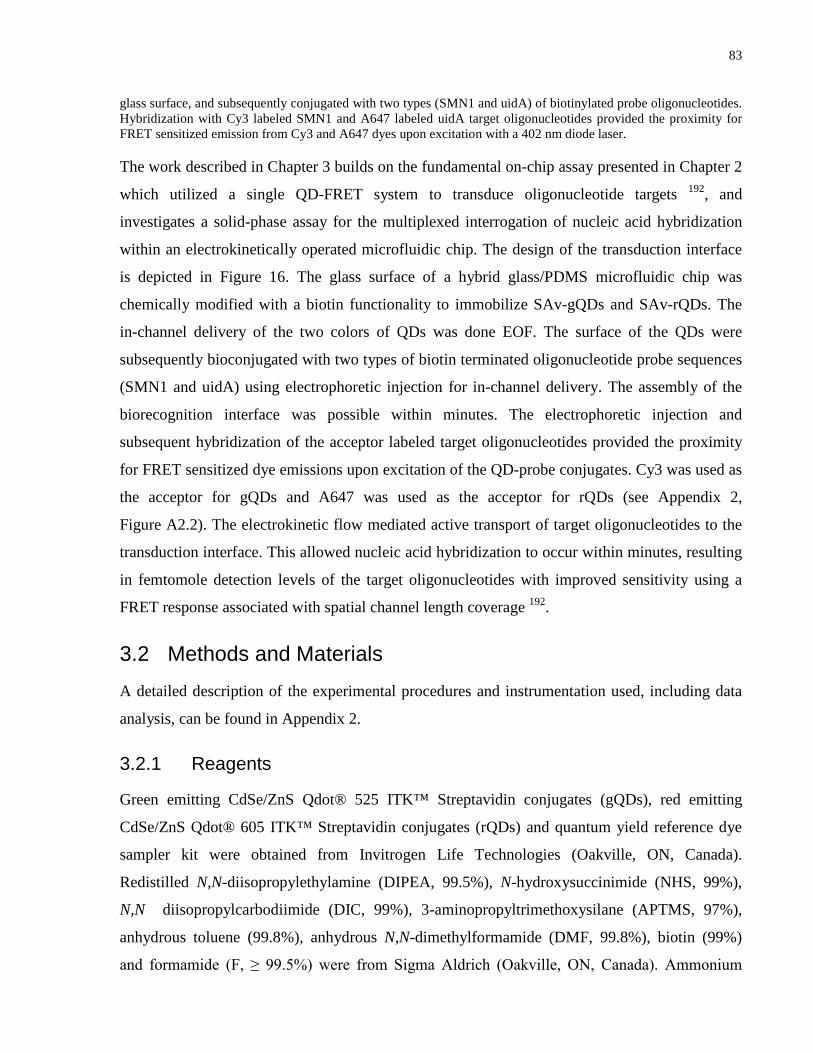
83
glass surface, and subsequently conjugated with two types (SMN1 and uidA) of biotinylated probe oligonucleotides. Hybridization with Cy3 labeled SMN1 and A647 labeled uidA target oligonucleotides provided the proximity for FRET sensitized emission from Cy3 and A647 dyes upon excitation with a 402 nm diode laser.
The work described in Chapter 3 builds on the fundamental on-chip assay presented in Chapter 2
which utilized a single QD-FRET system to transduce oligonucleotide targets 192, and
investigates a solid-phase assay for the multiplexed interrogation of nucleic acid hybridization
within an electrokinetically operated microfluidic chip. The design of the transduction interface
is depicted in Figure 16. The glass surface of a hybrid glass/PDMS microfluidic chip was
chemically modified with a biotin functionality to immobilize SAv-gQDs and SAv-rQDs. The
in-channel delivery of the two colors of QDs was done EOF. The surface of the QDs were
subsequently bioconjugated with two types of biotin terminated oligonucleotide probe sequences
(SMN1 and uidA) using electrophoretic injection for in-channel delivery. The assembly of the
biorecognition interface was possible within minutes. The electrophoretic injection and
subsequent hybridization of the acceptor labeled target oligonucleotides provided the proximity
for FRET sensitized dye emissions upon excitation of the QD-probe conjugates. Cy3 was used as
the acceptor for gQDs and A647 was used as the acceptor for rQDs (see Appendix 2,
Figure A2.2). The electrokinetic flow mediated active transport of target oligonucleotides to the
transduction interface. This allowed nucleic acid hybridization to occur within minutes, resulting
in femtomole detection levels of the target oligonucleotides with improved sensitivity using a
FRET response associated with spatial channel length coverage 192.
3.2 Methods and Materials A detailed description of the experimental procedures and instrumentation used, including data
analysis, can be found in Appendix 2.
3.2.1 Reagents
Green emitting CdSe/ZnS Qdot® 525 ITK™ Streptavidin conjugates (gQDs), red emitting
CdSe/ZnS Qdot® 605 ITK™ Streptavidin conjugates (rQDs) and quantum yield reference dye
sampler kit were obtained from Invitrogen Life Technologies (Oakville, ON, Canada).
Redistilled N,N-diisopropylethylamine (DIPEA, 99.5%), N-hydroxysuccinimide (NHS, 99%),
N,N diisopropylcarbodiimide (DIC, 99%), 3-aminopropyltrimethoxysilane (APTMS, 97%),
anhydrous toluene (99.8%), anhydrous N,N-dimethylformamide (DMF, 99.8%), biotin (99%)
and formamide (F, ≥ 99.5%) were from Sigma Aldrich (Oakville, ON, Canada). Ammonium
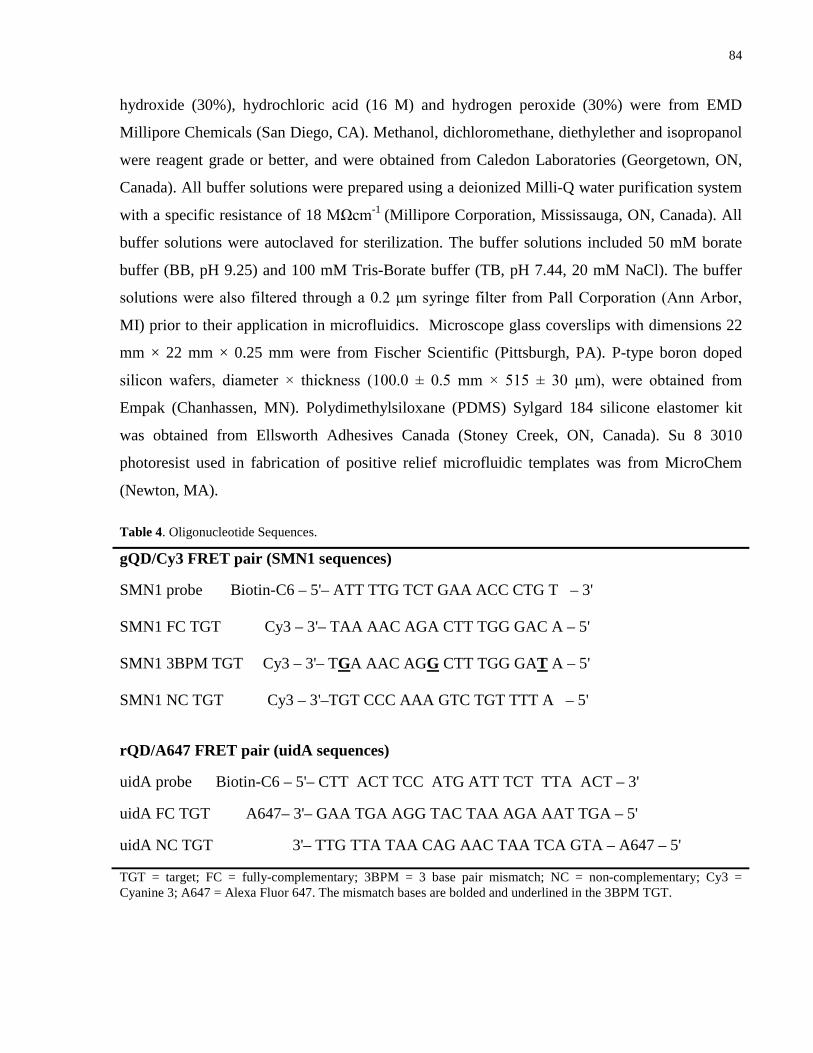
84
hydroxide (30%), hydrochloric acid (16 M) and hydrogen peroxide (30%) were from EMD
Millipore Chemicals (San Diego, CA). Methanol, dichloromethane, diethylether and isopropanol
were reagent grade or better, and were obtained from Caledon Laboratories (Georgetown, ON,
Canada). All buffer solutions were prepared using a deionized Milli-Q water purification system
with a specific resistance of 18 MΩcm-1 (Millipore Corporation, Mississauga, ON, Canada). All
buffer solutions were autoclaved for sterilization. The buffer solutions included 50 mM borate
buffer (BB, pH 9.25) and 100 mM Tris-Borate buffer (TB, pH 7.44, 20 mM NaCl). The buffer
solutions were also filtered through a 0.2 μm syringe filter from Pall Corporation (Ann Arbor,
MI) prior to their application in microfluidics. Microscope glass coverslips with dimensions 22
mm × 22 mm × 0.25 mm were from Fischer Scientific (Pittsburgh, PA). P-type boron doped
silicon wafers, diameter × thickness (100.0 ± 0.5 mm × 515 ± 30 μm), were obtained from
Empak (Chanhassen, MN). Polydimethylsiloxane (PDMS) Sylgard 184 silicone elastomer kit
was obtained from Ellsworth Adhesives Canada (Stoney Creek, ON, Canada). Su 8 3010
photoresist used in fabrication of positive relief microfluidic templates was from MicroChem
(Newton, MA).
Table 4. Oligonucleotide Sequences.
gQD/Cy3 FRET pair (SMN1 sequences)
SMN1 probe Biotin-C6 – 5'– ATT TTG TCT GAA ACC CTG T – 3' SMN1 FC TGT Cy3 – 3'– TAA AAC AGA CTT TGG GAC A – 5' SMN1 3BPM TGT Cy3 – 3'– TGA AAC AGG CTT TGG GAT A – 5' SMN1 NC TGT Cy3 – 3'–TGT CCC AAA GTC TGT TTT A – 5'
rQD/A647 FRET pair (uidA sequences)
uidA probe Biotin-C6 – 5'– CTT ACT TCC ATG ATT TCT TTA ACT – 3'
uidA FC TGT A647– 3'– GAA TGA AGG TAC TAA AGA AAT TGA – 5'
uidA NC TGT 3'– TTG TTA TAA CAG AAC TAA TCA GTA – A647 – 5'
TGT = target; FC = fully-complementary; 3BPM = 3 base pair mismatch; NC = non-complementary; Cy3 = Cyanine 3; A647 = Alexa Fluor 647. The mismatch bases are bolded and underlined in the 3BPM TGT.
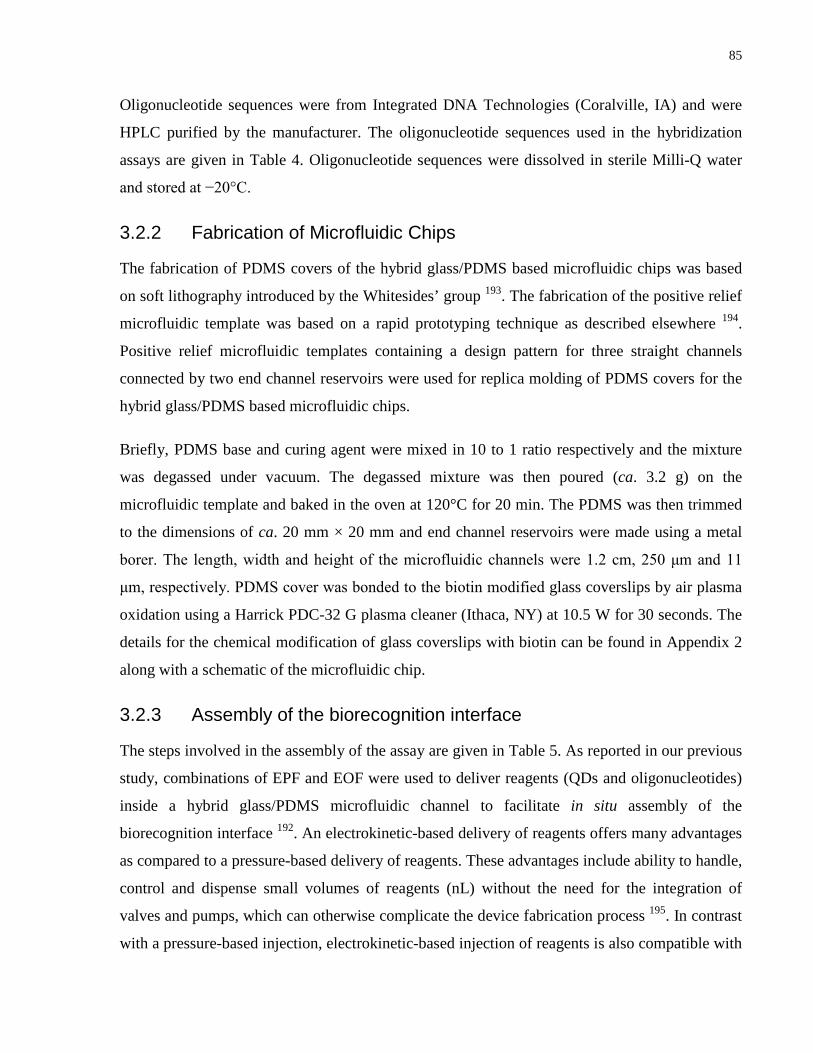
85
Oligonucleotide sequences were from Integrated DNA Technologies (Coralville, IA) and were
HPLC purified by the manufacturer. The oligonucleotide sequences used in the hybridization
assays are given in Table 4. Oligonucleotide sequences were dissolved in sterile Milli-Q water
and stored at −20°C.
3.2.2 Fabrication of Microfluidic Chips
The fabrication of PDMS covers of the hybrid glass/PDMS based microfluidic chips was based
on soft lithography introduced by the Whitesides’ group 193. The fabrication of the positive relief
microfluidic template was based on a rapid prototyping technique as described elsewhere 194.
Positive relief microfluidic templates containing a design pattern for three straight channels
connected by two end channel reservoirs were used for replica molding of PDMS covers for the
hybrid glass/PDMS based microfluidic chips.
Briefly, PDMS base and curing agent were mixed in 10 to 1 ratio respectively and the mixture
was degassed under vacuum. The degassed mixture was then poured (ca. 3.2 g) on the
microfluidic template and baked in the oven at 120°C for 20 min. The PDMS was then trimmed
to the dimensions of ca. 20 mm × 20 mm and end channel reservoirs were made using a metal
borer. The length, width and height of the microfluidic channels were 1.2 cm, 250 μm and 11
μm, respectively. PDMS cover was bonded to the biotin modified glass coverslips by air plasma
oxidation using a Harrick PDC-32 G plasma cleaner (Ithaca, NY) at 10.5 W for 30 seconds. The
details for the chemical modification of glass coverslips with biotin can be found in Appendix 2
along with a schematic of the microfluidic chip.
3.2.3 Assembly of the biorecognition interface
The steps involved in the assembly of the assay are given in Table 5. As reported in our previous
study, combinations of EPF and EOF were used to deliver reagents (QDs and oligonucleotides)
inside a hybrid glass/PDMS microfluidic channel to facilitate in situ assembly of the
biorecognition interface 192. An electrokinetic-based delivery of reagents offers many advantages
as compared to a pressure-based delivery of reagents. These advantages include ability to handle,
control and dispense small volumes of reagents (nL) without the need for the integration of
valves and pumps, which can otherwise complicate the device fabrication process 195. In contrast
with a pressure-based injection, electrokinetic-based injection of reagents is also compatible with
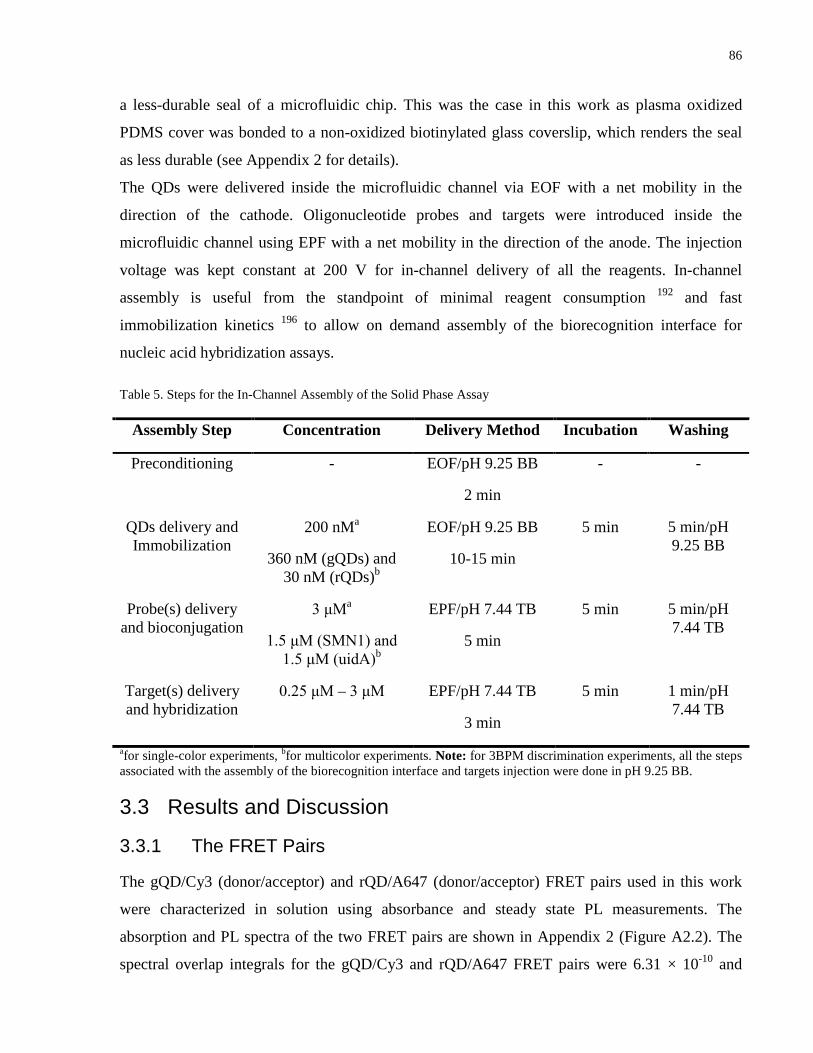
86
a less-durable seal of a microfluidic chip. This was the case in this work as plasma oxidized
PDMS cover was bonded to a non-oxidized biotinylated glass coverslip, which renders the seal
as less durable (see Appendix 2 for details).
The QDs were delivered inside the microfluidic channel via EOF with a net mobility in the
direction of the cathode. Oligonucleotide probes and targets were introduced inside the
microfluidic channel using EPF with a net mobility in the direction of the anode. The injection
voltage was kept constant at 200 V for in-channel delivery of all the reagents. In-channel
assembly is useful from the standpoint of minimal reagent consumption 192 and fast
immobilization kinetics 196 to allow on demand assembly of the biorecognition interface for
nucleic acid hybridization assays.
Table 5. Steps for the In-Channel Assembly of the Solid Phase Assay
Assembly Step Concentration Delivery Method Incubation Washing
Preconditioning - EOF/pH 9.25 BB
2 min
- -
QDs delivery and Immobilization
200 nMa
360 nM (gQDs) and 30 nM (rQDs)b
EOF/pH 9.25 BB
10-15 min
5 min 5 min/pH 9.25 BB
Probe(s) delivery and bioconjugation
3 μMa
1.5 μM (SMN1) and 1.5 μM (uidA)b
EPF/pH 7.44 TB
5 min
5 min 5 min/pH 7.44 TB
Target(s) delivery and hybridization
0.25 μM – 3 μM EPF/pH 7.44 TB
3 min
5 min 1 min/pH 7.44 TB
afor single-color experiments, bfor multicolor experiments. Note: for 3BPM discrimination experiments, all the steps associated with the assembly of the biorecognition interface and targets injection were done in pH 9.25 BB.
3.3 Results and Discussion
3.3.1 The FRET Pairs
The gQD/Cy3 (donor/acceptor) and rQD/A647 (donor/acceptor) FRET pairs used in this work
were characterized in solution using absorbance and steady state PL measurements. The
absorption and PL spectra of the two FRET pairs are shown in Appendix 2 (Figure A2.2). The
spectral overlap integrals for the gQD/Cy3 and rQD/A647 FRET pairs were 6.31 × 10⁻¹⁰ and
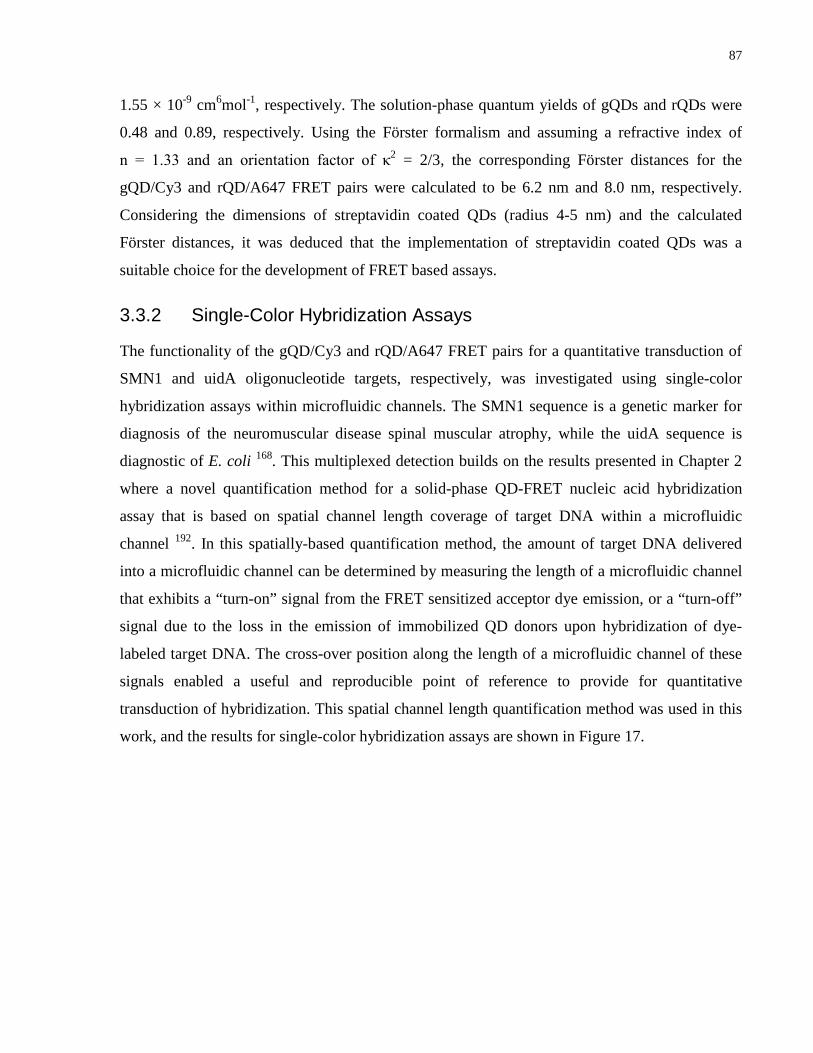
87
1.55 × 10⁻⁹ cm6mol-1, respectively. The solution-phase quantum yields of gQDs and rQDs were
0.48 and 0.89, respectively. Using the Förster formalism and assuming a refractive index of
n = 1.33 and an orientation factor of κ2 = 2/3, the corresponding Förster distances for the
gQD/Cy3 and rQD/A647 FRET pairs were calculated to be 6.2 nm and 8.0 nm, respectively.
Considering the dimensions of streptavidin coated QDs (radius 4-5 nm) and the calculated
Förster distances, it was deduced that the implementation of streptavidin coated QDs was a
suitable choice for the development of FRET based assays.
3.3.2 Single-Color Hybridization Assays
The functionality of the gQD/Cy3 and rQD/A647 FRET pairs for a quantitative transduction of
SMN1 and uidA oligonucleotide targets, respectively, was investigated using single-color
hybridization assays within microfluidic channels. The SMN1 sequence is a genetic marker for
diagnosis of the neuromuscular disease spinal muscular atrophy, while the uidA sequence is
diagnostic of E. coli 168. This multiplexed detection builds on the results presented in Chapter 2
where a novel quantification method for a solid-phase QD-FRET nucleic acid hybridization
assay that is based on spatial channel length coverage of target DNA within a microfluidic
channel 192. In this spatially-based quantification method, the amount of target DNA delivered
into a microfluidic channel can be determined by measuring the length of a microfluidic channel
that exhibits a “turn-on” signal from the FRET sensitized acceptor dye emission, or a “turn-off”
signal due to the loss in the emission of immobilized QD donors upon hybridization of dye-
labeled target DNA. The cross-over position along the length of a microfluidic channel of these
signals enabled a useful and reproducible point of reference to provide for quantitative
transduction of hybridization. This spatial channel length quantification method was used in this
work, and the results for single-color hybridization assays are shown in Figure 17.
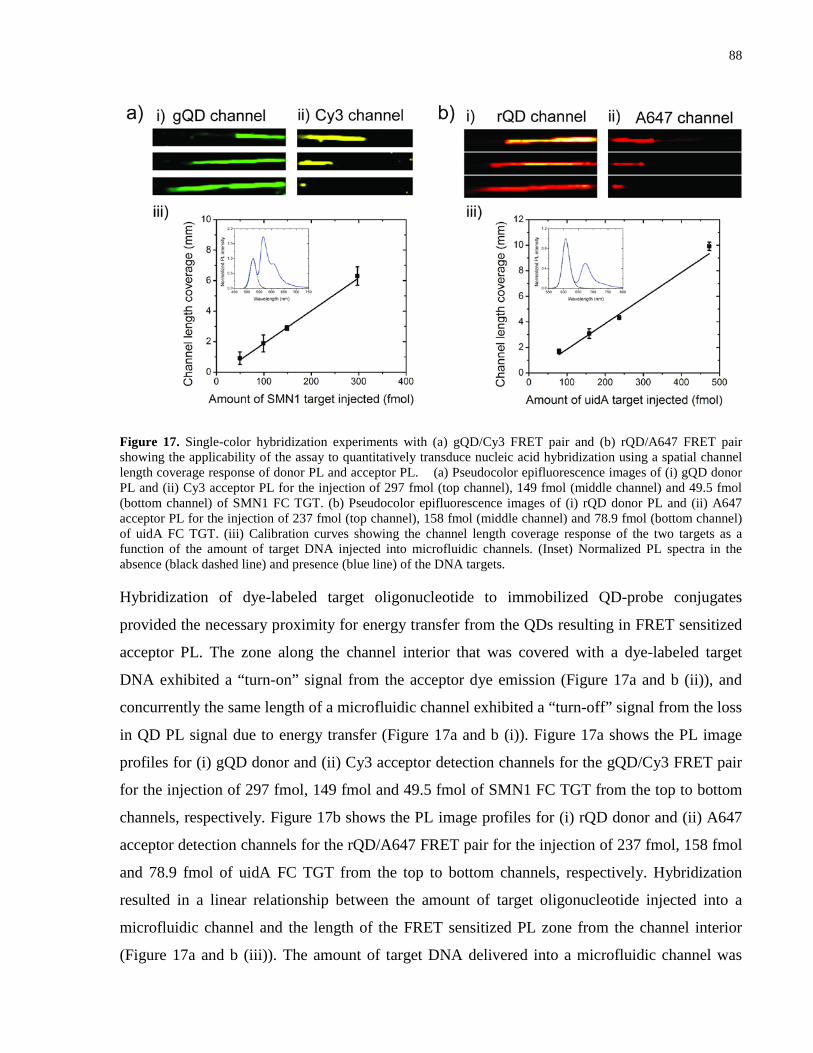
88
Figure 17. Single-color hybridization experiments with (a) gQD/Cy3 FRET pair and (b) rQD/A647 FRET pair showing the applicability of the assay to quantitatively transduce nucleic acid hybridization using a spatial channel length coverage response of donor PL and acceptor PL. (a) Pseudocolor epifluorescence images of (i) gQD donor PL and (ii) Cy3 acceptor PL for the injection of 297 fmol (top channel), 149 fmol (middle channel) and 49.5 fmol (bottom channel) of SMN1 FC TGT. (b) Pseudocolor epifluorescence images of (i) rQD donor PL and (ii) A647 acceptor PL for the injection of 237 fmol (top channel), 158 fmol (middle channel) and 78.9 fmol (bottom channel) of uidA FC TGT. (iii) Calibration curves showing the channel length coverage response of the two targets as a function of the amount of target DNA injected into microfluidic channels. (Inset) Normalized PL spectra in the absence (black dashed line) and presence (blue line) of the DNA targets.
Hybridization of dye-labeled target oligonucleotide to immobilized QD-probe conjugates
provided the necessary proximity for energy transfer from the QDs resulting in FRET sensitized
acceptor PL. The zone along the channel interior that was covered with a dye-labeled target
DNA exhibited a “turn-on” signal from the acceptor dye emission (Figure 17a and b (ii)), and
concurrently the same length of a microfluidic channel exhibited a “turn-off” signal from the loss
in QD PL signal due to energy transfer (Figure 17a and b (i)). Figure 17a shows the PL image
profiles for (i) gQD donor and (ii) Cy3 acceptor detection channels for the gQD/Cy3 FRET pair
for the injection of 297 fmol, 149 fmol and 49.5 fmol of SMN1 FC TGT from the top to bottom
channels, respectively. Figure 17b shows the PL image profiles for (i) rQD donor and (ii) A647
acceptor detection channels for the rQD/A647 FRET pair for the injection of 237 fmol, 158 fmol
and 78.9 fmol of uidA FC TGT from the top to bottom channels, respectively. Hybridization
resulted in a linear relationship between the amount of target oligonucleotide injected into a
microfluidic channel and the length of the FRET sensitized PL zone from the channel interior
(Figure 17a and b (iii)). The amount of target DNA delivered into a microfluidic channel was
89
determined by multiplying the injection volume by the concentration of target DNA added to the
sample reservoir. The volume of target DNA delivered into a microfluidic channel was estimated
by multiplying the net mobility of the target DNA by the cross-sectional area of the microfluidic
channel. The net mobilities of SMN1 and uidA targets in the direction of the anode were
determined to be 1.1 × 10⁻⁴ cm2 V-1s-1 and 1.6 × 10⁻⁴ cm2 V-1s-1, respectively. Since the injection
voltage (200 V) and time (3 min) were kept constant in all the hybridization assays, it was
determined that about 99 nL and 158 nL of SMN1 and uidA targets were delivered into a
microfluidic channel, respectively.
Quantitative assessment of the length of a microfluidic channel that exhibited FRET sensitized
PL from target hybridization was determined by a cross-over point analysis, i.e. the point in the
microfluidic channel where the normalized PL intensities of the acceptor and donor crossed. An
example of a cross-over point analysis for the determination of channel length can be found in
Appendix 2 (see Figure A2.3). For a constant injection voltage of 200 V and time of 3 min, the
limit of detection (LOD) of the SMN1 and uidA targets was determined to be 23 fmol. Similar
detection limits in the fmol range have been previously reported for the nucleic acid
hybridization assays conducted within a microfluidic channel (non QD-FRET based assays) 195,
197. The LOD (based on a distance measured) was estimated by taking into account the spatial
relationship of one imaged data point and the equation associated with the calibration curve of
the corresponding target. One spatial data point correlated to a channel length of ca. 0.24 mm,
considering that for imaging each chip, approximately 50 line scans were completed across the
length of the channel which measured 12 mm.
For solid-phase QD-FRET assays that rely on the PL intensities of donors and acceptors,
ratiometric analysis is commonly employed for quantification. For a ratiometric approach, the
LOD is determined by the ability to resolve FRET sensitized acceptor PL against a bright
background of donor PL, and the limit of linearity (LOL) is determined by either the saturation
of the biorecognition element or by the threshold of the number of acceptors that results in the
saturation of FRET efficiency response 198. It is important to note that saturation of the FRET
efficiency response as governed by the number of acceptors may occur prior to the saturation of
the biorecognition element. The sensitivity of such assays is governed by changes in the FRET
efficiency upon an increasing number of acceptors interacting with the donor QDs. For the
spatially-based detection method described herein, the quantification is independent of the PL
90
intensities of donors and acceptors. The LOL is only governed by the saturation of the
biorecognition element and is limited by the length of the microchannel. Furthermore, the
sensitivity of this transduction method is not as dependent on changes in the FRET efficiency
response and has the potential to improve the dynamic range of QD-FRET based assays.
3.3.3 Selectivity
The selectivity of nucleic acid hybridization assays was evaluated with single-color experiments
by comparing the response of the assay to FC and NC targets. The results are shown in
Figure 18. For the gQD/Cy3 FRET pair, hybridization assays conducted with SMN1 FC TGT
yielded a FRET ratio response of 1.7 ± 0.2, while in the presence of SMN1 NC TGT, the FRET
ratio response observed was 0.0015 ± 0.0003. This corresponds to a contrast ratio of 1143 to 1
for FC and NC targets respectively. In the case of the rQD/A647 FRET pair, hybridization with
uidA FC TGT yielded a FRET ratio response of 0.58 ± 0.05, while uidA NC TGT yielded a
FRET ratio response of 0.029 ± 0.007. This corresponds to a contrast ratio of 20 to 1 for FC and
NC targets respectively. These results confirm that the assay design provided selectivity of
nucleic acid hybridization and is consistent with the previous reports of resistance of streptavidin
coated QDs to non-specific adsorption of oligonucleotides 192.
Figure 18. Single-color hybridization experiments showing the FRET ratio response of the assay in the presence of FC and NC targets.
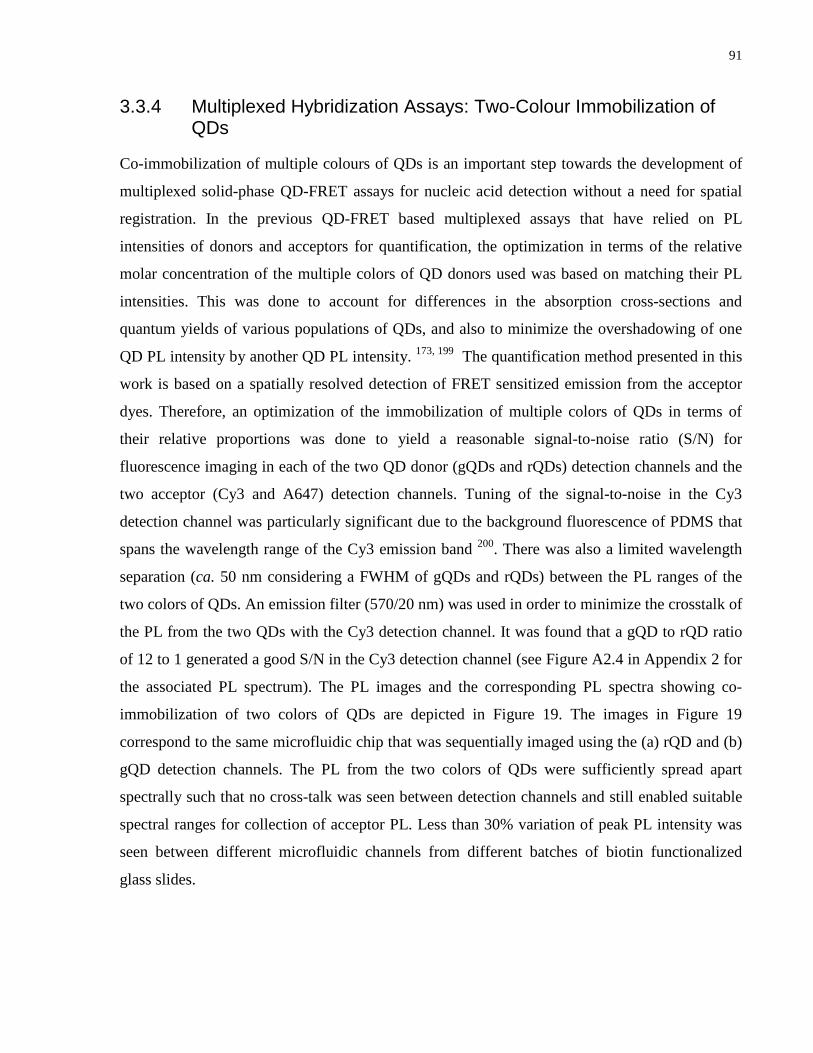
91
3.3.4 Multiplexed Hybridization Assays: Two-Colour Immobilization of QDs
Co-immobilization of multiple colours of QDs is an important step towards the development of
multiplexed solid-phase QD-FRET assays for nucleic acid detection without a need for spatial
registration. In the previous QD-FRET based multiplexed assays that have relied on PL
intensities of donors and acceptors for quantification, the optimization in terms of the relative
molar concentration of the multiple colors of QD donors used was based on matching their PL
intensities. This was done to account for differences in the absorption cross-sections and
quantum yields of various populations of QDs, and also to minimize the overshadowing of one
QD PL intensity by another QD PL intensity. 173, 199 The quantification method presented in this
work is based on a spatially resolved detection of FRET sensitized emission from the acceptor
dyes. Therefore, an optimization of the immobilization of multiple colors of QDs in terms of
their relative proportions was done to yield a reasonable signal-to-noise ratio (S/N) for
fluorescence imaging in each of the two QD donor (gQDs and rQDs) detection channels and the
two acceptor (Cy3 and A647) detection channels. Tuning of the signal-to-noise in the Cy3
detection channel was particularly significant due to the background fluorescence of PDMS that
spans the wavelength range of the Cy3 emission band 200. There was also a limited wavelength
separation (ca. 50 nm considering a FWHM of gQDs and rQDs) between the PL ranges of the
two colors of QDs. An emission filter (570/20 nm) was used in order to minimize the crosstalk of
the PL from the two QDs with the Cy3 detection channel. It was found that a gQD to rQD ratio
of 12 to 1 generated a good S/N in the Cy3 detection channel (see Figure A2.4 in Appendix 2 for
the associated PL spectrum). The PL images and the corresponding PL spectra showing co-
immobilization of two colors of QDs are depicted in Figure 19. The images in Figure 19
correspond to the same microfluidic chip that was sequentially imaged using the (a) rQD and (b)
gQD detection channels. The PL from the two colors of QDs were sufficiently spread apart
spectrally such that no cross-talk was seen between detection channels and still enabled suitable
spectral ranges for collection of acceptor PL. Less than 30% variation of peak PL intensity was
seen between different microfluidic channels from different batches of biotin functionalized
glass slides.
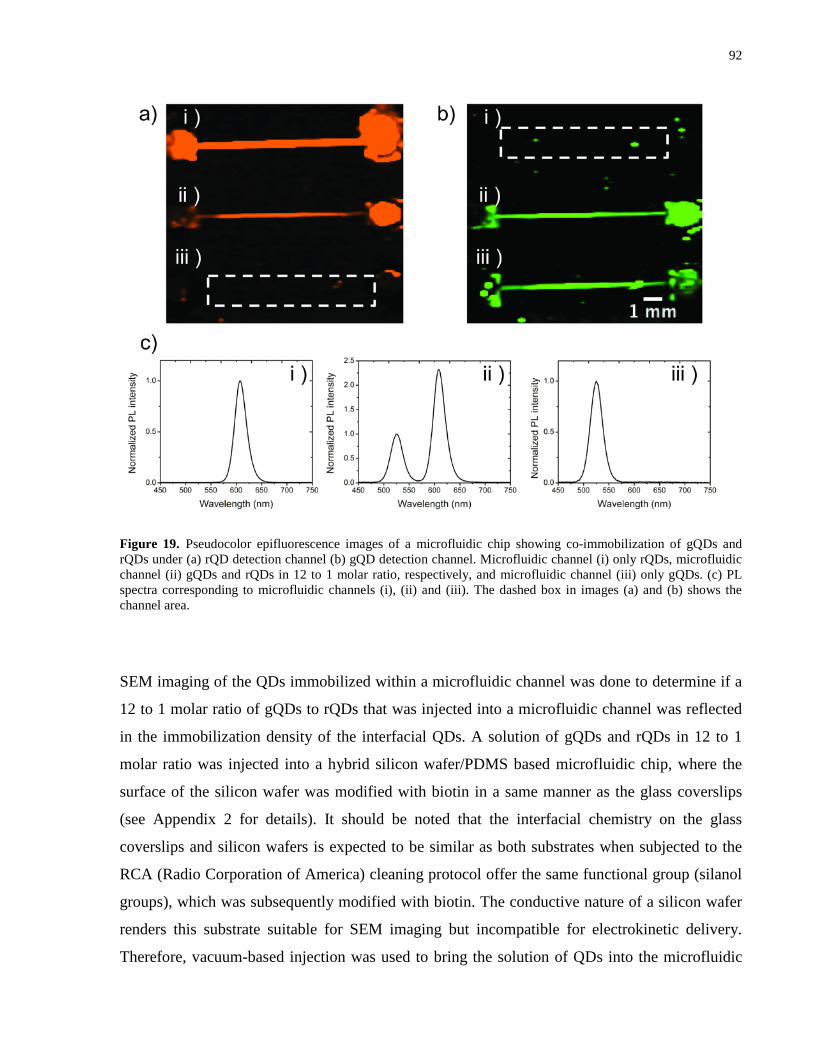
92
Figure 19. Pseudocolor epifluorescence images of a microfluidic chip showing co-immobilization of gQDs and rQDs under (a) rQD detection channel (b) gQD detection channel. Microfluidic channel (i) only rQDs, microfluidic channel (ii) gQDs and rQDs in 12 to 1 molar ratio, respectively, and microfluidic channel (iii) only gQDs. (c) PL spectra corresponding to microfluidic channels (i), (ii) and (iii). The dashed box in images (a) and (b) shows the channel area.
SEM imaging of the QDs immobilized within a microfluidic channel was done to determine if a
12 to 1 molar ratio of gQDs to rQDs that was injected into a microfluidic channel was reflected
in the immobilization density of the interfacial QDs. A solution of gQDs and rQDs in 12 to 1
molar ratio was injected into a hybrid silicon wafer/PDMS based microfluidic chip, where the
surface of the silicon wafer was modified with biotin in a same manner as the glass coverslips
(see Appendix 2 for details). It should be noted that the interfacial chemistry on the glass
coverslips and silicon wafers is expected to be similar as both substrates when subjected to the
RCA (Radio Corporation of America) cleaning protocol offer the same functional group (silanol
groups), which was subsequently modified with biotin. The conductive nature of a silicon wafer
renders this substrate suitable for SEM imaging but incompatible for electrokinetic delivery.
Therefore, vacuum-based injection was used to bring the solution of QDs into the microfluidic
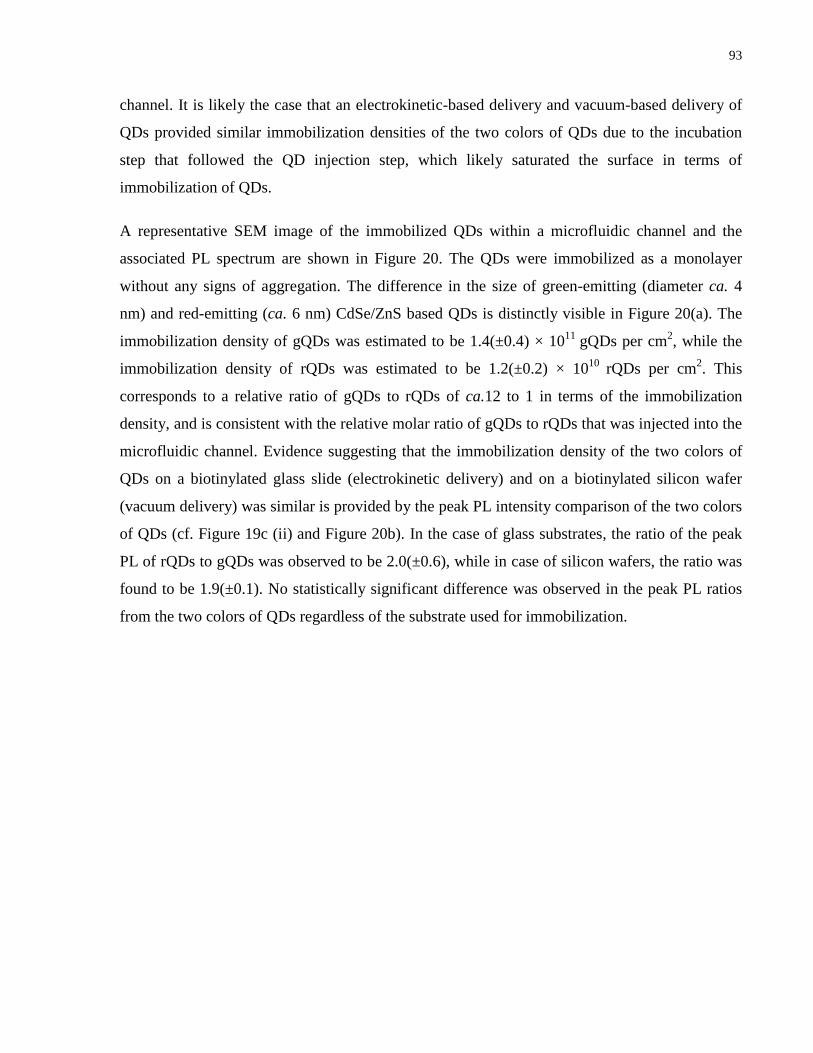
93
channel. It is likely the case that an electrokinetic-based delivery and vacuum-based delivery of
QDs provided similar immobilization densities of the two colors of QDs due to the incubation
step that followed the QD injection step, which likely saturated the surface in terms of
immobilization of QDs.
A representative SEM image of the immobilized QDs within a microfluidic channel and the
associated PL spectrum are shown in Figure 20. The QDs were immobilized as a monolayer
without any signs of aggregation. The difference in the size of green-emitting (diameter ca. 4
nm) and red-emitting (ca. 6 nm) CdSe/ZnS based QDs is distinctly visible in Figure 20(a). The
immobilization density of gQDs was estimated to be 1.4(±0.4) × 1011 gQDs per cm2, while the
immobilization density of rQDs was estimated to be 1.2(±0.2) × 1010 rQDs per cm2. This
corresponds to a relative ratio of gQDs to rQDs of ca.12 to 1 in terms of the immobilization
density, and is consistent with the relative molar ratio of gQDs to rQDs that was injected into the
microfluidic channel. Evidence suggesting that the immobilization density of the two colors of
QDs on a biotinylated glass slide (electrokinetic delivery) and on a biotinylated silicon wafer
(vacuum delivery) was similar is provided by the peak PL intensity comparison of the two colors
of QDs (cf. Figure 19c (ii) and Figure 20b). In the case of glass substrates, the ratio of the peak
PL of rQDs to gQDs was observed to be 2.0(±0.6), while in case of silicon wafers, the ratio was
found to be 1.9(±0.1). No statistically significant difference was observed in the peak PL ratios
from the two colors of QDs regardless of the substrate used for immobilization.
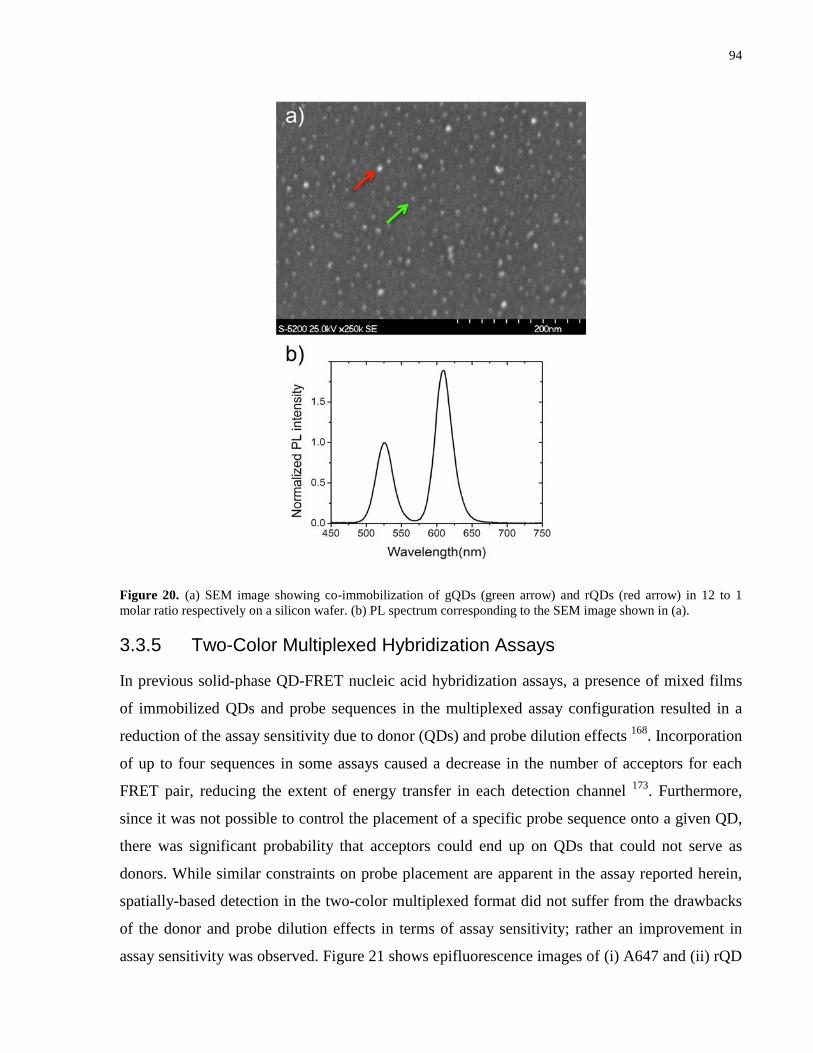
94
Figure 20. (a) SEM image showing co-immobilization of gQDs (green arrow) and rQDs (red arrow) in 12 to 1 molar ratio respectively on a silicon wafer. (b) PL spectrum corresponding to the SEM image shown in (a).
3.3.5 Two-Color Multiplexed Hybridization Assays
In previous solid-phase QD-FRET nucleic acid hybridization assays, a presence of mixed films
of immobilized QDs and probe sequences in the multiplexed assay configuration resulted in a
reduction of the assay sensitivity due to donor (QDs) and probe dilution effects 168. Incorporation
of up to four sequences in some assays caused a decrease in the number of acceptors for each
FRET pair, reducing the extent of energy transfer in each detection channel 173. Furthermore,
since it was not possible to control the placement of a specific probe sequence onto a given QD,
there was significant probability that acceptors could end up on QDs that could not serve as
donors. While similar constraints on probe placement are apparent in the assay reported herein,
spatially-based detection in the two-color multiplexed format did not suffer from the drawbacks
of the donor and probe dilution effects in terms of assay sensitivity; rather an improvement in
assay sensitivity was observed. Figure 21 shows epifluorescence images of (i) A647 and (ii) rQD
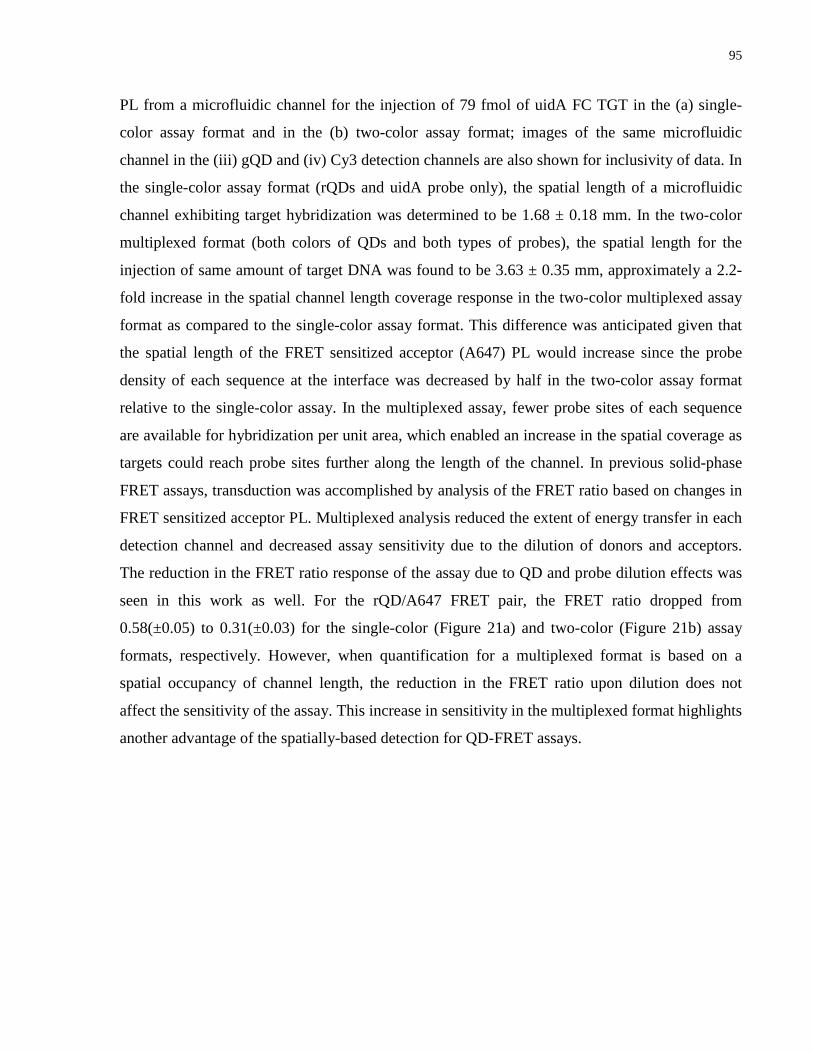
95
PL from a microfluidic channel for the injection of 79 fmol of uidA FC TGT in the (a) single-
color assay format and in the (b) two-color assay format; images of the same microfluidic
channel in the (iii) gQD and (iv) Cy3 detection channels are also shown for inclusivity of data. In
the single-color assay format (rQDs and uidA probe only), the spatial length of a microfluidic
channel exhibiting target hybridization was determined to be 1.68 ± 0.18 mm. In the two-color
multiplexed format (both colors of QDs and both types of probes), the spatial length for the
injection of same amount of target DNA was found to be 3.63 ± 0.35 mm, approximately a 2.2-
fold increase in the spatial channel length coverage response in the two-color multiplexed assay
format as compared to the single-color assay format. This difference was anticipated given that
the spatial length of the FRET sensitized acceptor (A647) PL would increase since the probe
density of each sequence at the interface was decreased by half in the two-color assay format
relative to the single-color assay. In the multiplexed assay, fewer probe sites of each sequence
are available for hybridization per unit area, which enabled an increase in the spatial coverage as
targets could reach probe sites further along the length of the channel. In previous solid-phase
FRET assays, transduction was accomplished by analysis of the FRET ratio based on changes in
FRET sensitized acceptor PL. Multiplexed analysis reduced the extent of energy transfer in each
detection channel and decreased assay sensitivity due to the dilution of donors and acceptors.
The reduction in the FRET ratio response of the assay due to QD and probe dilution effects was
seen in this work as well. For the rQD/A647 FRET pair, the FRET ratio dropped from
0.58(±0.05) to 0.31(±0.03) for the single-color (Figure 21a) and two-color (Figure 21b) assay
formats, respectively. However, when quantification for a multiplexed format is based on a
spatial occupancy of channel length, the reduction in the FRET ratio upon dilution does not
affect the sensitivity of the assay. This increase in sensitivity in the multiplexed format highlights
another advantage of the spatially-based detection for QD-FRET assays.
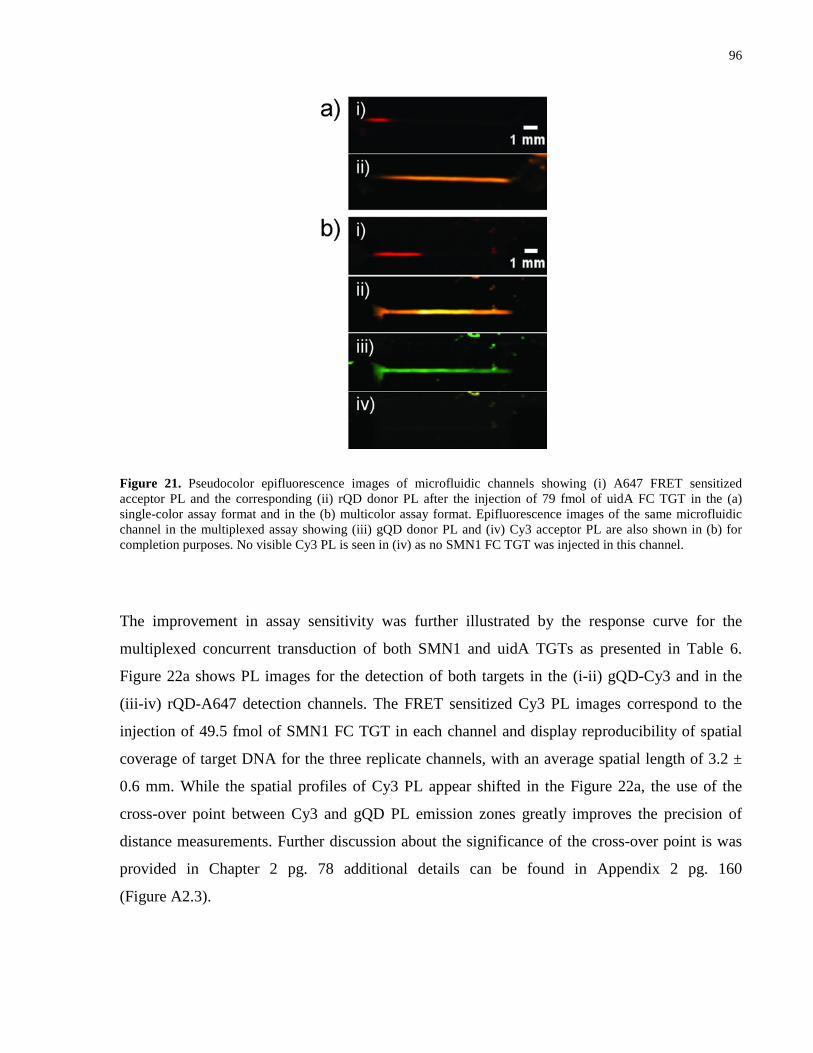
96
Figure 21. Pseudocolor epifluorescence images of microfluidic channels showing (i) A647 FRET sensitized acceptor PL and the corresponding (ii) rQD donor PL after the injection of 79 fmol of uidA FC TGT in the (a) single-color assay format and in the (b) multicolor assay format. Epifluorescence images of the same microfluidic channel in the multiplexed assay showing (iii) gQD donor PL and (iv) Cy3 acceptor PL are also shown in (b) for completion purposes. No visible Cy3 PL is seen in (iv) as no SMN1 FC TGT was injected in this channel.
The improvement in assay sensitivity was further illustrated by the response curve for the
multiplexed concurrent transduction of both SMN1 and uidA TGTs as presented in Table 6.
Figure 22a shows PL images for the detection of both targets in the (i-ii) gQD-Cy3 and in the
(iii-iv) rQD-A647 detection channels. The FRET sensitized Cy3 PL images correspond to the
injection of 49.5 fmol of SMN1 FC TGT in each channel and display reproducibility of spatial
coverage of target DNA for the three replicate channels, with an average spatial length of 3.2 ±
0.6 mm. While the spatial profiles of Cy3 PL appear shifted in the Figure 22a, the use of the
cross-over point between Cy3 and gQD PL emission zones greatly improves the precision of
distance measurements. Further discussion about the significance of the cross-over point is was
provided in Chapter 2 pg. 78 additional details can be found in Appendix 2 pg. 160
(Figure A2.3).
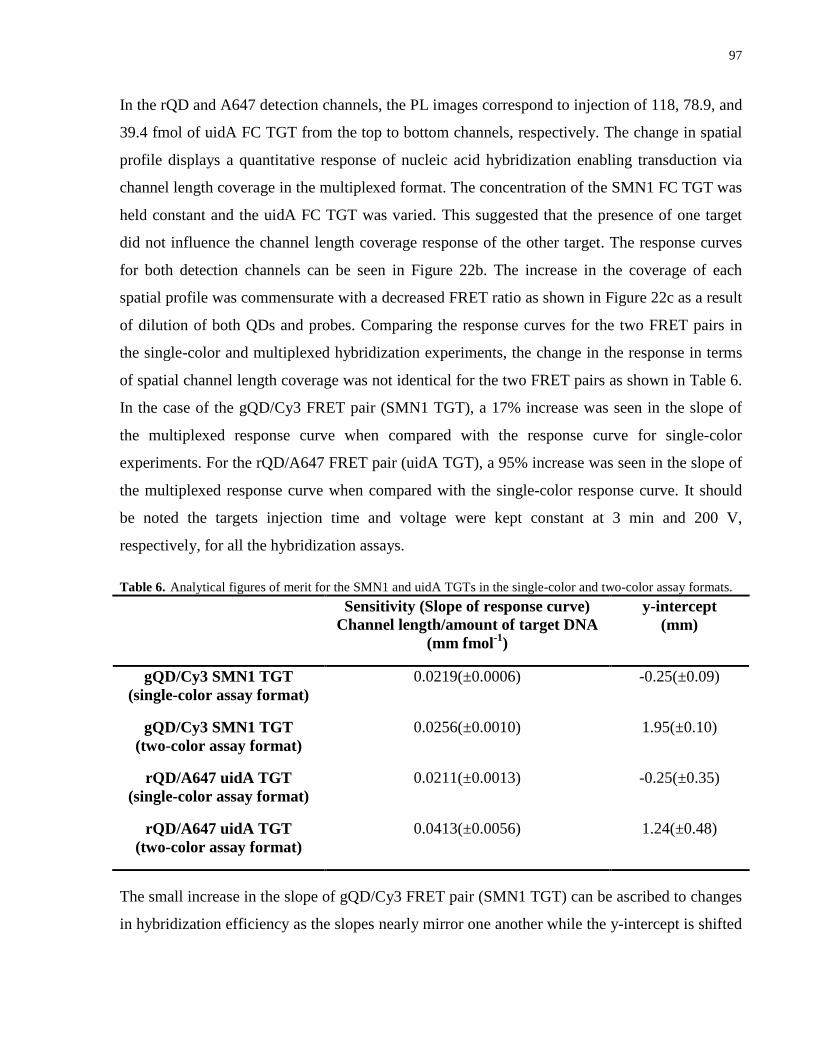
97
In the rQD and A647 detection channels, the PL images correspond to injection of 118, 78.9, and
39.4 fmol of uidA FC TGT from the top to bottom channels, respectively. The change in spatial
profile displays a quantitative response of nucleic acid hybridization enabling transduction via
channel length coverage in the multiplexed format. The concentration of the SMN1 FC TGT was
held constant and the uidA FC TGT was varied. This suggested that the presence of one target
did not influence the channel length coverage response of the other target. The response curves
for both detection channels can be seen in Figure 22b. The increase in the coverage of each
spatial profile was commensurate with a decreased FRET ratio as shown in Figure 22c as a result
of dilution of both QDs and probes. Comparing the response curves for the two FRET pairs in
the single-color and multiplexed hybridization experiments, the change in the response in terms
of spatial channel length coverage was not identical for the two FRET pairs as shown in Table 6.
In the case of the gQD/Cy3 FRET pair (SMN1 TGT), a 17% increase was seen in the slope of
the multiplexed response curve when compared with the response curve for single-color
experiments. For the rQD/A647 FRET pair (uidA TGT), a 95% increase was seen in the slope of
the multiplexed response curve when compared with the single-color response curve. It should
be noted the targets injection time and voltage were kept constant at 3 min and 200 V,
respectively, for all the hybridization assays.
Table 6. Analytical figures of merit for the SMN1 and uidA TGTs in the single-color and two-color assay formats. Sensitivity (Slope of response curve)
Channel length/amount of target DNA (mm fmol-1)
y-intercept (mm)
gQD/Cy3 SMN1 TGT (single-color assay format)
0.0219(±0.0006) -0.25(±0.09)
gQD/Cy3 SMN1 TGT (two-color assay format)
0.0256(±0.0010) 1.95(±0.10)
rQD/A647 uidA TGT (single-color assay format)
0.0211(±0.0013) -0.25(±0.35)
rQD/A647 uidA TGT (two-color assay format)
0.0413(±0.0056) 1.24(±0.48)
The small increase in the slope of gQD/Cy3 FRET pair (SMN1 TGT) can be ascribed to changes
in hybridization efficiency as the slopes nearly mirror one another while the y-intercept is shifted
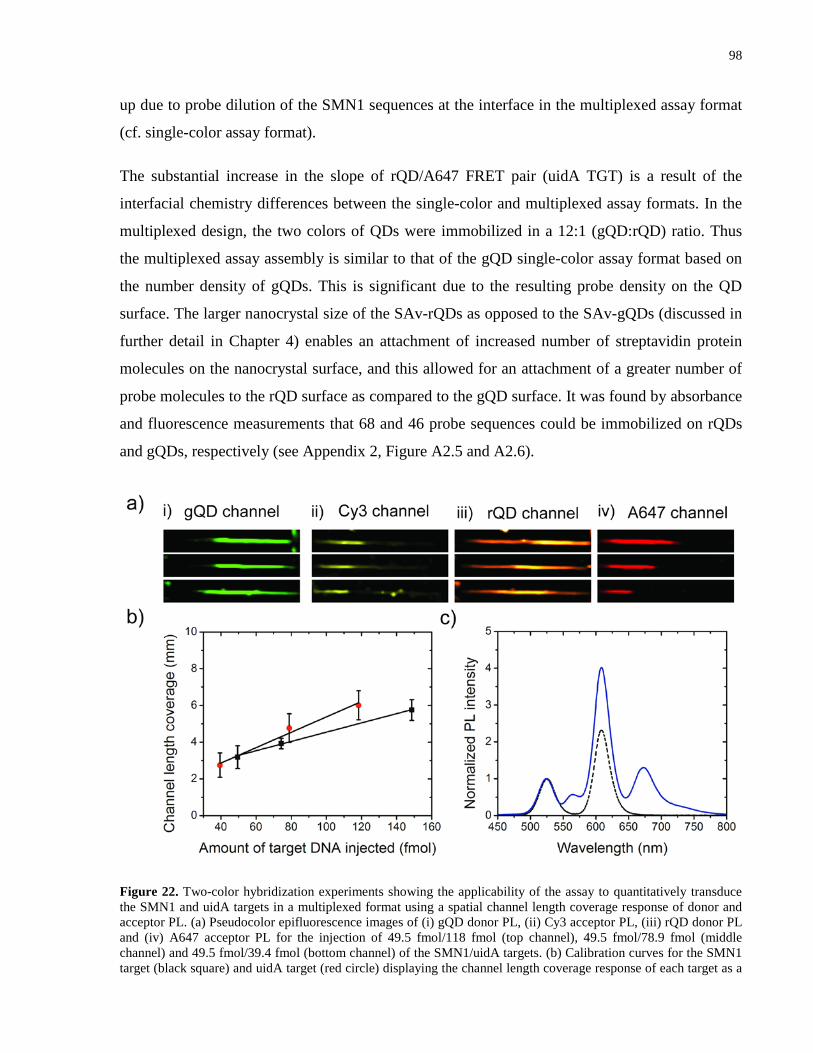
98
up due to probe dilution of the SMN1 sequences at the interface in the multiplexed assay format
(cf. single-color assay format).
The substantial increase in the slope of rQD/A647 FRET pair (uidA TGT) is a result of the
interfacial chemistry differences between the single-color and multiplexed assay formats. In the
multiplexed design, the two colors of QDs were immobilized in a 12:1 (gQD:rQD) ratio. Thus
the multiplexed assay assembly is similar to that of the gQD single-color assay format based on
the number density of gQDs. This is significant due to the resulting probe density on the QD
surface. The larger nanocrystal size of the SAv-rQDs as opposed to the SAv-gQDs (discussed in
further detail in Chapter 4) enables an attachment of increased number of streptavidin protein
molecules on the nanocrystal surface, and this allowed for an attachment of a greater number of
probe molecules to the rQD surface as compared to the gQD surface. It was found by absorbance
and fluorescence measurements that 68 and 46 probe sequences could be immobilized on rQDs
and gQDs, respectively (see Appendix 2, Figure A2.5 and A2.6).
Figure 22. Two-color hybridization experiments showing the applicability of the assay to quantitatively transduce the SMN1 and uidA targets in a multiplexed format using a spatial channel length coverage response of donor and acceptor PL. (a) Pseudocolor epifluorescence images of (i) gQD donor PL, (ii) Cy3 acceptor PL, (iii) rQD donor PL and (iv) A647 acceptor PL for the injection of 49.5 fmol/118 fmol (top channel), 49.5 fmol/78.9 fmol (middle channel) and 49.5 fmol/39.4 fmol (bottom channel) of the SMN1/uidA targets. (b) Calibration curves for the SMN1 target (black square) and uidA target (red circle) displaying the channel length coverage response of each target as a
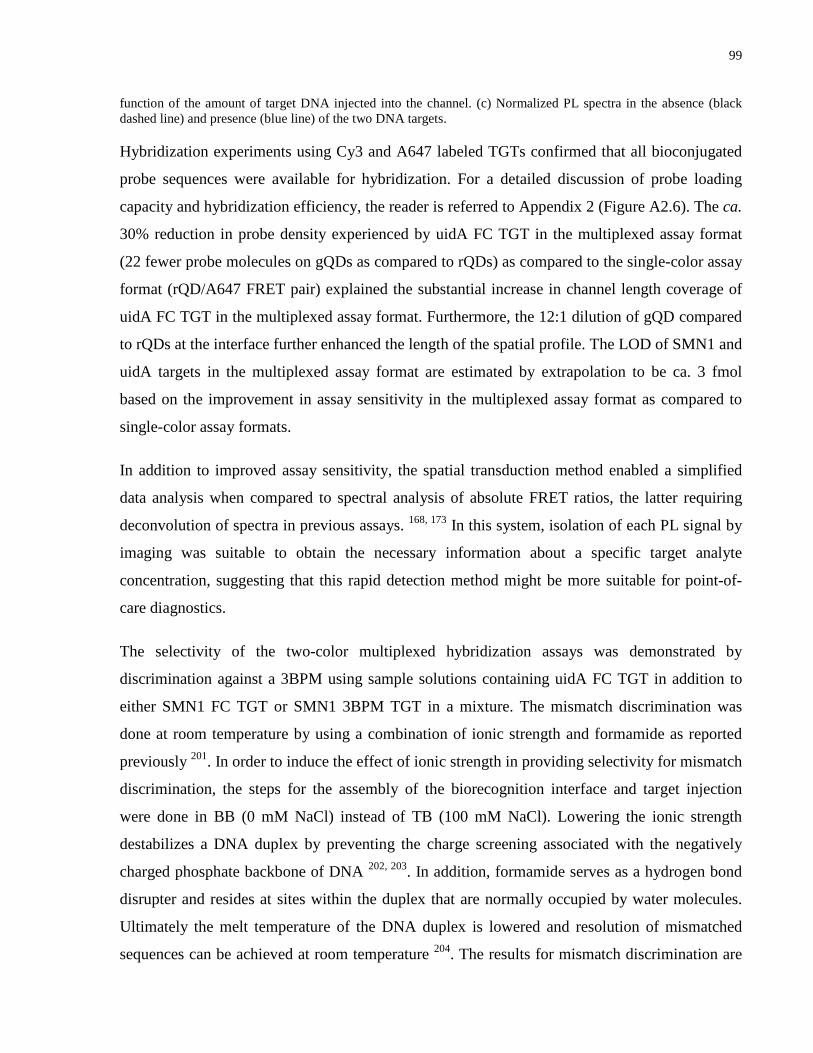
99
function of the amount of target DNA injected into the channel. (c) Normalized PL spectra in the absence (black dashed line) and presence (blue line) of the two DNA targets.
Hybridization experiments using Cy3 and A647 labeled TGTs confirmed that all bioconjugated
probe sequences were available for hybridization. For a detailed discussion of probe loading
capacity and hybridization efficiency, the reader is referred to Appendix 2 (Figure A2.6). The ca.
30% reduction in probe density experienced by uidA FC TGT in the multiplexed assay format
(22 fewer probe molecules on gQDs as compared to rQDs) as compared to the single-color assay
format (rQD/A647 FRET pair) explained the substantial increase in channel length coverage of
uidA FC TGT in the multiplexed assay format. Furthermore, the 12:1 dilution of gQD compared
to rQDs at the interface further enhanced the length of the spatial profile. The LOD of SMN1 and
uidA targets in the multiplexed assay format are estimated by extrapolation to be ca. 3 fmol
based on the improvement in assay sensitivity in the multiplexed assay format as compared to
single-color assay formats.
In addition to improved assay sensitivity, the spatial transduction method enabled a simplified
data analysis when compared to spectral analysis of absolute FRET ratios, the latter requiring
deconvolution of spectra in previous assays. 168, 173 In this system, isolation of each PL signal by
imaging was suitable to obtain the necessary information about a specific target analyte
concentration, suggesting that this rapid detection method might be more suitable for point-of-
care diagnostics.
The selectivity of the two-color multiplexed hybridization assays was demonstrated by
discrimination against a 3BPM using sample solutions containing uidA FC TGT in addition to
either SMN1 FC TGT or SMN1 3BPM TGT in a mixture. The mismatch discrimination was
done at room temperature by using a combination of ionic strength and formamide as reported
previously 201. In order to induce the effect of ionic strength in providing selectivity for mismatch
discrimination, the steps for the assembly of the biorecognition interface and target injection
were done in BB (0 mM NaCl) instead of TB (100 mM NaCl). Lowering the ionic strength
destabilizes a DNA duplex by preventing the charge screening associated with the negatively
charged phosphate backbone of DNA 202, 203. In addition, formamide serves as a hydrogen bond
disrupter and resides at sites within the duplex that are normally occupied by water molecules.
Ultimately the melt temperature of the DNA duplex is lowered and resolution of mismatched
sequences can be achieved at room temperature 204. The results for mismatch discrimination are
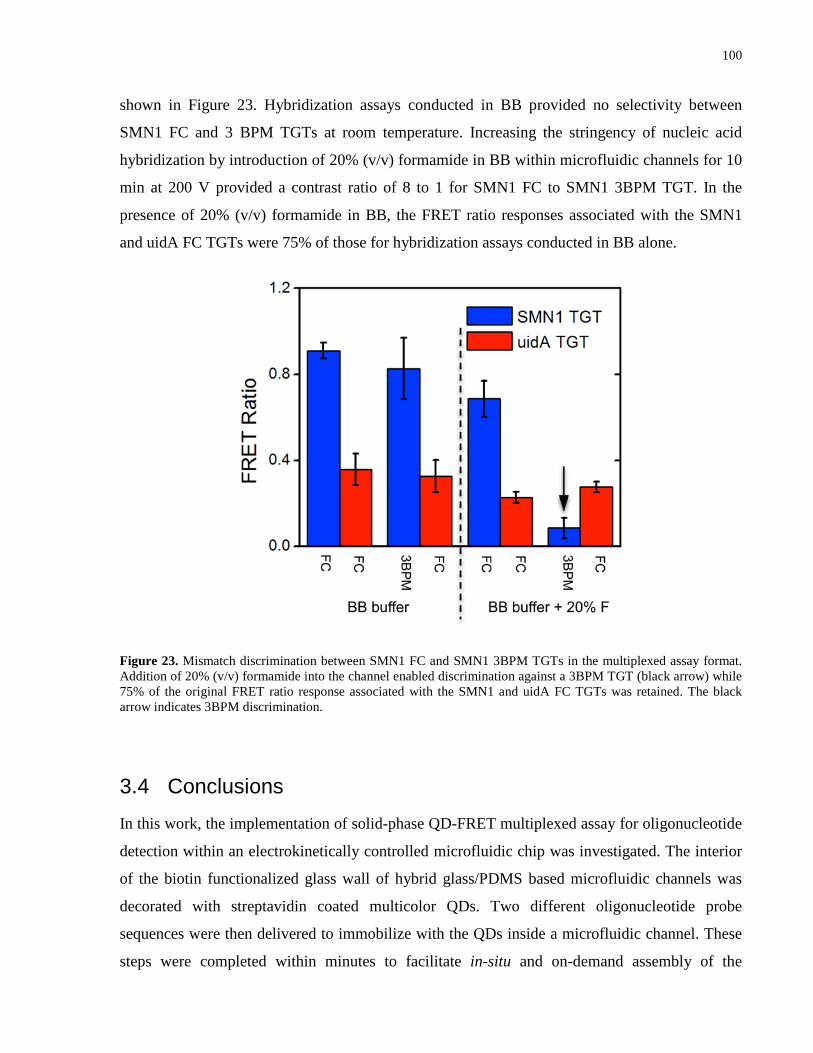
100
shown in Figure 23. Hybridization assays conducted in BB provided no selectivity between
SMN1 FC and 3 BPM TGTs at room temperature. Increasing the stringency of nucleic acid
hybridization by introduction of 20% (v/v) formamide in BB within microfluidic channels for 10
min at 200 V provided a contrast ratio of 8 to 1 for SMN1 FC to SMN1 3BPM TGT. In the
presence of 20% (v/v) formamide in BB, the FRET ratio responses associated with the SMN1
and uidA FC TGTs were 75% of those for hybridization assays conducted in BB alone.
Figure 23. Mismatch discrimination between SMN1 FC and SMN1 3BPM TGTs in the multiplexed assay format. Addition of 20% (v/v) formamide into the channel enabled discrimination against a 3BPM TGT (black arrow) while 75% of the original FRET ratio response associated with the SMN1 and uidA FC TGTs was retained. The black arrow indicates 3BPM discrimination.
3.4 Conclusions In this work, the implementation of solid-phase QD-FRET multiplexed assay for oligonucleotide
detection within an electrokinetically controlled microfluidic chip was investigated. The interior
of the biotin functionalized glass wall of hybrid glass/PDMS based microfluidic channels was
decorated with streptavidin coated multicolor QDs. Two different oligonucleotide probe
sequences were then delivered to immobilize with the QDs inside a microfluidic channel. These
steps were completed within minutes to facilitate in-situ and on-demand assembly of the
101
biorecognition interface. Subsequent in-channel delivery and hybridization of dye-labeled
oligonucleotide targets provided the proximity for FRET sensitized energy transfer from gQDs
and rQDs donors to Cy3 and A647 acceptors, respectively. The emission from the acceptor dyes
served as the basis on which an analytical signal could be determined. Electrokinetically
mediated mass transport of target oligonucleotides to the biorecognition interface provided for
completion of hybridization within minutes. Quantitative determination of femtomole quantities
of the two oligonucleotide targets (SMN1 and uidA) was possible by measurement of spatial
channel length coverage by the two oligonucleotide targets. The channel length coverage was
dependent on “turn-on” PL profiles of the two acceptor dyes and “turn-off” PL profiles of the
two donor QDs. As compared to other solid-phase QD-FRET nucleic acid hybridization assays
that rely on the PL intensities of donors and acceptors for quantification, the spatially-based
detection method provided improved sensitivity when subjected to similar constraints of dilution
of donors and acceptors when operating in a multiplexed detection format. Hybridization assays
showed excellent resistance to non-specific adsorption of oligonucleotides, and provided a
contrast ratio of 8 to 1 for 3BPM discrimination by using a combination of ionic strength and
formamide. This work provides an important precedent towards the integration of solid-phase
multiplexed QD-FRET assays within microfluidics, where the spatially-based detection method
enhances precision and simplifies data analysis.
102
Interfacial Nucleic Acid Hybridization on Streptavidin 4Coated Quantum Dots: Impact of Nanocrystal Size on the Sensitivity and Selectivity of Oligonucleotide Conjugates
The following content in Chapter 4 is unpublished at the present time. The hydrodynamic radii of
both QDs were measured by Zhenfu Zhang from the Gradinaru Group at UTM using FCS. MON
is also thanked for collection of the data set containing the effect of ionic strength on SNP
selectivity. The remainder of the experiments, results, and data analysis was performed by AJT.
4.1 Introduction
Perhaps one of the most important characteristics of a nucleic acid bioassay or biosensor is the
ability to resolve oligonucleotides with mismatches within a mixture of target sequences. The
work reported in Chapters 2 and 3 developed assays in either single or multiplexed formats that
have offered discrimination of duplexes containing a 3BPM. Ideally assays should offer
selectivity for distinction of a 1BPM or a SNP, as single base insertion, deletions, or mutations
can lead to disease as described previously in the case of spinal muscular atrophy. The intrinsic
selectivity of hybridization can enable SNP resolution as the Tm of each duplex is different.
Through a systematic evaluation of denaturation conditions it is possible to selectivity melt the
SNP duplex prior to that of the perfectly matched duplex. The difference in probe loading
capacities of gQDs and rQDs as observed in Chapter 3, which is likely a result of the different
size scales of the QDs, has significant impact on selectivity. In an effort to find suitable
conidtions for SNP selectivity, it was necessary to evaluate the stringency conditions for each
QD. .
Previous work that has conjugated oligonucleotides to glass, fused silica and gold has
demonstrated that surface propoerties such as charge and the density of probe immobilization
must be considered as features that impact selectivity and sensitivity.205-208 Chapter 4 evaluates
the impact of QD size and the average number of conjugated oligonucleotide probes on the
analytical performance of a FRET-based hybridization bioassay. The same SMN1 19mer probe-
target oligonucleotide hybridization system was used on the gQDs and rQDs which had similar
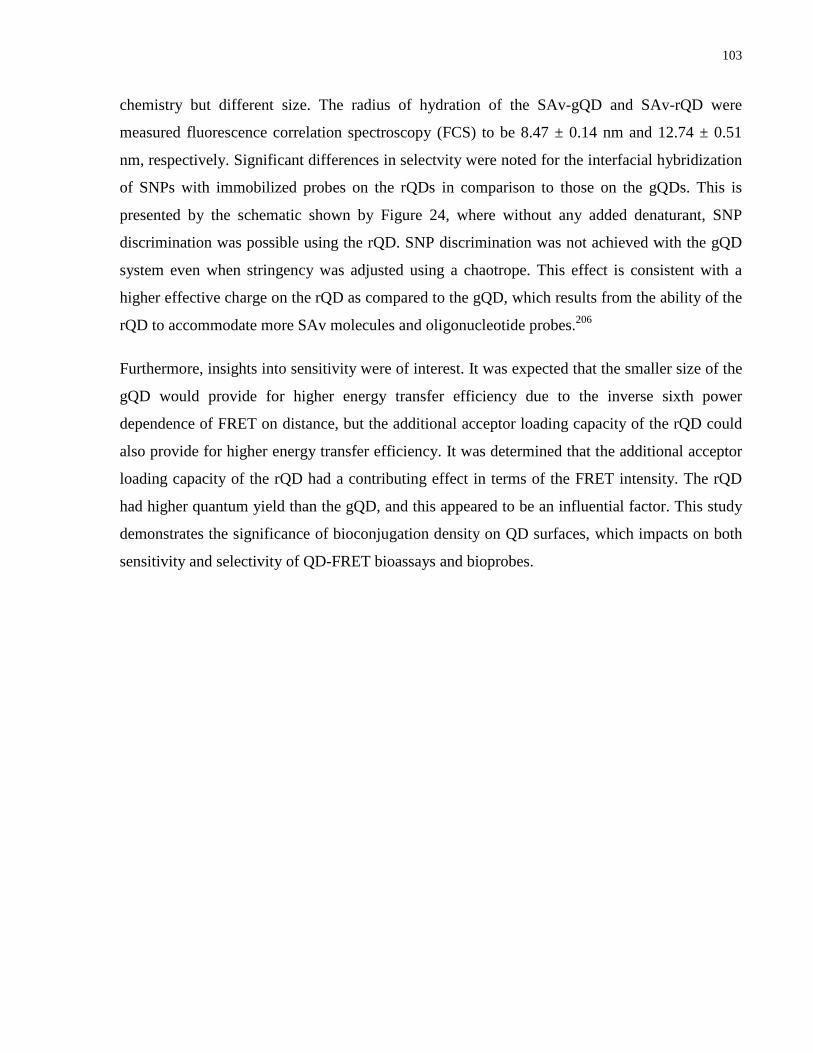
103
chemistry but different size. The radius of hydration of the SAv-gQD and SAv-rQD were
measured fluorescence correlation spectroscopy (FCS) to be 8.47 ± 0.14 nm and 12.74 ± 0.51
nm, respectively. Significant differences in selectvity were noted for the interfacial hybridization
of SNPs with immobilized probes on the rQDs in comparison to those on the gQDs. This is
presented by the schematic shown by Figure 24, where without any added denaturant, SNP
discrimination was possible using the rQD. SNP discrimination was not achieved with the gQD
system even when stringency was adjusted using a chaotrope. This effect is consistent with a
higher effective charge on the rQD as compared to the gQD, which results from the ability of the
rQD to accommodate more SAv molecules and oligonucleotide probes.206
Furthermore, insights into sensitivity were of interest. It was expected that the smaller size of the
gQD would provide for higher energy transfer efficiency due to the inverse sixth power
dependence of FRET on distance, but the additional acceptor loading capacity of the rQD could
also provide for higher energy transfer efficiency. It was determined that the additional acceptor
loading capacity of the rQD had a contributing effect in terms of the FRET intensity. The rQD
had higher quantum yield than the gQD, and this appeared to be an influential factor. This study
demonstrates the significance of bioconjugation density on QD surfaces, which impacts on both
sensitivity and selectivity of QD-FRET bioassays and bioprobes.
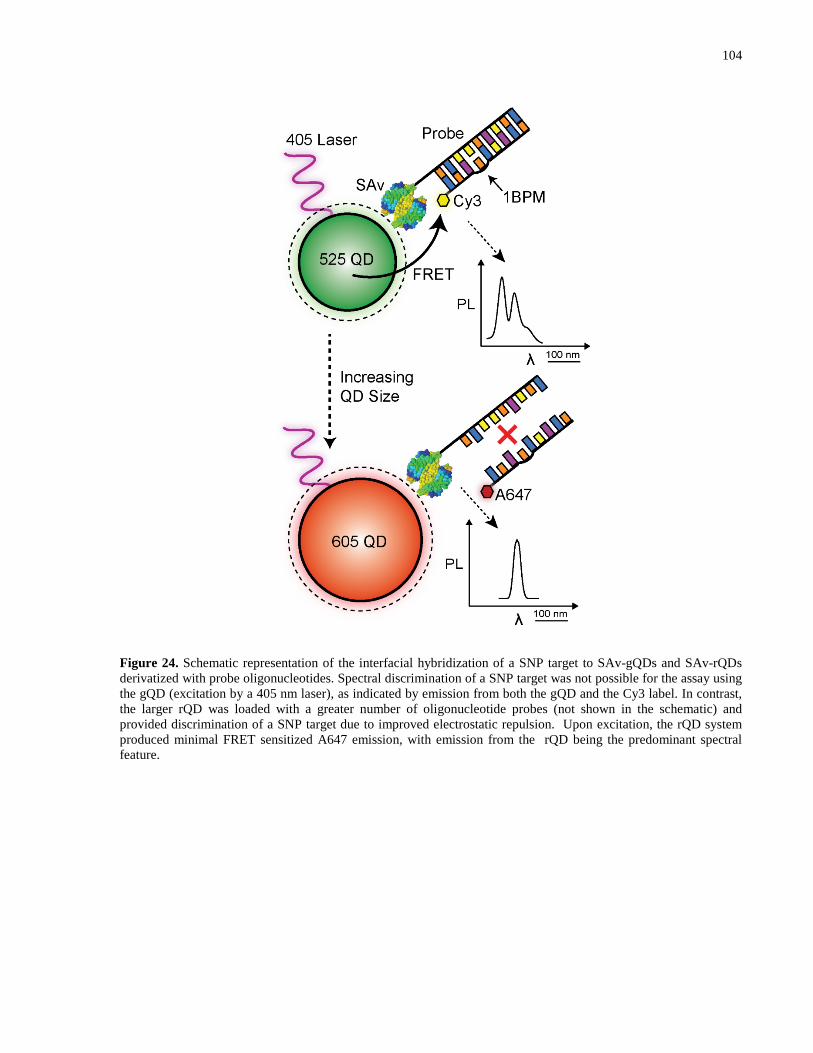
104
Figure 24. Schematic representation of the interfacial hybridization of a SNP target to SAv-gQDs and SAv-rQDs derivatized with probe oligonucleotides. Spectral discrimination of a SNP target was not possible for the assay using the gQD (excitation by a 405 nm laser), as indicated by emission from both the gQD and the Cy3 label. In contrast, the larger rQD was loaded with a greater number of oligonucleotide probes (not shown in the schematic) and provided discrimination of a SNP target due to improved electrostatic repulsion. Upon excitation, the rQD system produced minimal FRET sensitized A647 emission, with emission from the rQD being the predominant spectral feature.
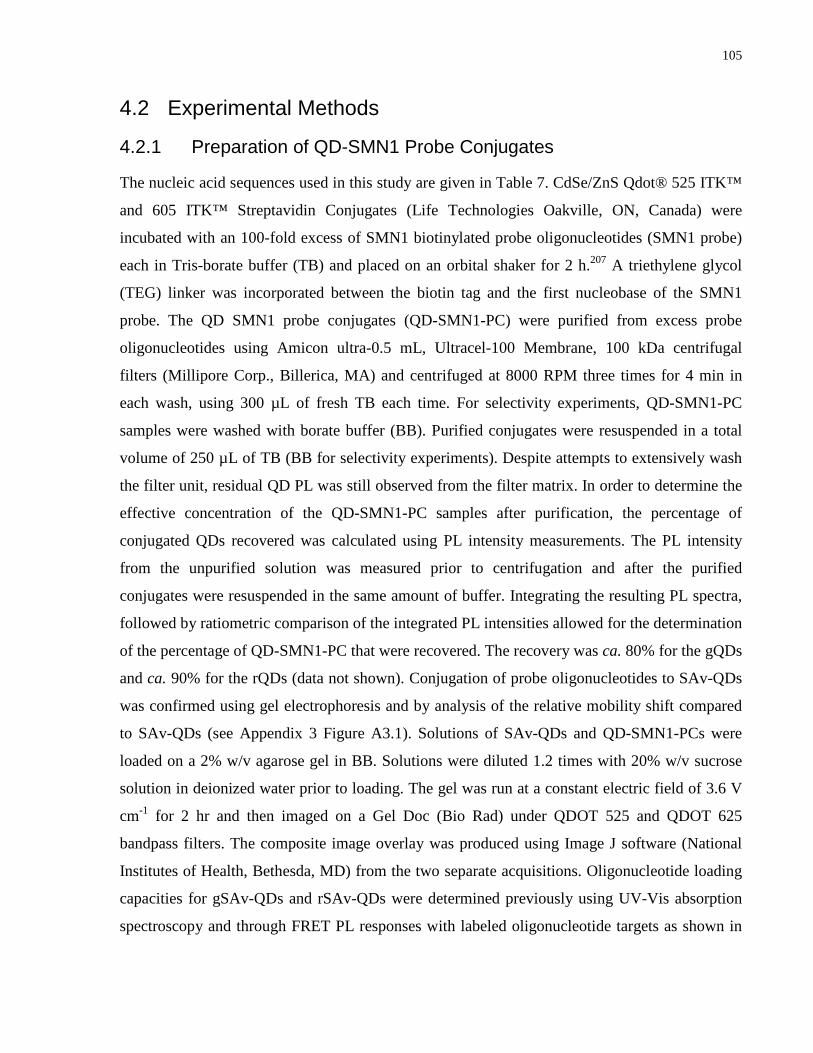
105
4.2 Experimental Methods
4.2.1 Preparation of QD-SMN1 Probe Conjugates
The nucleic acid sequences used in this study are given in Table 7. CdSe/ZnS Qdot® 525 ITK™
and 605 ITK™ Streptavidin Conjugates (Life Technologies Oakville, ON, Canada) were
incubated with an 100-fold excess of SMN1 biotinylated probe oligonucleotides (SMN1 probe)
each in Tris-borate buffer (TB) and placed on an orbital shaker for 2 h.207 A triethylene glycol
(TEG) linker was incorporated between the biotin tag and the first nucleobase of the SMN1
probe. The QD SMN1 probe conjugates (QD-SMN1-PC) were purified from excess probe
oligonucleotides using Amicon ultra-0.5 mL, Ultracel-100 Membrane, 100 kDa centrifugal
filters (Millipore Corp., Billerica, MA) and centrifuged at 8000 RPM three times for 4 min in
each wash, using 300 µL of fresh TB each time. For selectivity experiments, QD-SMN1-PC
samples were washed with borate buffer (BB). Purified conjugates were resuspended in a total
volume of 250 µL of TB (BB for selectivity experiments). Despite attempts to extensively wash
the filter unit, residual QD PL was still observed from the filter matrix. In order to determine the
effective concentration of the QD-SMN1-PC samples after purification, the percentage of
conjugated QDs recovered was calculated using PL intensity measurements. The PL intensity
from the unpurified solution was measured prior to centrifugation and after the purified
conjugates were resuspended in the same amount of buffer. Integrating the resulting PL spectra,
followed by ratiometric comparison of the integrated PL intensities allowed for the determination
of the percentage of QD-SMN1-PC that were recovered. The recovery was ca. 80% for the gQDs
and ca. 90% for the rQDs (data not shown). Conjugation of probe oligonucleotides to SAv-QDs
was confirmed using gel electrophoresis and by analysis of the relative mobility shift compared
to SAv-QDs (see Appendix 3 Figure A3.1). Solutions of SAv-QDs and QD-SMN1-PCs were
loaded on a 2% w/v agarose gel in BB. Solutions were diluted 1.2 times with 20% w/v sucrose
solution in deionized water prior to loading. The gel was run at a constant electric field of 3.6 V
cm-1 for 2 hr and then imaged on a Gel Doc (Bio Rad) under QDOT 525 and QDOT 625
bandpass filters. The composite image overlay was produced using Image J software (National
Institutes of Health, Bethesda, MD) from the two separate acquisitions. Oligonucleotide loading
capacities for gSAv-QDs and rSAv-QDs were determined previously using UV-Vis absorption
spectroscopy and through FRET PL responses with labeled oligonucleotide targets as shown in
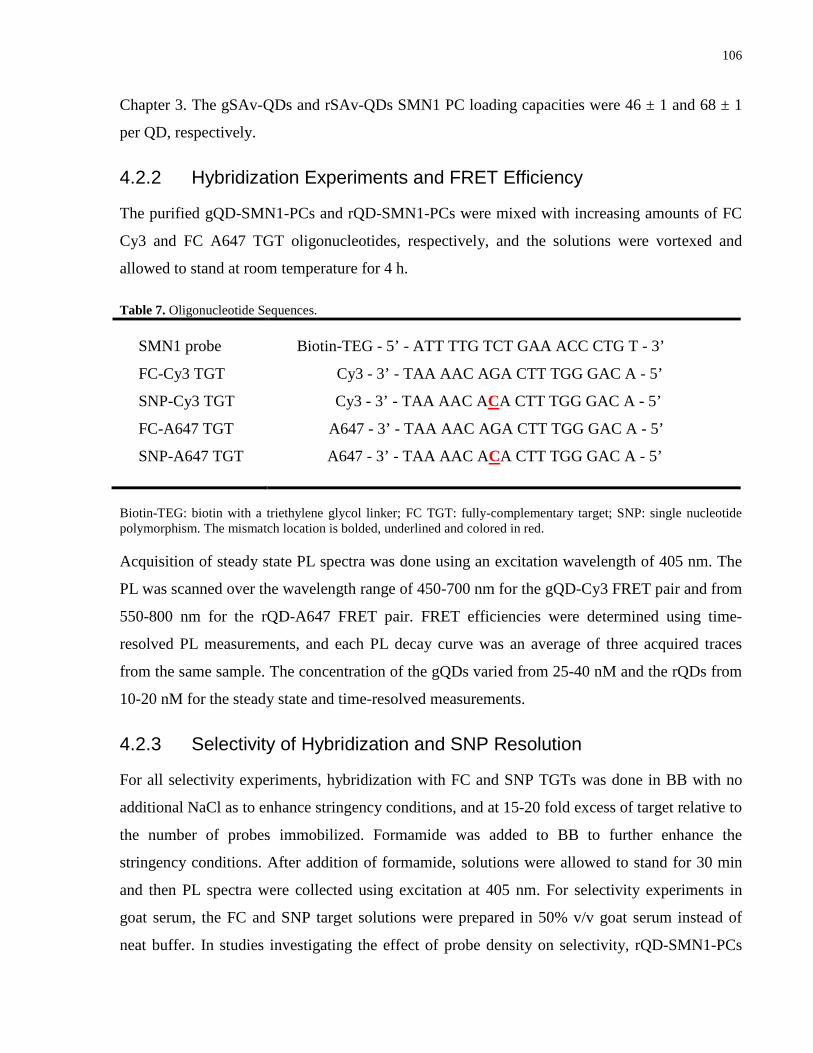
106
Chapter 3. The gSAv-QDs and rSAv-QDs SMN1 PC loading capacities were 46 ± 1 and 68 ± 1
per QD, respectively.
4.2.2 Hybridization Experiments and FRET Efficiency
The purified gQD-SMN1-PCs and rQD-SMN1-PCs were mixed with increasing amounts of FC
Cy3 and FC A647 TGT oligonucleotides, respectively, and the solutions were vortexed and
allowed to stand at room temperature for 4 h.
Table 7. Oligonucleotide Sequences.
SMN1 probe
FC-Cy3 TGT
SNP-Cy3 TGT
FC-A647 TGT
SNP-A647 TGT
Biotin-TEG - 5’ - ATT TTG TCT GAA ACC CTG T - 3’
Cy3 - 3’ - TAA AAC AGA CTT TGG GAC A - 5’
Cy3 - 3’ - TAA AAC ACA CTT TGG GAC A - 5’
A647 - 3’ - TAA AAC AGA CTT TGG GAC A - 5’
A647 - 3’ - TAA AAC ACA CTT TGG GAC A - 5’
Biotin-TEG: biotin with a triethylene glycol linker; FC TGT: fully-complementary target; SNP: single nucleotide polymorphism. The mismatch location is bolded, underlined and colored in red.
Acquisition of steady state PL spectra was done using an excitation wavelength of 405 nm. The
PL was scanned over the wavelength range of 450-700 nm for the gQD-Cy3 FRET pair and from
550-800 nm for the rQD-A647 FRET pair. FRET efficiencies were determined using time-
resolved PL measurements, and each PL decay curve was an average of three acquired traces
from the same sample. The concentration of the gQDs varied from 25-40 nM and the rQDs from
10-20 nM for the steady state and time-resolved measurements.
4.2.3 Selectivity of Hybridization and SNP Resolution
For all selectivity experiments, hybridization with FC and SNP TGTs was done in BB with no
additional NaCl as to enhance stringency conditions, and at 15-20 fold excess of target relative to
the number of probes immobilized. Formamide was added to BB to further enhance the
stringency conditions. After addition of formamide, solutions were allowed to stand for 30 min
and then PL spectra were collected using excitation at 405 nm. For selectivity experiments in
goat serum, the FC and SNP target solutions were prepared in 50% v/v goat serum instead of
neat buffer. In studies investigating the effect of probe density on selectivity, rQD-SMN1-PCs
107
with different amounts of immobilized SMN1 probe were incubated with a 10 fold excess of FC
and SNP TGTs (relative to the amount of immobilized probe). In evaluating the effect of ionic
strength on selectivity, sodium chloride was added directly to the hybridization solutions
containing rQD-SMN1-PCs with FC and SNP TGTs. After an aliquot was added, the solutions
were allowed to stand for 30 min and the PL was determined. Although continued additions
diluted the samples, analysis via an assigned FRET ratio alleviated this issue.
4.3 Results and Discussion
4.3.1 FRET Efficiency and Sensitivity
The sensitivity of QD-FRET nucleic acid hybridization assays are often measured by the
magnitude of the ratio of the FRET ratio which is defined as the ratio of acceptor to donor PL.
This is influenced by the quantum yield of the acceptor and the efficiency of energy transfer as
related to the number of donor-acceptors interactions at the QD interface. Two FRET pairs are
considered herein; gQD-Cy3 and rQD-A647 and have been extensively characterized
spectroscopically by our group. The quantum yields of the Cy3 and A647 dyes that are the labels
on the target oligonucleotides have been previously determined to be 0.2 and 0.52,
respectively.209 Despite the ca. 2.5 fold brighter PL of A647 as compared to Cy3, the sixth power
distance dependence of FRET and the energy transfer efficiency will also significantly influence
the intensity of FRET sensitized acceptor PL as governed by the Förster formalism. The
efficiency of energy transfer (E) is given by Eqn. 20 (previously defined in Chapter 1), where R0
is the Förster distance and the donor-acceptor separation distance is given by r. 6
6 6o
o
nREnR r
=+
(20)
These QD-dye FRET pairs have been extensively characterized spectroscopically by our group.
The Förster distances for the gQD-Cy3 and rQD-A647 FRET pairs were determined to be 6.2
and 8.0 nm, respectively. The reasoning for the 1.3-fold larger Förster distance for the
rQD-A647 FRET pair is two-fold. The donor-acceptor spectral overlap is much larger for the
rQD-A647 FRET pair cf. 1.55 × 10⁻⁹ cm6∙mol-1 vs 6.31 × 10⁻¹⁰ cm6∙mol-1 than for the gQD-Cy3
FRET pair as determined in Chapter 3.209 Furthermore, the quantum yield of the SAv-rQDs (Φ =
0.89) is also ca. 1.9-fold larger than that of the SAv-gQDs (Φ = 0.48). An increased Förster
distance ultimately offers improved FRET efficiency for larger values of r. This can be
108
illustrated by dividing the right side of Eqn. 20 by R06. In this form Eqn. 20 describes the energy
transfer efficiency as function of (r/R0) for a given FRET pair. This has important implications
on QD-FRET since the donor PL emission is tuned by the size of the nanocrystal. Furthermore, it
is noteworthy to mention that the Förster formalism considers the donor and acceptor as point
dipoles, where the center-to-center distance is taken from the center of the QD.210 The intrinsic
size of different QDs will influence the efficiency of energy transfer. The CdSe/ZnS QDs
nanocrystals that emit at 525 nm have an inorganic diameter of about 3 nm, whereas the 605
QDs had a diameter closer to 5 nm.36 This 66% relative increase in size of the rQDs would have
a negative impact on energy transfer efficiency given that the Förster distances for the two FRET
pairs are identical. For the FRET pairs described herein, the larger Förster distance for the rQD-
A647 FRET will likely compensate for the increased intrinsic size of the nanocrystal. Moreover,
the surface chemistry of the QDs used herein consists of anamphilic polymer terminated with
carboxylic acids. The QDs are further conjugated with SAv which adds considerable size.The
diameters of the the SAv-gQDs and SAv-rQDs were reported to be 12 and 15 nm, respectively as
measured by the manufacturer through size-exclusion chromatography. Using fluorescence
correlation spectroscopy (FCS), we measured the radius of hydration of both colors of SAv-QDs.
A value of 8.47 ± 0.14 nm was found for the SAv-gQDs and 12.74 ± 0.51 nm for the SAv-rQDs,
Other reports in the literature have measured these same QDs to be indistinguishable in
hydrodynamic radius within experimental precision using FCS, albeit the SAv-rQDs have a
higher mean hydrodynamic radius.211, 212 These data suggest that the proportional differences in
intrinsic nanocrystal size are in fact lessened by both the amphiliphilic polymer and the
immobilized SAv. Nonetheless, since these nanocrystals are prepared in batch synthesis, slight
variations in size and resulting composition may result between different studies. In Chapter 3 it
was determined that 46 and 68 nucleic acid probes could be immobilized on the SAv-gQDs and
SAv-rQDs, respectively using a combination of absorbance and fluorescence spectroscopy. This
occupancy of biotin binding sites at each QD interface is also consisten with what others have
reported in the literature.213 The ability to immobilize ca. and additional 20 probes on the SAv-
rQD should also provide for improved energy transfer efficiency as displayed by Eqn. 1. It was
anticipated that similar energy transfer efficiencies would be displayed in both FRET pairs.
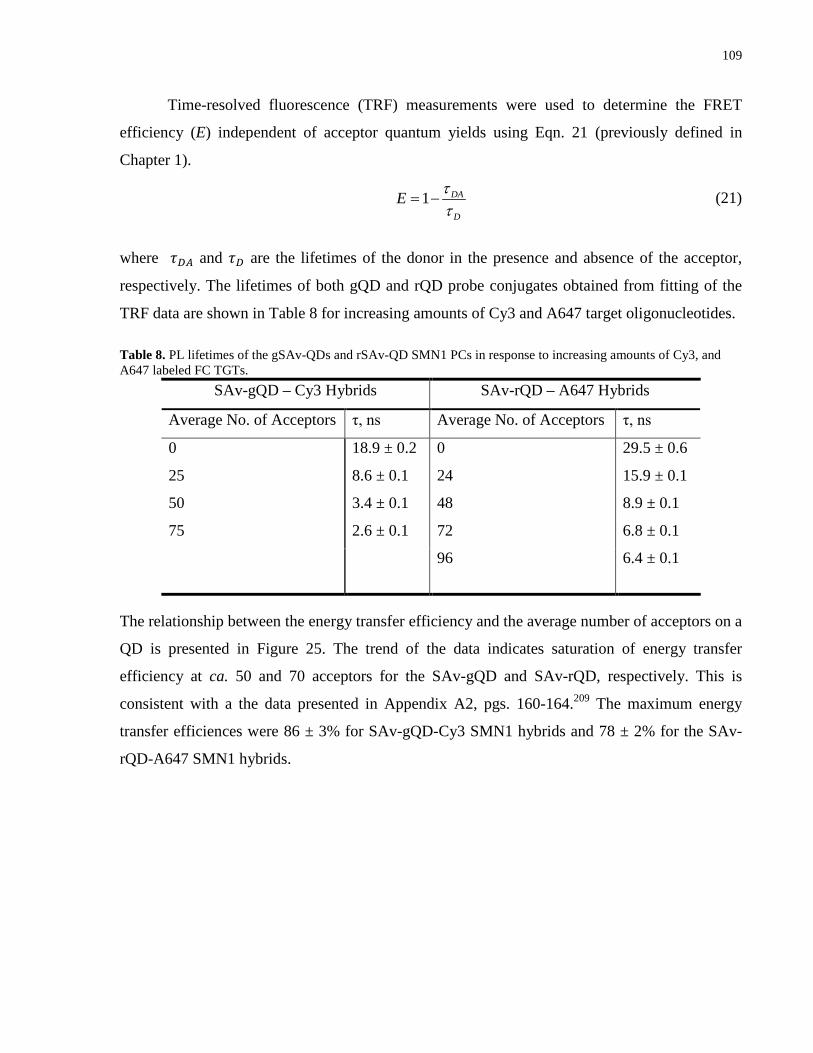
109
Time-resolved fluorescence (TRF) measurements were used to determine the FRET
efficiency (E) independent of acceptor quantum yields using Eqn. 21 (previously defined in
Chapter 1).
1 DA
D
E ττ
= − (21)
where 𝜏𝐷𝐴 and 𝜏𝐷 are the lifetimes of the donor in the presence and absence of the acceptor,
respectively. The lifetimes of both gQD and rQD probe conjugates obtained from fitting of the
TRF data are shown in Table 8 for increasing amounts of Cy3 and A647 target oligonucleotides.
Table 8. PL lifetimes of the gSAv-QDs and rSAv-QD SMN1 PCs in response to increasing amounts of Cy3, and A647 labeled FC TGTs.
SAv-gQD – Cy3 Hybrids SAv-rQD – A647 Hybrids
Average No. of Acceptors τ, ns Average No. of Acceptors τ, ns
0
25
50
75
18.9 ± 0.2
8.6 ± 0.1
3.4 ± 0.1
2.6 ± 0.1
0
24
48
72
96
29.5 ± 0.6
15.9 ± 0.1
8.9 ± 0.1
6.8 ± 0.1
6.4 ± 0.1
The relationship between the energy transfer efficiency and the average number of acceptors on a
QD is presented in Figure 25. The trend of the data indicates saturation of energy transfer
efficiency at ca. 50 and 70 acceptors for the SAv-gQD and SAv-rQD, respectively. This is
consistent with a the data presented in Appendix A2, pgs. 160-164.209 The maximum energy
transfer efficiences were 86 ± 3% for SAv-gQD-Cy3 SMN1 hybrids and 78 ± 2% for the SAv-
rQD-A647 SMN1 hybrids.
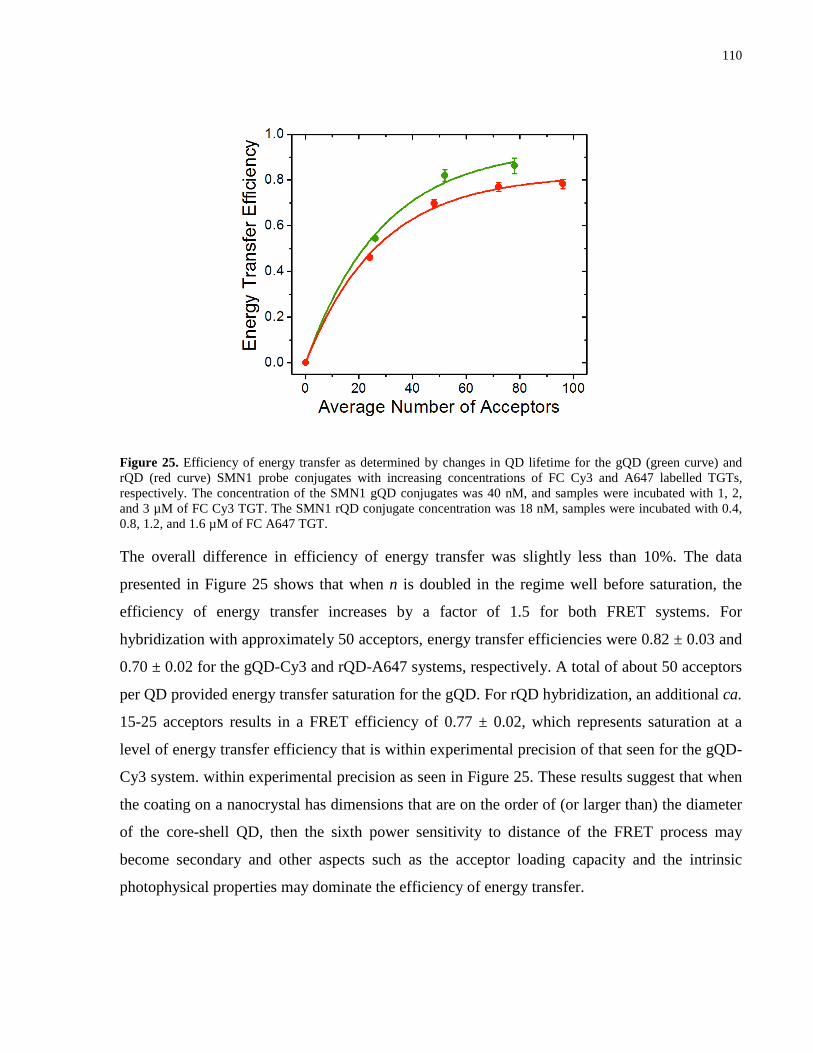
110
Figure 25. Efficiency of energy transfer as determined by changes in QD lifetime for the gQD (green curve) and rQD (red curve) SMN1 probe conjugates with increasing concentrations of FC Cy3 and A647 labelled TGTs, respectively. The concentration of the SMN1 gQD conjugates was 40 nM, and samples were incubated with 1, 2, and 3 µM of FC Cy3 TGT. The SMN1 rQD conjugate concentration was 18 nM, samples were incubated with 0.4, 0.8, 1.2, and 1.6 µM of FC A647 TGT.
The overall difference in efficiency of energy transfer was slightly less than 10%. The data
presented in Figure 25 shows that when n is doubled in the regime well before saturation, the
efficiency of energy transfer increases by a factor of 1.5 for both FRET systems. For
hybridization with approximately 50 acceptors, energy transfer efficiencies were 0.82 ± 0.03 and
0.70 ± 0.02 for the gQD-Cy3 and rQD-A647 systems, respectively. A total of about 50 acceptors
per QD provided energy transfer saturation for the gQD. For rQD hybridization, an additional ca.
15-25 acceptors results in a FRET efficiency of 0.77 ± 0.02, which represents saturation at a
level of energy transfer efficiency that is within experimental precision of that seen for the gQD-
Cy3 system. within experimental precision as seen in Figure 25. These results suggest that when
the coating on a nanocrystal has dimensions that are on the order of (or larger than) the diameter
of the core-shell QD, then the sixth power sensitivity to distance of the FRET process may
become secondary and other aspects such as the acceptor loading capacity and the intrinsic
photophysical properties may dominate the efficiency of energy transfer.
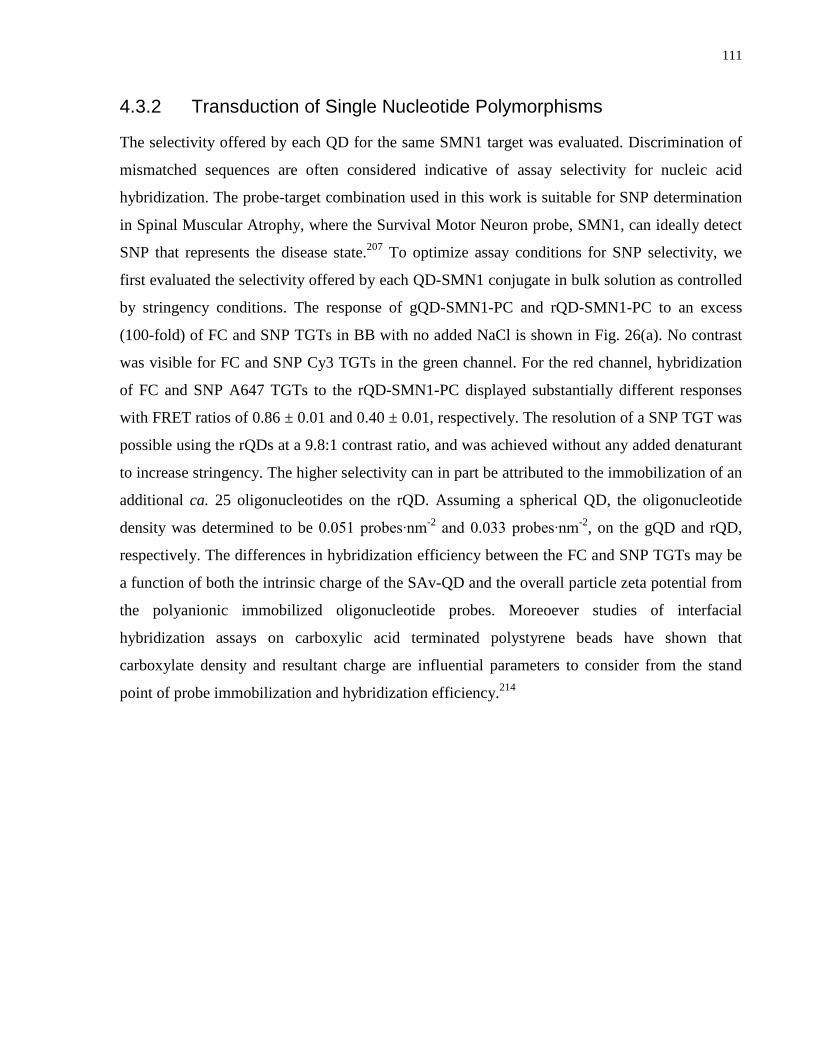
111
4.3.2 Transduction of Single Nucleotide Polymorphisms
The selectivity offered by each QD for the same SMN1 target was evaluated. Discrimination of
mismatched sequences are often considered indicative of assay selectivity for nucleic acid
hybridization. The probe-target combination used in this work is suitable for SNP determination
in Spinal Muscular Atrophy, where the Survival Motor Neuron probe, SMN1, can ideally detect
SNP that represents the disease state.207 To optimize assay conditions for SNP selectivity, we
first evaluated the selectivity offered by each QD-SMN1 conjugate in bulk solution as controlled
by stringency conditions. The response of gQD-SMN1-PC and rQD-SMN1-PC to an excess
(100-fold) of FC and SNP TGTs in BB with no added NaCl is shown in Fig. 26(a). No contrast
was visible for FC and SNP Cy3 TGTs in the green channel. For the red channel, hybridization
of FC and SNP A647 TGTs to the rQD-SMN1-PC displayed substantially different responses
with FRET ratios of 0.86 ± 0.01 and 0.40 ± 0.01, respectively. The resolution of a SNP TGT was
possible using the rQDs at a 9.8:1 contrast ratio, and was achieved without any added denaturant
to increase stringency. The higher selectivity can in part be attributed to the immobilization of an
additional ca. 25 oligonucleotides on the rQD. Assuming a spherical QD, the oligonucleotide
density was determined to be 0.051 probes∙nm-2 and 0.033 probes∙nm-2, on the gQD and rQD,
respectively. The differences in hybridization efficiency between the FC and SNP TGTs may be
a function of both the intrinsic charge of the SAv-QD and the overall particle zeta potential from
the polyanionic immobilized oligonucleotide probes. Moreoever studies of interfacial
hybridization assays on carboxylic acid terminated polystyrene beads have shown that
carboxylate density and resultant charge are influential parameters to consider from the stand
point of probe immobilization and hybridization efficiency.214
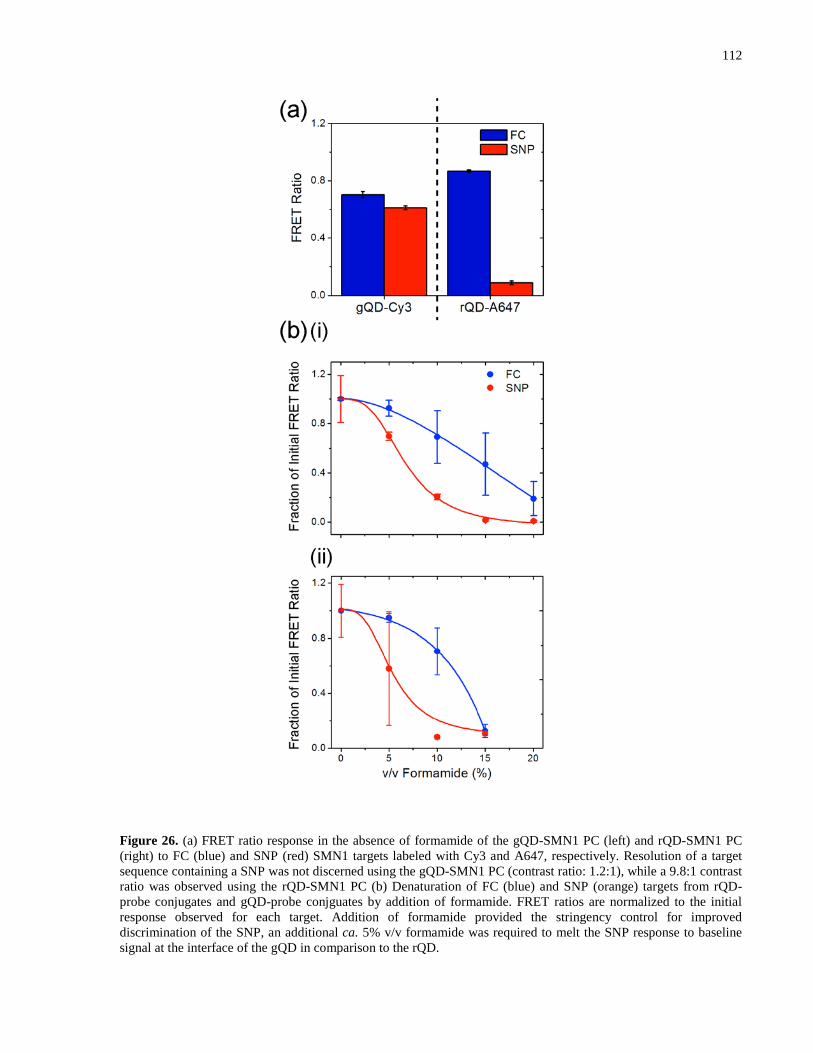
112
Figure 26. (a) FRET ratio response in the absence of formamide of the gQD-SMN1 PC (left) and rQD-SMN1 PC (right) to FC (blue) and SNP (red) SMN1 targets labeled with Cy3 and A647, respectively. Resolution of a target sequence containing a SNP was not discerned using the gQD-SMN1 PC (contrast ratio: 1.2:1), while a 9.8:1 contrast ratio was observed using the rQD-SMN1 PC (b) Denaturation of FC (blue) and SNP (orange) targets from rQD-probe conjugates and gQD-probe conjguates by addition of formamide. FRET ratios are normalized to the initial response observed for each target. Addition of formamide provided the stringency control for improved discrimination of the SNP, an additional ca. 5% v/v formamide was required to melt the SNP response to baseline signal at the interface of the gQD in comparison to the rQD.
113
To further improve the contrast between FC:SNP TGTs and to evaluate the difference in duplex
stability at each QD interface, formamide (% v/v) was incorporated into the hybridization assay
for the rQD-SMN1 PC with FC and SNP TGTs.25 Figure 26(b) (i) and (ii) show the assay
response to increasing amounts of formamide for FC and SNP TGTs on gQD and rQD-SMN1
hybrids. The respective FRET ratios are plotted as a percentage of the initial response for both
targets to illustrate the degree of duplex denaturation at each increment of added formamide. In
Figure 26(b) (i) an optimal contrast of 33:1 between FC and SNP TGTs at the gQD interface was
observed at 15% v/v formamide in BB where the FRET ratios for the FC (0.33 ± 0.17) and SNP
(0.010 ± 0.005) TGTs were reduced to 47% and 2% of their initial response, respectively. On the
contrary, at the rQD interface only 10% v/v formamide in BB was required to achieve an optimal
contrast ratio of 43:1 (Figure 26(b) (ii)). The response of the SNP TGT is reduced to 8% of its
initial response with a FRET ratio of 0.012 ± 0.001, while the response from FC TGT is still
large at 71% with a FRET ratio of 0.51 ± 0.12. Furthermore, differences in hybridization
efficiency can be seen for the FC TGT at each respective QD interface. As shown in Figure 26(b)
(i) 50% of the FC duplexes at the gQD interface are denatured at ca. 15% v/v formamide while
only ca. 12.5% v/v formamide is required to achieve the same degree of denaturation on the rQD
(Figure 26(b) (ii)).
4.3.3 Effect of Probe Number on Selectivity
To evaluate whether the higher stringency of hybridization at the rQD-SMN1-PC was in fact a
result of overall conjugate charge and or a result of differences in the number of immobilized
oligonucleotides, different amounts of SMN1 probe oligonucleotides were immobilized on the
rQDs. The immobilization of different amounts of SMN1 probe on the rQDs was confirmed by
gel electrophoresis (see Appendix 3 Figure A3.2) where increased probe number resulted in
increased migration distances toward the anode. It was estimated that a maximum of ca. 46
SMN1 oligonucleotide probes could be immobilized on gSAv-QDs. If a similar number of
SMN1 probes were immobilized on the rSAv-QD then a contrast of 1.2:1 between FC and SNPs
TGTs would be expected given that the oligonucleotides were the predominant source of the
charge difference between both sizes of QD.
114
Figure 27. Immobilization of an increasing number of SMN1 probes on rQDs and the resultant response of the bioconjugates to FC and SNP TGTs. Despite only derivatization with 10 equivalents (Eq.) of SMN1 probe, contrast between FC and SNP TGTs is seen, with the highest contrast ratio (9.8:1) visible at saturation (67 probes per QD).
The response of the rSAv-QD with an increasing number of immobilized SMN1 probes to FC
and SNP TGTs is shown in Fig. 27. Even at 10 immobilized SMN1 oligonucleotides per QD,
improved contrast (1.5:1) between FC and SNP TGTs was visible where the FRET ratios for the
FC and SNP TGTs were 0.29 ± 0.01 and 0.18 ± 0.01, respectively. A minimum of 10 Eq. of
probe was chosen to avoid Poisson statistics governing the distribution of oligonuceotides on the
SAv-rQDs which is often seen for biomolecule conjugates of 5 Eq. or less.215 At 25 and 50
SMN1 probes per QD, the response to the FC TGT increased to 0.49 ± 0.01 and 0.64 ± 0.01,
where the response to the SNP increased to 0.34 ± 0.01 and 0.40 ± 0.02, and respectively. At an
average of 50 SMN1 probes immobilized per rQD these rQD-SMN1-PC have a similar probe
valency to the gQD-SMN1-PC at saturation of immobilized probe, yet they display a slightly
improved contrast ratio (cf. 1.6 vs. 1.2). These data suggest that the instrinsic charge of the QD
may also influence the hybridization efficiency assuming that the increase in charge provided by
the ca. 50 oligonucleotide probes would be consistent amongst both QDs. The isolectric point of
immobilized monolayers of SAv has been reported to be ca. 5.5 and the resultant charge is
dependent on ionic strength.216 Since hybridization was conducted herein at pH 9.25, the SAv
immobilized on both QDs are negatively charged and contribute to the overall effective charge of
the QDs in addition to the underlying carboxylic acid coating on the QDs to which the protein is
conjugated. The zeta potentials of the gSAv-QDs and rSAv-QDs were measured to be -20 mV
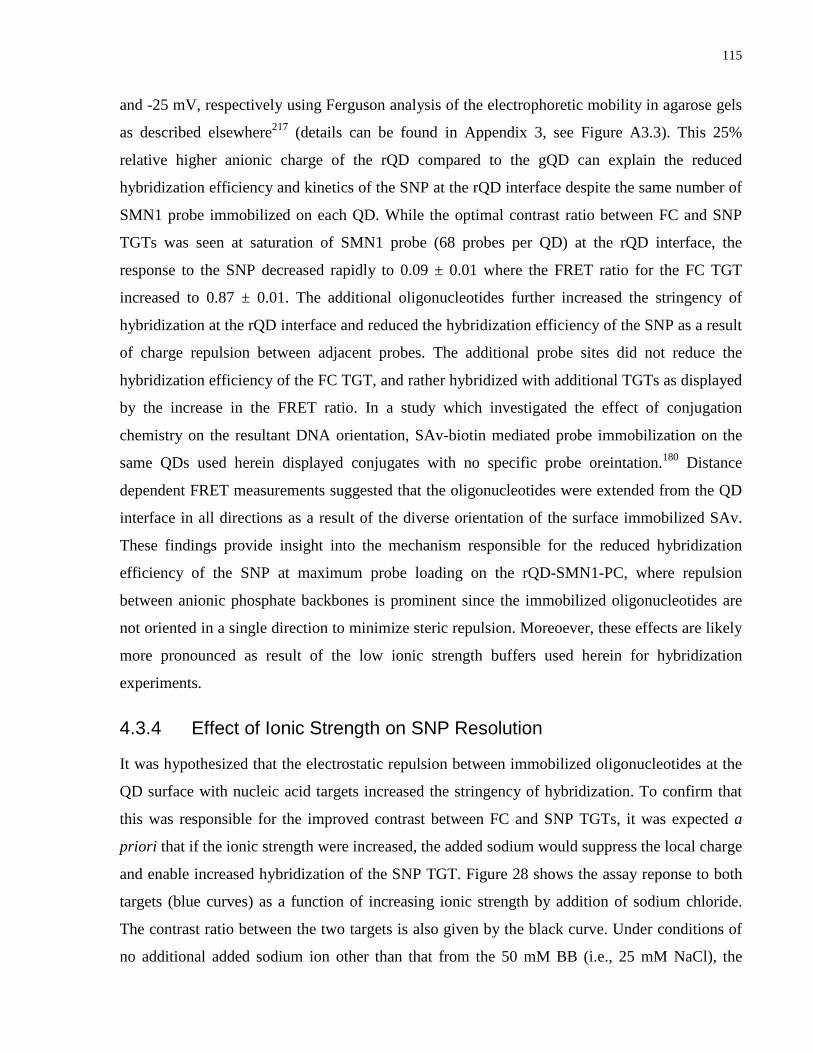
115
and -25 mV, respectively using Ferguson analysis of the electrophoretic mobility in agarose gels
as described elsewhere217 (details can be found in Appendix 3, see Figure A3.3). This 25%
relative higher anionic charge of the rQD compared to the gQD can explain the reduced
hybridization efficiency and kinetics of the SNP at the rQD interface despite the same number of
SMN1 probe immobilized on each QD. While the optimal contrast ratio between FC and SNP
TGTs was seen at saturation of SMN1 probe (68 probes per QD) at the rQD interface, the
response to the SNP decreased rapidly to 0.09 ± 0.01 where the FRET ratio for the FC TGT
increased to 0.87 ± 0.01. The additional oligonucleotides further increased the stringency of
hybridization at the rQD interface and reduced the hybridization efficiency of the SNP as a result
of charge repulsion between adjacent probes. The additional probe sites did not reduce the
hybridization efficiency of the FC TGT, and rather hybridized with additional TGTs as displayed
by the increase in the FRET ratio. In a study which investigated the effect of conjugation
chemistry on the resultant DNA orientation, SAv-biotin mediated probe immobilization on the
same QDs used herein displayed conjugates with no specific probe oreintation.180 Distance
dependent FRET measurements suggested that the oligonucleotides were extended from the QD
interface in all directions as a result of the diverse orientation of the surface immobilized SAv.
These findings provide insight into the mechanism responsible for the reduced hybridization
efficiency of the SNP at maximum probe loading on the rQD-SMN1-PC, where repulsion
between anionic phosphate backbones is prominent since the immobilized oligonucleotides are
not oriented in a single direction to minimize steric repulsion. Moreoever, these effects are likely
more pronounced as result of the low ionic strength buffers used herein for hybridization
experiments.
4.3.4 Effect of Ionic Strength on SNP Resolution
It was hypothesized that the electrostatic repulsion between immobilized oligonucleotides at the
QD surface with nucleic acid targets increased the stringency of hybridization. To confirm that
this was responsible for the improved contrast between FC and SNP TGTs, it was expected a
priori that if the ionic strength were increased, the added sodium would suppress the local charge
and enable increased hybridization of the SNP TGT. Figure 28 shows the assay reponse to both
targets (blue curves) as a function of increasing ionic strength by addition of sodium chloride.
The contrast ratio between the two targets is also given by the black curve. Under conditions of
no additional added sodium ion other than that from the 50 mM BB (i.e., 25 mM NaCl), the
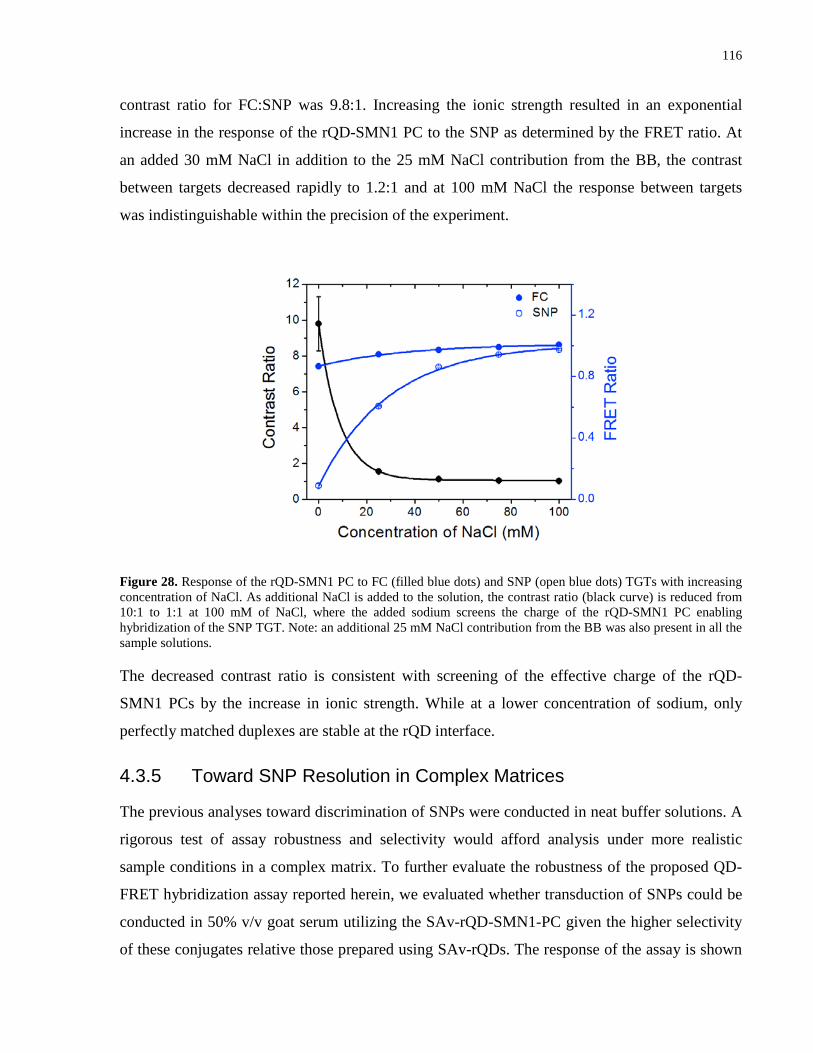
116
contrast ratio for FC:SNP was 9.8:1. Increasing the ionic strength resulted in an exponential
increase in the response of the rQD-SMN1 PC to the SNP as determined by the FRET ratio. At
an added 30 mM NaCl in addition to the 25 mM NaCl contribution from the BB, the contrast
between targets decreased rapidly to 1.2:1 and at 100 mM NaCl the response between targets
was indistinguishable within the precision of the experiment.
Figure 28. Response of the rQD-SMN1 PC to FC (filled blue dots) and SNP (open blue dots) TGTs with increasing concentration of NaCl. As additional NaCl is added to the solution, the contrast ratio (black curve) is reduced from 10:1 to 1:1 at 100 mM of NaCl, where the added sodium screens the charge of the rQD-SMN1 PC enabling hybridization of the SNP TGT. Note: an additional 25 mM NaCl contribution from the BB was also present in all the sample solutions.
The decreased contrast ratio is consistent with screening of the effective charge of the rQD-
SMN1 PCs by the increase in ionic strength. While at a lower concentration of sodium, only
perfectly matched duplexes are stable at the rQD interface.
4.3.5 Toward SNP Resolution in Complex Matrices
The previous analyses toward discrimination of SNPs were conducted in neat buffer solutions. A
rigorous test of assay robustness and selectivity would afford analysis under more realistic
sample conditions in a complex matrix. To further evaluate the robustness of the proposed QD-
FRET hybridization assay reported herein, we evaluated whether transduction of SNPs could be
conducted in 50% v/v goat serum utilizing the SAv-rQD-SMN1-PC given the higher selectivity
of these conjugates relative those prepared using SAv-rQDs. The response of the assay is shown
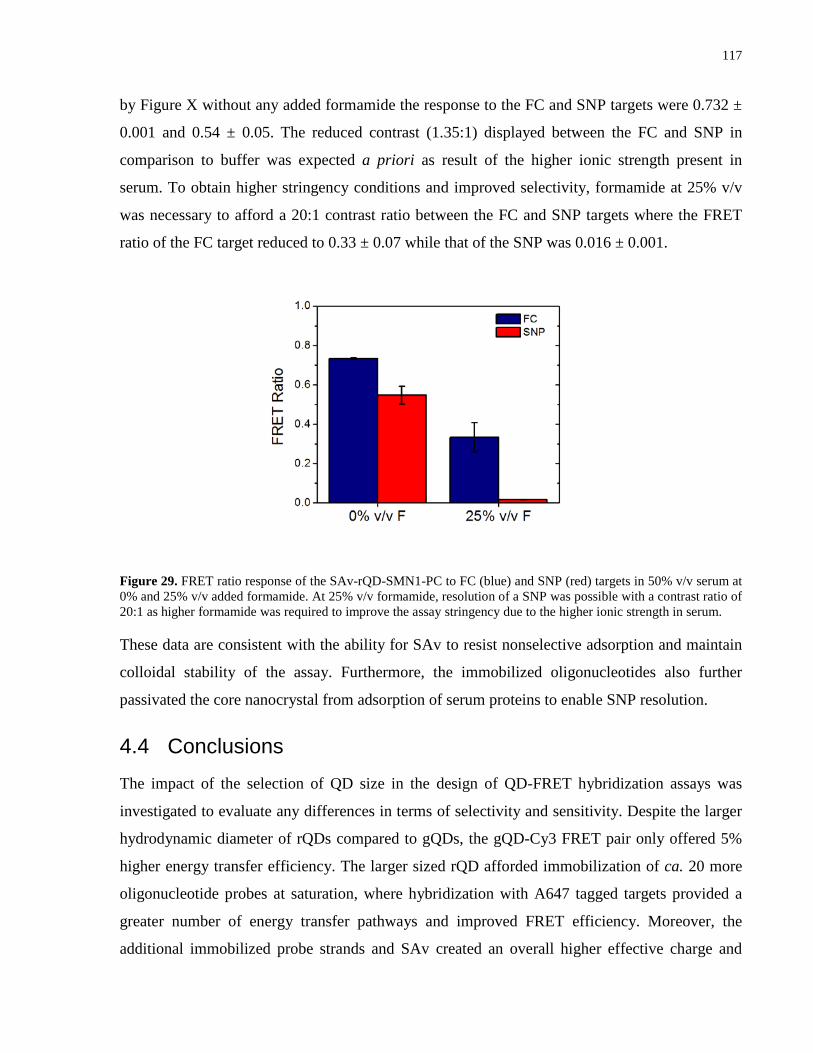
117
by Figure X without any added formamide the response to the FC and SNP targets were 0.732 ±
0.001 and 0.54 ± 0.05. The reduced contrast (1.35:1) displayed between the FC and SNP in
comparison to buffer was expected a priori as result of the higher ionic strength present in
serum. To obtain higher stringency conditions and improved selectivity, formamide at 25% v/v
was necessary to afford a 20:1 contrast ratio between the FC and SNP targets where the FRET
ratio of the FC target reduced to 0.33 ± 0.07 while that of the SNP was 0.016 ± 0.001.
Figure 29. FRET ratio response of the SAv-rQD-SMN1-PC to FC (blue) and SNP (red) targets in 50% v/v serum at 0% and 25% v/v added formamide. At 25% v/v formamide, resolution of a SNP was possible with a contrast ratio of 20:1 as higher formamide was required to improve the assay stringency due to the higher ionic strength in serum.
These data are consistent with the ability for SAv to resist nonselective adsorption and maintain
colloidal stability of the assay. Furthermore, the immobilized oligonucleotides also further
passivated the core nanocrystal from adsorption of serum proteins to enable SNP resolution.
4.4 Conclusions The impact of the selection of QD size in the design of QD-FRET hybridization assays was
investigated to evaluate any differences in terms of selectivity and sensitivity. Despite the larger
hydrodynamic diameter of rQDs compared to gQDs, the gQD-Cy3 FRET pair only offered 5%
higher energy transfer efficiency. The larger sized rQD afforded immobilization of ca. 20 more
oligonucleotide probes at saturation, where hybridization with A647 tagged targets provided a
greater number of energy transfer pathways and improved FRET efficiency. Moreover, the
additional immobilized probe strands and SAv created an overall higher effective charge and
118
increased the stringency of hybridization at the rQD interface enabling discrimination of a SNP
target without any added denaturant. In contrast, resolution of a SNP was not possible when the
assay was conducted with the gQDs. These results provide important insights about criteria for
the design and optimization of QD-FRET bioassays and biosensors.
119
Transduction of Unlabeled Target Oligonucleotides 5and Resolution of Single Nucleotide Polymorphisms in an Electrokinetically Controlled Microfluidic Chip using Immobilized Quantum Dots and Fluorescence Resonance Energy Transfer
Of the following data presented in Chapter 5, MON collected and analyzed the in-channel
regeneration data and contributed to acquisition of SNP resolution data. Dr. Ilya Gourevich is
thanked for assistance with SEM imaging of the immobilized QDs. The remainder of the
experiments and analyses of collected data were performed by AJT.
5.1 Introduction
In Chapter 4, the differences in selectivity between the two colours of SAv-QDs toward SNP
discrimination provided insight into optimization of the on-chip assay. Up until this point,
resolution of SNPs on-chip was not possible in both the single-colour or multi-colour assay
formats presented in Chapters 2 and 3, respectively. Chapter 4 elucidated why this challenge
existed. In single-colour assays with the gQD-Cy3 FRET as demonstrated in Chapter 2, SNP
resolution would not be expected without added denaturant. The multi-colour assay format also
reflected similar interfacial chemistry since the QDs were deposited in a 12:1 ratio of gQD:rQD
and the interface resembled that of a single colour assay using gQDs. Furthermore, only a 15-
fold (relative to the concentration dispensed) excess of oligonucleotide probe was deposited after
initial QD immobilization. The investigation of QD loading capacities suggested that this was
insufficient probe to offer the highest selectivity toward interfacial hybridization. With this
knowledge it was anticipated that SNP resolution could be achieved on-chip with careful
refinement of conditions for assay assembly and target hybridization and by utilizing a single-
colour approach with the rQD-A647 FRET pair. This was realized and a contrast ratio between
FC:SNP of 108:1 was possible at only half of the added formamide utilized in Chapter 4 for
optimal SNP resolution. Moreover, assay regeneration was possible on-chip where a single
channel could undergo up to three rounds of hybridization.
In reference to sensitivity of solid-phase assays, electron microscopy was performed on the
immobilized QDs in-channel to evaluate the relative donor densities. As introduced in Chapter 1,
enhancements in FRET efficiency on solid-phase formats arise as a result of the increased donor-
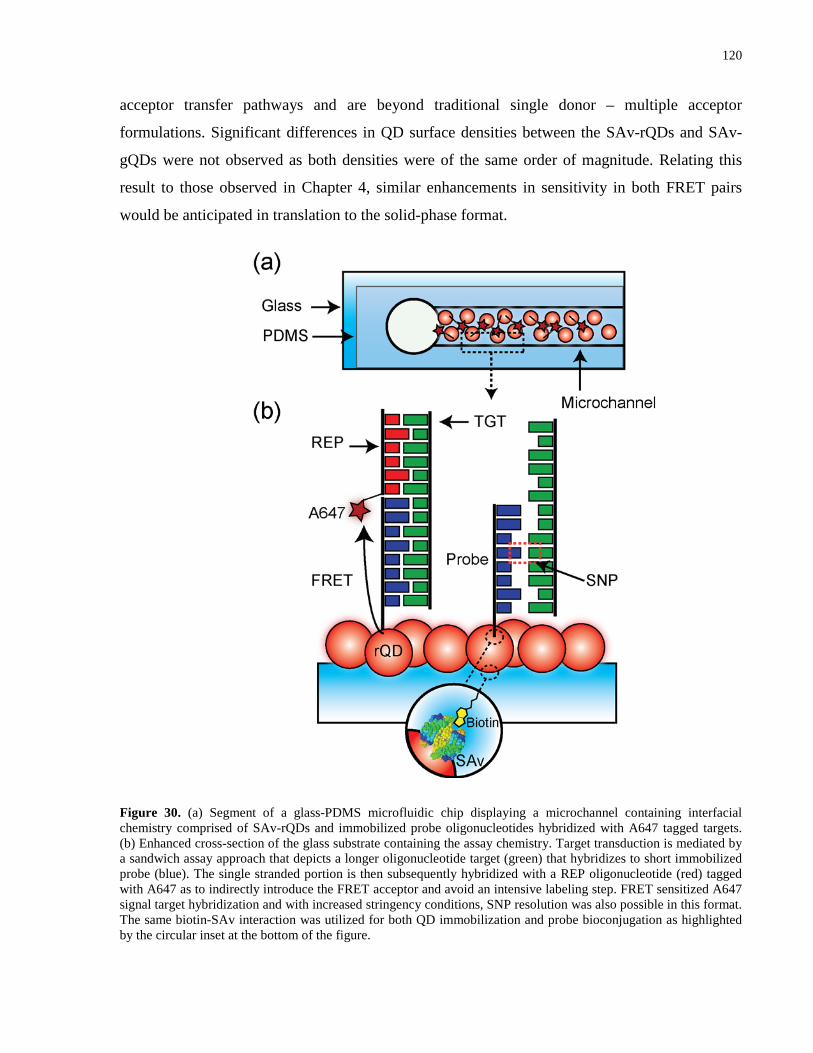
120
acceptor transfer pathways and are beyond traditional single donor – multiple acceptor
formulations. Significant differences in QD surface densities between the SAv-rQDs and SAv-
gQDs were not observed as both densities were of the same order of magnitude. Relating this
result to those observed in Chapter 4, similar enhancements in sensitivity in both FRET pairs
would be anticipated in translation to the solid-phase format.
Figure 30. (a) Segment of a glass-PDMS microfluidic chip displaying a microchannel containing interfacial chemistry comprised of SAv-rQDs and immobilized probe oligonucleotides hybridized with A647 tagged targets. (b) Enhanced cross-section of the glass substrate containing the assay chemistry. Target transduction is mediated by a sandwich assay approach that depicts a longer oligonucleotide target (green) that hybridizes to short immobilized probe (blue). The single stranded portion is then subsequently hybridized with a REP oligonucleotide (red) tagged with A647 as to indirectly introduce the FRET acceptor and avoid an intensive labeling step. FRET sensitized A647 signal target hybridization and with increased stringency conditions, SNP resolution was also possible in this format. The same biotin-SAv interaction was utilized for both QD immobilization and probe bioconjugation as highlighted by the circular inset at the bottom of the figure.
121
A significant advantage of the chip based assay is the rapid hybridization times which are on the
order of seconds to minutes. In all assays described thus far, transduction of hybridization of
short labeled targets was presented. While these sequences are ideal for proof-of-concept and
assay optimization, they do not reflect targets characteristic of real-world application. The need
for labeling steps would diminish the impact of the fast hybridization kinetics offered by the
microfluidic format and would reduce sample-to-answer response times. An alternate design
strategy that does not require labeled targets and permits transduction of longer target sequences
is a sandwich assay. This transduction scheme is shown in Figure 30, where a short
oligonucleotide probe hybridizes to a longer target sequence in the first step. The extended
ssDNA segment is then hybridized with a reporter oligonucleotide tagged with an A647 label.
While the dye label extends further from the interface in a sandwich configuration, FRET
sensitization of the A647 is still possible from the immobilized QDs and the A647 PL still serves
as the analytical signal. This approach avoids a labeling step prior to detection and is amenable
to target lengths exceeding 100 nucleotides. Through this approach fmol amounts of
oligonucleotide target could still be detected and no loss in assay sensitivity was demonstrated.
For traditional FRET assays relying on FRET sensitized PL intensity, a decreased sensitivity
resulted from implementation of the sandwich assay format due to the larger separation distance
between the QDs and the acceptor dye.168 On the contrary, transduction using spatial FRET
profiles only requires a FRET signal intensity higher than background, so that sensitivity is
controlled by saturation of defined areas of interfacial chemistry and an unambiguous length
measurement provides for quantification. The robustness of the assay was further tested in
complex matrices containing large excesses of BSA and genomic DNA. Target transduction was
still possible and with excellent selectivity.
5.2 Experimental Methods
5.2.1 On-Chip Assay Assembly
Glass substrates were functionalized with biotin using a previously published protocol,218 and the
details of the modification steps can be found in the Appendix 4. Negative relief PDMS stamps
that served as a cover for PDMS-glass microfluidic chips were cast from a glass master that was
fabricated using standard photolithography methods.146 PDMS chips were oxidized in air plasma
for 2 min and reversibly sealed to modified glass coverslips as described elsewhere.209 The
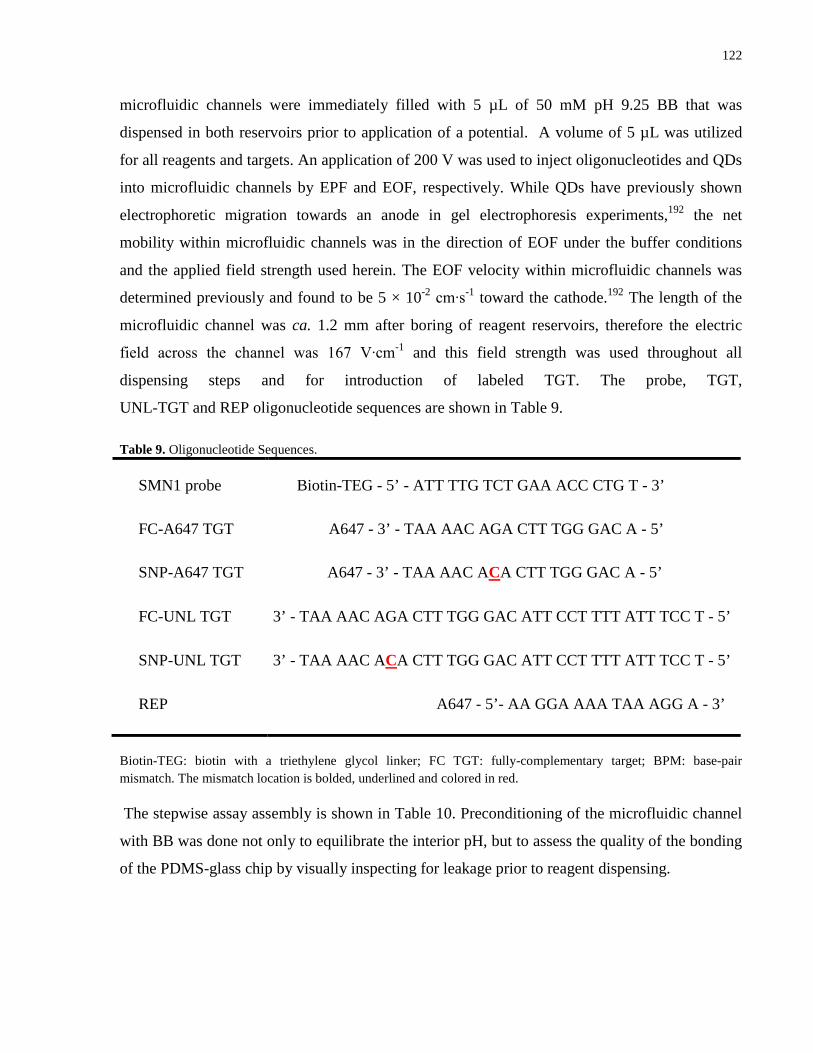
122
microfluidic channels were immediately filled with 5 µL of 50 mM pH 9.25 BB that was
dispensed in both reservoirs prior to application of a potential. A volume of 5 µL was utilized
for all reagents and targets. An application of 200 V was used to inject oligonucleotides and QDs
into microfluidic channels by EPF and EOF, respectively. While QDs have previously shown
electrophoretic migration towards an anode in gel electrophoresis experiments,192 the net
mobility within microfluidic channels was in the direction of EOF under the buffer conditions
and the applied field strength used herein. The EOF velocity within microfluidic channels was
determined previously and found to be 5 × 10⁻² cm∙s-1 toward the cathode.192 The length of the
microfluidic channel was ca. 1.2 mm after boring of reagent reservoirs, therefore the electric
field across the channel was 167 V∙cm-1 and this field strength was used throughout all
dispensing steps and for introduction of labeled TGT. The probe, TGT,
UNL-TGT and REP oligonucleotide sequences are shown in Table 9.
Table 9. Oligonucleotide Sequences.
SMN1 probe
FC-A647 TGT
SNP-A647 TGT
Biotin-TEG - 5’ - ATT TTG TCT GAA ACC CTG T - 3’
A647 - 3’ - TAA AAC AGA CTT TGG GAC A - 5’
A647 - 3’ - TAA AAC ACA CTT TGG GAC A - 5’
FC-UNL TGT 3’ - TAA AAC AGA CTT TGG GAC ATT CCT TTT ATT TCC T - 5’
SNP-UNL TGT 3’ - TAA AAC ACA CTT TGG GAC ATT CCT TTT ATT TCC T - 5’
REP A647 - 5’- AA GGA AAA TAA AGG A - 3’
Biotin-TEG: biotin with a triethylene glycol linker; FC TGT: fully-complementary target; BPM: base-pair mismatch. The mismatch location is bolded, underlined and colored in red.
The stepwise assay assembly is shown in Table 10. Preconditioning of the microfluidic channel
with BB was done not only to equilibrate the interior pH, but to assess the quality of the bonding
of the PDMS-glass chip by visually inspecting for leakage prior to reagent dispensing.
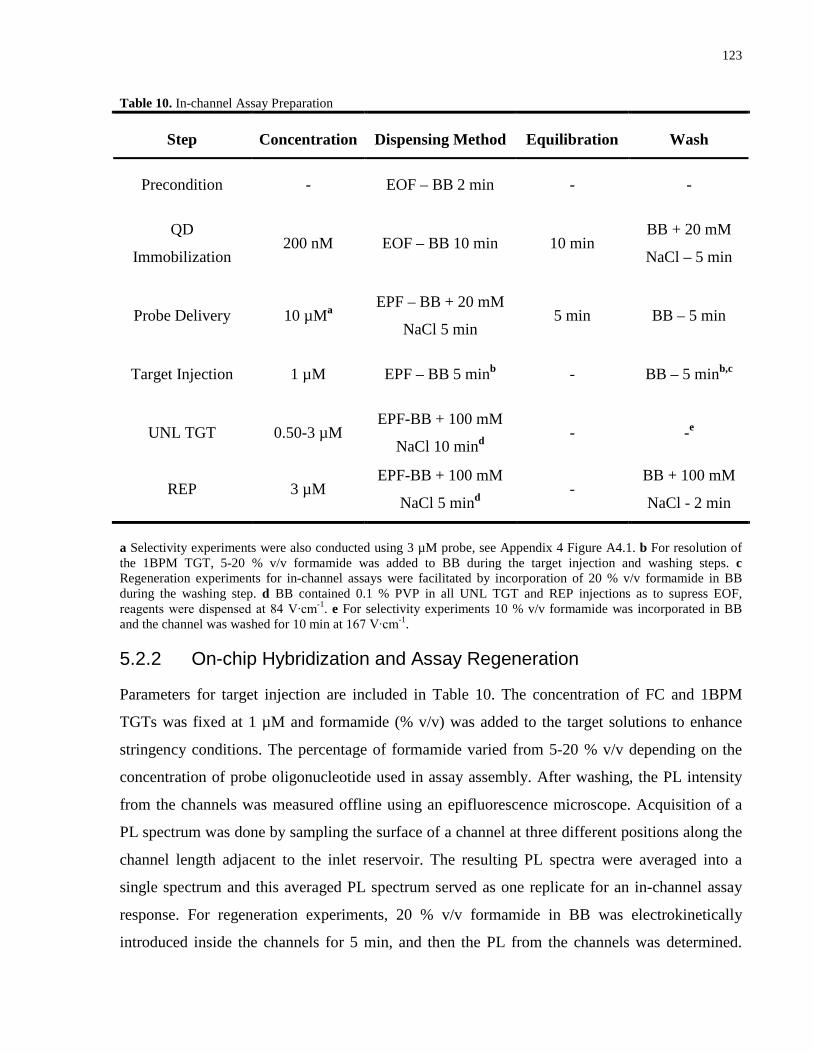
123
Table 10. In-channel Assay Preparation
Step Concentration Dispensing Method Equilibration Wash
Precondition - EOF – BB 2 min - -
QD
Immobilization 200 nM EOF – BB 10 min 10 min
BB + 20 mM
NaCl – 5 min
Probe Delivery 10 µMa EPF – BB + 20 mM
NaCl 5 min 5 min BB – 5 min
Target Injection 1 µM EPF – BB 5 minb - BB – 5 minb,c
UNL TGT 0.50-3 µM EPF-BB + 100 mM
NaCl 10 mind - -e
REP 3 µM EPF-BB + 100 mM
NaCl 5 mind -
BB + 100 mM
NaCl - 2 min
a Selectivity experiments were also conducted using 3 µM probe, see Appendix 4 Figure A4.1. b For resolution of the 1BPM TGT, 5-20 % v/v formamide was added to BB during the target injection and washing steps. c Regeneration experiments for in-channel assays were facilitated by incorporation of 20 % v/v formamide in BB during the washing step. d BB contained 0.1 % PVP in all UNL TGT and REP injections as to supress EOF, reagents were dispensed at 84 V∙cm-1. e For selectivity experiments 10 % v/v formamide was incorporated in BB and the channel was washed for 10 min at 167 V∙cm-1.
5.2.2 On-chip Hybridization and Assay Regeneration
Parameters for target injection are included in Table 10. The concentration of FC and 1BPM
TGTs was fixed at 1 µM and formamide (% v/v) was added to the target solutions to enhance
stringency conditions. The percentage of formamide varied from 5-20 % v/v depending on the
concentration of probe oligonucleotide used in assay assembly. After washing, the PL intensity
from the channels was measured offline using an epifluorescence microscope. Acquisition of a
PL spectrum was done by sampling the surface of a channel at three different positions along the
channel length adjacent to the inlet reservoir. The resulting PL spectra were averaged into a
single spectrum and this averaged PL spectrum served as one replicate for an in-channel assay
response. For regeneration experiments, 20 % v/v formamide in BB was electrokinetically
introduced inside the channels for 5 min, and then the PL from the channels was determined.
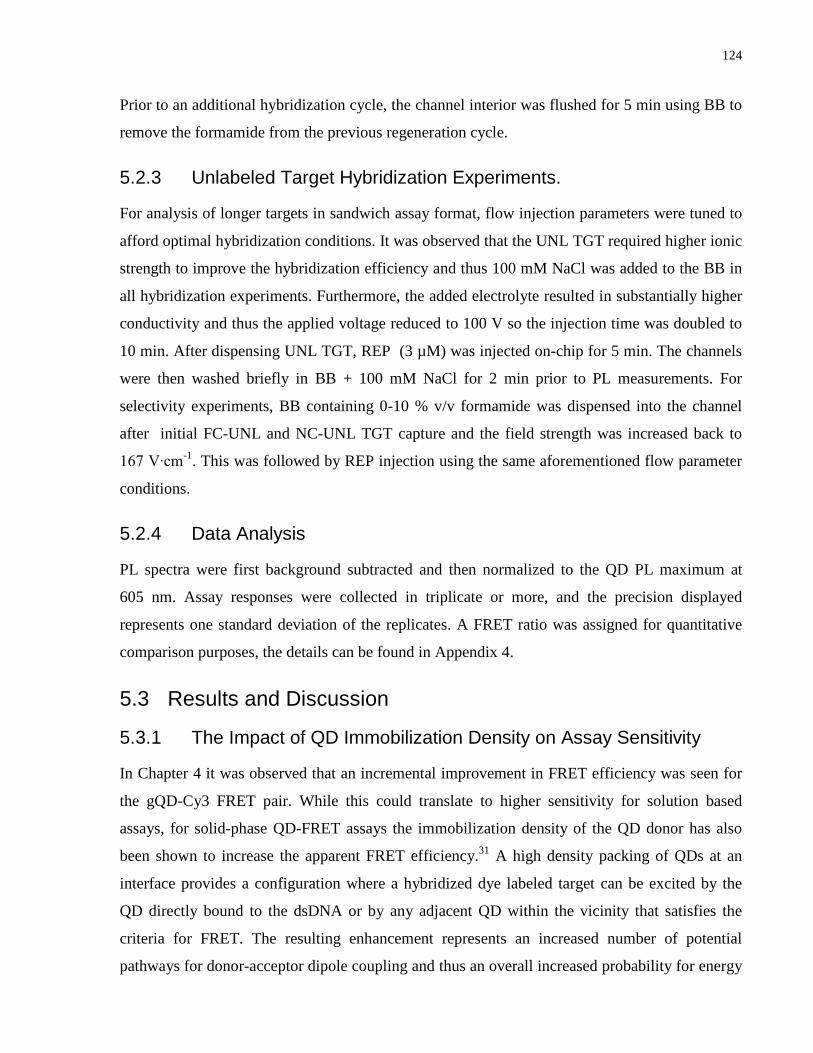
124
Prior to an additional hybridization cycle, the channel interior was flushed for 5 min using BB to
remove the formamide from the previous regeneration cycle.
5.2.3 Unlabeled Target Hybridization Experiments.
For analysis of longer targets in sandwich assay format, flow injection parameters were tuned to
afford optimal hybridization conditions. It was observed that the UNL TGT required higher ionic
strength to improve the hybridization efficiency and thus 100 mM NaCl was added to the BB in
all hybridization experiments. Furthermore, the added electrolyte resulted in substantially higher
conductivity and thus the applied voltage reduced to 100 V so the injection time was doubled to
10 min. After dispensing UNL TGT, REP (3 µM) was injected on-chip for 5 min. The channels
were then washed briefly in BB + 100 mM NaCl for 2 min prior to PL measurements. For
selectivity experiments, BB containing 0-10 % v/v formamide was dispensed into the channel
after initial FC-UNL and NC-UNL TGT capture and the field strength was increased back to
167 V∙cm-1. This was followed by REP injection using the same aforementioned flow parameter
conditions.
5.2.4 Data Analysis
PL spectra were first background subtracted and then normalized to the QD PL maximum at
605 nm. Assay responses were collected in triplicate or more, and the precision displayed
represents one standard deviation of the replicates. A FRET ratio was assigned for quantitative
comparison purposes, the details can be found in Appendix 4.
5.3 Results and Discussion
5.3.1 The Impact of QD Immobilization Density on Assay Sensitivity
In Chapter 4 it was observed that an incremental improvement in FRET efficiency was seen for
the gQD-Cy3 FRET pair. While this could translate to higher sensitivity for solution based
assays, for solid-phase QD-FRET assays the immobilization density of the QD donor has also
been shown to increase the apparent FRET efficiency.31 A high density packing of QDs at an
interface provides a configuration where a hybridized dye labeled target can be excited by the
QD directly bound to the dsDNA or by any adjacent QD within the vicinity that satisfies the
criteria for FRET. The resulting enhancement represents an increased number of potential
pathways for donor-acceptor dipole coupling and thus an overall increased probability for energy
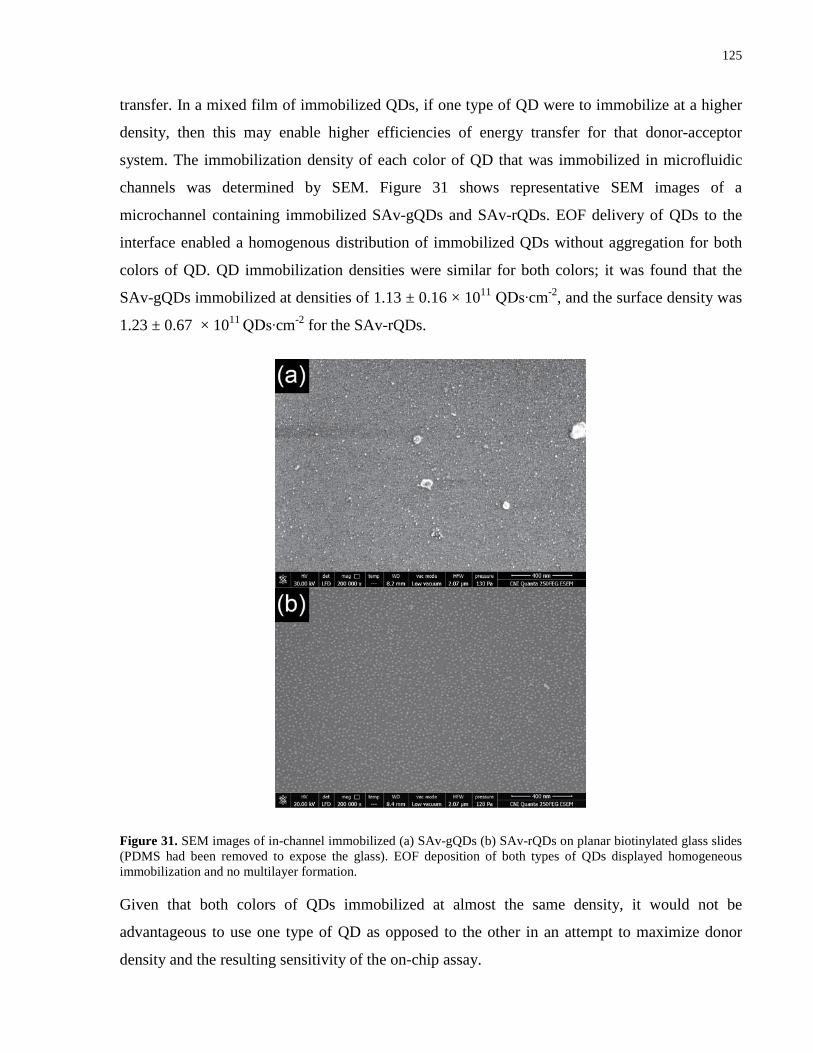
125
transfer. In a mixed film of immobilized QDs, if one type of QD were to immobilize at a higher
density, then this may enable higher efficiencies of energy transfer for that donor-acceptor
system. The immobilization density of each color of QD that was immobilized in microfluidic
channels was determined by SEM. Figure 31 shows representative SEM images of a
microchannel containing immobilized SAv-gQDs and SAv-rQDs. EOF delivery of QDs to the
interface enabled a homogenous distribution of immobilized QDs without aggregation for both
colors of QD. QD immobilization densities were similar for both colors; it was found that the
SAv-gQDs immobilized at densities of 1.13 ± 0.16 × 10¹¹ QDs∙cm-2, and the surface density was
1.23 ± 0.67 × 10¹¹ QDs∙cm-2 for the SAv-rQDs.
Figure 31. SEM images of in-channel immobilized (a) SAv-gQDs (b) SAv-rQDs on planar biotinylated glass slides (PDMS had been removed to expose the glass). EOF deposition of both types of QDs displayed homogeneous immobilization and no multilayer formation.
Given that both colors of QDs immobilized at almost the same density, it would not be
advantageous to use one type of QD as opposed to the other in an attempt to maximize donor
density and the resulting sensitivity of the on-chip assay.
126
As an additional consideration, it has been noted that autofluorescence from the PDMS layer
coincided with the region of FRET sensitized Cy3 PL.200, 219 This resulted in higher background
signals within the green detection channel. Thus, using the rQD-A647 FRET pair is
advantageous as this detection channel experiences less background in single color assays.
5.3.2 On-chip SNP Resolution
Given the higher stringency of hybridization at the SAv-rQD interface compared to that of the
SAv-gQD as shown in Chapter 4 and marginal differences in sensitivity between the two FRET
pairs, the in-channel hybridization assay assembled using the rQDs should offer improved
selectivity. The in-channel format offers additional stringency control by electrokinetic control
with a constant electrophoretic force acting on oligonucleotides within the channel and an
elevation of local temperature due to Joule heating.167 Because of these conditions, it was
anticipated that less formamide would be required to offer high contrast between FC and SNP
TGTs when a suitable voltage was applied across the microfluidic channel. In-channel
hybridization of the FC and SNP TGTs in the presence and absence of formamide is shown in
Figure 32. Without any added formamide, SNP resolution was possible with a contrast ratio of
4.2:1.
Figure 32. Response of the rQD-A647 in-channel assay to FC (blue) and SNP (red) targets in BB with 0% and 5% v/v formamide (F). After hybridization with FC and SNP targets, injection of 5% v/v F in BB is sufficient to denature the SNP, with the signal from the SNP target being reduced to the background level within experimental precision.
127
Addition of 5% v/v formamide was sufficient to melt the SNP TGT to levels that were
undetectable within experimental precision (a FRET Ratio of 0.003 ± 0.004 from 0.09 ± 0.06). In
contrast, the response of the assay to the FC TGT was unchanged with addition of formamide,
(a FRET ratio of 0.37 ± 0.08 from 0.35 ± 0.08). This was not observed when the same assay was
assembled using 3 µM probe instead of 10 µM. Not until a concentration of 25 % v/v formamide
was used was SNP resolution observed (see Appendix 4, Figure A4.1). Since every % v/v
formamide lowers the duplex Tm by 0.6 ºC,172, 204 the Tm of the duplex in the on-chip assay was
destabilized by ca. 3 ºC due to the aforementioned electrokinetically driven stringency factors
under an applied field strength of 167 V∙cm-1. This allowed selective resolution of a SNP with a
contrast ratio of 108:1, which is the highest contrast ratio reported for the SMN1 sequences as
compared to previous studies that also employed QD-FRET transduction of nucleic acid
hybridization using the same sequences.220
5.3.3 Regeneration of the In-channel Assay
The high speed (within min) of the in-channel assay provides opportunity to consider the
potential for assay reusability. Given that 5% v/v formamide was sufficient to denature the
1BPM TGT, it was anticipated that between 15-20% v/v formamide would enable melting of the
FC duplex as displayed by the melt profile of the FC TGT shown in Chapter 4 (Figure 26(b)(ii))
This level of formamide in solution is important for assay fidelity, as formamide percentages of
50 and over were shown to have detrimental effects on QD PL in previous assays.172 Injection of
20% v/v formamide in 50 mM BB for 10 min displayed complete duplex melting as indicated by
FRET sensitized A647 PL displaying a response characteristic of NC TGT as shown by the first
regeneration cycle (R1) in Figure 33. The need for a longer duration of dispensing is likely a
result of the weak EOF under these regeneration conditions due to the low ionic strength of the
BB used. The 20% v/v formamide did not negatively impact QD PL and allowed faster assay
cycling.
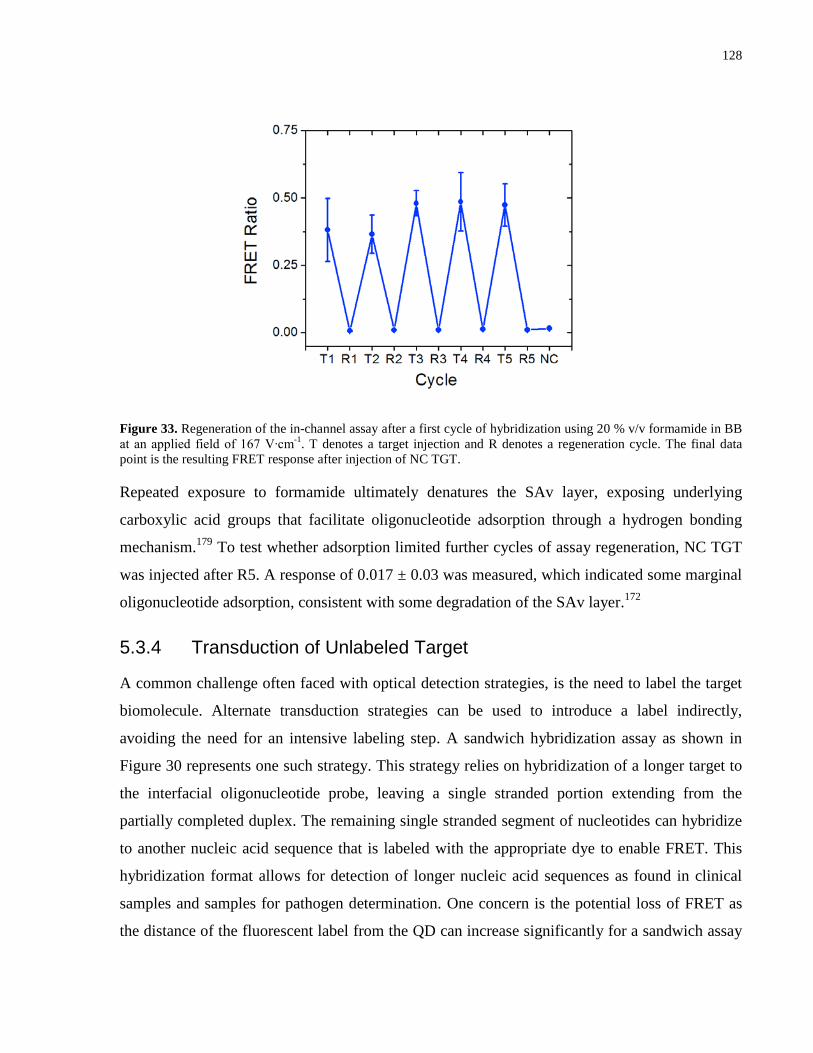
128
Figure 33. Regeneration of the in-channel assay after a first cycle of hybridization using 20 % v/v formamide in BB at an applied field of 167 V∙cm-1. T denotes a target injection and R denotes a regeneration cycle. The final data point is the resulting FRET response after injection of NC TGT.
Repeated exposure to formamide ultimately denatures the SAv layer, exposing underlying
carboxylic acid groups that facilitate oligonucleotide adsorption through a hydrogen bonding
mechanism.179 To test whether adsorption limited further cycles of assay regeneration, NC TGT
was injected after R5. A response of 0.017 ± 0.03 was measured, which indicated some marginal
oligonucleotide adsorption, consistent with some degradation of the SAv layer.172
5.3.4 Transduction of Unlabeled Target
A common challenge often faced with optical detection strategies, is the need to label the target
biomolecule. Alternate transduction strategies can be used to introduce a label indirectly,
avoiding the need for an intensive labeling step. A sandwich hybridization assay as shown in
Figure 30 represents one such strategy. This strategy relies on hybridization of a longer target to
the interfacial oligonucleotide probe, leaving a single stranded portion extending from the
partially completed duplex. The remaining single stranded segment of nucleotides can hybridize
to another nucleic acid sequence that is labeled with the appropriate dye to enable FRET. This
hybridization format allows for detection of longer nucleic acid sequences as found in clinical
samples and samples for pathogen determination. One concern is the potential loss of FRET as
the distance of the fluorescent label from the QD can increase significantly for a sandwich assay
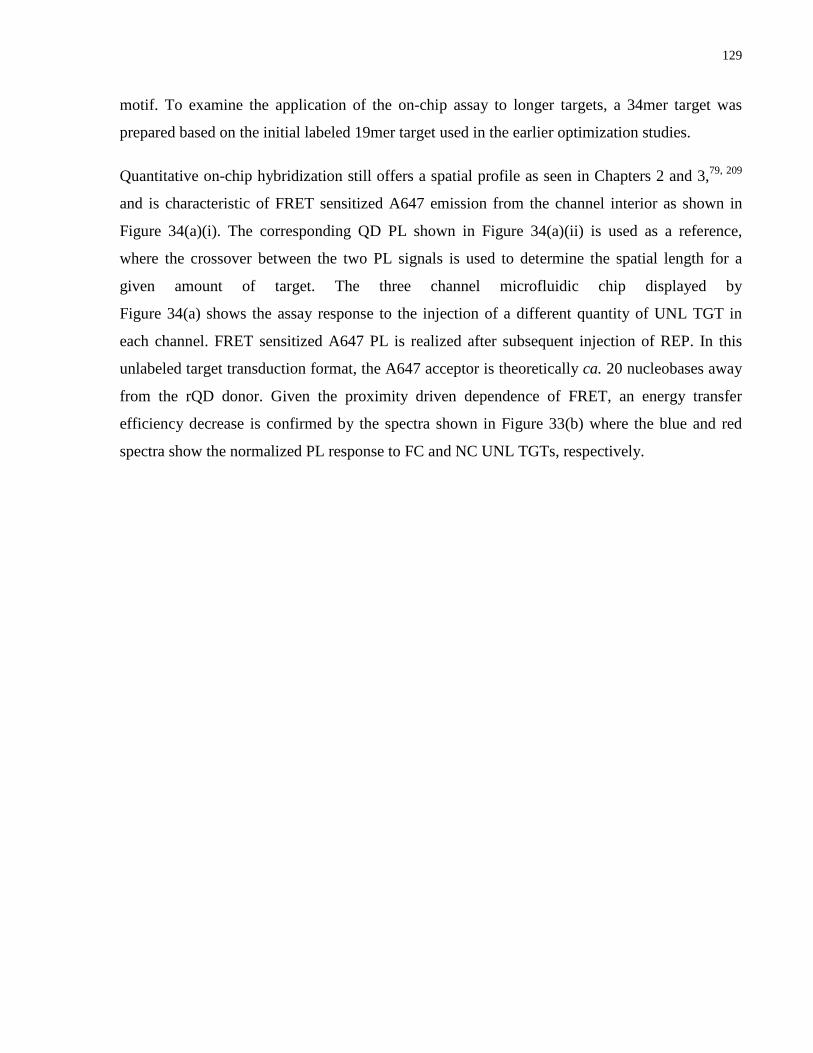
129
motif. To examine the application of the on-chip assay to longer targets, a 34mer target was
prepared based on the initial labeled 19mer target used in the earlier optimization studies.
Quantitative on-chip hybridization still offers a spatial profile as seen in Chapters 2 and 3,79, 209
and is characteristic of FRET sensitized A647 emission from the channel interior as shown in
Figure 34(a)(i). The corresponding QD PL shown in Figure 34(a)(ii) is used as a reference,
where the crossover between the two PL signals is used to determine the spatial length for a
given amount of target. The three channel microfluidic chip displayed by
Figure 34(a) shows the assay response to the injection of a different quantity of UNL TGT in
each channel. FRET sensitized A647 PL is realized after subsequent injection of REP. In this
unlabeled target transduction format, the A647 acceptor is theoretically ca. 20 nucleobases away
from the rQD donor. Given the proximity driven dependence of FRET, an energy transfer
efficiency decrease is confirmed by the spectra shown in Figure 33(b) where the blue and red
spectra show the normalized PL response to FC and NC UNL TGTs, respectively.
130
Figure 34. (a) False color epifluorescence images (i) A647 PL (ii) rQD PL after the in-channel injection of 10.5 pmol, 3.5 pmol, 1.4 pmol of UNL FC TGT and 21 pmol A647 REP. (b) Normalized average PL intensities of the assay response to FC (blue) and NC (red). PL from immobilized rQDs is shown by the dashed black line. (c) Quantitative assay response to 0.35-17.5 pmol of UNL-FC TGT as a function of the in-channel FRET profile.
Adsorption of NC oligonucleotides was not detected. The FRET ratio for the FC UNL TGT
decreased as a result of a larger donor-acceptor separation distance. Higher ionic strength was
required (100 mM NaCl) in sandwich assays to facilitate interfacial hybridization. To evaluate
whether this was a result of kinetic or steric constraints, UNL TGT was injected and allowed to
equilibrate for 30 min in pH 9.25 50 mM BB with 20 mM NaCl. After subsequent injection of
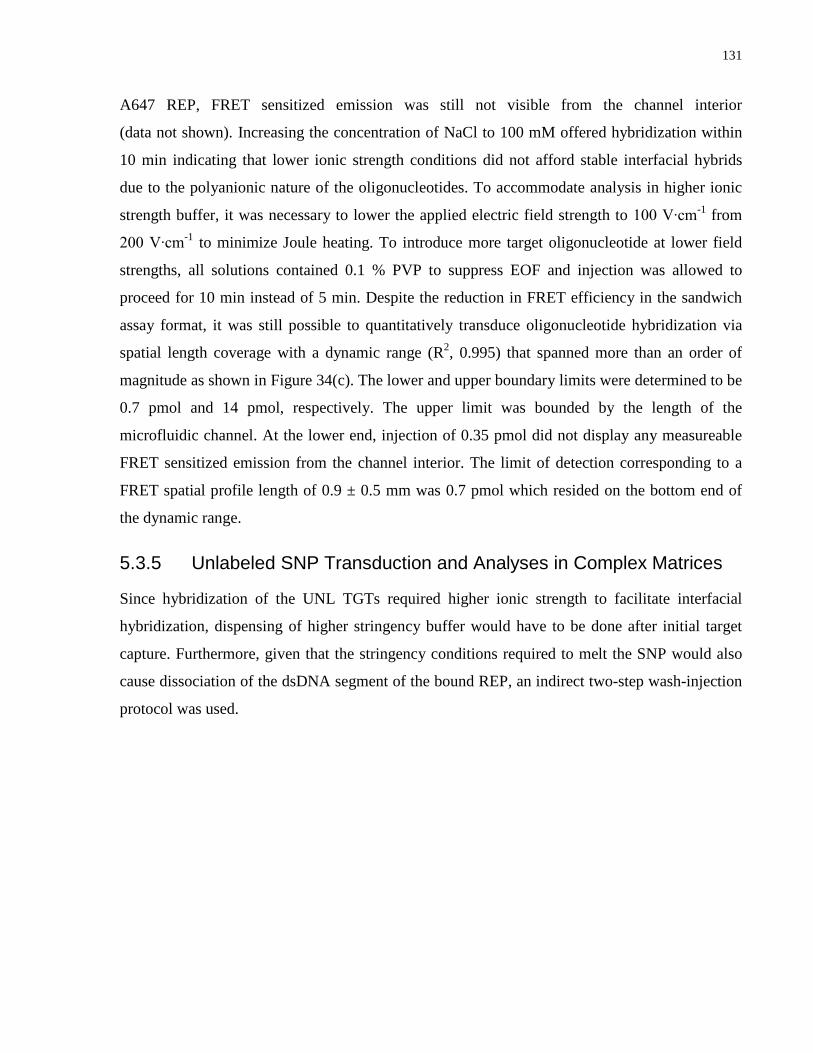
131
A647 REP, FRET sensitized emission was still not visible from the channel interior
(data not shown). Increasing the concentration of NaCl to 100 mM offered hybridization within
10 min indicating that lower ionic strength conditions did not afford stable interfacial hybrids
due to the polyanionic nature of the oligonucleotides. To accommodate analysis in higher ionic
strength buffer, it was necessary to lower the applied electric field strength to 100 V∙cm-1 from
200 V∙cm-1 to minimize Joule heating. To introduce more target oligonucleotide at lower field
strengths, all solutions contained 0.1 % PVP to suppress EOF and injection was allowed to
proceed for 10 min instead of 5 min. Despite the reduction in FRET efficiency in the sandwich
assay format, it was still possible to quantitatively transduce oligonucleotide hybridization via
spatial length coverage with a dynamic range (R2, 0.995) that spanned more than an order of
magnitude as shown in Figure 34(c). The lower and upper boundary limits were determined to be
0.7 pmol and 14 pmol, respectively. The upper limit was bounded by the length of the
microfluidic channel. At the lower end, injection of 0.35 pmol did not display any measureable
FRET sensitized emission from the channel interior. The limit of detection corresponding to a
FRET spatial profile length of 0.9 ± 0.5 mm was 0.7 pmol which resided on the bottom end of
the dynamic range.
5.3.5 Unlabeled SNP Transduction and Analyses in Complex Matrices
Since hybridization of the UNL TGTs required higher ionic strength to facilitate interfacial
hybridization, dispensing of higher stringency buffer would have to be done after initial target
capture. Furthermore, given that the stringency conditions required to melt the SNP would also
cause dissociation of the dsDNA segment of the bound REP, an indirect two-step wash-injection
protocol was used.
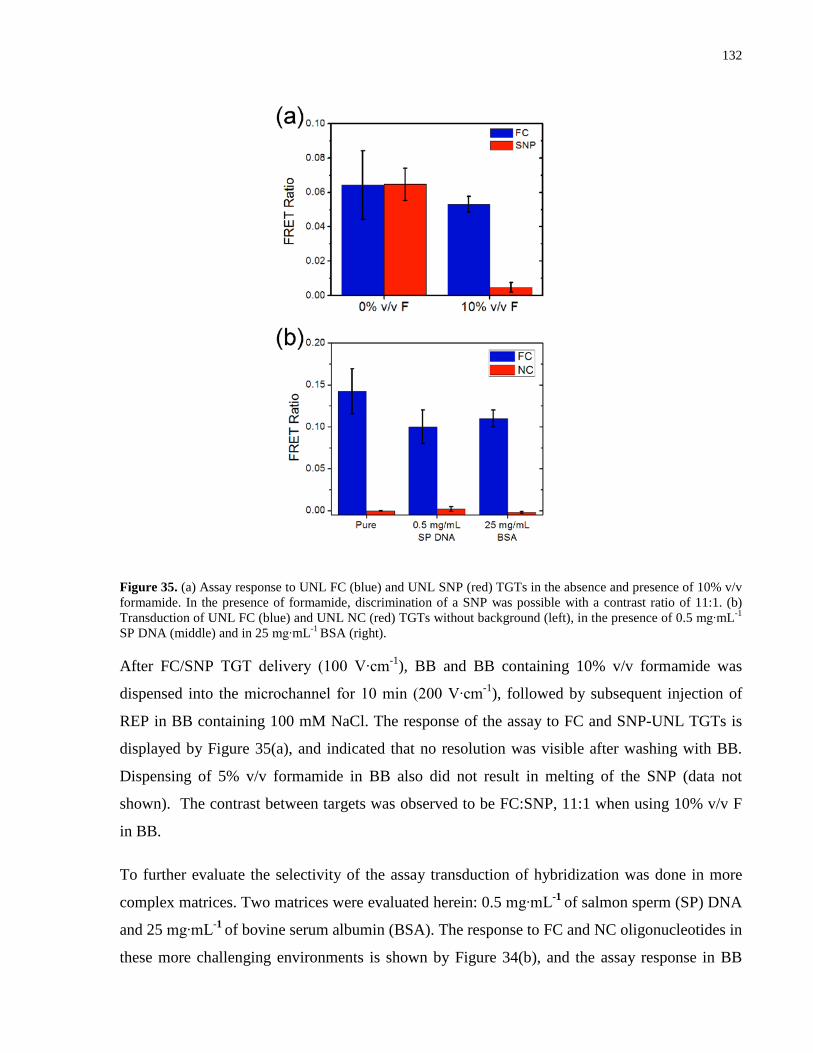
132
Figure 35. (a) Assay response to UNL FC (blue) and UNL SNP (red) TGTs in the absence and presence of 10% v/v formamide. In the presence of formamide, discrimination of a SNP was possible with a contrast ratio of 11:1. (b) Transduction of UNL FC (blue) and UNL NC (red) TGTs without background (left), in the presence of 0.5 mg∙mL-1 SP DNA (middle) and in 25 mg∙mL-1 BSA (right).
After FC/SNP TGT delivery (100 V∙cm-1), BB and BB containing 10% v/v formamide was
dispensed into the microchannel for 10 min (200 V∙cm-1), followed by subsequent injection of
REP in BB containing 100 mM NaCl. The response of the assay to FC and SNP-UNL TGTs is
displayed by Figure 35(a), and indicated that no resolution was visible after washing with BB.
Dispensing of 5% v/v formamide in BB also did not result in melting of the SNP (data not
shown). The contrast between targets was observed to be FC:SNP, 11:1 when using 10% v/v F
in BB.
To further evaluate the selectivity of the assay transduction of hybridization was done in more
complex matrices. Two matrices were evaluated herein: 0.5 mg∙mL-1 of salmon sperm (SP) DNA
and 25 mg∙mL-1 of bovine serum albumin (BSA). The response to FC and NC oligonucleotides in
these more challenging environments is shown by Figure 34(b), and the assay response in BB
133
(pure) is shown for comparison purposes. Within experimental precision, the mean FRET ratios
remained unchanged for analyses in SP DNA and BSA, respectively. Given that the SP DNA
was in 250 fold and the BSA was in 12500 excess relative to the FC and NC TGTs, occlusion of
target oligonucleotides from the selective interfacial chemistry was expected. Nonetheless, any
physisorption of background material did not result in false positives from the two-step
hybridization assay, and the response to the NC TGTs in all samples was undetectable within
experimental precision.
5.4 Conclusions
In this chapter, the impact of designing QD-FRET assays on-chip using the SAv-rQD system
was evaluated with an aim towards optimization of the selectivity and sensitivity of the nucleic
acid hybridization assay. In earlier reports of chip-based single colour and multi-colour assays
where gQDs were used, SNP selectivity and regeneration were not possible. Assembly of the
solid-phase assay on-chip with SAv-rQDs provided detection of 1BPM targets with a contrast
ratio of 108:1. In addition, up to three cycles of assay regeneration were possible. In moving
toward analyses of real nucleic acid samples, a sandwich assay approach enabled unlabeled
target transduction. No loss in sensitivity was observed despite the lower FRET efficiencies as a
result of increased donor-acceptor distance. This highlights the advantage of the spatially based
quantitative transduction of nucleic acids that requires only a signal above background to
translate into the length measurement. SNP resolution was also possible in the sandwich assay
format with a contrast ratio of 11:1, which was lower than the direct label assay due to reduced
FRET efficiency. Furthermore, analyses in complex matrices containing a large excess of BSA
and genomic nucleic acid did not influence the selectivity or performance of the on-chip assay.
134
Conclusions 6In this work, the integration of a solid-phase nucleic acid hybridization assay within an
electrokinetically microfluidic chip was explored. Hybridization was transduced by FRET from
immobilized QDs to dye tagged oligonucleotide targets and reporters. The two FRET pairs used
in PL transduction were a 525 nm emitting gQD-Cy3 and a 605 nm rQD-A647. The microfluidic
chip was comprised of PDMS and glass slides that had been functionalized with biotin to afford
immobilization of SAv-QDs. Assay assembly was done in situ through electrokinetic delivery
where QDs were transported using EOF and nucleic acids moved by EPF. In-channel design
enabled rapid reaction kinetics where both assay assembly and target transduction could be done
within minutes. Tens of femtomole amounts of labeled and unlabeled oligonucleotide targets
could be detected through direct and sandwich assay transduction designs. The novelty of the
work is highlighted by the new detection strategy provided by the microfluidic assay format. As
a result of immobilization of the selective interfacial chemistry throughout the entire
microchannel in combination with very rapid hybridization, dispensing of target nucleic acid into
the microchannel resulted in hybridization along the length of the glass surface of the channel.
As probe sites adjacent to the inlet reservoir were saturated, subsequent target was delivered
further along the channel length. For a defined set of injection parameters including the applied
field strength and dispensing time, the length of the FRET spatial profile from the channel
interior could be used to quantify the amount of DNA in the sample. The area of channel where
probe sites were not hybridized displayed homogenous QD PL, where the crossover position of
both FRET and QD PL was utilized a reference point to measure the length of the FRET spatial
response. Through this quantitative analytical measurement, a dynamic range spanning more
than an order of magnitude could be realized for a microchannel measuring 1.2 cm in length.
Multiplexed concurrent detection of two targets by FRET was also possible as a result of the
combination of two different QDs and probes. While earlier solid-phase QD-FRET assays
displayed limited LODs when multiplexed analyses were implemented,168 the opposite was seen
in quantification via spatial length coverage. The presence of two probes diluted the interfacial
chemistry such that the target response in each channel doubled (resolution based on length
doubled) in comparison to single-color assay channels comprised of a single probe
oligonucleotide sequence. Assay sensitivity improved in the multiplexed format and femtomole
amounts of DNA could be detected.
135
As a gold-standard for nucleic acid hybridization selectivity the ultimate test is the ability to
resolve SNPs. A non-traditional approach was taken in order to optimize the selectivity of the
in-channel assay. The stringency of hybridization at both the SAv-gQD and SAv-rQD interface
was investigated with the intention of finding suitable conditions for SNP resolution. At room
temperature without any added formamide, SNP discrimination was possible at the SAv-rQD
interface. Interestingly, a chemically identical SAv-gQD system did not offer SNP resolution.
The higher effective charge of the larger SAv-rQDs that accommodated a greater number of
immobilized probe oligonucleotides resulted in improved stringency conditions. Assembly of an
on-chip assay using SAv-rQDs and A647 as the FRET reporter resulted in SNP resolution with a
contrast ratio of 108:1 for short oligonucleotides. Assay regeneration was possible where three
cycles of hybridization could proceed in a given channel prior to any noticeable degradation of
the interfacial chemistry. Transduction of unlabled target was possible with femtomole detection
limits by implementation of a sandwich assay. Despite the added donor-acceptor separation
distance as a result of this format, the FRET sensitized emission was significant above
background to translate detection through FRET spatial profiles. Through this method of
quantification, no sensitivity was lost and similar LODs were observed. Moreover, SNP
resolution was possible using unlabeled target in combination with a sandwich assay. The
robustness of the assay was further demonstrated by loading the sample matrix with substantial
quantities of of BSA and genomic nucleic acids. These potential interferents did not alter the
assay response and did not generate false positive signals.
This thesis contributes to the field of bioanalytical chemistry, and more specifically to bioassay
and biosensor design. The spatial detection platform is a novel approach to the limitations of
signal-to-noise when relying on fluorescence intensity for quantification, and the work
exemplifies the advantages offered by microfluidics as a format for bioassay design.
6.1 Future Work The fundamental investigations explored herein have demonstrated the advantages of the
electrokinetic microfluidic platform toward assembly of solid-phase QD-FRET nucleic acid
hybridization assays. While the spatial length method of quantitative nucleic acid transduction is
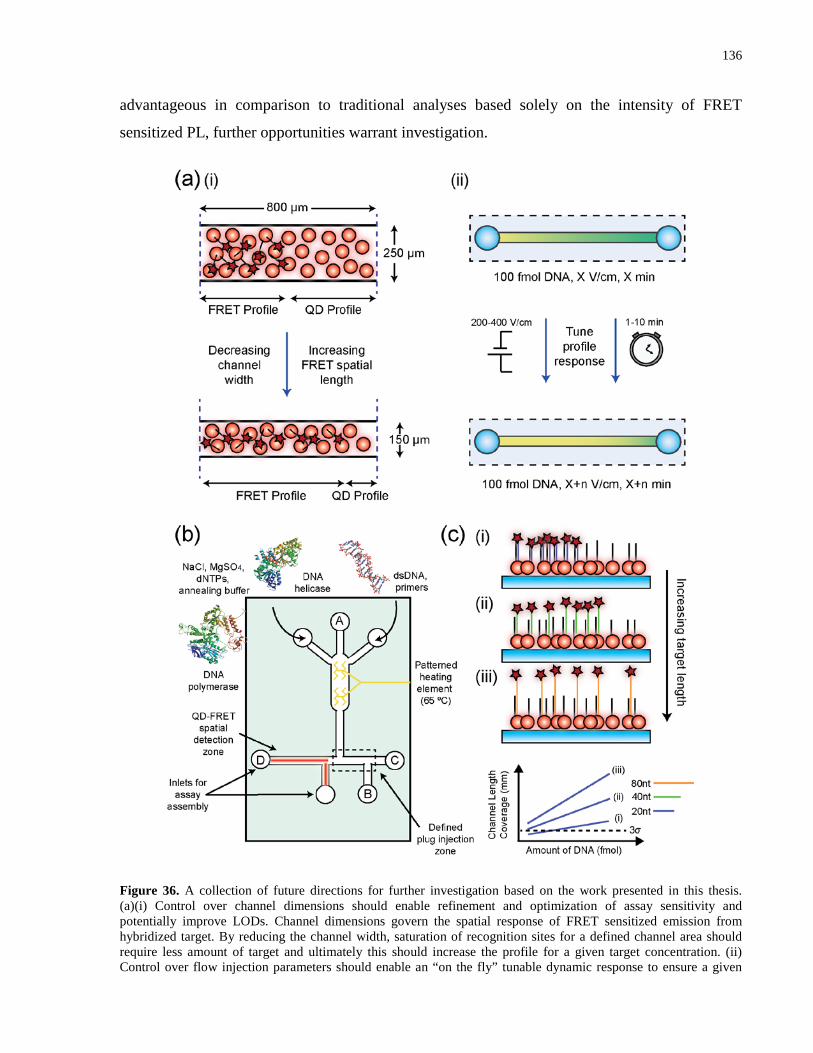
136
advantageous in comparison to traditional analyses based solely on the intensity of FRET
sensitized PL, further opportunities warrant investigation.
Figure 36. A collection of future directions for further investigation based on the work presented in this thesis. (a)(i) Control over channel dimensions should enable refinement and optimization of assay sensitivity and potentially improve LODs. Channel dimensions govern the spatial response of FRET sensitized emission from hybridized target. By reducing the channel width, saturation of recognition sites for a defined channel area should require less amount of target and ultimately this should increase the profile for a given target concentration. (ii) Control over flow injection parameters should enable an “on the fly” tunable dynamic response to ensure a given
137
target concentration falls within the dynamic range of the assay. Furthermore, control over injection parameters could be coupled with channel dimensions as smaller microchannels can afford higher electric field strengths and still maintain low current and Joule heating effects. Optimization of such control could offer lower LODs and a collective dynamic range spanning more than two-three orders of magnitude based. (b) A schematic design of a LOC system for amplification of nucleic acid targets followed by on-chip spatial transduction. The inlet ports and central channel at the top of the chip illustrate the zone of amplification, were enzymes and dNTP precursors can be added for nucleic acid amplification. Controlled micro heating elements can be patterned into the chip design to afford isothermal conditions for amplification to proceed. Assay assembly is localized at the end of the chip, where a plug injection of amplified material can proceed using the additional inlet ports toward the detection platform. (c) Improved spatial assay sensitivity and LODs toward longer nucleic acid targets as a result of reduced hybridization efficiency with immobilized probe. Such a phenomenon would further highlight the advantage of spatial transduction and may overcome limitations discussed in much of the literature about analyses by hybridization of nucleic acid targets associated with real samples.
Some of these concepts are displayed by Figure 36 schematically, where (a)(i) and (ii) illustrate
the advantages of the fluidic platform and its control over analytical figures of merit; in
particular sensitivity and LOD. The control over the length of a spatial FRET response is
governed by the channel dimensions as shown in Figure 36(a)(i). By reducing the channel width,
saturation of a given area of channel should occur for a reduced amount of hybridized target and
it is likely that the FRET spatial response would increase. This should afford both increased
sensitivity and LODs as less nucleic acid is required to saturate the response of the interfacial
recognition chemistry. Manipulation of channel dimensions along with flow injection parameters
(see Figure 36(a)(ii)), such as time and the applied field strength may enhance the sensitivity of
the spatial response and offer lower LODs. Furthermore, this should enable a “tunable” dynamic
range to ensure that a specific target concentration reside within the response bound by the LOD
and the upper limit of quantification.
The microfluidic designs presented in the work of this thesis were utilized for assay development
rather than the practical construction of a self-contained LOC system. A potential further
direction may include development of LOC system that integrates both isothermal nucleic acid
amplification and on-line transduction using the QD-FRET spatial detection method
(Figure 36(b)). Isothermal amplification kits are commercially available; one example is helicase
dependent amplification from BioHelix.2 This method utilizes DNA polymerase and helicase
along with the require deoxynucleotide triphosphates (dNTPs), enzyme cofactors, and suitable
annealing conditions. Primer design characteristic of a specific gene can be integrated into a
contained amplification zone on-chip as illustrated by the straight channel with three inlet ports
2 http://www.biohelix.com/hda_technology.asp
138
at the top of the chip design. Heating elements can be patterned into the chip design to enable
appropriate temperature conditions to offer efficient amplification of the nucleic acid targets.
Application of a voltage from A to B will afford a defined plug of amplified material localized
toward the detection platform. The extra reservoir to the left of B along with D can be utilized
for routine QD-FRET assay assembly as previously described. Application of a voltage from C
to D affords target dispensing to toward the QD-FRET detection zone. This self-contained
system would only require DNA isolation from a patient or pathogenic species while
amplification and detection could be done within 1-2 hours. Such a LOC would enable POC
application for nucleic acid analysis.
Based on the work presented in Chapter 5 for longer nucleic acid targets, it was observed that the
spatial profiles increased in comparison to those associated with short oligonucleotides. This
result is consistent with lower hybridization efficiency toward longer targets by the interfacial
oligonucleotide probes. While this is disadvantageous for traditional PL intensity based
measurements, this concept should afford an extension of spatial response as shown by Figure
35(c), leading to improved LODs. Ultimately the compromise may come from such reduction in
hybridization efficiency that the FRET PL may no longer be discernable above background
levels and thus a spatial FRET profile would no longer be observed.
The ideas presented herein may provide direction and present a foundation from which future
research work can be conducted.
139
Appendix 1 – Supporting Information for Chapter 2
A1.1 Detailed Experimental Methods
A1.1.1 Materials and Reagents
Ammonium hydroxide (30%), hydrochloric acid (16 M) and hydrogen peroxide (30%) were
obtained from EMD Chemicals (San Diego, CA). Methanol, ethanol, isopropanol,
dichloromethane, and diethylether were reagent grade or better and were acquired from Caledon
Laboratories (Georgetown, ON, Canada). Anhydrous toluene (99.8%), 3-
aminopropyltrimethoxysilane (APTMS, 97%), N,N-diisopropylethylamine (DIPEA, 99.5%),
anhydrous N,N-dimethylformamide (DMF, 99.8%), biotin (99%), N,N-diisopropylcarbodiimide
(DIC, 99%), N-hydroxysuccinimide (NHS, 99%), and formamide (99.5%) were from Sigma
Aldrich (Oakville, ON, Canada). All buffers were prepared with deionized water from a Milli-Q
cartridge purification system (Millipore Corporation, Mississauga, ON, Canada) and sterilized by
autoclaving. Buffers used included borate buffer (BB; 50 mM, pH 9.25) and Tris-Borate (TB)
buffer (100 mM, pH 7.44, 20 mM NaCl). For microfluidic experiments, buffers were filtered
through a Acrodisc 0.2 µm syringe filter from Pall Corp. (Ann Arbor, MI) prior to use.
Microscope glass slides (25 mm × 75 mm) and glass cover slips (22 × 22 mm) were from Fischer
Scientific (Pittsburgh, PA). P-type boron doped <100> silicon wafers, 515 ± 30 µm thick and
100.0 ± 0.5 mm in diameter were obtained from Empak (Chanhassen, MN).
Polydimethylsiloxane (PDMS) Sylgard 184 silicone elastomer kit was obtained from Dow
Corning (Newton, MA). Su-8 5 photoresist was from MicroChem (Newton, MA).
Oligonucleotides were purchased from Integrated DNA technologies (Coralville, IA) and were
HPLC purified by the manufacturer. CdSe/ZnS Qdot® 525 ITK™ Streptavidin Conjugates were
from Invitrogen by Life Technologies (Oakville, ON, Canada).
A1.1.2 Instrumentation
Solution phase PL measurements were made using a QuantaMaster PTI spectrofluorimeter
(Photon Technology International, London, ON, Canada) equipped with a xenon arc lamp
(Ushio, Cypress, CA) and a red-sensitive photomultiplier tube (R928P; Hamamtsu, Bridgewater,
140
NJ). Time-resolved fluorescence decay curves were obtained with a dye laser (GL-302, Photon
Technology International) that was pumped using a pulsed nitrogen laser (GL-3300, Photon
Technology International). The lasing dye used was 4,4´-(1,2-ethenediyl)bis-1, 1-biphenyl (DPS)
in dioxane (Exciton, Dayton, OH) and the output of the dye laser was tuned to 402 nm. Time
resolved PL measurements were made using the stroboscopic technique.46 Absorption spectra
were obtained using a HP8452A Diode-Array Spectrophotometer (Hewlett Packard Corporation,
Palo Alto, CA).
In-channel PL measurements were made using an epifluorescence microscope custom built in
house, and based on a Nikon Eclipse L150 model (Nikon, Mississauga, ON, Canada) that was
equipped with a motorized xyz translational stage. A schematic of the instrument can be found
elsewhere.2 A diode laser with an output of 406 nm (Radius 405, 25 mW, Coherent Inc, Santa
Clara, CA) was used as the excitation source. A filter cube containing a 405/20x nm excitation
filter and a Z405 rdc dichroic mirror was used to direct the laser light through a 40x Nikon
ELWD Plan Fluor Objective (NA = 0.60) to the sample stage. PL was collected in the backwards
direction using the same lens and detected using a diode array spectrophotometer (QE6500,
Ocean Optics Inc., Dunedin, FL) by means of a fiber optic waveguide. SpectraSuite software
(Ocean Optics) was used for spectra acquisition, and PL spectra were averaged from
measurements made at 3-5 points along the length of the microfluidic channel. A program
written in LabVIEW (National Instruments, Austin, TX) was used to control the microscope for
image collection. Channel images were obtained using a PMT and by raster scanning over the
sample surface. Filter cubes containing bandpass filters: a D525/20 and HQ570/20 (Chroma
Technologies Corp., Bellows Falls, VT) were used to isolate QD and Cy3 FRET sensitized PL,
respectively. Images were obtained by point-by-point reconstructions of the raster scans and
processed using ImageJ software (National Institutes of Health, Bethesda, MD).
The data for the electrophoretic mobility of the target nucleic acid sequence was acquired using a
similar Nikon Eclipse epifluorescent microscope setup that was upgraded to a Nikon C2si
confocal microscope. Excitation of the Cy3 labeled sequence was accomplished using a 543 nm,
1.5 mW HeNe laser (Electro-Optics Inc., Boulder, CO) and detection using a PMT. Time based
signals were acquired using NIS-Elements imaging software (Nikon, Mississauga, ON, Canada).
141
Electrokinetic microfluidic experiments were conducted using a High Voltage Sequencer
HVS448 3000V (Labsmith, Livermore, CA).
Monochromatic ellipsometry measurements were made using a Rudolph Auto EL III
ellipsometer equipped with a HeNe laser source (632.8 nm emission) with an angle of incidence
of 70º. Prior to measurements, the instrument function was checked against a reference silicon
wafer of known film thickness (455 ± 3 Å) and refractive index (1.463).
A1.1.3 Glass Substrate Modification and Microfluidic Chip Fabrication
Microscope glass substrates (slides or coverslips) were first etched using a two-step RCA
cleaning protocol to generate silanol groups. Substrates were placed inside a Teflon holder that
prevented the glass slides from contacting one another, and were then treated with a 5:1:1
mixture of deionized water, ammonium hydroxide, and hydrogen peroxide. The solution was
heated to 85 ºC and kept at this temperature for 5 min. The slides were then rinsed twice with
deionized water. A 5:1:1 mixture of deionized water, hydrochloric acid, and hydrogen peroxide
was added to the slides, heated to 85 ºC and kept at this temperature for 5 min. The slides were
then rinsed twice with deionized water, twice with methanol, and then sonicated twice in
methanol for 10 min. After sonication, the slides were rinsed twice with dichloromethane, twice
with ether and then placed in a dessicator until further use.
The RCA cleaned slides were then aminated through silanization with APTMS. The substrates
were immersed in ca. 300 mL of anhydrous toluene and 7.5 mL of APTMS (2.5% v/v) in the
presence of 0.5 mL of DIPEA, and the mixture refluxed under argon for 6 h. After reaction, the
substrates were rinsed twice with methanol and then sonicated twice in methanol for 10 min,
followed by rinsing twice with dichloromethane and ether. APTMS slides were further
derivatized with biotin by amide formation through carbodiimide activation. The APTMS slides
were immersed in ca. 150 mL of DMF containing 250 mg (1 mmol) of biotin and 200 mg
(1.7 mmol) of NHS. The mixture was stirred until dissolution of the reagents and then a solution
of 200 µL (1.3 mmol) of DIC in 5 mL of DMF was added dropwise into the flask while stirring.
The mixture was then placed on a shaker for 24-48 h. Once the reaction was complete, the
substrates were rinsed twice with isopropanol and then sonicated twice in isopropanol for
142
10 min. Slides were then rinsed twice with dichloromethane and ether and stored in a dessicator
until further use.
Silicon substrates used in ellipsometry measurements were cut to dimensions of 22 × 22 mm so
that they fit within the Teflon holders used for glass cover slips. Silicon slides were
aminosilanized in parallel with glass substrates for quality control purposes and measurement of
film thickness (the silanol surfaces are analogous between the substrates, but only the silicon is
suitably reflective for ellipsometry measurements). The refractive index (1.463) of the silicon
wafer was used as an approximation when measuring derivatized substrates. Two samples from
each modification step were measured four times and the change in thickness was calculated by
subtracting the measured thickness from the RCA etched silicon wafer. For an in-depth
characterization of silane modified surfaces, the reader is referred elsewhere.47
PDMS chips were made by mixing 10 g of the elastomer with 1 g of curing agent in a small
beaker and stirring vigorously for 10 min. The mixture was then degassed for 30 min, poured
(ca. 3 g) on the microfluidic template and baked at 120 ºC for 25 minutes. Microfluidic templates
were fabricated as previously reported by using standard lithography methods.17 PDMS chips
were cut to dimensions of ca. 2 mm less than those of the substrates and the reagent and waste
reservoirs were made manually using a metal bore. Reservoirs were inserted such that the length
of the microchannels was ca. 1 cm. The channel width and height were 250 µm and 9 µm,
respectively. The PDMS was sealed to the glass substrates by first rinsing the PDMS cover with
95% ethanol, drying with nitrogen, and then oxidizing the chip using air plasma at 10.5 W for
30 s. After annealing the PDMS to the glass substrate, the channels were immediately filled with
50 mM pH 9.25 BB. A schematic of the PDMS-glass chip is displayed by Figure A1.1.
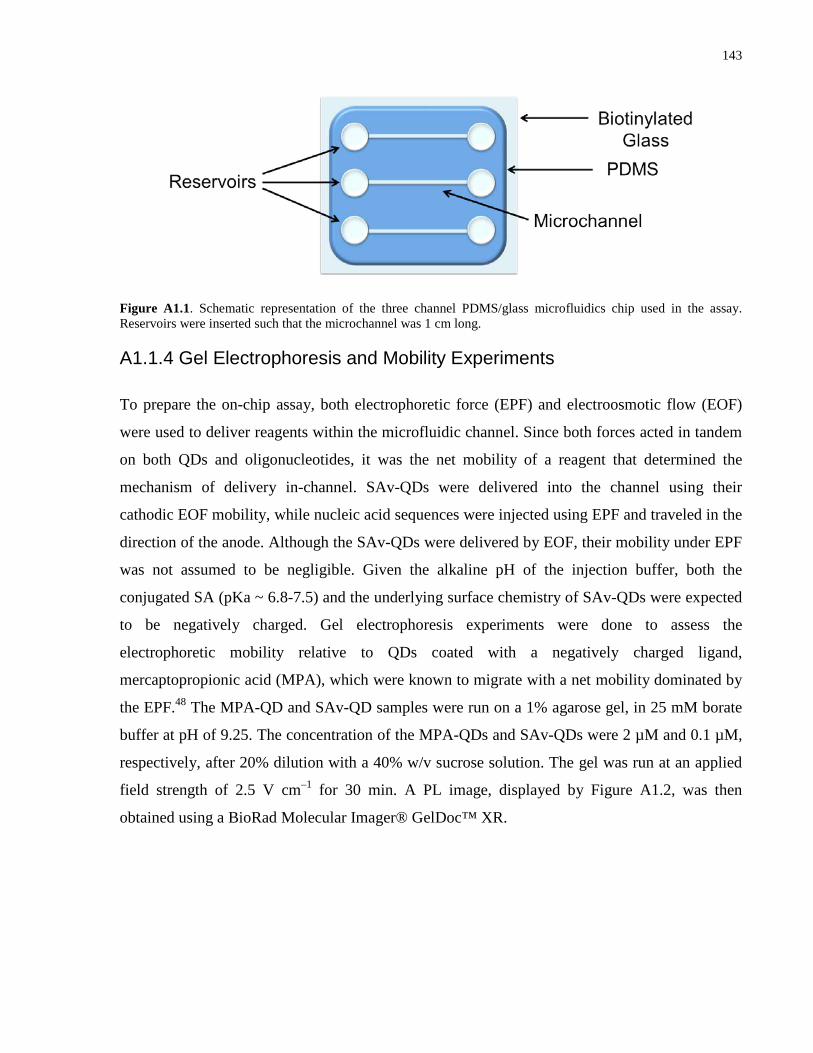
143
Figure A1.1. Schematic representation of the three channel PDMS/glass microfluidics chip used in the assay. Reservoirs were inserted such that the microchannel was 1 cm long.
A1.1.4 Gel Electrophoresis and Mobility Experiments
To prepare the on-chip assay, both electrophoretic force (EPF) and electroosmotic flow (EOF)
were used to deliver reagents within the microfluidic channel. Since both forces acted in tandem
on both QDs and oligonucleotides, it was the net mobility of a reagent that determined the
mechanism of delivery in-channel. SAv-QDs were delivered into the channel using their
cathodic EOF mobility, while nucleic acid sequences were injected using EPF and traveled in the
direction of the anode. Although the SAv-QDs were delivered by EOF, their mobility under EPF
was not assumed to be negligible. Given the alkaline pH of the injection buffer, both the
conjugated SA (pKa ~ 6.8-7.5) and the underlying surface chemistry of SAv-QDs were expected
to be negatively charged. Gel electrophoresis experiments were done to assess the
electrophoretic mobility relative to QDs coated with a negatively charged ligand,
mercaptopropionic acid (MPA), which were known to migrate with a net mobility dominated by
the EPF.48 The MPA-QD and SAv-QD samples were run on a 1% agarose gel, in 25 mM borate
buffer at pH of 9.25. The concentration of the MPA-QDs and SAv-QDs were 2 µM and 0.1 µM,
respectively, after 20% dilution with a 40% w/v sucrose solution. The gel was run at an applied
field strength of 2.5 V cm–1 for 30 min. A PL image, displayed by Figure A1.2, was then
obtained using a BioRad Molecular Imager® GelDoc™ XR.
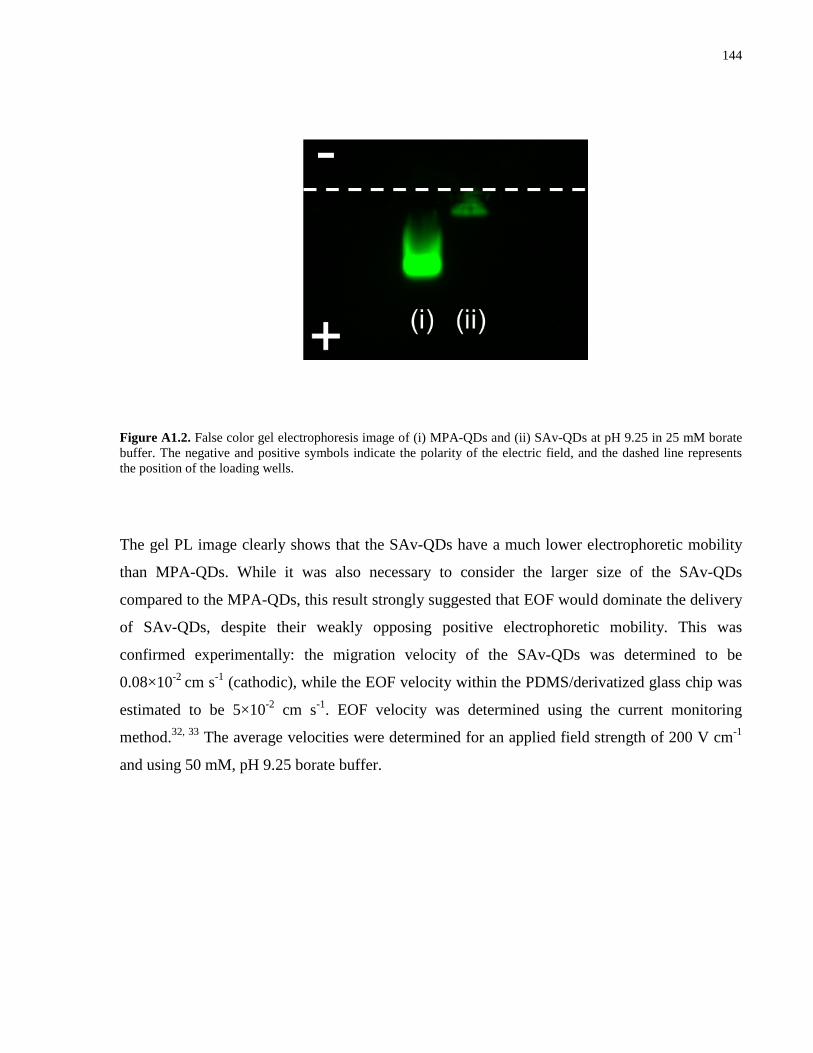
144
Figure A1.2. False color gel electrophoresis image of (i) MPA-QDs and (ii) SAv-QDs at pH 9.25 in 25 mM borate buffer. The negative and positive symbols indicate the polarity of the electric field, and the dashed line represents the position of the loading wells.
The gel PL image clearly shows that the SAv-QDs have a much lower electrophoretic mobility
than MPA-QDs. While it was also necessary to consider the larger size of the SAv-QDs
compared to the MPA-QDs, this result strongly suggested that EOF would dominate the delivery
of SAv-QDs, despite their weakly opposing positive electrophoretic mobility. This was
confirmed experimentally: the migration velocity of the SAv-QDs was determined to be
0.08×10⁻² cm s-1 (cathodic), while the EOF velocity within the PDMS/derivatized glass chip was
estimated to be 5×10⁻² cm s-1. EOF velocity was determined using the current monitoring
method.32, 33 The average velocities were determined for an applied field strength of 200 V cm-1
and using 50 mM, pH 9.25 borate buffer.

145
A1.2 Data Analysis
A1.2.1 Förster Formalism and Time-Resolved Fluorescence Measurements
The SAv-QD/Cy3 FRET pair was characterized using the Förster formalism, the Förster distance
( , in units of cm) was calculated from solution based measurements using Eqn. A1.1:
[A1.1]
where n is the refractive index of the surrounding medium and was approximated as 1.33, κ2 is
the orientation factor (a value of 2/3 is assumed)49, ΦD is the quantum yield of the donor (a value
of 0.2 was used from a previously published study)34 and J is the spectral overlap which was
determined using Eqn. A1.2:
[A1.2]
where FD is the fluorescence intensity of the donor and εA is the molar absorptivity coefficient of
the acceptor as a function of wavelength, λ. The qualitative spectral overlap for the FRET pair is
displayed by the shaded region in Figure A1.3. The spectral overlap was determined to be 3.03 ×
10-10 M-1cm6 and the Förster distance was calculated to be 4.63 nm.
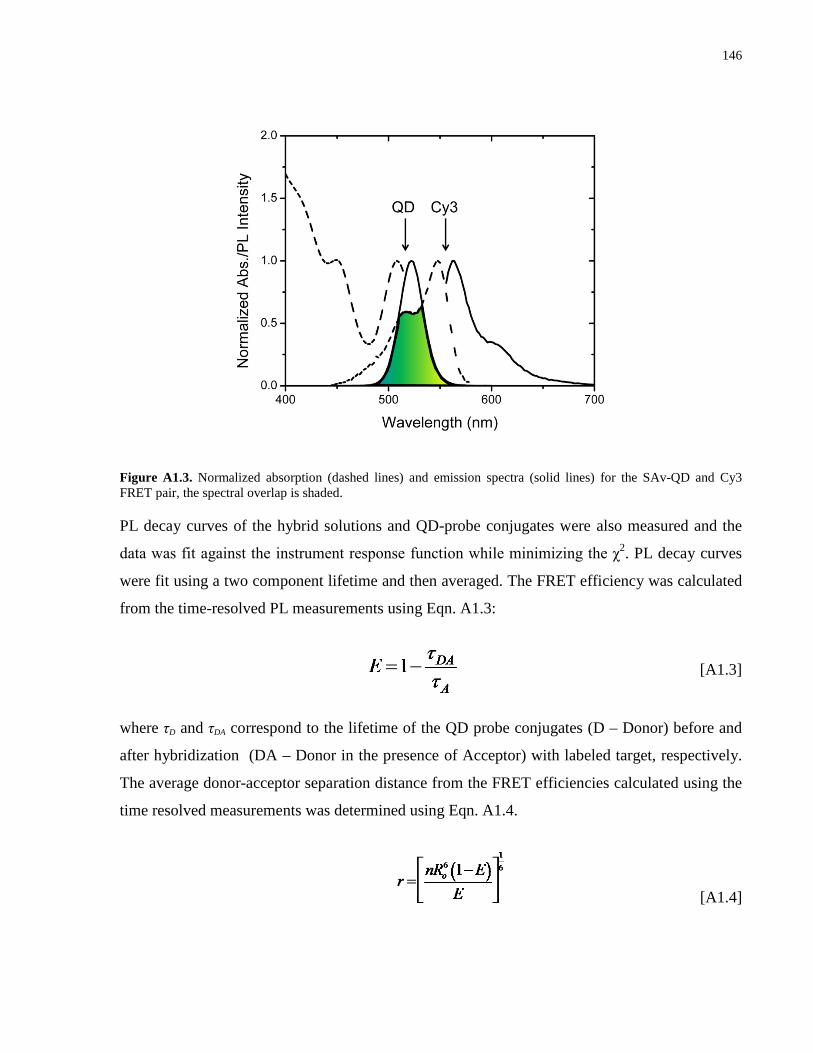
146
Figure A1.3. Normalized absorption (dashed lines) and emission spectra (solid lines) for the SAv-QD and Cy3 FRET pair, the spectral overlap is shaded.
PL decay curves of the hybrid solutions and QD-probe conjugates were also measured and the
data was fit against the instrument response function while minimizing the χ2. PL decay curves
were fit using a two component lifetime and then averaged. The FRET efficiency was calculated
from the time-resolved PL measurements using Eqn. A1.3:
[A1.3]
where τD and τDA correspond to the lifetime of the QD probe conjugates (D – Donor) before and
after hybridization (DA – Donor in the presence of Acceptor) with labeled target, respectively.
The average donor-acceptor separation distance from the FRET efficiencies calculated using the
time resolved measurements was determined using Eqn. A1.4.
[A1.4]
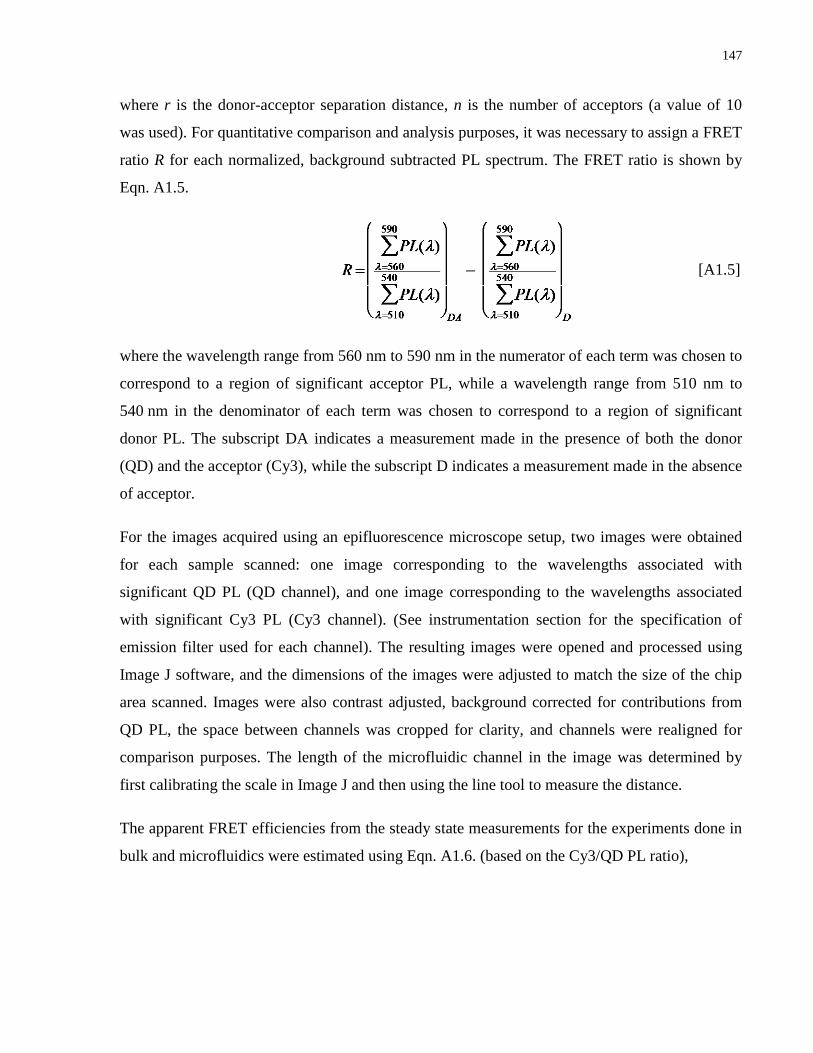
147
where r is the donor-acceptor separation distance, n is the number of acceptors (a value of 10
was used). For quantitative comparison and analysis purposes, it was necessary to assign a FRET
ratio R for each normalized, background subtracted PL spectrum. The FRET ratio is shown by
Eqn. A1.5.
[A1.5]
where the wavelength range from 560 nm to 590 nm in the numerator of each term was chosen to
correspond to a region of significant acceptor PL, while a wavelength range from 510 nm to
540 nm in the denominator of each term was chosen to correspond to a region of significant
donor PL. The subscript DA indicates a measurement made in the presence of both the donor
(QD) and the acceptor (Cy3), while the subscript D indicates a measurement made in the absence
of acceptor.
For the images acquired using an epifluorescence microscope setup, two images were obtained
for each sample scanned: one image corresponding to the wavelengths associated with
significant QD PL (QD channel), and one image corresponding to the wavelengths associated
with significant Cy3 PL (Cy3 channel). (See instrumentation section for the specification of
emission filter used for each channel). The resulting images were opened and processed using
Image J software, and the dimensions of the images were adjusted to match the size of the chip
area scanned. Images were also contrast adjusted, background corrected for contributions from
QD PL, the space between channels was cropped for clarity, and channels were realigned for
comparison purposes. The length of the microfluidic channel in the image was determined by
first calibrating the scale in Image J and then using the line tool to measure the distance.
The apparent FRET efficiencies from the steady state measurements for the experiments done in
bulk and microfluidics were estimated using Eqn. A1.6. (based on the Cy3/QD PL ratio),
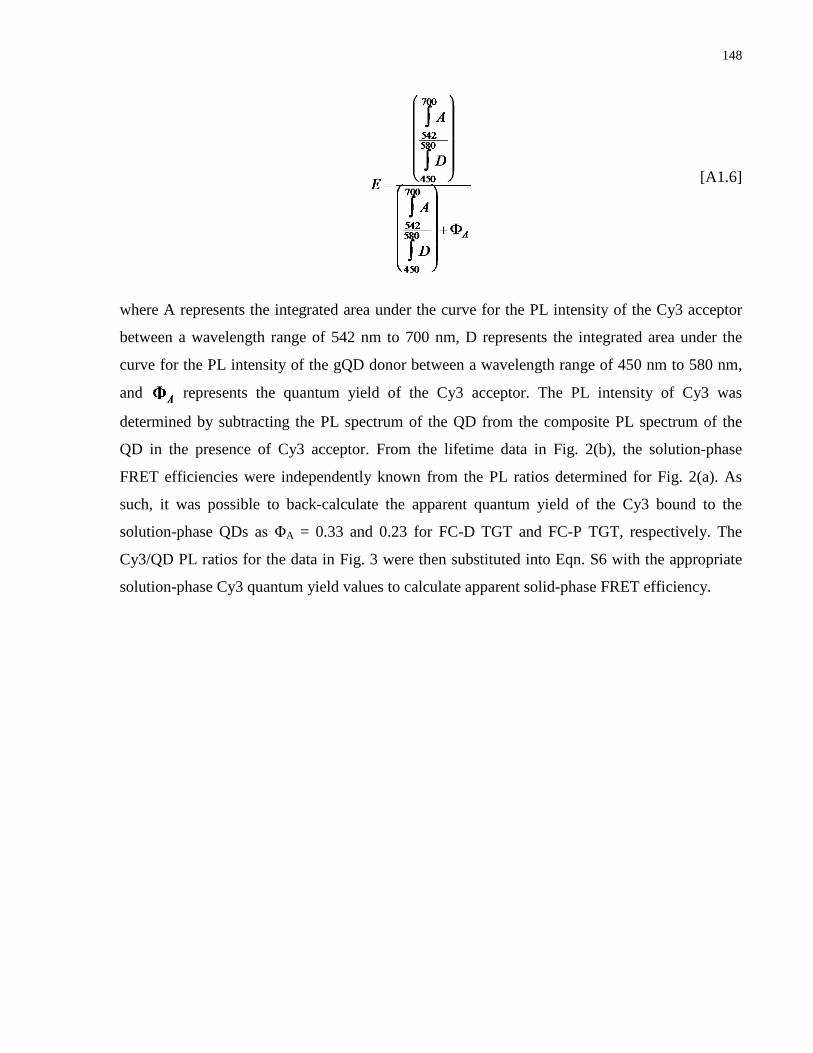
148
[A1.6]
where A represents the integrated area under the curve for the PL intensity of the Cy3 acceptor
between a wavelength range of 542 nm to 700 nm, D represents the integrated area under the
curve for the PL intensity of the gQD donor between a wavelength range of 450 nm to 580 nm,
and represents the quantum yield of the Cy3 acceptor. The PL intensity of Cy3 was
determined by subtracting the PL spectrum of the QD from the composite PL spectrum of the
QD in the presence of Cy3 acceptor. From the lifetime data in Fig. 2(b), the solution-phase
FRET efficiencies were independently known from the PL ratios determined for Fig. 2(a). As
such, it was possible to back-calculate the apparent quantum yield of the Cy3 bound to the
solution-phase QDs as ΦA = 0.33 and 0.23 for FC-D TGT and FC-P TGT, respectively. The
Cy3/QD PL ratios for the data in Fig. 3 were then substituted into Eqn. S6 with the appropriate
solution-phase Cy3 quantum yield values to calculate apparent solid-phase FRET efficiency.
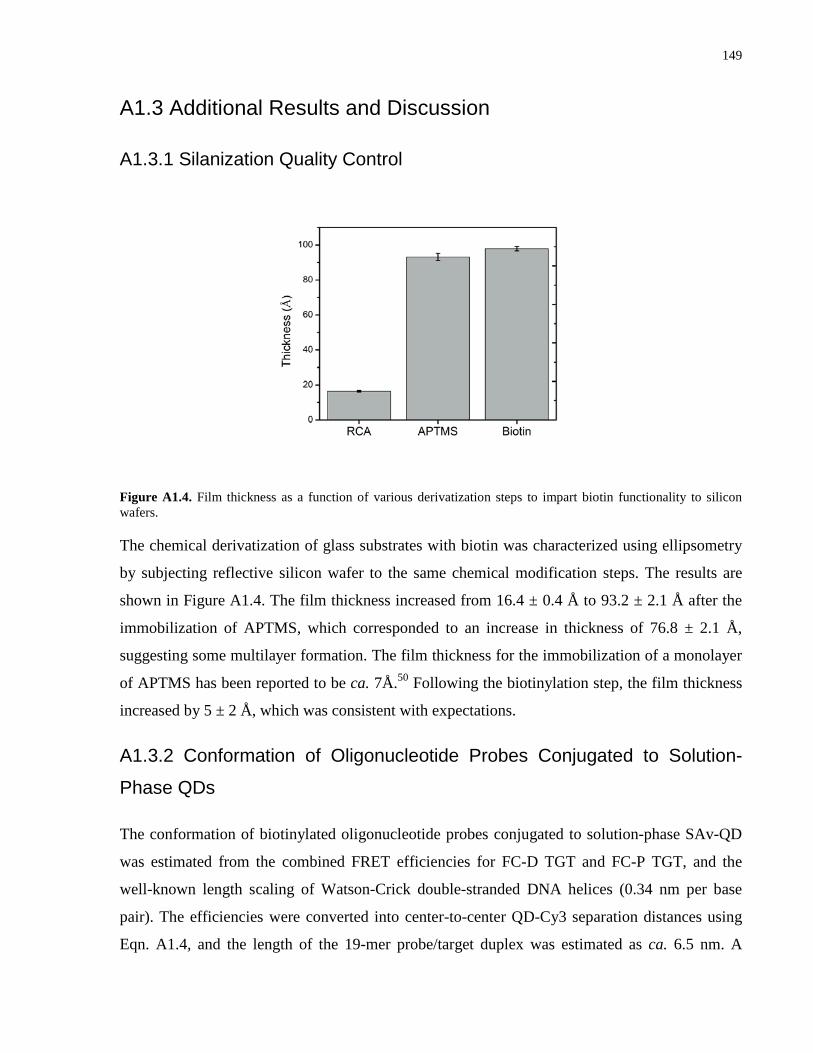
149
A1.3 Additional Results and Discussion
A1.3.1 Silanization Quality Control
Figure A1.4. Film thickness as a function of various derivatization steps to impart biotin functionality to silicon wafers.
The chemical derivatization of glass substrates with biotin was characterized using ellipsometry
by subjecting reflective silicon wafer to the same chemical modification steps. The results are
shown in Figure A1.4. The film thickness increased from 16.4 ± 0.4 Å to 93.2 ± 2.1 Å after the
immobilization of APTMS, which corresponded to an increase in thickness of 76.8 ± 2.1 Å,
suggesting some multilayer formation. The film thickness for the immobilization of a monolayer
of APTMS has been reported to be ca. 7Å.50 Following the biotinylation step, the film thickness
increased by 5 ± 2 Å, which was consistent with expectations.
A1.3.2 Conformation of Oligonucleotide Probes Conjugated to Solution-
Phase QDs
The conformation of biotinylated oligonucleotide probes conjugated to solution-phase SAv-QD
was estimated from the combined FRET efficiencies for FC-D TGT and FC-P TGT, and the
well-known length scaling of Watson-Crick double-stranded DNA helices (0.34 nm per base
pair). The efficiencies were converted into center-to-center QD-Cy3 separation distances using
Eqn. A1.4, and the length of the 19-mer probe/target duplex was estimated as ca. 6.5 nm. A
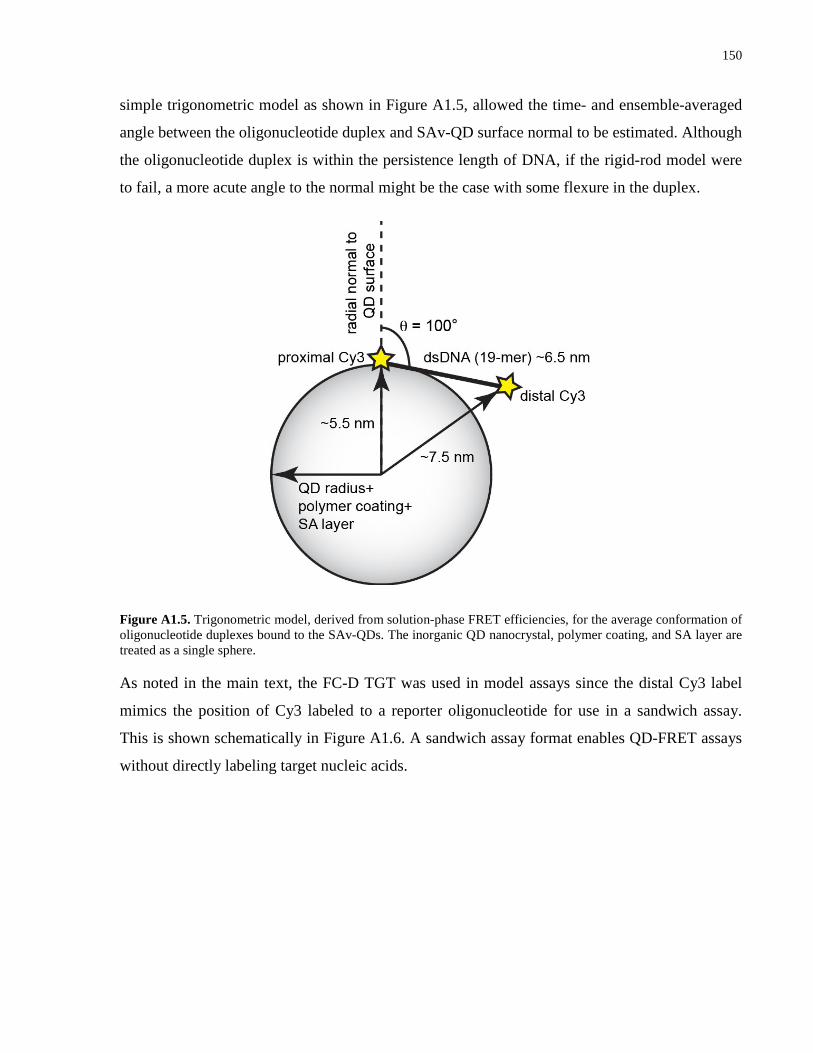
150
simple trigonometric model as shown in Figure A1.5, allowed the time- and ensemble-averaged
angle between the oligonucleotide duplex and SAv-QD surface normal to be estimated. Although
the oligonucleotide duplex is within the persistence length of DNA, if the rigid-rod model were
to fail, a more acute angle to the normal might be the case with some flexure in the duplex.
Figure A1.5. Trigonometric model, derived from solution-phase FRET efficiencies, for the average conformation of oligonucleotide duplexes bound to the SAv-QDs. The inorganic QD nanocrystal, polymer coating, and SA layer are treated as a single sphere.
As noted in the main text, the FC-D TGT was used in model assays since the distal Cy3 label
mimics the position of Cy3 labeled to a reporter oligonucleotide for use in a sandwich assay.
This is shown schematically in Figure A1.6. A sandwich assay format enables QD-FRET assays
without directly labeling target nucleic acids.
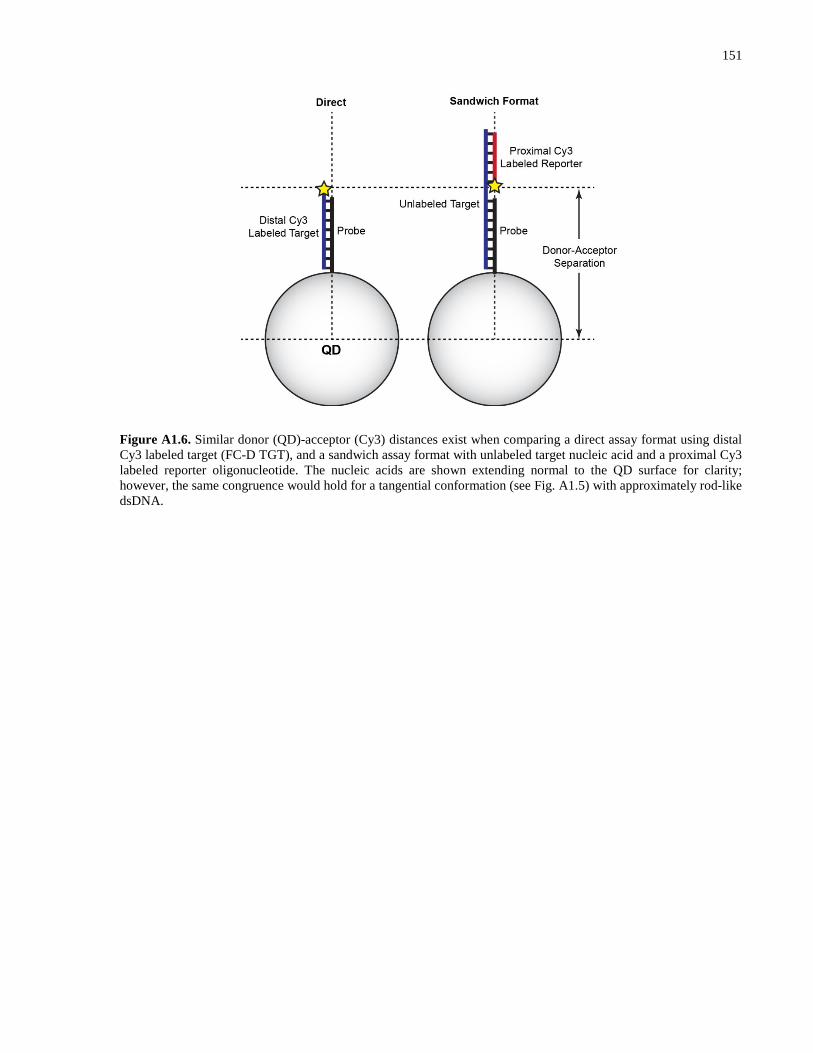
151
Figure A1.6. Similar donor (QD)-acceptor (Cy3) distances exist when comparing a direct assay format using distal Cy3 labeled target (FC-D TGT), and a sandwich assay format with unlabeled target nucleic acid and a proximal Cy3 labeled reporter oligonucleotide. The nucleic acids are shown extending normal to the QD surface for clarity; however, the same congruence would hold for a tangential conformation (see Fig. A1.5) with approximately rod-like dsDNA.
152
Appendix 2 – Supporting Information for Chapter 3
A2.1 Detailed Experimental Methods
A2.1.1 Instrumentation
Absorption spectra were acquired using a HP8452A Diode-Array Spectrophotometer (Hewlett
Packard Corporation (Palo Alto, CA). Solution phase PL measurements were made using a
QuantaMaster Photon Technology International spectrofluorimeter (London, ON, Canada). The
excitation source was a xenon arc lamp (Ushio, Cypress, CA) and the detector was a red-
sensitive R928P photomultiplier tube (PMT, Hamamatsu, Bridgewater, NJ).
PL measurements from the interior of the microfluidic channels were made using a Nikon
Eclipse L150 epifluorescence microscope (Nikon, Mississauga, ON) that was custom modified
with a motorized xyz translational stage. The excitation source included a 25 mW diode laser
with an output of 402 nm (Radius 402, Coherent Inc, Santa Clara, CA). The light from the laser
was directed through a filter cube (excitation filter: ZET405/20x, dichroic mirror: Z405rdc
(Chroma Technologies Corp., Bellows Falls, VT)) to excite the chemistry on the glass wall of the
microfluidic channels using a 40x Nikon ELWD Plan Fluor objective lens (NA = 0.60). The PL
intensity was collected in the backward direction by the same objective lens and was coupled
into a diode array spectrophotometer (QE65000, Ocean Optics Inc., Dunedin, FL) using an
optical fiber waveguide. Data acquisition was done using a SpectraSuite software (Ocean
Optics). On average, 3 to 5 PL spectra were collected at different positions along the length of a
microfluidic channel. Epifluorescence images were collected using a custom written LabVIEW
(National Instruments, Austin, TX) program to control the data acquisition and the operation of
the xyz translational stage of the epifluorescence microscope described above. Images for the
two QDs donor detection channels (gQDs and rQDs) and the two FRET sensitized acceptor
detection channels (Cy3 and A647) were collected by raster scanning over the microfluidic chip
using H5784-20 PMT (Hamamatsu, Bridgewater, NJ) as the detector. For each QD and FRET
sensitized detection channel, a different emission filter was associated with the filter cube to
isolate the PL intensities associated with each of the detection channels. D525/20x and D620/40x
emission filters (Chroma Technologies Corp., Bellows Falls, VT) were used to image the PL
153
associated with gQDs and rQDs (donor detection channels), while HQ570/20x and HQ680/30x
(Chroma Technologies Corp., Bellows Falls, VT) emission filters were used to image the PL
associated with Cy3 and A647 (acceptor detection channels).
The data for the net mobility of A647 labeled DNA targets (SMN1 and uidA) was acquired using
an epifluorescence microscope setup (described above) that was equipped with a 10 mW diode
laser with an output of 635 nm. The laser light was passed through an excitation filter D640/20x
(Chroma) and reflected off a ZT647rdc dichroic mirror to excite the sample through a ELWD
20x Nikon Plan Fluor objective lens (NA = 0.45). The PL intensity was collected in the
backward direction by the same objective lens, passed through a HQ680/30x emission filter
(Chroma) and finally detected by a H5784-20 PMT (Hamamatsu, Bridgewater, NJ). The
program used for time based monitoring and data acquisition was written in-house using
LabVIEW software.
Electrokinetic flow within the walls of microfluidic channels was controlled using a Labsmith
High Voltage Sequencer (HVS448-3000, Livermore, CA).
Scanning electron microscope (SEM) images were acquired using a Hitachi s-5200 SEM
(Hitachi High Technologies America, Pleasanton, CA).
A2.1.2 Chemical Modification of Glass Coverslips and Silicon Wafers
The chemical modification scheme described below was concurrently applied to 32 glass
coverslips. The microscope glass coverslips were placed inside mini-racks made of Teflon
(Invitrogen by Life Technologies) to prevent contact between the coverslips. The coverslips were
then cleaned with the RCA1 and RCA2 methods (described below) to generate surface silanol
groups.
The coverslips were initially subjected to a base wash treatment consisting of 1:1:5 (v/v) mixture
of ammonium hydroxide, hydrogen peroxide and deionized water respectively at 85°C for 5 min.
The slides were then rinsed twice with deionized water. This was followed by an acid wash
treatment consisting of 1:1:5 (v/v) mixture of hydrochloric acid, hydrogen peroxide and
deionized water respectively at 85°C for 5 min. The slides were then rinsed twice with deionized
water, sonicated twice in methanol, and then rinsed with dichloromethane and diethylether in a
154
sequential manner. The slides were dried using a nitrogen spray and kept inside a desiccator until
further use.
Cleaned coverslips were modified with APTMS to yield amine terminated coverslips via a
silanization reaction. The cleaned coverslips were immersed in anhydrous toluene solution (ca.
300 ml) containing APTMS at 3-5% (v/v) and 1 ml of DIPEA. The dispensing of the reagents
was carried out inside a glovebox filled with nitrogen. The reaction mixture was refluxed under
argon for 6 hours at ca. 120°C. After the reaction, the slides were rinsed twice with methanol,
sonicated twice in methanol for 10 min, and then rinsed with dichloromethane and diethylether
in sequentially. APTMS modified glass coverslips were stored inside a desiccator until further
use.
APTMS modified coverslips were further derivatized with a biotin functionality by an amide
bond formation using carbodiimide chemistry. The slides were immersed in ca. 150 mL of
anhydrous DMF containing 350 mg (1.4 mmol) of biotin, 400 mg (3.5 mmol) of NHS and 1 ml
of DIPEA. The reaction mixture was then placed on an orbital shaker until complete dissolution
of the reagents and then 350 μl of DIC (2.3 mmol) dissolved in 5 ml of DMF was added
dropwise to the reaction mixture while stirring. The reaction was allowed to proceed for 24
hours, followed by rinsing of the glass coverslips once with DMF, twice with isopropanol. The
glass coverslips were then sonicated twice in isopropanol for 10 min, rinsed once with
dichloromethane and once with diethylether. The biotin modified coverslips were stored in a
desiccator until further use.
The chemical modification of silicon wafers with a biotin functionality proceeded in the same
manner as for the glass coverslips, except the silicon wafers were cut to dimensions of 22 mm ×
22 mm to accommodate placement in mini-racks during the chemical modification steps.
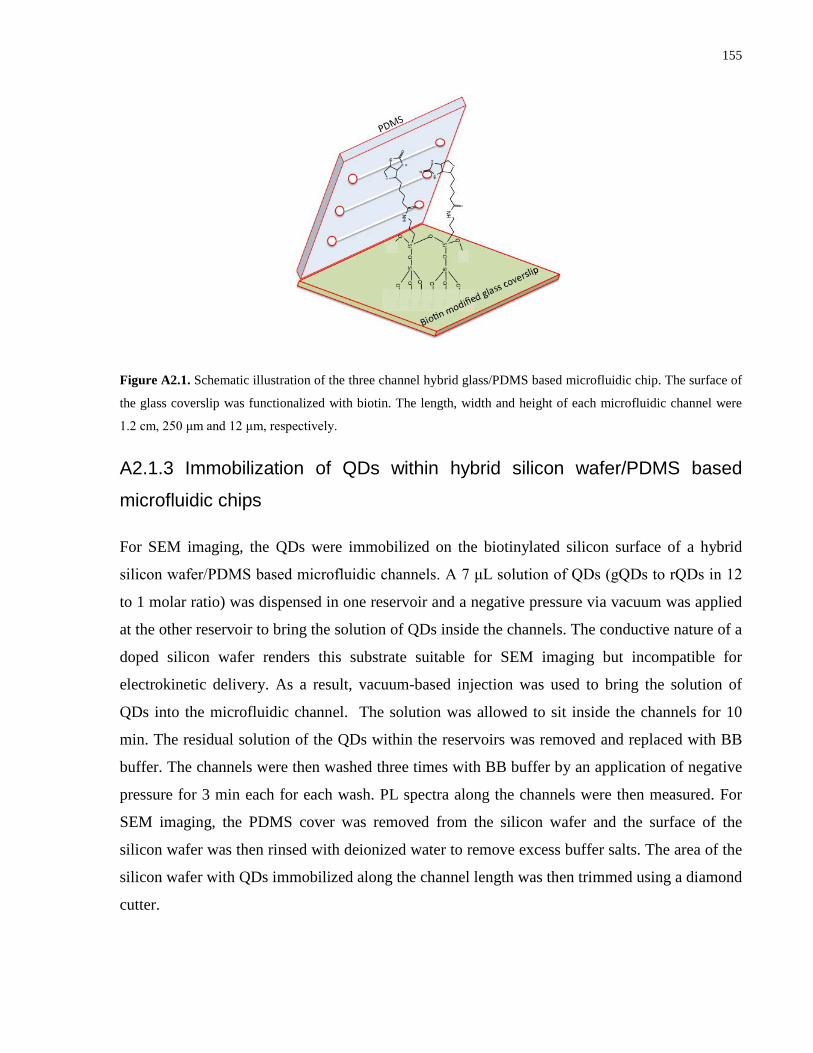
155
Figure A2.1. Schematic illustration of the three channel hybrid glass/PDMS based microfluidic chip. The surface of
the glass coverslip was functionalized with biotin. The length, width and height of each microfluidic channel were
1.2 cm, 250 μm and 12 μm, respectively.
A2.1.3 Immobilization of QDs within hybrid silicon wafer/PDMS based
microfluidic chips
For SEM imaging, the QDs were immobilized on the biotinylated silicon surface of a hybrid
silicon wafer/PDMS based microfluidic channels. A 7 μL solution of QDs (gQDs to rQDs in 12
to 1 molar ratio) was dispensed in one reservoir and a negative pressure via vacuum was applied
at the other reservoir to bring the solution of QDs inside the channels. The conductive nature of a
doped silicon wafer renders this substrate suitable for SEM imaging but incompatible for
electrokinetic delivery. As a result, vacuum-based injection was used to bring the solution of
QDs into the microfluidic channel. The solution was allowed to sit inside the channels for 10
min. The residual solution of the QDs within the reservoirs was removed and replaced with BB
buffer. The channels were then washed three times with BB buffer by an application of negative
pressure for 3 min each for each wash. PL spectra along the channels were then measured. For
SEM imaging, the PDMS cover was removed from the silicon wafer and the surface of the
silicon wafer was then rinsed with deionized water to remove excess buffer salts. The area of the
silicon wafer with QDs immobilized along the channel length was then trimmed using a diamond
cutter.
156
It should be noted that the plasma oxidation of the PDMS cover was necessary to render
channels hydrophilic for the injection of aqueous solution. However, due to the presence of
biotin functionality on the glass coverslips, they could not be subjected to plasma oxidation. As a
result, biotin-modified coverslips offer a weak seal of the PDMS cover, which rendered the
bonding reversible. In other words, it was possible to remove PDMS cover from the glass
coverslip. Due to the aforementioned weak seal, vacuum injection instead of pressure injection
was applied to bring QDs inside the microfluidic channels.
A2.2 Data Analysis
A2.2.1 Quantum Yields
For gQDs dissolved in 50 mM BB (pH 9.25), the QY value was estimated using fluorescein dye
as a standard that was dissolved in 0.1 M NaOH. The QY of fluorescein under these conditions is
reported to be 0.92 221. In case of rQDs dissolved in 50 mM BB (pH 9.25), the QY standard used
was sulforhodamine 101 dissolved in ethanol. The QY of sulforhodamine 101 under these
conditions is reported to be 1.00 222. For Cy3 dissolved in 100 mM TB (pH 7.44, 20 mM NaCl),
the QY standard used was 5-carboxytetramethylrhodamine (5-CTMR) that was dissolved in
methanol. The QY of 5-CTMR under these conditions is reported to be 0.68 223. In case of A647
dissolved in 100 mM TB (pH 7.44, 20 mM NaCl), the QY standard used was Nile Blue
perchlorate that was dissolved in acidic ethanol. The QY of Nile Blue perchlorate under these
conditions is reported to be 0.27 224. The Cy3 and A647 dyes were conjugated with SMN1 and
uidA targets, respectively. Using equation 1, the QY values were obtained from the relative
slopes of the plots of integrated fluorescence intensity versus absorbance for the sample and the
standard at different concentrations. The trapezoidal approximation was made in calculating the
value of the integrated fluorescence intensity. The QY standards fluorescein, sulforhodamine
101, 5-CTMR and nile blue perchlorate were excited at 470 nm, 560 nm, 520 nm and 600 nm,
respectively. Cy3, A647 and both colors of QDs were excited at 518 nm, 620 nm and 406 nm,
respectively. The path length was kept constant for all the measurements and is assumed in Eqn.
A2.1.
[A2.1]
157
The QYs of gQDs and rQDs donors were determined to be 47.8% and 89.1%, respectively. The
QYs of Cy3 and A647 acceptors were determined to be 19.7% and 51.6%, respectively.
The Förster distance, Ro, which is a characteristic of the donor-acceptor FRET pair, was
determined using Eqn. A2.2. The Förster distance depends on the refractive index of the
medium, n, the quantum yield of the donor, ΦD, the relative orientation in space of the emission
dipole of donor and absorption dipole of acceptor, κ2, and spectral overlap between the emission
of the donor and the absorption of the acceptor, J, a value described by Eqn. A2.3. The spectral
overlap integral is a wavelength dependent function of the fluorescence intensity of the donor,
FD, and molar absorptivity coefficient of the acceptor, εA, normalized by the integrated
fluorescence intensity of the donor. The trapezoidal approximation was made in calculating the
various integrals. A qualitative representation of the spectral overlaps for the gQD/Cy3 and
rQD/A647 FRET pairs is shown in the shaded area in Figure A2.2.
[A2.2]
[A2.3]
A2.2.2 FRET Ratios
For single-color hybridization experiments, the quantitative and comparative analysis was done
by assigning a FRET ratio, R, for each normalized and background corrected PL spectrum. For
the experiments done with gQD/Cy3 FRET pair, the RgQD/Cy3 is given by Eqn. A2.4.
[A2.4]
In Eqn. A2.4, a wavelength range from 560 nm to 590 nm in the numerator corresponds to a
region of significant acceptor (Cy3) PL intensity, while a wavelength range from 510 nm to 540
nm in the denominator corresponds to a region of significant donor (gQDs) PL intensity. The
subscript DA indicates the measurements made in the presence of both the donor (gQDs) and the
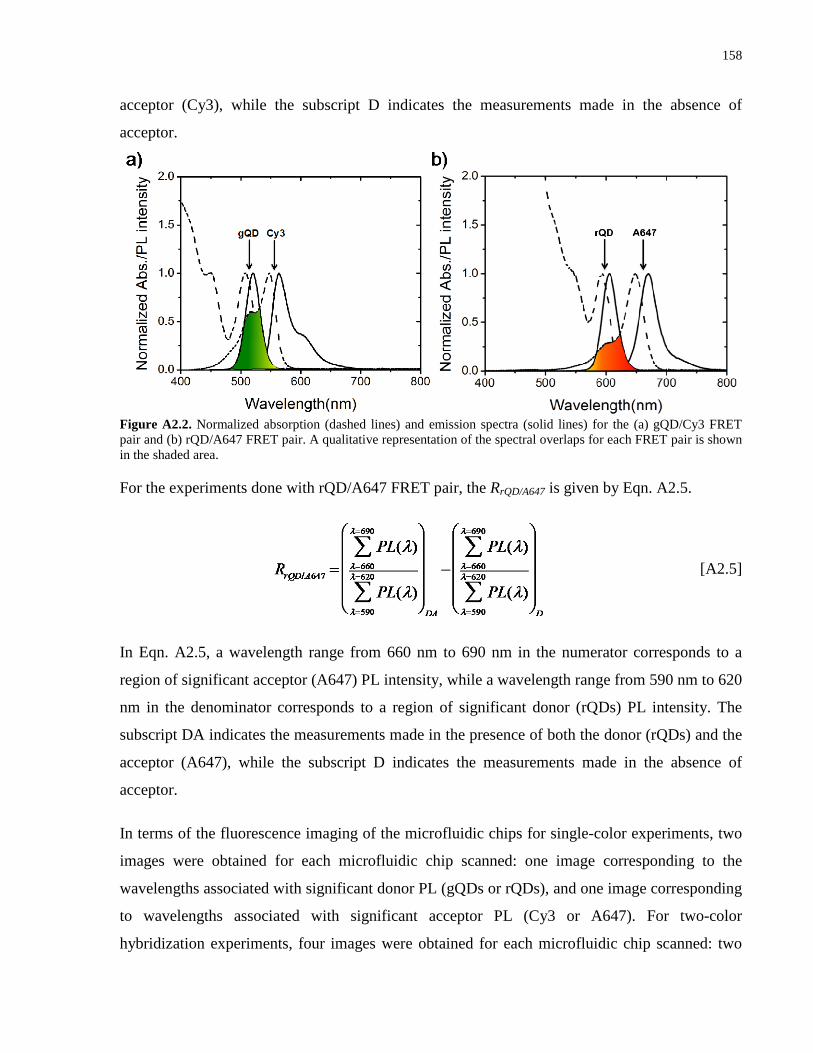
158
acceptor (Cy3), while the subscript D indicates the measurements made in the absence of
acceptor.
Figure A2.2. Normalized absorption (dashed lines) and emission spectra (solid lines) for the (a) gQD/Cy3 FRET pair and (b) rQD/A647 FRET pair. A qualitative representation of the spectral overlaps for each FRET pair is shown in the shaded area.
For the experiments done with rQD/A647 FRET pair, the RrQD/A647 is given by Eqn. A2.5.
[A2.5]
In Eqn. A2.5, a wavelength range from 660 nm to 690 nm in the numerator corresponds to a
region of significant acceptor (A647) PL intensity, while a wavelength range from 590 nm to 620
nm in the denominator corresponds to a region of significant donor (rQDs) PL intensity. The
subscript DA indicates the measurements made in the presence of both the donor (rQDs) and the
acceptor (A647), while the subscript D indicates the measurements made in the absence of
acceptor.
In terms of the fluorescence imaging of the microfluidic chips for single-color experiments, two
images were obtained for each microfluidic chip scanned: one image corresponding to the
wavelengths associated with significant donor PL (gQDs or rQDs), and one image corresponding
to wavelengths associated with significant acceptor PL (Cy3 or A647). For two-color
hybridization experiments, four images were obtained for each microfluidic chip scanned: two
159
images corresponding to the wavelengths associated with significant donors PL (gQDs and
rQDr) and two images corresponding to the wavelengths associated with significant acceptors PL
(Cy3 and A647). (See instrumentation section for the specification of emission filter used for
imaging each detection channel).
A2.2.3 Determination of the Net Mobilities of SMN1 and uidA Targets
The net mobilities of the SMN1 and uidA targets were in the direction of the anode. Mobilities
were experimentally determined using time-based measurements. The sequence for tracking of
motion was Cy5 labeled, and an epifluorescence microscope equipped with the excitation and
detection of Cy5 dye (see instrumentation section for details) was used for imaging. A 7 μL
solution of an oligonucleotide sequence at 1 μM concentration dissolved in TB buffer was
dispensed in a reservoir connected to the cathode. A voltage of 200 V was applied across the
length of a microfluidic channel to introduce Cy5-labeled sequence into the channel. Time-based
measurements associated with observation of the location of Cy5 fluorescence were done at the
end of the channel close to a reservoir connected to the anode. Knowledge of the length of the
microfluidic channel (ca. 1.2 cm) and the time required for the appearance of a fluorescence
signal, was sufficient to determine the net mobilities of SMN1 and uidA target. The net
mobilities of SMN1 and uidA targets were determined to be 1.1 × 10⁻⁴ cm2 V-1s-1 and
1.6 × 10⁻⁴ cm2 V-1s-1, respectively.
A2.2.4 Cross-over Point Calibration
An estimation of the length of a microfluidic channel exhibiting target hybridization as a
function of the amount of target DNA delivered into a microfluidic channel was done using a
cross-over point analysis. Cross-over point is a distance along a microfluidic channel where the
normalized PL intensities of the donor and the acceptor meet. An example of a cross-over point
for the gQD/Cy3 FRET pair for determination of the channel length coverage exhibiting target
hybridization is shown in Figure. A2.3. The acquired epifluorescence images were opened and
background corrected using ImageJ software, and the plot line profile feature was used to plot
the donors and acceptors PL intensity profiles along the microfluidic channels. The PL profiles
were then normalized to a maximum value.
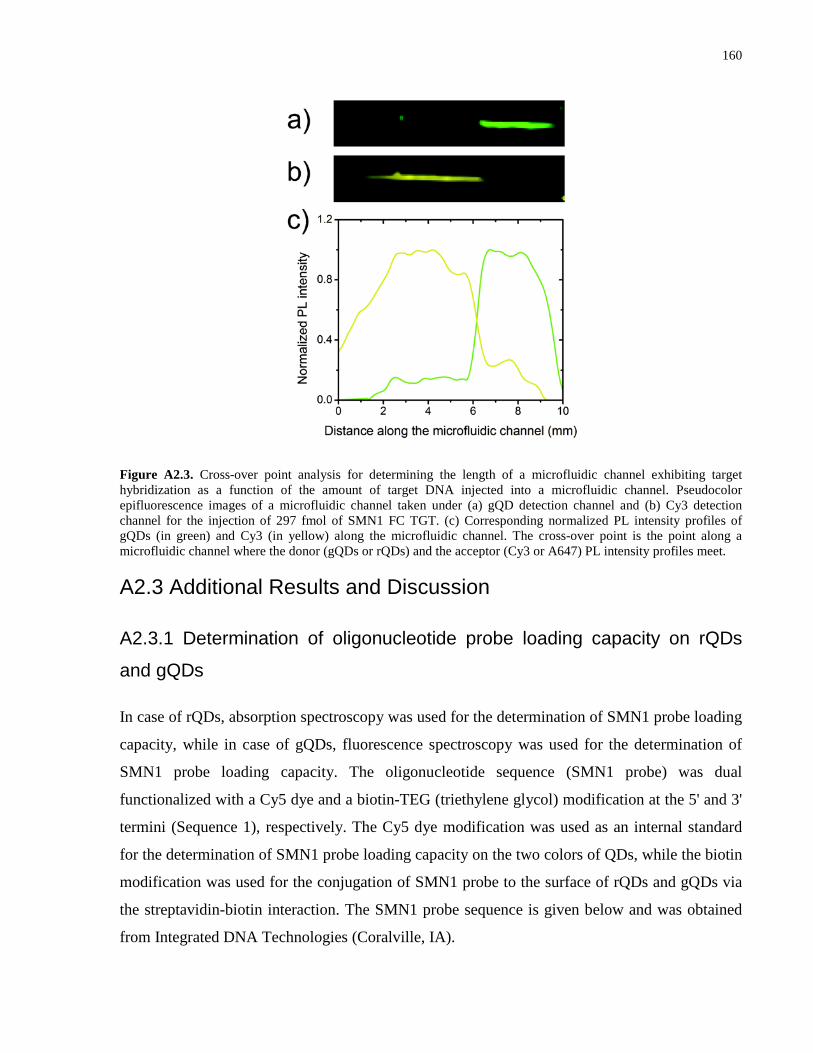
160
Figure A2.3. Cross-over point analysis for determining the length of a microfluidic channel exhibiting target hybridization as a function of the amount of target DNA injected into a microfluidic channel. Pseudocolor epifluorescence images of a microfluidic channel taken under (a) gQD detection channel and (b) Cy3 detection channel for the injection of 297 fmol of SMN1 FC TGT. (c) Corresponding normalized PL intensity profiles of gQDs (in green) and Cy3 (in yellow) along the microfluidic channel. The cross-over point is the point along a microfluidic channel where the donor (gQDs or rQDs) and the acceptor (Cy3 or A647) PL intensity profiles meet.
A2.3 Additional Results and Discussion
A2.3.1 Determination of oligonucleotide probe loading capacity on rQDs
and gQDs
In case of rQDs, absorption spectroscopy was used for the determination of SMN1 probe loading
capacity, while in case of gQDs, fluorescence spectroscopy was used for the determination of
SMN1 probe loading capacity. The oligonucleotide sequence (SMN1 probe) was dual
functionalized with a Cy5 dye and a biotin-TEG (triethylene glycol) modification at the 5' and 3'
termini (Sequence 1), respectively. The Cy5 dye modification was used as an internal standard
for the determination of SMN1 probe loading capacity on the two colors of QDs, while the biotin
modification was used for the conjugation of SMN1 probe to the surface of rQDs and gQDs via
the streptavidin-biotin interaction. The SMN1 probe sequence is given below and was obtained
from Integrated DNA Technologies (Coralville, IA).
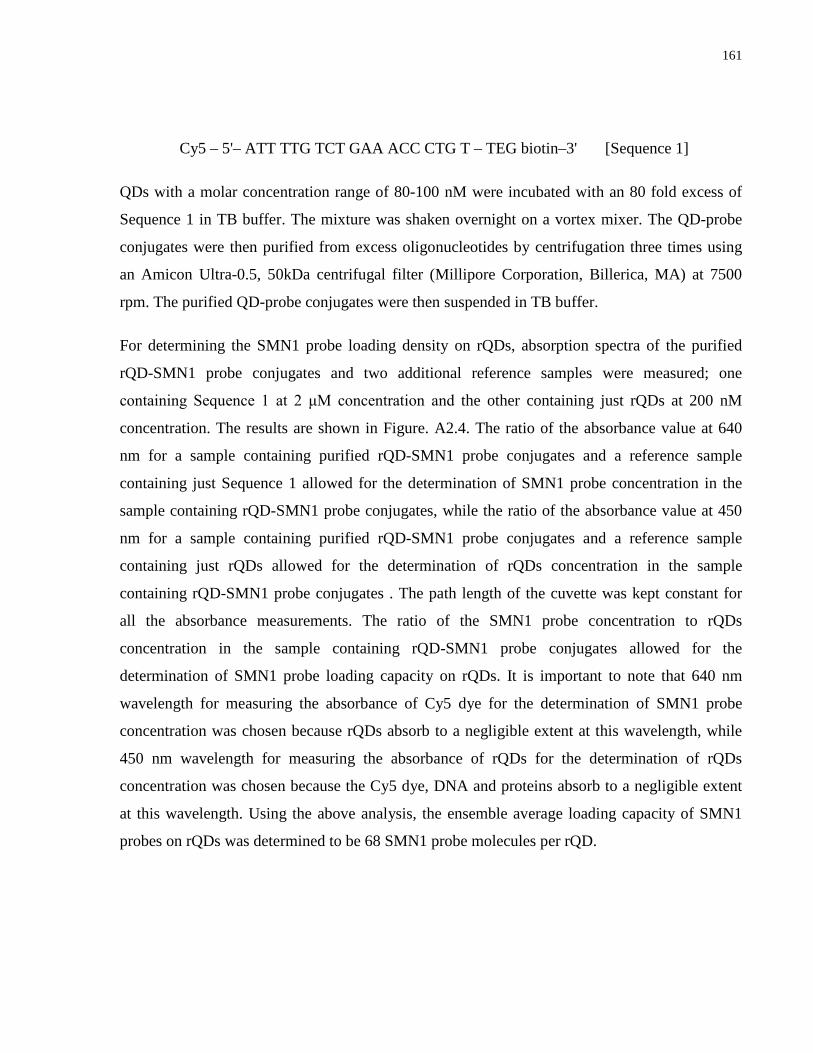
161
Cy5 – 5'– ATT TTG TCT GAA ACC CTG T – TEG biotin–3' [Sequence 1]
QDs with a molar concentration range of 80-100 nM were incubated with an 80 fold excess of
Sequence 1 in TB buffer. The mixture was shaken overnight on a vortex mixer. The QD-probe
conjugates were then purified from excess oligonucleotides by centrifugation three times using
an Amicon Ultra-0.5, 50kDa centrifugal filter (Millipore Corporation, Billerica, MA) at 7500
rpm. The purified QD-probe conjugates were then suspended in TB buffer.
For determining the SMN1 probe loading density on rQDs, absorption spectra of the purified
rQD-SMN1 probe conjugates and two additional reference samples were measured; one
containing Sequence 1 at 2 μM concentration and the other containing just rQDs at 200 nM
concentration. The results are shown in Figure. A2.4. The ratio of the absorbance value at 640
nm for a sample containing purified rQD-SMN1 probe conjugates and a reference sample
containing just Sequence 1 allowed for the determination of SMN1 probe concentration in the
sample containing rQD-SMN1 probe conjugates, while the ratio of the absorbance value at 450
nm for a sample containing purified rQD-SMN1 probe conjugates and a reference sample
containing just rQDs allowed for the determination of rQDs concentration in the sample
containing rQD-SMN1 probe conjugates . The path length of the cuvette was kept constant for
all the absorbance measurements. The ratio of the SMN1 probe concentration to rQDs
concentration in the sample containing rQD-SMN1 probe conjugates allowed for the
determination of SMN1 probe loading capacity on rQDs. It is important to note that 640 nm
wavelength for measuring the absorbance of Cy5 dye for the determination of SMN1 probe
concentration was chosen because rQDs absorb to a negligible extent at this wavelength, while
450 nm wavelength for measuring the absorbance of rQDs for the determination of rQDs
concentration was chosen because the Cy5 dye, DNA and proteins absorb to a negligible extent
at this wavelength. Using the above analysis, the ensemble average loading capacity of SMN1
probes on rQDs was determined to be 68 SMN1 probe molecules per rQD.
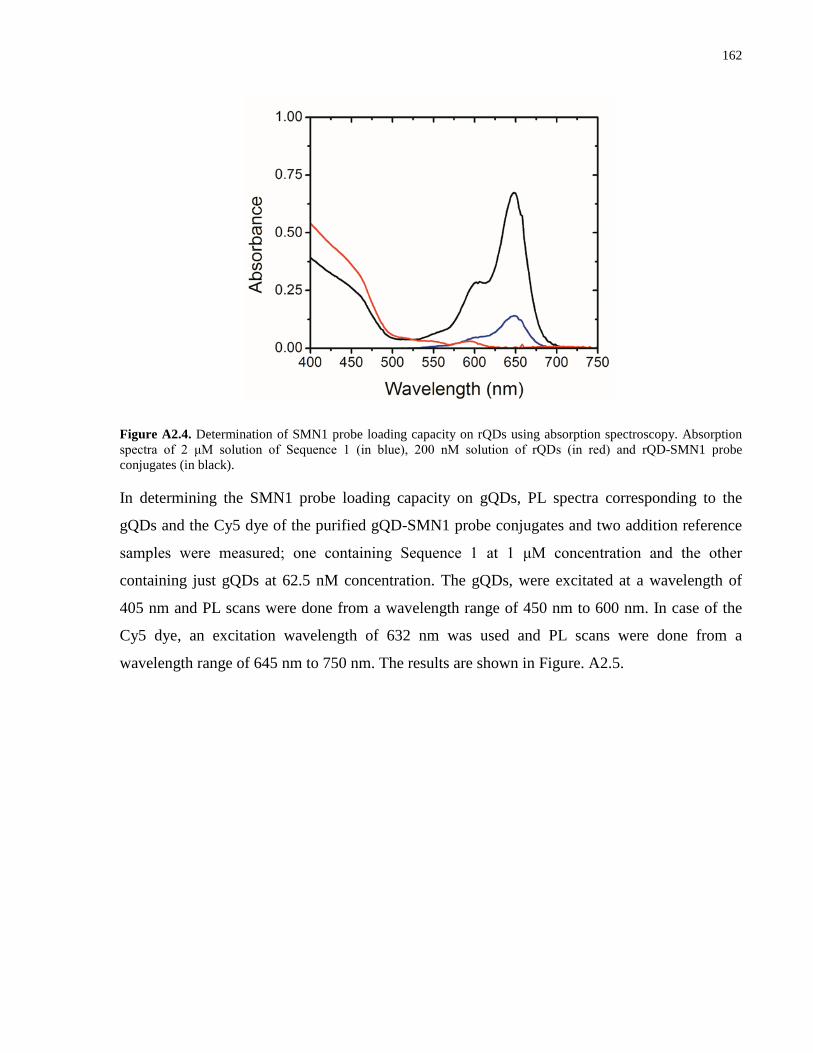
162
Figure A2.4. Determination of SMN1 probe loading capacity on rQDs using absorption spectroscopy. Absorption spectra of 2 μM solution of Sequence 1 (in blue), 200 nM solution of rQDs (in red) and rQD-SMN1 probe conjugates (in black).
In determining the SMN1 probe loading capacity on gQDs, PL spectra corresponding to the
gQDs and the Cy5 dye of the purified gQD-SMN1 probe conjugates and two addition reference
samples were measured; one containing Sequence 1 at 1 μM concentration and the other
containing just gQDs at 62.5 nM concentration. The gQDs, were excitated at a wavelength of
405 nm and PL scans were done from a wavelength range of 450 nm to 600 nm. In case of the
Cy5 dye, an excitation wavelength of 632 nm was used and PL scans were done from a
wavelength range of 645 nm to 750 nm. The results are shown in Figure. A2.5.
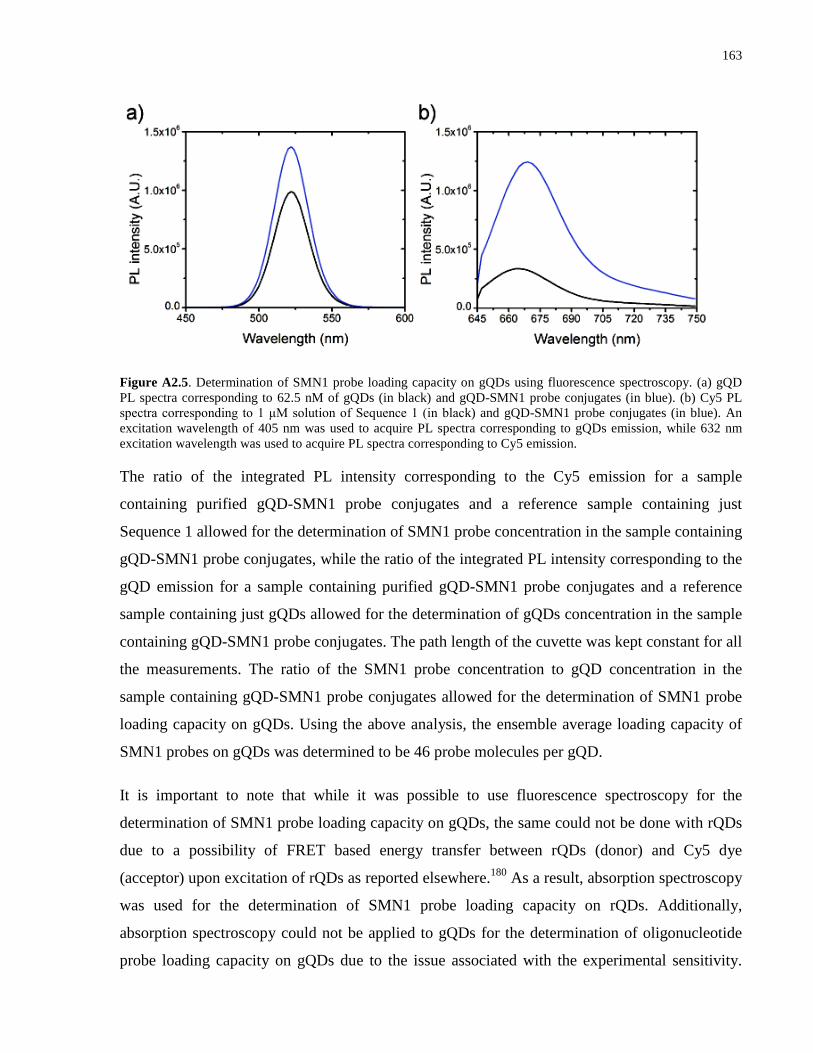
163
Figure A2.5. Determination of SMN1 probe loading capacity on gQDs using fluorescence spectroscopy. (a) gQD PL spectra corresponding to 62.5 nM of gQDs (in black) and gQD-SMN1 probe conjugates (in blue). (b) Cy5 PL spectra corresponding to 1 μM solution of Sequence 1 (in black) and gQD-SMN1 probe conjugates (in blue). An excitation wavelength of 405 nm was used to acquire PL spectra corresponding to gQDs emission, while 632 nm excitation wavelength was used to acquire PL spectra corresponding to Cy5 emission.
The ratio of the integrated PL intensity corresponding to the Cy5 emission for a sample
containing purified gQD-SMN1 probe conjugates and a reference sample containing just
Sequence 1 allowed for the determination of SMN1 probe concentration in the sample containing
gQD-SMN1 probe conjugates, while the ratio of the integrated PL intensity corresponding to the
gQD emission for a sample containing purified gQD-SMN1 probe conjugates and a reference
sample containing just gQDs allowed for the determination of gQDs concentration in the sample
containing gQD-SMN1 probe conjugates. The path length of the cuvette was kept constant for all
the measurements. The ratio of the SMN1 probe concentration to gQD concentration in the
sample containing gQD-SMN1 probe conjugates allowed for the determination of SMN1 probe
loading capacity on gQDs. Using the above analysis, the ensemble average loading capacity of
SMN1 probes on gQDs was determined to be 46 probe molecules per gQD.
It is important to note that while it was possible to use fluorescence spectroscopy for the
determination of SMN1 probe loading capacity on gQDs, the same could not be done with rQDs
due to a possibility of FRET based energy transfer between rQDs (donor) and Cy5 dye
(acceptor) upon excitation of rQDs as reported elsewhere.180 As a result, absorption spectroscopy
was used for the determination of SMN1 probe loading capacity on rQDs. Additionally,
absorption spectroscopy could not be applied to gQDs for the determination of oligonucleotide
probe loading capacity on gQDs due to the issue associated with the experimental sensitivity.
164
The gQDs used in the work have a smaller molar extinction coefficient value as compared to the
rQDs. The wavelength used to monitor the absorbance value of the QDs was 450 nm. At this
wavelength, the molar extinction coefficient of rQDs and gQDs are 6.0 ×10⁶ M-1cm-1 and
2.0 ×10⁵ M-1cm-1 respectively. As an example, a 1 μM solution of gQDs will provide an
absorbance value of 0.06, while in case of 1 μM solution of rQDs, the absorbance value will be
1.81. It should be noted that the stock concentration of QDs provided by the manufacturer was 2
μM. For an improved signal to noise consideration, fluorescence spectroscopy was used to
determine probe loading capacity on gQDs.
A2.3.2 Solution-phase Hybridization Assays
Solution-phase hybridization experiments were done with both colors of QDs to investigate the
effect of probe loading capacity on the hybridization efficiency, and also to cross-correlate the
probe loading capacity results with the hybridization results. Moreover, for FRET applications it
is not the presence of probes but rather those available for hybridization at the given temperature
and ionic strength. The oligonucleotide probe and target sequences used for solution-phase
hybridization assays are given in Table A2.1.
Table A2.1. Oligonucleotide sequences used for solution-phase hybridization assays
Name Sequence SMN1 probe BiotinC6 - 5'- ATT TTG TCT GAA ACC CTG T - 3'
SMN1 Cy3 FC TGT Cy3 - 3′-TAA AAC AGA CTT TGG GAC A-5′
SMN1 A647 FC TGT A647 - 3′-TAA AAC AGA CTT TGG GAC A-5′
TGT = target, FC = fully-complementary, A647 = Alexa Fluor 647
Solution-phase preparation of QD-probe conjugates was done by incubating gQDs and rQDs
with 80 times molar excess of SMN1 probe in TB buffer. The concentration of the QDs in the
final solution was 200-250 nM. The mixture was placed on an orbital shaker for 2 hours
followed by purification of QD-probe conjugates from excess probe by centrifugation three times
using an Amicon Ultra-0.5, 50kDa centrifugal filter (Millipore Corporation, Billerica, MA) at
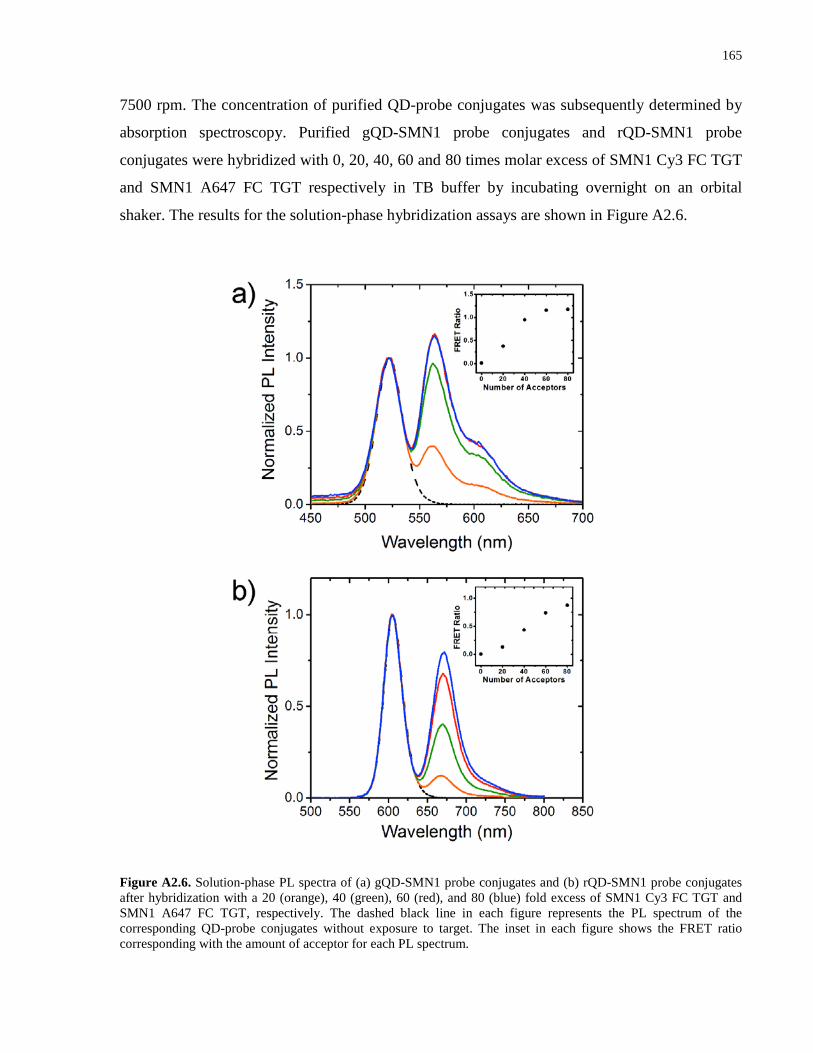
165
7500 rpm. The concentration of purified QD-probe conjugates was subsequently determined by
absorption spectroscopy. Purified gQD-SMN1 probe conjugates and rQD-SMN1 probe
conjugates were hybridized with 0, 20, 40, 60 and 80 times molar excess of SMN1 Cy3 FC TGT
and SMN1 A647 FC TGT respectively in TB buffer by incubating overnight on an orbital
shaker. The results for the solution-phase hybridization assays are shown in Figure A2.6.
Figure A2.6. Solution-phase PL spectra of (a) gQD-SMN1 probe conjugates and (b) rQD-SMN1 probe conjugates after hybridization with a 20 (orange), 40 (green), 60 (red), and 80 (blue) fold excess of SMN1 Cy3 FC TGT and SMN1 A647 FC TGT, respectively. The dashed black line in each figure represents the PL spectrum of the corresponding QD-probe conjugates without exposure to target. The inset in each figure shows the FRET ratio corresponding with the amount of acceptor for each PL spectrum.
166
Based on the saturation of FRET ratio response, the response for the gQD/Cy3 FRET pair
saturated at 48 acceptors (48 SMN1 Cy3 FC TGTs), while in case of the rQD/A647 FRET pair,
the FRET ratio response saturated at 69 acceptors (69 SMN1 A647 TGTs). These numbers are in
agreement with the SMN1 probe loading capacity of 46 and 68 on gQDs and rQDs, respectively.
Overall, these results suggest that the hybridization efficiency of the assay was not compromised
despite the presence of different probe loading capacity on the two colors of QDs.
167
Appendix 3 – Supporting Information for Chapter 4
A3.1 Experimental
A3.1.1 Reagents and Materials
Buffers used included 50 mM borate buffer (BB) pH 9.25 and 100 mM Tris-borate buffer with
20 mM NaCl (TB) pH 7.43. In experiments evaluating the effect of ionic strength on
hybridization selectivity, additional NaCl was added to the BB in 25 mM increments from 25 to
100 mM. Buffer solutions were prepared using deionized water from a Millipore Synergy UV R
system (Millipore Corp., Mississauga, ON, Canada) and autoclaved. Oligonucleotide probe and
target sequences were purchased from Integrated DNA Technologies (Coralville, IA) and HPLC
purified by the manufacturer. Additional reagents that included agarose, dioxane
(anhydrous, 99.8%), formamide (99.5%), and goat serum were from Sigma Aldrich (Oakville,
ON, Canada).
A3.1.2 Instrumentation
Steady-state and time-resolved photoluminescence (PL) measurements were made using a PTI
QuantaMaster spectrofluorimeter (Photon Technology International, London, ON, Canada)
through use of Felix GX software. The stroboscopic method was used in acquisition of PL
lifetimes through use of a dye laser (GL-302, Photon Technology International) pumped by a
pulsed nitrogen laser (GL-3300, Photon Technology International). The lasing dye was
comprised of a saturated solution of 4,4’-(1,2-ethenediyl)bis-1,1-biphenyl (DPS) from Exciton
(Dayton, OH) in dioxane, and the output of the dye laser was tuned to 402 nm.
A3.2. Data Analysis A3.2.1 Steady State and Time-Resolved Fluorescence Measurements
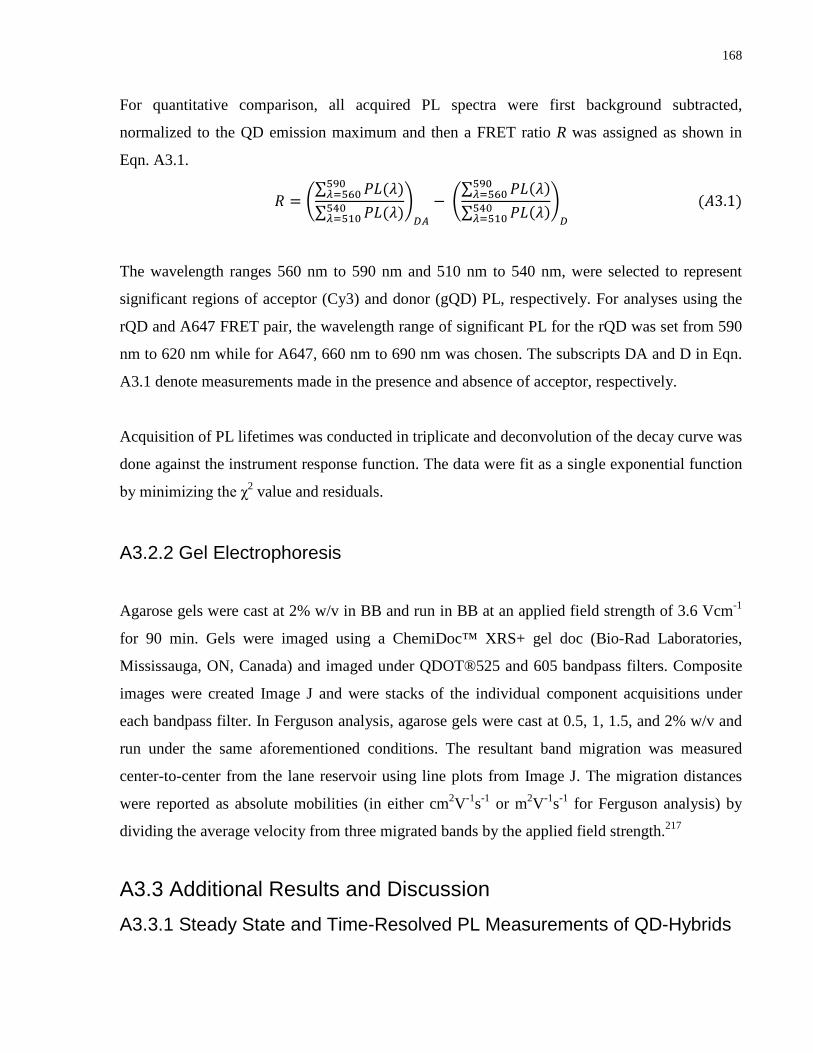
168
For quantitative comparison, all acquired PL spectra were first background subtracted,
normalized to the QD emission maximum and then a FRET ratio R was assigned as shown in
Eqn. A3.1.
𝑅 = �∑ 𝑃𝐿(𝜆)590𝜆=560
∑ 𝑃𝐿(𝜆)540𝜆=510
�𝐷𝐴
− �∑ 𝑃𝐿(𝜆)590𝜆=560
∑ 𝑃𝐿(𝜆)540𝜆=510
�𝐷
(𝐴3.1)
The wavelength ranges 560 nm to 590 nm and 510 nm to 540 nm, were selected to represent
significant regions of acceptor (Cy3) and donor (gQD) PL, respectively. For analyses using the
rQD and A647 FRET pair, the wavelength range of significant PL for the rQD was set from 590
nm to 620 nm while for A647, 660 nm to 690 nm was chosen. The subscripts DA and D in Eqn.
A3.1 denote measurements made in the presence and absence of acceptor, respectively.
Acquisition of PL lifetimes was conducted in triplicate and deconvolution of the decay curve was
done against the instrument response function. The data were fit as a single exponential function
by minimizing the χ2 value and residuals.
A3.2.2 Gel Electrophoresis
Agarose gels were cast at 2% w/v in BB and run in BB at an applied field strength of 3.6 Vcm-1
for 90 min. Gels were imaged using a ChemiDoc™ XRS+ gel doc (Bio-Rad Laboratories,
Mississauga, ON, Canada) and imaged under QDOT®525 and 605 bandpass filters. Composite
images were created Image J and were stacks of the individual component acquisitions under
each bandpass filter. In Ferguson analysis, agarose gels were cast at 0.5, 1, 1.5, and 2% w/v and
run under the same aforementioned conditions. The resultant band migration was measured
center-to-center from the lane reservoir using line plots from Image J. The migration distances
were reported as absolute mobilities (in either cm2V-1s-1 or m2V-1s-1 for Ferguson analysis) by
dividing the average velocity from three migrated bands by the applied field strength.217
A3.3 Additional Results and Discussion A3.3.1 Steady State and Time-Resolved PL Measurements of QD-Hybrids
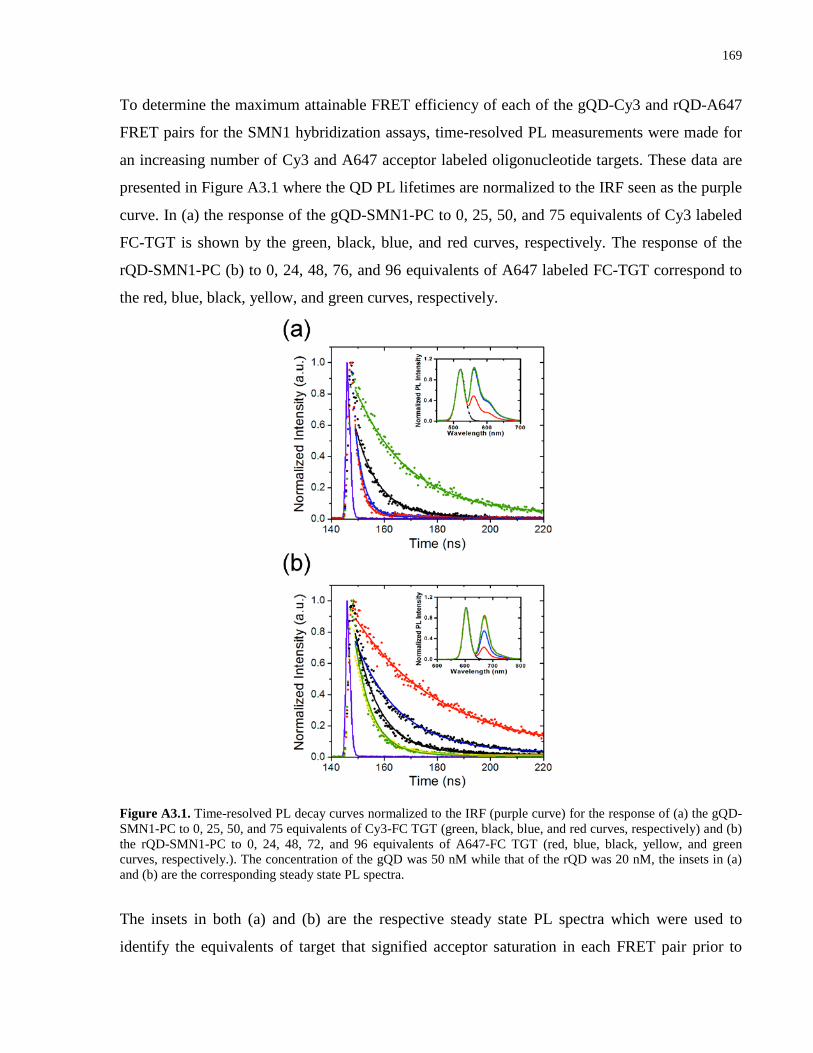
169
To determine the maximum attainable FRET efficiency of each of the gQD-Cy3 and rQD-A647
FRET pairs for the SMN1 hybridization assays, time-resolved PL measurements were made for
an increasing number of Cy3 and A647 acceptor labeled oligonucleotide targets. These data are
presented in Figure A3.1 where the QD PL lifetimes are normalized to the IRF seen as the purple
curve. In (a) the response of the gQD-SMN1-PC to 0, 25, 50, and 75 equivalents of Cy3 labeled
FC-TGT is shown by the green, black, blue, and red curves, respectively. The response of the
rQD-SMN1-PC (b) to 0, 24, 48, 76, and 96 equivalents of A647 labeled FC-TGT correspond to
the red, blue, black, yellow, and green curves, respectively.
Figure A3.1. Time-resolved PL decay curves normalized to the IRF (purple curve) for the response of (a) the gQD-SMN1-PC to 0, 25, 50, and 75 equivalents of Cy3-FC TGT (green, black, blue, and red curves, respectively) and (b) the rQD-SMN1-PC to 0, 24, 48, 72, and 96 equivalents of A647-FC TGT (red, blue, black, yellow, and green curves, respectively.). The concentration of the gQD was 50 nM while that of the rQD was 20 nM, the insets in (a) and (b) are the corresponding steady state PL spectra.
The insets in both (a) and (b) are the respective steady state PL spectra which were used to
identify the equivalents of target that signified acceptor saturation in each FRET pair prior to
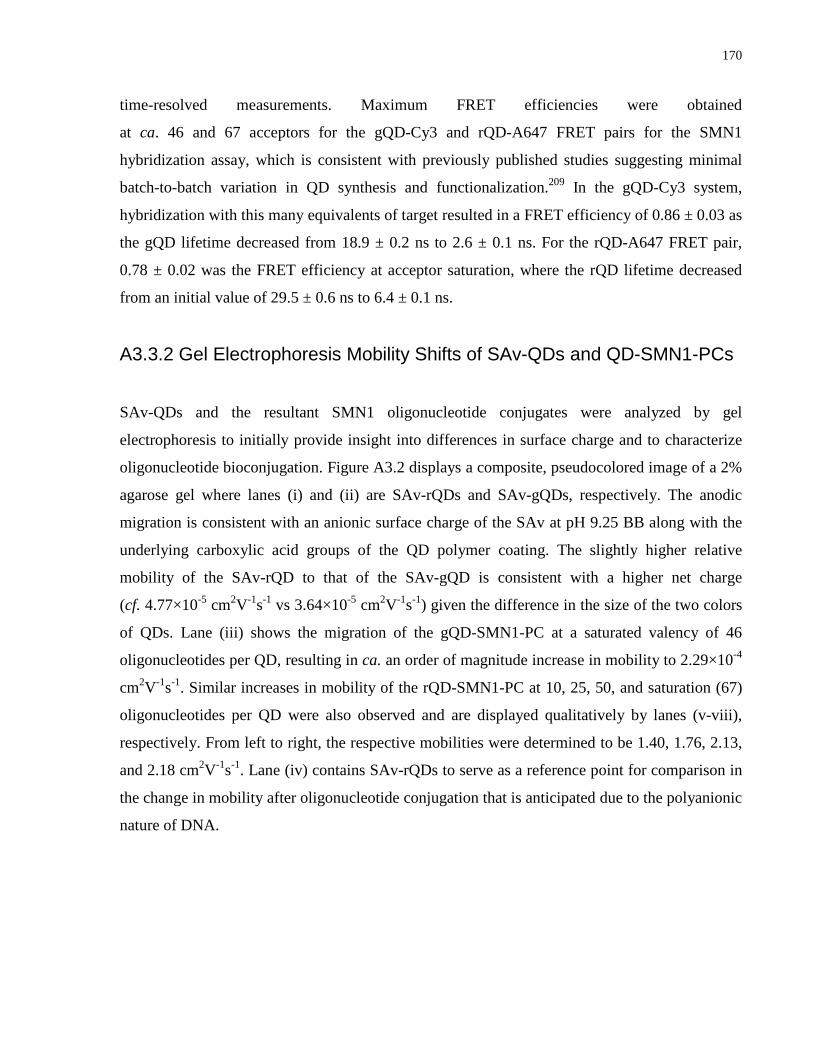
170
time-resolved measurements. Maximum FRET efficiencies were obtained
at ca. 46 and 67 acceptors for the gQD-Cy3 and rQD-A647 FRET pairs for the SMN1
hybridization assay, which is consistent with previously published studies suggesting minimal
batch-to-batch variation in QD synthesis and functionalization.209 In the gQD-Cy3 system,
hybridization with this many equivalents of target resulted in a FRET efficiency of 0.86 ± 0.03 as
the gQD lifetime decreased from 18.9 ± 0.2 ns to 2.6 ± 0.1 ns. For the rQD-A647 FRET pair,
0.78 ± 0.02 was the FRET efficiency at acceptor saturation, where the rQD lifetime decreased
from an initial value of 29.5 ± 0.6 ns to 6.4 ± 0.1 ns.
A3.3.2 Gel Electrophoresis Mobility Shifts of SAv-QDs and QD-SMN1-PCs
SAv-QDs and the resultant SMN1 oligonucleotide conjugates were analyzed by gel
electrophoresis to initially provide insight into differences in surface charge and to characterize
oligonucleotide bioconjugation. Figure A3.2 displays a composite, pseudocolored image of a 2%
agarose gel where lanes (i) and (ii) are SAv-rQDs and SAv-gQDs, respectively. The anodic
migration is consistent with an anionic surface charge of the SAv at pH 9.25 BB along with the
underlying carboxylic acid groups of the QD polymer coating. The slightly higher relative
mobility of the SAv-rQD to that of the SAv-gQD is consistent with a higher net charge
(cf. 4.77×10⁻⁵ cm2V-1s-1 vs 3.64×10⁻⁵ cm2V-1s-1) given the difference in the size of the two colors
of QDs. Lane (iii) shows the migration of the gQD-SMN1-PC at a saturated valency of 46
oligonucleotides per QD, resulting in ca. an order of magnitude increase in mobility to 2.29×10⁻⁴
cm2V-1s-1. Similar increases in mobility of the rQD-SMN1-PC at 10, 25, 50, and saturation (67)
oligonucleotides per QD were also observed and are displayed qualitatively by lanes (v-viii),
respectively. From left to right, the respective mobilities were determined to be 1.40, 1.76, 2.13,
and 2.18 cm2V-1s-1. Lane (iv) contains SAv-rQDs to serve as a reference point for comparison in
the change in mobility after oligonucleotide conjugation that is anticipated due to the polyanionic
nature of DNA.
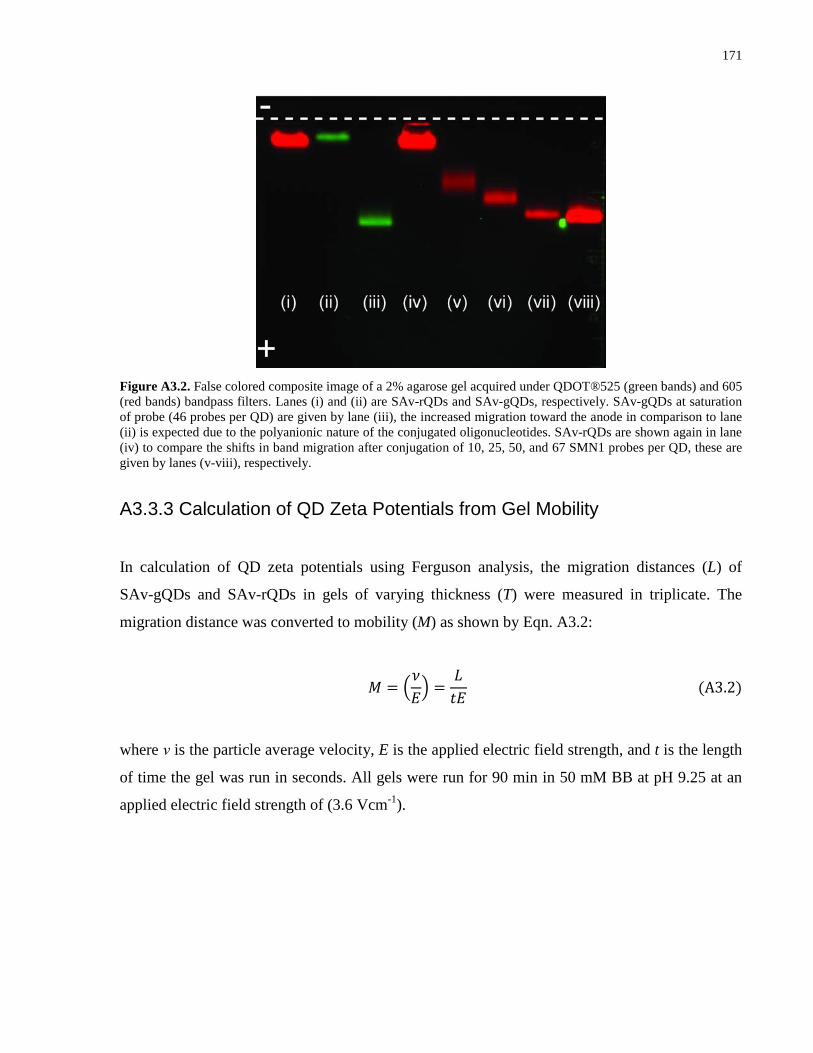
171
Figure A3.2. False colored composite image of a 2% agarose gel acquired under QDOT®525 (green bands) and 605 (red bands) bandpass filters. Lanes (i) and (ii) are SAv-rQDs and SAv-gQDs, respectively. SAv-gQDs at saturation of probe (46 probes per QD) are given by lane (iii), the increased migration toward the anode in comparison to lane (ii) is expected due to the polyanionic nature of the conjugated oligonucleotides. SAv-rQDs are shown again in lane (iv) to compare the shifts in band migration after conjugation of 10, 25, 50, and 67 SMN1 probes per QD, these are given by lanes (v-viii), respectively.
A3.3.3 Calculation of QD Zeta Potentials from Gel Mobility
In calculation of QD zeta potentials using Ferguson analysis, the migration distances (L) of
SAv-gQDs and SAv-rQDs in gels of varying thickness (T) were measured in triplicate. The
migration distance was converted to mobility (M) as shown by Eqn. A3.2:
𝑀 = �𝜈𝐸� =
𝐿𝑡𝐸
(A3.2)
where ν is the particle average velocity, E is the applied electric field strength, and t is the length
of time the gel was run in seconds. All gels were run for 90 min in 50 mM BB at pH 9.25 at an
applied electric field strength of (3.6 Vcm-1).
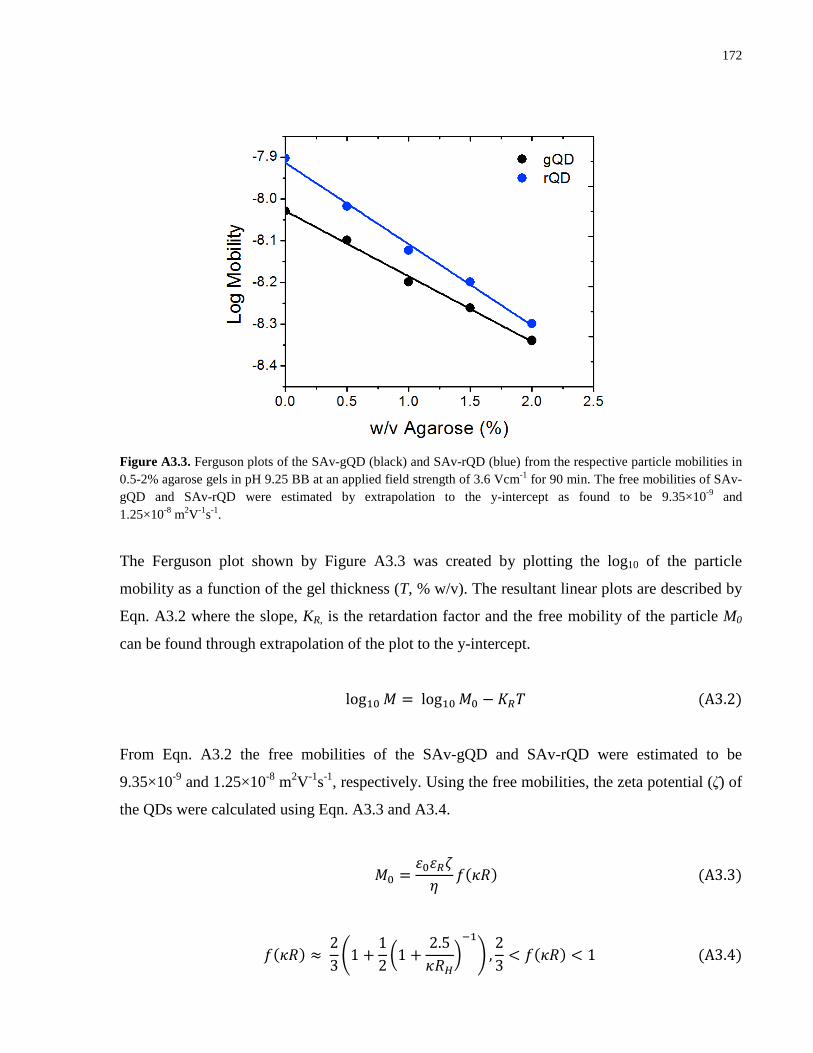
172
Figure A3.3. Ferguson plots of the SAv-gQD (black) and SAv-rQD (blue) from the respective particle mobilities in 0.5-2% agarose gels in pH 9.25 BB at an applied field strength of 3.6 Vcm-1 for 90 min. The free mobilities of SAv-gQD and SAv-rQD were estimated by extrapolation to the y-intercept as found to be 9.35×10⁻⁹ and 1.25×10⁻⁸ m2V-1s-1.
The Ferguson plot shown by Figure A3.3 was created by plotting the log10 of the particle
mobility as a function of the gel thickness (T, % w/v). The resultant linear plots are described by
Eqn. A3.2 where the slope, KR, is the retardation factor and the free mobility of the particle M0
can be found through extrapolation of the plot to the y-intercept.
log10 𝑀 = log10 𝑀0 − 𝐾𝑅𝑇 (A3.2)
From Eqn. A3.2 the free mobilities of the SAv-gQD and SAv-rQD were estimated to be
9.35×10⁻⁹ and 1.25×10⁻⁸ m2V-1s-1, respectively. Using the free mobilities, the zeta potential (ζ) of
the QDs were calculated using Eqn. A3.3 and A3.4.
𝑀0 =𝜀0𝜀𝑅𝜁𝜂
𝑓(𝜅𝑅) (A3.3)
𝑓(𝜅𝑅) ≈ 23�1 +
12�1 +
2.5𝜅𝑅𝐻
�−1
� ,23
< 𝑓(𝜅𝑅) < 1 (A3.4)

173
In Eqn. A3.3, ε0 and εR are the permittivity of free space and the relative permittivity of the
medium, respectively, the viscosity of the medium is given by η, which was approximated as
water. The particle Debye length is given by (κ-1) and can be calculated from the ionic strength
of the buffer as described in the publication by Park et al.217 The radius of hydration for each
type of SAv-QD as determined from fluorescence correlation spectroscopy measurements was
used in the calculation but can also be estimated from the gel data.217 From Eqn. A3.3 the zeta
potentials of the SAv-gQDs and SAv-rQDs were determined to be -20 and -25 mV, respectively.
174
Appendix 4 – Supporting Information for Chapter 5
A4.1 Detailed Experimental Methods A4.1.1 Reagents and Materials
Hydrogen peroxide (30%), ammonium hydroxide (30%), hydrochloric acid (16 M), methanol,
ethanol, isopropanol, dichloromethane and diethyl ether were obtained from Caledon
Laboratories (Georgetown, ON, Canada) and were reagent grade or better. Toluene (anhydrous,
99.8%), N,N-dimethylformamide (DMF) (anhydrous, 99.8%) 3-aminopropyltrimethoxysilane
(APTMS, 97%), N,N-diisopropylethylamine (DIPEA, 99.5%), N-hydroxysuccinimide (NHS,
99%), N,N-diisopropylcarbodiimide (DIC, 99%), biotin (99%), dioxane (anhydrous, 99.8%), and
formamide (99.5%) were from Sigma Aldrich (Oakville, ON, Canada). Deuterated
dimethylsulfoxide (DMSO-d6) was from Cambridge Isotope Laboratories (Cambridge, MA).
Buffers used were borate (BB; 50 mM, pH 9.25) and borate (BB + NaCl; 50 mM + 20 mM
NaCl, pH 9.25), and tris-borate (TB; 100 mM tris, 100 mM borate and 20 mM NaCl, pH 7.4).
All buffers were prepared using deionized water from a Millipore Synergy UV R purification
system (Millipore Corp., Mississauga, ON, Canada) and autoclaved prior to use. Before use in
microfluidic experiments, all buffers were filtered using an Acrodisc 0.2 μm syringe filter, Pall
Corp. (Ann Arbor, MI). CdSe/ZnS Qdot® 525 ITK™ and 605 ITK™ Streptavidin Conjugates
were from Life Technologies (Oakville, ON, Canada). Oligonucleotides were from Integrated
DNA Technologies (Coralville, IA) and were HPLC purified by the manufacturer. Fisher’s
Finest glass microscope slides (25 mm × 75 mm) and coverslips (22 mm × 22 mm) were
obtained from Fisher Scientific (Ottawa, ON, Canada). Su-8 5 photoresist was obtained from
MicroChem (Newton, MA). A PDMS Sylgard 184 silicone elastomer kit was from Ellsworth
Adhesives (Stoney Creek, ON, Canada).
A4.1.2 Instrumentation
On-chip PL measurements were acquired using an in house, custom-built epifluorescence
microscope that was based on a Nikon Eclipse L150 platform (Nikon, Mississauga, ON,
175
Canada). The microscope contained a 406 nm diode laser (Radius 405, 25 mW, Coherent Inc.,
Santa Clara, CA) and a motorized xyz translation stage. The intensity of the laser light was
modulated using optical density filters. A filter cube comprised of a 405/20 nm excitation filter
and Z405 rdc dichroic mirror (Chroma Technology Corp., Bellows Falls, VT) was used to direct
the light to a 40x Nikon ELWD Plan Fluor Objective lens (NA: 0.60). PL emission was collected
through the same lens and measured using a diode array spectrophotometer and SpectraSuite
software (QE6500, Ocean Optics Inc., Dunedin, FL) via a fiber optic waveguide. Images of
microfluidic chips were acquired using a photomultiplier tube and by raster scanning over the
sample. Point-by-point reconstruction enabled image processing using ImageJ software (National
Institutes of Health, Bethesda, MD). PL intensities from the rQD and A647 were isolated using
D620/20 and 680/30 bandpass filters (Chroma Technology Corp.), respectively.
Electrokinetic control in microfluidic chips was facilitated by use of a High Voltage Sequencer
HVS448 3000V (Labsmith, Livermore, CA). Platinum wire electrodes were soldered onto high
voltage silicone coated wire for delivery of the required voltages on-chip.
Scanning electron microscopy (SEM) images of in-channel immobilized QDs were obtained at
the Centre for Nanostructure Imaging (Toronto, ON, Canada) using a FEI Quanta FEG 250
Environmental SEM/STEM.
A4.1.3 Microfluidic Chip Assembly
A4.1.3.1 Cleaning of Glass Coverslips using RCA Protocol
The microfluidic chips were hybrid PDMS-glass structures; glass coverslips were modified with
interfacial chemistry in batches of 32 and fixed with PDMS prior to assay assembly. Coverslips
were processed using the RCA protocol to expose surface silanol groups by means of sequential
treatment with base and acid in oxidizing conditions. Substrates were immersed in a 5:1:1 v/v of
deionized water, 30% ammonium hydroxide, and 30% hydrogen peroxide for 10 min at 85-90
°C. Glass coverslips were then washed twice thoroughly with deionized water before immersion
in the acidic wash of 5:1:1 v/v deionized water, 16 M hydrochloric acid, and 30% hydrogen
peroxide for 10 min at 85-90 °C. Coverslips were then washed again twice with deionized water,
176
and then were sonicated in methanol twice for 10 min each time. This was followed by rinsing
two times with dichloromethane and diethyl ether. The processed coverslips were stored in a
vacuum oven at 60 °C.
A4.1.3.2 Silanization of Cleaned Coverslips
Etched slides were immersed in ca. 300 mL of anhydrous toluene, 0.5 mL of DIPEA, and 7.5 mL
of APTMS and then the mixture was refluxed for 6 hrs under argon on an orbital shaker. After
the allotted time, the solution was decanted, rinsed twice with methanol and then sonicated in
methanol two times for 10 min each time. Coverslips were then rinsed twice with
dichloromethane and diethylether and stored in a dessicator.
A4.1.3.3 Biotinylation of APTMS Modified Coverslips
In earlier work, APTMS modified coverslips were amide coupled to biotin by in situ activation
of the carboxylic acid group using carbodiimide/NHS activation. This procedure was modified
due to the poor solubility of biotin in DMF and the reduced yield (ca. 50-60%) of the
carbodiimide activation at room temperature. In this new protocol, biotin NHS ester was
synthesized in a separate step,218 purified and then reacted with the APTMS coated coverslips.
The process began by combining 2.5 g (10 mmol) of biotin and 1.5 g (13 mmol) of NHS with 75
mL of anhydrous DMF in a 250 mL Schlenk flask. The mixture was stirred and heated to 70 °C
under argon until complete dissolution was achieved. DIPEA (1 mL) was added to the solution
followed by the dropwise addition of 1.9 mL (12 mmol) of DIC. An air condenser was installed
and the temperature of the solution was maintained at 70 °C for ca. 2 hrs. The reaction mixture
was removed from heat, allowed to cool to room temperature and the solvent was removed under
reduced pressure. The crude off white precipitate was recrystallized from isopropanol and the
resultant white powder was collected via vacuum filtration, washed with three successive portion
of cold isopropanol and then stored in a dessicator. NMR 1H (400 MHz, DMSO-d6) δ: 1.37-1.64
(m; 6H), 2.54-2.57 (d; 1H), 2.63-2.67 (t; 2H), 2.79-2.87 (m; 5H), 3.07-3.10 (m; 1H), 4.11-4.14
(m; 1H), 4.27-4.30 (m; 1H), 6.34 (s; 1H), 6.39 (s; 1H) ppm.
177
APTMS modified coverslips were added to a 500 mL beaker along with ca. 250-300 mL of
anhydrous DMF and 0.4 g (1.2 mmol) of Biotin-NHS. A watch glass was placed on top, sealed
with Parafilm® and the mixture was placed on an orbital shaker for 24 hrs. The substrates were
then washed twice with DMF, sonicated twice for 10 min each time in isopropanol, washed
twice with dichloromethane and diethylether and then stored in a dessicator.
A4.1.3.4 Fabrication of PDMS Microfluidic Chips
PDMS elastomer and curing agent were mixed 10:1 w/w, respectively, by vigorous stirring. The
mixture was then degassed for ca. 1 hr. PDMS chips were made by pouring ca. 3.2 g onto a
positive relief template followed by curing in an oven at 110 °C for 30 min. Microfluidic master
templates were manufactured in a clean room facility using Su-8 5 photoresist as previously
reported.146 The channel dimensions measured 12 mm in length, 250 μm in width and 12 μm in
height. Cured PDMS chips were cut to 20 mm × 20 mm and reagent wells were manually bored.
PDMS chips were sealed irreversibly to modified coverslips, with the glass first being treated by
air plasma oxidation for 2 min at 10.5 W using a Harrick Plasma Cleaner (Harrick Plasma,
Ithaca, NY).
A4.2. Data Analysis A4.2.1 Steady State and Time-Resolved Fluorescence Measurements
For quantitative comparison, all acquired PL spectra were first background subtracted,
normalized and then a FRET ratio R was assigned as shown in Eqn. A4.1.
𝑅 = �∑ 𝑃𝐿(𝜆)660𝜆=690
∑ 𝑃𝐿(𝜆)620𝜆=590
�𝐷𝐴
− �∑ 𝑃𝐿(𝜆)660𝜆=690
∑ 𝑃𝐿(𝜆)620𝜆=590
�𝐷
(A4.1)
The wavelength range of significant PL for the rQD was set from 590 nm to 620 nm while for
A647, 660 nm to 690 nm was chosen. The subscripts DA and D in Eqn. A4.1 denote
measurements made in the presence and absence of acceptor, respectively. Acquisition of PL
spectra from the microchannels was conducted by interrogating three points along the length of a
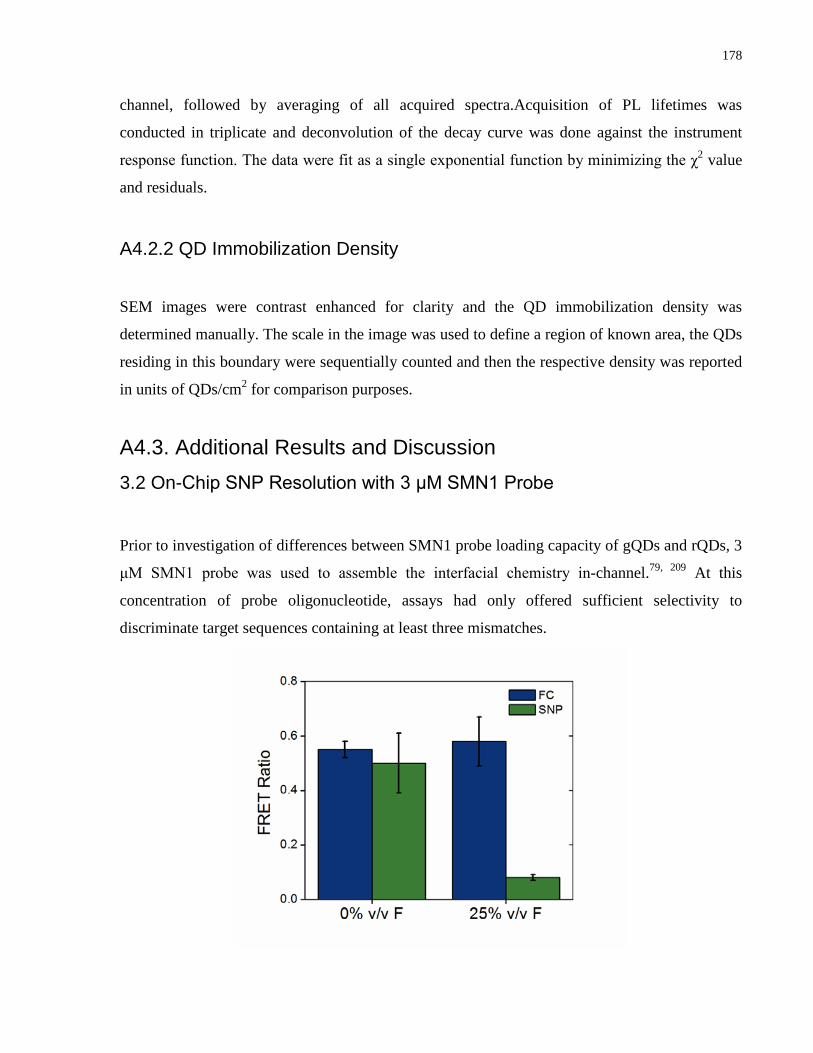
178
channel, followed by averaging of all acquired spectra.Acquisition of PL lifetimes was
conducted in triplicate and deconvolution of the decay curve was done against the instrument
response function. The data were fit as a single exponential function by minimizing the χ2 value
and residuals.
A4.2.2 QD Immobilization Density
SEM images were contrast enhanced for clarity and the QD immobilization density was
determined manually. The scale in the image was used to define a region of known area, the QDs
residing in this boundary were sequentially counted and then the respective density was reported
in units of QDs/cm2 for comparison purposes.
A4.3. Additional Results and Discussion 3.2 On-Chip SNP Resolution with 3 μM SMN1 Probe
Prior to investigation of differences between SMN1 probe loading capacity of gQDs and rQDs, 3
μM SMN1 probe was used to assemble the interfacial chemistry in-channel.79, 209 At this
concentration of probe oligonucleotide, assays had only offered sufficient selectivity to
discriminate target sequences containing at least three mismatches.
179
Figure A4.1. Response of the on-chip assay to FC (blue) and SNP (green) targets in BB with 0% and 25 % v/v formamide for a concentration of the SMN1 probe oligonucleotide delivered in channel of 3 μM. SNP resolution was not observed until the addition of 25% v/v formamide in BB, where a contrast ratio of 7:1 was achieved.
Moreover, previous in-channel assay selectivity has been investigated using only the gQD-Cy3
system and not the rQD-A647 FRET pair. To further illustrate the impact of QD size and the
resulting oligonucleotide probe density on assay selectivity, resolution of a SNP was attempted
with the rQD-A647 FRET pair using the aforementioned SMN1 probe concentration of 3 μM.
The response of the on-chip assay to FC and 1BPM TGTs is shown in Figure A4.1. In the
absence of formamide, resolution of a SNP is not possible where the FRET ratios for FC and the
1BPM TGTs were 0.55 ± 0.03 and 0.50 ± 0.11, respectively. To offer any selectivity against a
SNP, 25% v/v formamide was required, which left the signal of the FC TGT unchanged at 0.58 ±
0.09 while the response to the 1BPM TGT decreased to 0.09 ± 0.01 and gave rise to a contrast
ratio of 7 for FC:SNP targets. These results are in contrast to what was seen when 10 μM SMN1
was delivered in-channel, where discrimination against a SNP was possible without any added
formamide. These data illustrate the impact of oligonucleotide probe density on the stringency of
hybridization, which in turn is determined by the size of the nanocrystal for the QDs used herein.

180
Copyright Acknowledgements
Indications of Copyright permissions can be found in each figure caption for the specific
illustration shown. Sections of this thesis in particular those of the body have been published
prior to formatting of this thesis, the relevant Copyright acknowledgements are listed below.
Copyright 2012 American Chemical Society.
Copyright 2013 Elsevier.
Copyright 2014 Royal Society of Chemistry
181
References
(1) Kneipp, K.; Wang, Y.; Kneipp, H.; Perelman, L. T.; Itzkan, I.; Dasari, R.; Feld, M. S., Phys. Rev. Lett. 1997, 78, 1667-1670.
(2) Weiss, S., Science 1999, 283, 1676-1683.
(3) Anger, P.; Bharadwaj, P.; Novotny, L., Phys. Rev. Lett. 2006, 96.
(4) Willets, K. A.; Van Duyne, R. P., Localized surface plasmon resonance spectroscopy and sensing. In Annu. Rev. Phys. Chem., 2007; Vol. 58, pp 267-297.
(5) Anker, J. N.; Hall, W. P.; Lyandres, O.; Shah, N. C.; Zhao, J.; Van Duyne, R. P., Nat. Mater. 2008, 7, 442-453.
(6) Elghanian, R.; Storhoff, J. J.; Mucic, R. C.; Letsinger, R. L.; Mirkin, C. A., Science 1997, 277, 1078-1081.
(7) Watson, J. D.; Crick, F. H. C., Nature 1953, 171, 737-738.
(8) Griffiths, A. J. F.; Wessler, S. R.; Lewontin, R. C.; Gelbart, W. M.; Suzuki, D. T.; Miller, J. H., Introduction to Genetic Analysis. 7th ed.; W. H. Freeman and Company: New York, 2005.
(9) Adams, R. L. P.; Knowler, J. T.; Leader, D. P., The Biochemistry of the Nucleic Acids. 11th ed.; Chapman & Hall Ltd: New York, 1992.
(10) Wilusz, C. J.; Wormington, M.; Peltz, S. W., Nat. Rev. Mol. Cell Biol. 2001, 2, 237-246.
(11) Gilli, G.; Bellucci, F.; Ferretti, V.; Bertolasi, V., J. Am. Chem. Soc. 1989, 111, 1023-1028.
(12) Coll, M.; Frederick, C. A.; Wang, A. H. J.; Rich, A., Proc. Natl. Acad. Sci. U. S. A. 1987, 84, 8385-8389.
(13) Wetmur, J. G., Crit. Rev. Biochem. Mol. Biol. 1991, 26, 227-259.
(14) SantaLucia, J., Proc. Natl. Acad. Sci. U. S. A. 1998, 95, 1460-1465.
(15) Tinoco, I., J. Phys. Chem. 1996, 100, 13311-13322.
(16) Zuker, M., Nucleic Acids Res. 2003, 31, 3406-3415.
(17) Allawi, H. T.; SantaLucia, J., Biochemistry 1997, 36, 10581-10594.
(18) Allawi, H. T.; SantaLucia, J., Biochemistry 1998, 37, 9435-9444.
(19) Allawi, H. T.; Santalucia, J., Nucleic Acids Res. 1998, 26, 2694-2701.

182
(20) Allawi, H. T.; SantaLucia, J., Biochemistry 1998, 37, 2170-2179.
(21) Peyret, N.; Seneviratne, P. A.; Allawi, H. T.; SantaLucia, J., Biochemistry 1999, 38, 3468-3477.
(22) Lefebvre, S.; Burglen, L.; Reboullet, S.; Clermont, O.; Burlet, P.; Viollet, L.; Benichou, B.; Cruaud, C.; Millasseau, P.; Zeviani, M.; Lepaslier, D.; Frezal, J.; Cohen, D.; Weissenbach, J.; Munnich, A.; Melki, J., Cell 1995, 80, 155-165.
(23) Lorson, C. L.; Hahnen, E.; Androphy, E. J.; Wirth, B., Proc. Natl. Acad. Sci. U.S.A. 1999, 96, 6307-6311.
(24) Kerem, E.; Corey, M.; Kerem, B. S.; Rommens, J.; Markiewicz, D.; Levison, H.; Tsui, L. C.; Durie, P., N. Engl. J. Med. 1990, 323, 1517-1522.
(25) Blake, R. D.; Delcourt, S. G., Nucleic Acids Res. 1996, 24, 2095-2103.
(26) Lackowicz, J. R., Principles of Fluorescence Spectroscopy. 3rd ed.; Springer Science+Business Media, LLC: New York, 2006.
(27) Skoog, D. A.; Holler, F. J.; Nieman, T. A., Principles of Instrumental Analysis. 5th ed.; Thomson Learning, Inc.: Toronto, 1998.
(28) Skoog, D. A.; West, D. M.; Holler, F. J.; Crouch, S. R., Fundamentals of Analytical Chemistry. 8th ed.; Brooks/Cole: Belmont, 2004.
(29) Engel, T., Quantum Chemistry and Spectroscopy. Pearson Education, Inc.: San Francisco, 2006.
(30) Jares-Erijman, E. A.; Jovin, T. M., Nat. Biotechnol. 2003, 21, 1387-1395.
(31) Algar, W. R.; Tavares, A. J.; Krull, U. J., Anal. Chim. Acta 2010, 673, 1-25.
(32) Alivisatos, A. P., ACS Nano 2008, 2, 1514-1516.
(33) Bruchez, M.; Moronne, M.; Gin, P.; Weiss, S.; Alivisatos, A. P., Science 1998, 281, 2013-2016.
(34) Klein, D. L.; Roth, R.; Lim, A. K. L.; Alivisatos, A. P.; McEuen, P. L., Nature 1997, 389, 699-701.
(35) Greenham, N. C.; Peng, X. G.; Alivisatos, A. P., Phys. Rev. B 1996, 54, 17628-17637.
(36) Alivisatos, A. P.; Gu, W. W.; Larabell, C., Quantum dots as cellular probes. In Annu. Rev. Biomed. Eng., 2005; Vol. 7, pp 55-76.
(37) Dabbousi, B. O.; RodriguezViejo, J.; Mikulec, F. V.; Heine, J. R.; Mattoussi, H.; Ober, R.; Jensen, K. F.; Bawendi, M. G., J. Phys. Chem. B 1997, 101, 9463-9475.
(38) Murray, C. B.; Norris, D. J.; Bawendi, M. G., J. Am. Chem. Soc. 1993, 115, 8706-8715.
183
(39) Alivisatos, A. P., J. Phys. Chem. 1996, 100, 13226-13239.
(40) Manna, L.; Scher, E. C.; Alivisatos, A. P., J. Am. Chem. Soc. 2000, 122, 12700-12706.
(41) Peng, X. G.; Manna, L.; Yang, W. D.; Wickham, J.; Scher, E.; Kadavanich, A.; Alivisatos, A. P., Nature 2000, 404, 59-61.
(42) Hines, M. A.; Guyot-Sionnest, P., J. Phys. Chem. 1996, 100, 468-471.
(43) Peng, X. G.; Schlamp, M. C.; Kadavanich, A. V.; Alivisatos, A. P., J. Am. Chem. Soc. 1997, 119, 7019-7029.
(44) Bailey, R. E.; Nie, S. M., J. Am. Chem. Soc. 2003, 125, 7100-7106.
(45) Park, J. H.; Gu, L.; von Maltzahn, G.; Ruoslahti, E.; Bhatia, S. N.; Sailor, M. J., Nat. Mater. 2009, 8, 331-336.
(46) Sun, Y. P.; Zhou, B.; Lin, Y.; Wang, W.; Fernando, K. A. S.; Pathak, P.; Meziani, M. J.; Harruff, B. A.; Wang, X.; Wang, H. F.; Luo, P. J. G.; Yang, H.; Kose, M. E.; Chen, B. L.; Veca, L. M.; Xie, S. Y., J. Am. Chem. Soc. 2006, 128, 7756-7757.
(47) Alivisatos, A. P., Science 1996, 271, 933-937.
(48) Wilson, W. L.; Szajowski, P. F.; Brus, L. E., Science 1993, 262, 1242-1244.
(49) Peng, X. G.; Wickham, J.; Alivisatos, A. P., J. Am. Chem. Soc. 1998, 120, 5343-5344.
(50) Peng, Z. A.; Peng, X. G., J. Am. Chem. Soc. 2001, 123, 183-184.
(51) Qu, L. H.; Peng, Z. A.; Peng, X. G., Nano Lett. 2001, 1, 333-337.
(52) Kim, S. W.; Zimmer, J. P.; Ohnishi, S.; Tracy, J. B.; Frangioni, J. V.; Bawendi, M. G., J. Am. Chem. Soc. 2005, 127, 10526-10532.
(53) Yu, W. W.; Qu, L. H.; Guo, W. Z.; Peng, X. G., Chem. Mater. 2003, 15, 2854-2860.
(54) Atkins, P.; de Paula, J., Atkins' Physical Chemistry. 8th ed.; W. H. Freeman and Company: New York, 2006.
(55) Nirmal, M.; Brus, L., Acc. Chem. Res. 1999, 32, 407-414.
(56) Bawendi, M. G.; Steigerwald, M. L.; Brus, L. E., Annu. Rev. Phys. Chem. 1990, 41, 477-496.
(57) Efros, A. L.; Rosen, M.; Kuno, M.; Nirmal, M.; Norris, D. J.; Bawendi, M., Phys. Rev. B 1996, 54, 4843-4856.
(58) Norris, D. J.; Bawendi, M. G., Phys. Rev. B 1996, 53, 16338-16346.
184
(59) Chan, W. C. W.; Maxwell, D. J.; Gao, X. H.; Bailey, R. E.; Han, M. Y.; Nie, S. M., Curr. Opin. Biotechnol. 2002, 13, 40-46.
(60) Kuno, M.; Lee, J. K.; Dabbousi, B. O.; Mikulec, F. V.; Bawendi, M. G., J. Chem. Phys. 1997, 106, 9869-9882.
(61) Kim, S.; Fisher, B.; Eisler, H. J.; Bawendi, M., J. Am. Chem. Soc. 2003, 125, 11466-11467.
(62) Kim, S.; Lim, Y. T.; Soltesz, E. G.; De Grand, A. M.; Lee, J.; Nakayama, A.; Parker, J. A.; Mihaljevic, T.; Laurence, R. G.; Dor, D. M.; Cohn, L. H.; Bawendi, M. G.; Frangioni, J. V., Nat. Biotechnol. 2004, 22, 93-97.
(63) Chan, W. C. W.; Nie, S. M., Science 1998, 281, 2016-2018.
(64) Pellegrino, T.; Manna, L.; Kudera, S.; Liedl, T.; Koktysh, D.; Rogach, A. L.; Keller, S.; Radler, J.; Natile, G.; Parak, W. J., Nano Lett. 2004, 4, 703-707.
(65) Gao, X. H.; Cui, Y. Y.; Levenson, R. M.; Chung, L. W. K.; Nie, S. M., Nat. Biotechnol. 2004, 22, 969-976.
(66) Susumu, K.; Uyeda, H. T.; Medintz, I. L.; Pons, T.; Delehanty, J. B.; Mattoussi, H., J. Am. Chem. Soc. 2007, 129, 13987-13996.
(67) Uyeda, H. T.; Medintz, I. L.; Jaiswal, J. K.; Simon, S. M.; Mattoussi, H., J. Am. Chem. Soc. 2005, 127, 3870-3878.
(68) Medintz, I. L.; Uyeda, H. T.; Goldman, E. R.; Mattoussi, H., Nat. Mater. 2005, 4, 435-446.
(69) Susumu, K.; Oh, E.; Delehanty, J. B.; Blanco-Canosa, J. B.; Johnson, B. J.; Jain, V.; Hervey, W. J.; Algar, W. R.; Boeneman, K.; Dawson, P. E.; Medintz, I. L., J. Am. Chem. Soc. 2011, 133, 9480-9496.
(70) Zhan, N. Q.; Palui, G.; Safi, M.; Ji, X.; Mattoussi, H., J. Am. Chem. Soc. 2013, 135, 13786-13795.
(71) Johnson, I.; Spence, M. T. Z., The Molecular Probes Handbook: A Guide to Fluorescent Probes and Labeling Technologies. 11th ed.; Life Technologies Corporation: USA, 2010.
(72) Derfus, A. M.; Chan, W. C. W.; Bhatia, S. N., Nano Lett. 2004, 4, 11-18.
(73) Blanco-Canosa, J. B.; Wu, M.; Susumu, K.; Petryayeva, E.; Jennings, T. L.; Dawson, P. E.; Algar, W. R.; Medintz, I. L., Coord. Chem. Rev. 2014, 263, 101-137.
(74) Algar, W. R.; Prasuhn, D. E.; Stewart, M. H.; Jennings, T. L.; Blanco-Canosa, J. B.; Dawson, P. E.; Medintz, I. L., Bioconjugate Chem. 2011, 22, 825-858.
(75) Jennings, T. L.; Becker-Catania, S. G.; Triulzi, R. C.; Tao, G. L.; Scott, B.; Sapsford, K. E.; Spindel, S.; Oh, E.; Jain, V.; Delehanty, J. B.; Prasuhn, D. E.; Boeneman, K.; Algar, W. R.; Medintz, I. L., ACS Nano 2011, 5, 5579-5593.
185
(76) Medintz, I. L.; Mattoussi, H., Phys. Chem. Chem. Phys. 2009, 11, 17-45.
(77) Wagner, M. K.; Li, F.; Li, J. J.; Li, X. F.; Le, X. C., Anal. Bioanal. Chem. 2010, 397, 3213-3224.
(78) Algar, W. R.; Wegner, D.; Huston, A. L.; Blanco-Canosa, J. B.; Stewart, M. H.; Armstrong, A.; Dawson, P. E.; Hildebrandt, N.; Medintz, I. L., J. Am. Chem. Soc. 2012, 134, 1876-1891.
(79) Tavares, A. J.; Noor, M. O.; Vannoy, C. H.; Algar, W. R.; Krull, U. J., Anal. Chem. 2011, 84, 312-319.
(80) Algar, W. R. Toward Multiplexed Nucleic Acid Assays and Biosensors Using Immobilzed Quantum Dots as Donors in Fluorescence Resonance Energy Transfer. University of Toronto, Toronto, 2010.
(81) Petryayeva, E.; Algar, W. R.; Krull, U. J., Langmuir 2013, 29, 977-987.
(82) Freeman R.; Bahshi L.; Finder T.; Gill R.; Willner I., Chem. Commun. 2009, 764-766.
(83) Chen, Z.; Li, G.; Zhang, L.; Jiang, J. F.; Li, Z.; Peng, Z. H.; Deng, L., Anal. Bioanal. Chem. 2008, 392, 1185-1188.
(84) Medintz, I. L.; Clapp, A. R.; Melinger, J. S.; Deschamps, J. R.; Mattoussi, H., Adv. Mater. (Weinheim, Ger.) 2005, 17, 2450-2455.
(85) Zhang, C. Y.; Johnson, L. W., Anal. Chem. 2009, 81, 3051-3055.
(86) Freeman, R.; Li, Y.; Tel-Vered, R.; Sharon, E.; Elbaz, J.; Willner, I., Analyst 2009, 134, 653-656.
(87) Boeneman, K.; Mei, B. C.; Dennis, A. M.; Bao, G.; Deschamps, J. R.; Mattoussi, H.; Medintz, I. L., J. Am. Chem. Soc. 2009, 131, 3828-3829.
(88) Lowe, S. B.; Dick, J. A. G.; Cohen, B. E.; Stevens, M. M., ACS Nano 2011, 6, 851-857.
(89) Algar, W. R.; Ancona, M. G.; Malanoski, A. P.; Susumu, K.; Medintz, I. L., ACS Nano 2012, 6, 11044-11058.
(90) Algar, W. R.; Malanoski, A. P.; Susumu, K.; Stewart, M. H.; Hildebrandt, N.; Medintz, I. L., Anal. Chem. 2012, 84, 10136-10146.
(91) Freeman, R.; Willner, I., Chem. Soc. Rev. 2012, 41, 4067-4085.
(92) Blanco-Canosa, J. B.; Wu, M.; Susumu, K.; Petryayeva, E.; Jennings, T. L.; Dawson, P. E.; Algar, W. R.; Medintz, I. L., Coord. Chem. Rev. this issue.
(93) Zhang, C. Y.; Yeh, H. C.; Kuroki, M. T.; Wang, T. H., Nat. Mater. 2005, 4, 826-831.
(94) Zhang, C. Y.; Johnson, L. W., Angew. Chem.-Int. Edit. 2007, 46, 3482-3485.
186
(95) Zhang, C.-y.; Johnson, L. W., Anal. Chem. 2006, 78, 5532-5537.
(96) Zhang, Y.; Zhang, C.-y., Anal. Chem. 2012, 84, 224-231.
(97) Zhang, C.-y.; Hu, J., Anal. Chem. 2010, 82, 1921-1927.
(98) Algar, W. R.; Krull, U. J., Anal. Chim. Acta 2007, 581, 193-201.
(99) Vannoy, C. H.; Chong, L.; Le, C.; Krull, U. J., Anal. Chim. Acta 2013, 759, 92-99.
(100) Medintz, I. L.; Berti, L.; Pons, T.; Grimes, A. F.; English, D. S.; Alessandrini, A.; Facci, P.; Mattoussi, H., Nano Lett. 2007, 7, 1741-1748.
(101) Bailey, V. J.; Easwaran, H.; Zhang, Y.; Griffiths, E.; Belinsky, S. A.; Herman, J. G.; Baylin, S. B.; Carraway, H. E.; Wang, T.-H., Genome Res. 2009, 19, 1455-1461.
(102) Zhou, D.; Ying, L.; Hong, X.; Hall, E. A.; Abell, C.; Klenerman, D., Langmuir 2008, 24, 1659-1664.
(103) Feng, C. L.; Zhong, X. H.; Steinhart, M.; Caminade, A.-M.; Majoral, J. P.; Knoll, W., Small 2008, 4, 566-571.
(104) Jiang, G.; Susha, A. S.; Lutich, A. A.; Stefani, F. D.; Feldmann, J.; Rogach, A. L., ACS Nano 2009, 3, 4127-4131.
(105) Zhou, D. J.; Ying, L. M.; Hong, X.; Hall, E. A.; Abell, C.; Klenerman, D., Langmuir 2008, 24, 1659-1664.
(106) Olmsted, J.; Kearns, D. R., Biochemistry 1977, 16, 3647-3654.
(107) Zhang, H. Y.; Zhou, D. J., Chem. Commun. (Cambridge, U. K.) 2012, 48, 5097-5099.
(108) Tyagi, S.; Kramer, F. R., Nat. Biotechnol. 1996, 14, 303-308.
(109) Kim, J. H.; Morikis, D.; Ozkan, M., Sens. Actuator B-Chem. 2004, 102, 315-319.
(110) Cady, N. C.; Strickland, A. D.; Batt, C. A., Mol. Cell. Probes 2007, 21, 116-124.
(111) Kim, J. H.; Chaudhary, S.; Ozkan, M., Nanotechnology 2007, 18.
(112) Li, Y. Q.; Guan, L. Y.; Wang, J. H.; Zhang, H. L.; Chen, J.; Lin, S.; Chen, W.; Zhao, Y. D., Biosens. Bioelectron. 2011, 26, 2317-2322.
(113) Freeman, R.; Liu, X. Q.; Willner, I., J. Am. Chem. Soc. 2011, 133, 11597-11604.
(114) Wu, C. S.; Oo, M. K. K.; Cupps, J. M.; Fan, X. D., Biosens. Bioelectron. 2011, 26, 3870-3875.
(115) Yeh, H. Y.; Yates, M. V.; Mulchandania, A.; Chen, W., Chem. Commun. (Cambridge, U. K.) 2010, 46, 3914-3916.
187
(116) Wu, S. M.; Tian, Z. Q.; Zhang, Z. L.; Huang, B. H.; Jiang, P.; Xie, Z. X.; Pang, D. W., Biosens. Bioelectron. 2010, 26, 491-496.
(117) Liu, L. Z.; Li, H.; Qiu, T.; Zhou, G. H.; Wong, K. Y.; He, Z. K.; Liu, Z. H., Chem. Commun. (Cambridge, U. K.) 2011, 47, 2622-2624.
(118) Charbonniere, L. J.; Hildebrandt, N., Eur. J. Inorg. Chem. 2008, 3241-3251.
(119) Liu, X. Q.; Niazov-Elkan, A.; Wang, F. A.; Willner, I., Nano Lett. 2013, 13, 219-225.
(120) Golub, E.; Niazov, A.; Freeman, R.; Zatsepin, M.; Willner, I., J. Phys. Chem. C 2012, 116, 13827-13834.
(121) Cissell, K. A.; Campbell, S.; Deo, S. K., Anal. Bioanal. Chem. 2008, 391, 2577-2581.
(122) Kumar, M.; Zhang, D. H.; Broyles, D.; Deo, S. K., Biosens. Bioelectron. 2011, 30, 133-139.
(123) Whitesides, G. M., Nature 2006, 442, 368-373.
(124) Sanders, G. H. W.; Manz, A., Trends Anal. Chem. 2000, 19, 364-378.
(125) Teles, F. R. R.; Fonseca, L. R., Talanta 2008, 77, 606-623.
(126) Song, H.; Chen, D. L.; Ismagilov, R. F., Angew. Chem.-Int. Edit. 2006, 45, 7336-7356.
(127) Teh, S. Y.; Lin, R.; Hung, L. H.; Lee, A. P., Lab Chip 2008, 8, 198-220.
(128) Fair, R. B., Microfluid. Nanofluid. 2007, 3, 245-281.
(129) Abdelgawad, M.; Wheeler, A. R., Adv. Mater. (Weinheim, Ger.) 2009, 21, 920-925.
(130) Kurita, R.; Yokota, Y.; Sato, Y.; Mizutani, F.; Niwa, O., Anal. Chem. 2006, 78, 5525-5531.
(131) Springer, T.; Piliarik, M.; Homola, J., Sensors and Actuators B-Chemical 2010, 145, 588-591.
(132) Gao, Y. L.; Lam, A. W. Y.; Chan, W. C. W., ACS Appl. Mater. Interfaces 2013, 5, 2853-2860.
(133) Gao, Y.; Stanford, W. L.; Chan, W. C. W., Small 2011, 7, 137-146.
(134) Sun, S.; Ossandon, M.; Kostov, Y.; Rasooly, A., Lab Chip 2009, 9, 3275-3281.
(135) Islam, K.; Jha, S. K.; Chand, R.; Han, D.; Kim, Y. S., Microelectron. Eng. 2012, 97, 391-395.
(136) Lu, X. N.; Samuelson, D. R.; Xu, Y. H.; Zhang, H. W.; Wang, S.; Rasco, B. A.; Xu, J.; Konkel, M. E., Anal. Chem. 2013, 85, 2320-2327.

188
(137) Cao, L. L.; Cheng, L. W.; Zhang, Z. Y.; Wang, Y.; Zhang, X. X.; Chen, H.; Liu, B. H.; Zhang, S.; Kong, J. L., Lab Chip 2012, 12, 4864-4869.
(138) Triroj, N.; Jaroenapibal, P.; Shi, H.; Yeh, J. I.; Beresford, R., Biosensors and Bioelectronics 2011, 26, 2927-2933.
(139) Escobedo, C.; Chou, Y. W.; Rahman, M.; Duan, X. B.; Gordon, R.; Sinton, D.; Brolo, A. G.; Ferreira, J., Analyst 2013, 138, 1450-1458.
(140) Lam, B.; Fang, Z. C.; Sargent, E. H.; Kelley, S. O., Anal. Chem. 2012, 84, 21-25.
(141) Michalzik, M.; Wilke, R.; Büttgenbach, S., Sens. Actuators, B 2005, 111–112, 410-415.
(142) Ceyssens, F.; Witters, D.; Van Grimbergen, T.; Knez, K.; Lammertyn, J.; Puers, R., Sens. Actuators, B 2013, 181, 166-171.
(143) Hu, J.; Wang, S. Q.; Wang, L.; Li, F.; Pingguan-Murphy, B.; Lu, T. J.; Xu, F., Biosens. Bioelectron. 2014, 54, 585-597.
(144) Lei, K. F., Jala 2012, 17, 330-347.
(145) Kumar, S.; Ali, M. A.; Anand, P.; Agrawal, V. V.; John, R.; Maji, S.; Malhotra, B. D., Biotechnol. J. 2013, 8, 1267-1279.
(146) Whitesides, G. M., Nature 2006, 442, 368-373.
(147) McDonald, J. C.; Duffy, D. C.; Anderson, J. R.; Chiu, D. T.; Wu, H.; Schueller, O. J. A.; Whitesides, G. M., Electrophoresis 2000, 21, 27-40.
(148) Xia, Y.; Whitesides, G. M., Annu. Rev. Mater. Sci. 1998, 28, 153-184.
(149) McDonald, J. C.; Whitesides, G. M., Acc. Chem. Res. 2002, 35, 491-499.
(150) Lewis, L. N.; Lewis, N., J. Am. Chem. Soc. 1986, 108, 7228-7231.
(151) Marko, I. E.; Sterin, S.; Buisine, O.; Mignani, G.; Branlard, P.; Tinant, B.; Declercq, J.-P., Science 2002, 298, 204-206.
(152) Shallan, A. I.; Smejkal, P.; Corban, M.; Guijt, R. M.; Breadmore, M. C., Anal. Chem. 2014, 86, 3124-3130.
(153) Kitson, P. J.; Rosnes, M. H.; Sans, V.; Dragone, V.; Cronin, L., Lab Chip 2012, 12, 3267-3271.
(154) Dutta, D.; Ramachandran, A.; Leighton, D. T., Microfluid. Nanofluid. 2006, 2, 275-290.
(155) Squires, T. M.; Quake, S. R., Rev. Mod. Phys. 2005, 77, 977-1026.
(156) Di Carlo, D., Lab Chip 2009, 9, 3038-3046.
189
(157) Stone, H. A.; Stroock, A. D.; Ajdari, A., Annual Review of Fluid Mechanics 2004, 36, 381-411.
(158) Kirby, B. J.; Hasselbrink, E. F., Electrophoresis 2004, 25, 187-202.
(159) Sze, A.; Erickson, D.; Ren, L. Q.; Li, D. Q., J. Colloid Interface Sci. 2003, 261, 402-410.
(160) Cheng, Y. F.; Dovichi, N. J., Science 1988, 242, 562-564.
(161) Chien, R. L.; Burgi, D. S., Anal. Chem. 1992, 64, 1046-1050.
(162) Makamba, H.; Kim, J. H.; Lim, K.; Park, N.; Hahn, J. H., Electrophoresis 2003, 24, 3607-3619.
(163) Efimenko, K.; Wallace, W. E.; Genzer, J., J. Colloid Interface Sci. 2002, 254, 306-315.
(164) Liu, Y.; Fanguy, J. C.; Bledsoe, J. M.; Henry, C. S., Anal. Chem. 2000, 72, 5939-5944.
(165) Kaneta, T.; Ueda, T.; Hata, K.; Imasaka, T., J. Chromatogr. A 2006, 1106, 52-55.
(166) Erickson, D.; Liu, X. Z.; Krull, U.; Li, D. Q., Anal. Chem. 2004, 76, 7269-7277.
(167) Erickson, D.; Liu, X. Z.; Venditti, R.; Li, D. Q.; Krull, U. J., Anal. Chem. 2005, 77, 4000-4007.
(168) Algar, W. R.; Krull, U. J., Anal. Chem. 2009, 81, 4113-4120.
(169) Algar, W. R.; Krull, U. J., Anal. Chim. Acta 2007, 581, 193-201.
(170) Algar, W. R.; Krull, U. J., Langmuir 2009, 25, 633-638.
(171) Algar, W. R.; Krull, U. J., Anal. Chem. 2010, 82, 400-405.
(172) Algar, W. R.; Krull, U. J., Sensors 2011, 11, 6214-6236.
(173) Algar, W. R.; Krull, U. J., Langmuir 2010, 26, 6041-6047.
(174) Algar, W. R.; Krull, U. J., Langmuir 2008, 24, 5514-5520.
(175) Massey, M.; Krull, U. J., Anal. Bioanal. Chem. 2010, 398, 1605-1614.
(176) Wheeler, A. R.; Trapp, G.; Trapp, O.; Zare, R. N., Electrophoresis 2004, 25, 1120-1124.
(177) Wu, Y.; Lopez, G. P.; Sklar, L. A.; Buranda, T., Anal. Biochem. 2007, 364, 193-203.
(178) Algar, W. R.; Krull, U. J., Langmuir 2006, 22, 11346-11352.
(179) Algar, W. R.; Krull, U. J., J. Colloid Interface Sci. 2011, 359, 148-154.

190
(180) Boeneman, K.; Deschamps, J. R.; Buckhout-White, S.; Prasuhn, D. E.; Blanco-Canosa, J. B.; Dawson, P. E.; Stewart, M. H.; Susumu, K.; Goldman, E. R.; Ancona, M.; Medintz, I. L., ACS Nano 2010, 4, 7253-7266.
(181) Noor, M. O.; Krull, U. J., Anal. Chim. Acta 2011, 708, 1-10.
(182) Zhang, C. Y.; Johnson, L. W., Angew. Chem. Int. Ed. 2007, 46, 3482-3485.
(183) Suzuki, M.; Husimi, Y.; Komatsu, H.; Suzuki, K.; Douglas, K. T., J. Am. Chem. Soc. 2008, 130, 5720-5725.
(184) Goldman, E. R.; Medintz, I. L.; Whitley, J. L.; Hayhurst, A.; Clapp, A. R.; Uyeda, H. T.; Deschamps, J. R.; Lassman, M. E.; Mattoussi, H., J. Am. Chem. Soc. 2005, 127, 6744-6751.
(185) Shi, L. F.; De Paoli, V.; Rosenzweig, N.; Rosenzweig, Z., J. Am. Chem. Soc. 2006, 128, 10378-10379.
(186) Oh, E.; Hong, M. Y.; Lee, D.; Nam, S. H.; Yoon, H. C.; Kim, H. S., J. Am. Chem. Soc. 2005, 127, 3270-3271.
(187) Erickson, D.; Li, D. Q.; Krull, U. J., Anal. Biochem. 2003, 317, 186-200.
(188) Medintz, I. L.; Clapp, A. R.; Brunel, F. M.; Tiefenbrunn, T.; Uyeda, H. T.; Chang, E. L.; Deschamps, J. R.; Dawson, P. E.; Mattoussi, H., Nat. Mater. 2006, 5, 581-589.
(189) Hu, M.; Yan, J.; He, Y.; Lu, H. T.; Weng, L. X.; Song, S. P.; Fan, C. H.; Wang, L. H., ACS Nano 2010, 4, 488-494.
(190) Jokerst, J. V.; Raamanathan, A.; Christodoulides, N.; Floriano, P. N.; Pollard, A. A.; Simmons, G. W.; Wong, J.; Gage, C.; Furmaga, W. B.; Redding, S. W.; McDevitt, J. T., Biosens. Bioelectron. 2009, 24, 3622-3629.
(191) Klostranec, J. M.; Xiang, Q.; Farcas, G. A.; Lee, J. A.; Rhee, A.; Lafferty, E. I.; Perrault, S. D.; Kain, K. C.; Chan, W. C. W., Nano Lett. 2007, 7, 2812-2818.
(192) Tavares, A. J.; Noor, M. O.; Vannoy, C. H.; Algar, W. R.; Krull, U. J., Anal. Chem. 2012, 84, 312-319.
(193) Duffy, D. C.; McDonald, J. C.; Schueller, O. J. A.; Whitesides, G. M., Anal. Chem. 1998, 70, 4974-4984.
(194) Erickson, D.; Sinton, D.; Li, D., Lab Chip 2003, 3, 141-149.
(195) Erickson, D.; Liu, X.; Krull, U. J.; Li, D., Anal. Chem. 2004, 76, 7269-7277.
(196) Noor, M. O.; Krull, U. J., Anal. Chim. Acta 2011, 708, 1-10.
(197) Kim, J. H. S.; Marafie, A.; Jia, X. Y.; Zoval, J. V.; Madou, M. J., Sensors and Actuators B-Chemical 2006, 113, 281-289.
191
(198) Clapp, A. R.; Medintz, I. L.; Mauro, J. M.; Fisher, B. R.; Bawendi, M. G.; Mattoussi, H., J. Am. Chem. Soc. 2004, 126, 301-310.
(199) Clapp, A. R.; Medintz, I. L.; Uyeda, H. T.; Fisher, B. R.; Goldman, E. R.; Bawendi, M. G.; Mattoussi, H., J. Am. Chem. Soc. 2005, 127, 18212-18221.
(200) Cesaro-Tadic, S.; Dernick, G.; Juncker, D.; Buurman, G.; Kropshofer, H.; Michel, B.; Fattinger, C.; Delamarche, E., Lab Chip 2004, 4, 563-569.
(201) Noor, M. O.; Shahmuradyan, A.; Krull, U. J., Anal. Chem. 2013, 85, 1860-1867.
(202) Gong, P.; Levicky, R., Proc. Natl. Acad. Sci. U. S. A. 2008, 105, 5301-5306.
(203) Watterson, J. H.; Piunno, P. A. E.; Wust, C. C.; Krull, U. J., Langmuir 2000, 16, 4984-4992.
(204) Sadhu, C.; Dutta, S.; Gopinathan, K. P., J. Biosci. 1984, 6, 817-821.
(205) Piunno, P. A. E.; Watterson, J.; Wust, C. C.; Krull, U. J., Anal. Chim. Acta 1999, 400, 73-89.
(206) Watterson, J.; Piunno, P. A. E.; Krull, U. J., Anal. Chim. Acta 2002, 469, 115-127.
(207) Watterson, J. H.; Raha, S.; Kotoris, C. C.; Wust, C. C.; Gharabaghi, F.; Jantzi, S. C.; Haynes, N. K.; Gendron, N. H.; Krull, U. J.; Mackenzie, A. E.; Piunno, P. A. E., Nucleic Acids Res. 2004, 32.
(208) Peterson, A. W.; Heaton, R. J.; Georgiadis, R. M., Nucleic Acids Res. 2001, 29, 5163-5168.
(209) Noor, M. O.; Tavares, A. J.; Krull, U. J., Anal. Chim. Acta 2013, 788, 148-157.
(210) Medintz, I. L.; Clapp, A. R.; Mattoussi, H.; Goldman, E. R.; Fisher, B.; Mauro, J. M., Nat. Mater. 2003, 2, 630-638.
(211) Swift, J. L.; Heuff, R.; Cramb, D. T., Biophys. J. 2006, 90, 1396-1410.
(212) Arnspang, E. C.; Brewer, J. R.; Lagerholm, B. C., PLoS One 2012, 7, e48521.
(213) Mittal, R.; Bruchez, M. P., Bioconjugate Chem. 2011, 22, 362-368.
(214) Jennings, T. L.; Rahman, K. S.; Fournier-Bidoz, S.; Chan, W. C. W., Anal. Chem. 2008, 90, 2849-2856.
(215) Pons, T.; Medintz, I. L.; Wang, X.; English, D. S.; Mattoussi, H., J. Am. Chem. Soc. 2006, 128, 15324-15331.
(216) Sivasankar, S.; Subramaniam, S.; Leckband, D., Proc. Natl. Acad. Sci. U. S. A. 1998, 95, 12961-12966.

192
(217) Park, S.; Sinha, N.; Hamad-Schifferli, K., Langmuir 2010, 26, 13071-13075.
(218) Tavares, A. J.; Noor, M. O.; Uddayasankar, U.; Krull, U. J.; Vannoy, C. H., Methods Mol. Bio., In press.
(219) Piruska, A.; Nikcevic, I.; Lee, S. H.; Ahn, C.; Heineman, W. R.; Limbach, P. A.; Seliskar, C. J., Lab Chip 2005, 5, 1348-1354.
(220) Noor, M. O.; Krull, U. J., Anal. Chem. 2013, 85, 7502-7511.
(221) Grabolle, M.; Spieles, M.; Lesnyak, V.; Gaponik, N.; Eychmuller, A.; Resch-Genger, U., Anal. Chem. 2009, 81, 6285-6294.
(222) Karstens, T.; Kobs, K., J. Phys. Chem. 1980, 84, 1871-1872.
(223) Magde, D.; Brannon, J. H.; Cremers, T. L.; Olmsted, J., J. Phys. Chem. 1979, 83, 696-699.
(224) Sens, R.; Drexhage, K. H., J. Lumin. 1981, 24-25, 709-712.