Embed Size (px)
Citation preview
Joseph H Kennedy 2, Craig Aurand 1, Robert Shirey1, David S Bell1, Justin M
Wiseman2, Brian Laughlin2, Brenda Sweeney3
1Supelco/Sigma Aldrich, Bellefonte, PA USA; 2Prosolia, Inc, Indianapolis, IN USA;
3AIT Laboratories, Indianapolis, IN USA
Solid Phase Micro Extraction (SPME) of Opiates from Urine: Coupling SPME and DESI-MS/MS Detection
T410166
2
Outline•Solid Phase Micro Extraction (SPME)
•Direct ElectroSpray Ionization (DESI)
•Proof of Concept Application – Analysis of Opiates in Urine using SPME/DESI
•In-vivo application of SPME
•Summary and challenge
3
Solid Phase Microextraction (SPME)
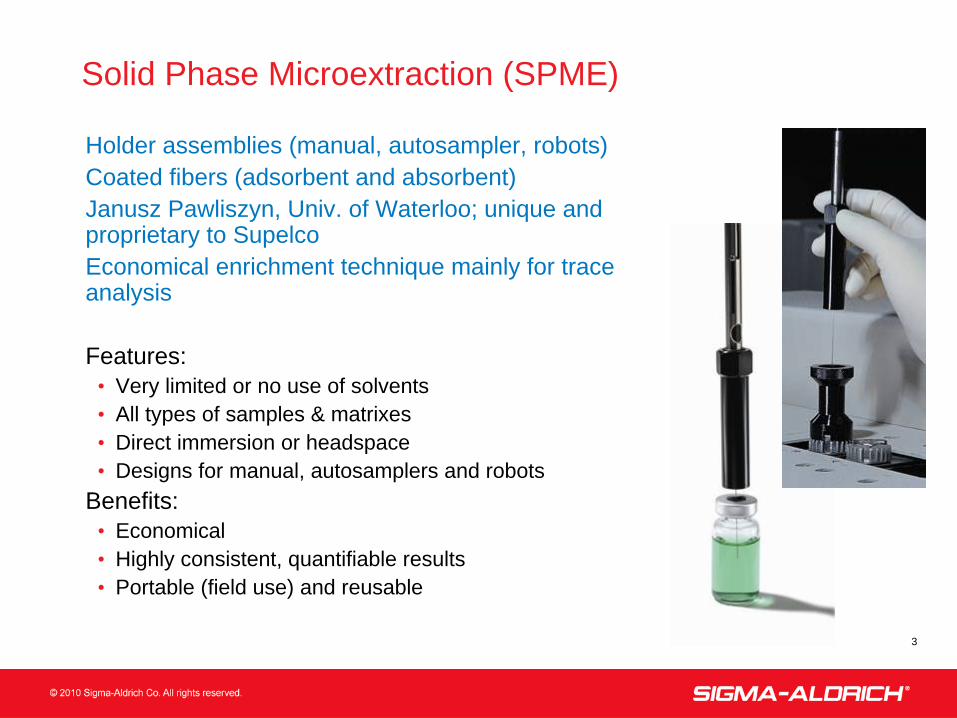
• Holder assemblies (manual, autosampler, robots)• Coated fibers (adsorbent and absorbent)• Janusz Pawliszyn, Univ. of Waterloo; unique and proprietary to Supelco
• Economical enrichment technique mainly for trace analysis
• Features:•
Very limited or no use of solvents•
All types of samples & matrixes•
Direct immersion or headspace•
Designs for manual, autosamplers and robots• Benefits:
•
Economical•
Highly consistent, quantifiable results•
Portable (field use) and reusable
4
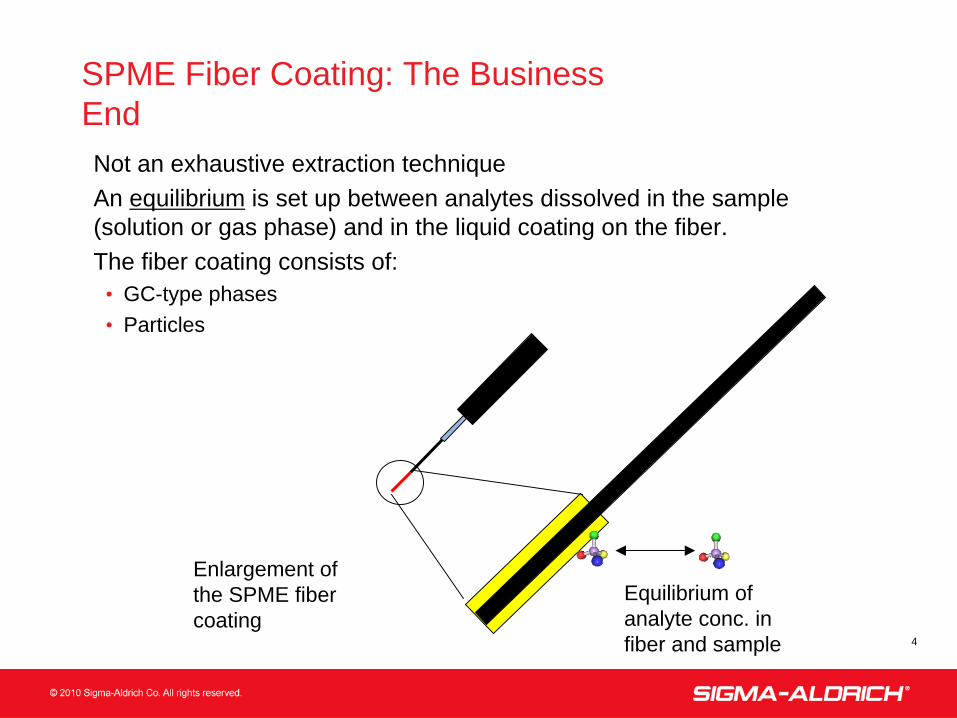
SPME Fiber Coating: The Business End• Not an exhaustive extraction technique• An equilibrium is set up between analytes dissolved in the sample (solution or gas phase) and in the liquid coating on the fiber.
• The fiber coating consists of:•
GC-type phases•
Particles
Enlargement of the SPME fiber coating
Equilibrium of analyte conc. in fiber and sample
5
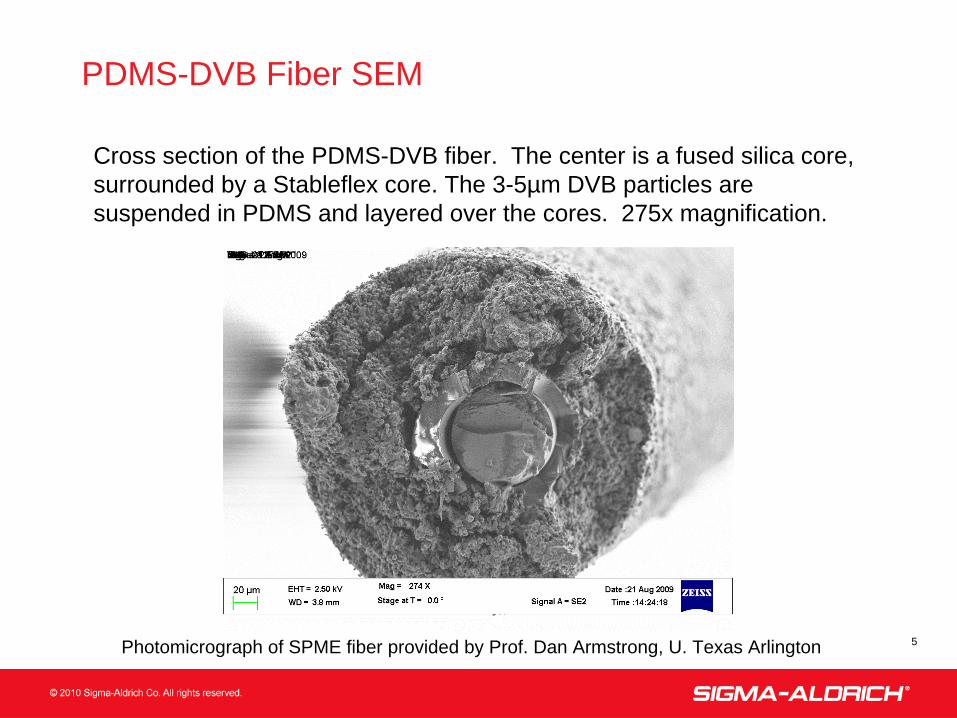
PDMS-DVB Fiber SEM
• Cross section of the PDMS-DVB fiber. The center is a fused silica core, surrounded by a Stableflex core. The 3-5µm DVB particles are suspended in PDMS and layered over the cores. 275x magnification.
Photomicrograph of SPME fiber provided by Prof. Dan Armstrong, U. Texas Arlington
6
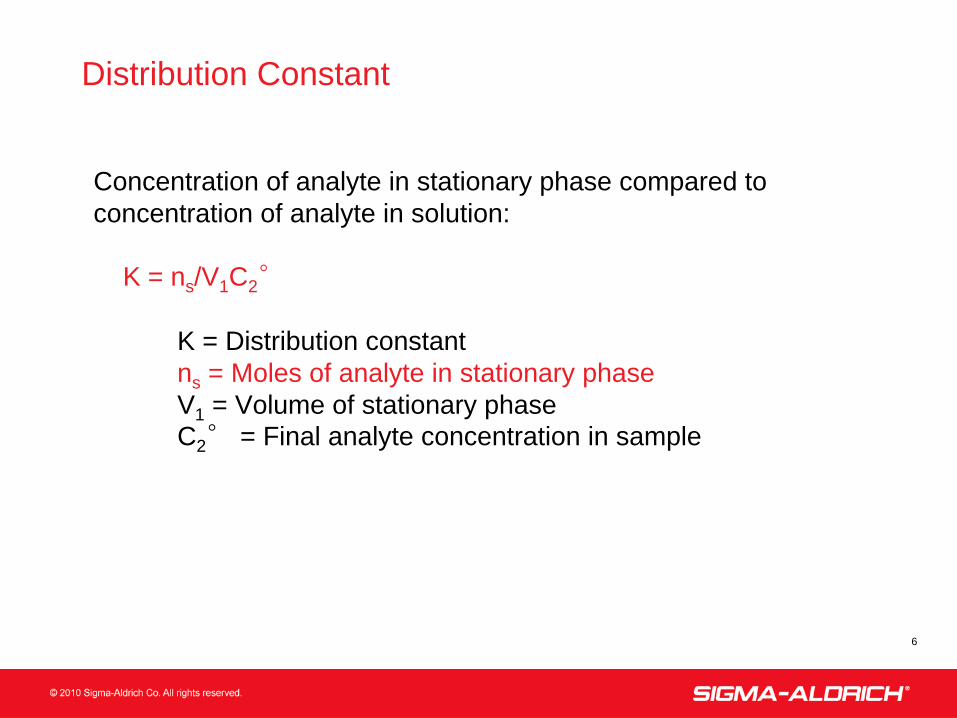
Distribution Constant
•Concentration of analyte in stationary phase compared to concentration of analyte in solution:
K = ns /V1 C2 °
K = Distribution constant ns = Moles of analyte in stationary phase V1 = Volume of stationary phase C2 ° = Final analyte concentration in sample
7
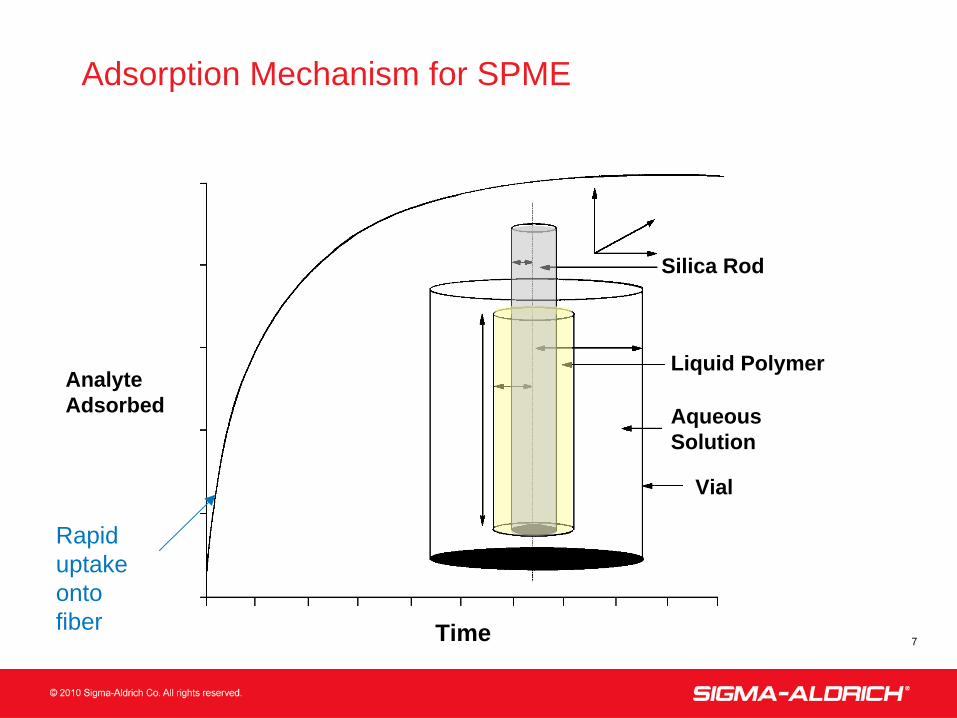
Analyte Adsorbed
Silica Rod
Liquid Polymer
Aqueous Solution
Vial
Time
Adsorption Mechanism for SPME
Rapid uptake onto fiber
8
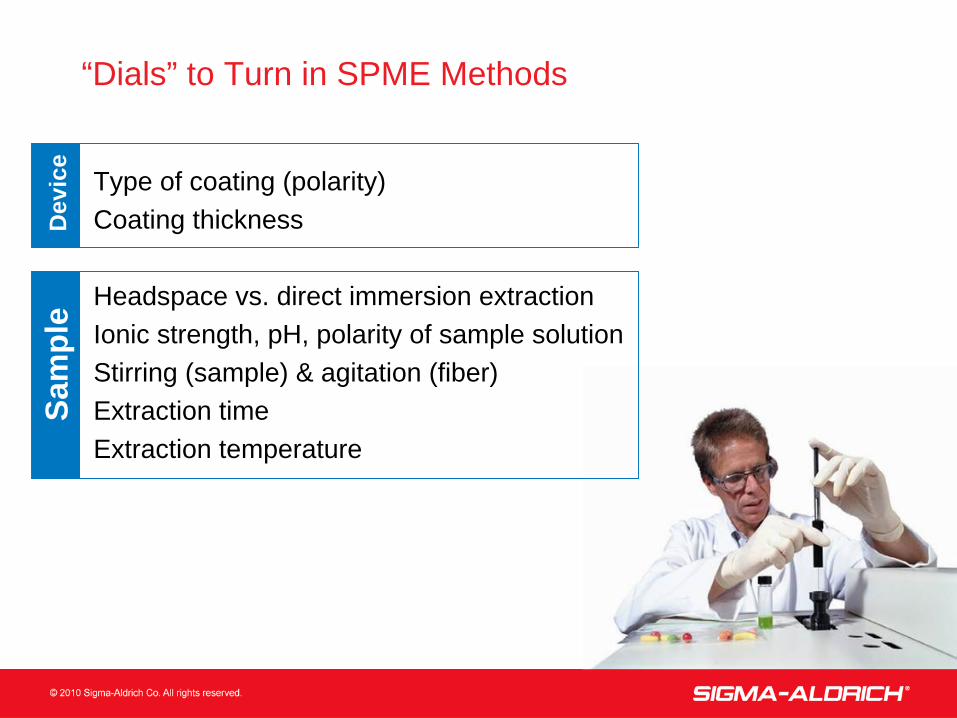
“Dials” to Turn in SPME Methods
•Type of coating (polarity)•Coating thickness
•Headspace vs. direct immersion extraction•Ionic strength, pH, polarity of sample solution•Stirring (sample) & agitation (fiber)•Extraction time•Extraction temperature
Dev
ice
Sam
ple
9
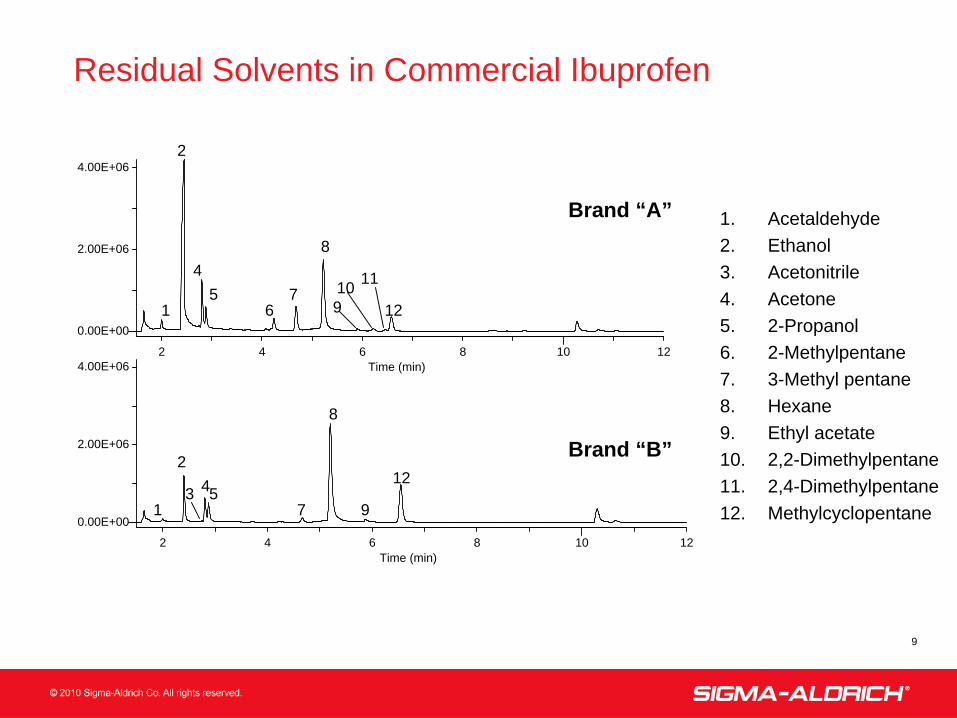
Residual Solvents in Commercial Ibuprofen
Brand “A”
Brand “B”
2 4 6 8 10 12Time (min)
0.00E+00
2.00E+06
4.00E+06
31
24
7
8
9
125
2 4 6 8 10 12Time (min)
0.00E+00
2.00E+06
4.00E+06
91
2
45
67
8
10 11
12
1. Acetaldehyde2. Ethanol3. Acetonitrile4. Acetone5. 2-Propanol6. 2-Methylpentane7. 3-Methyl pentane8. Hexane9. Ethyl acetate10. 2,2-Dimethylpentane11. 2,4-Dimethylpentane12. Methylcyclopentane
10
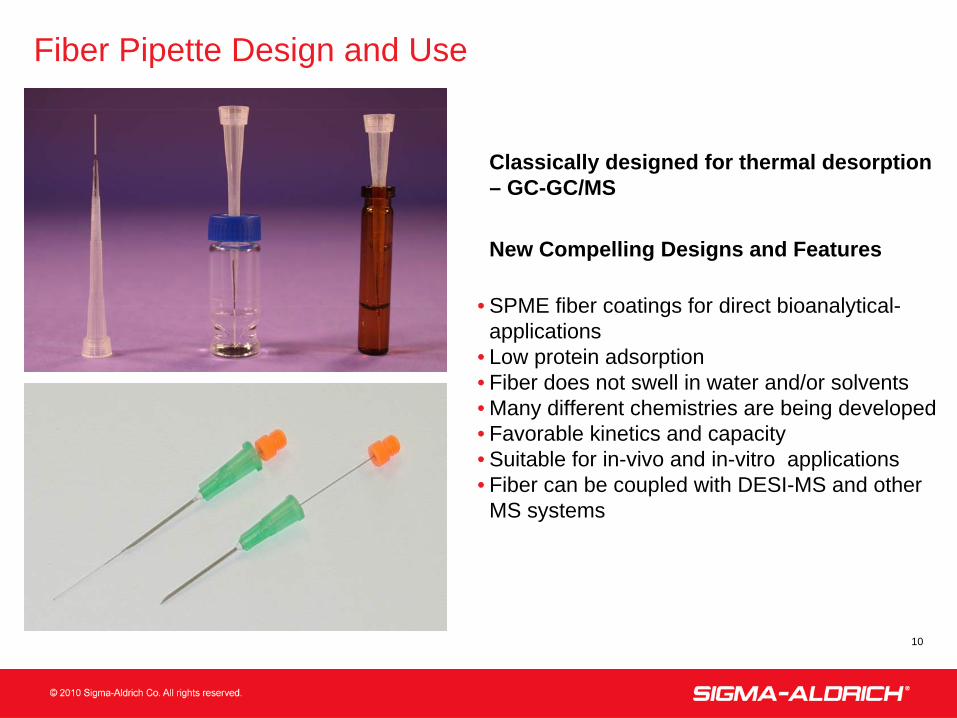
Fiber Pipette Design and Use
• Classically designed for thermal desorption – GC-GC/MS
• New Compelling Designs and Features
• SPME fiber coatings for direct bioanalytical- applications
• Low protein adsorption• Fiber does not swell in water and/or solvents• Many different chemistries are being developed• Favorable kinetics and capacity• Suitable for in-vivo and in-vitro applications• Fiber can be coupled with DESI-MS and other
MS systems
11
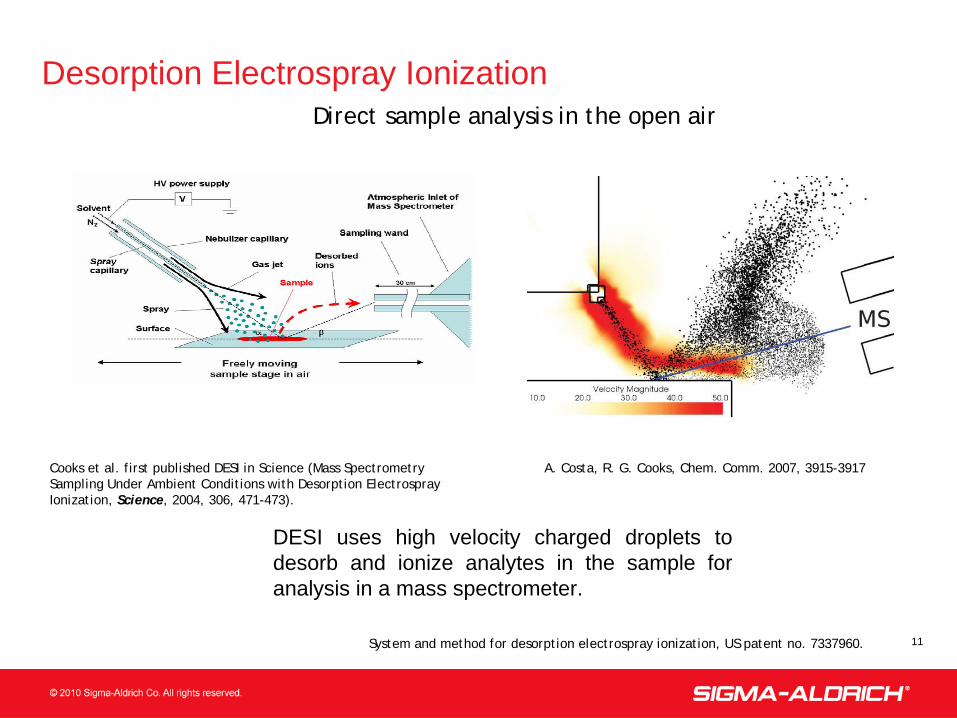
Desorption Electrospray Ionization
Cooks et al. first published DESI in Science (Mass Spectrometry Sampling Under Ambient Conditions with Desorption Electrospray Ionization, Science, 2004, 306, 471-473).
DESI uses high velocity charged droplets to desorb and ionize analytes in the sample for analysis in a mass spectrometer.
Direct sample analysis in the open air
A. Costa, R. G. Cooks, Chem. Comm. 2007, 3915-3917
System and method for desorption electrospray ionization, US patent no. 7337960.
12
SPME-DESI-MS (MS/MS) Approach for Drugs and Metabolites in Biological Fluids
• Compelling features
• Offers minimal sample handling, including sample transfers• Combines sampling and sample preparation into one step• Analytes are ‘stored’ in solid-phase – retained for further evaluation• Possibility to follow-up direct desorption analysis with liquid desorption
LC/MS/MS• Rapid and potentially high throughput analysis
13
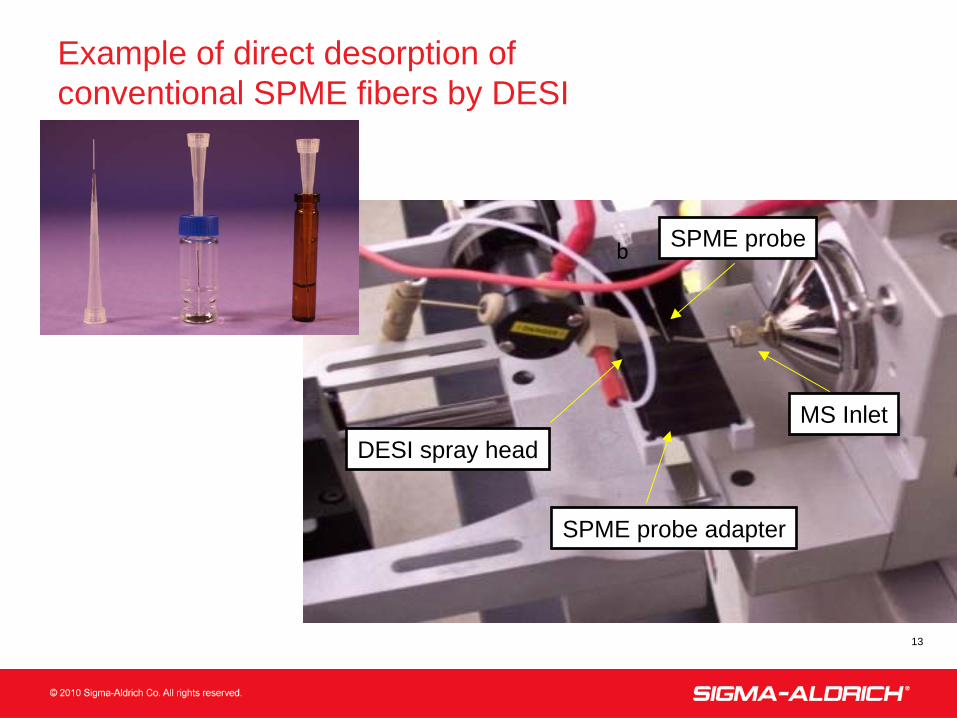
Example of direct desorption of conventional SPME fibers by DESI
DESI spray headMS Inlet
SPME probe
SPME probe adapter
b
14
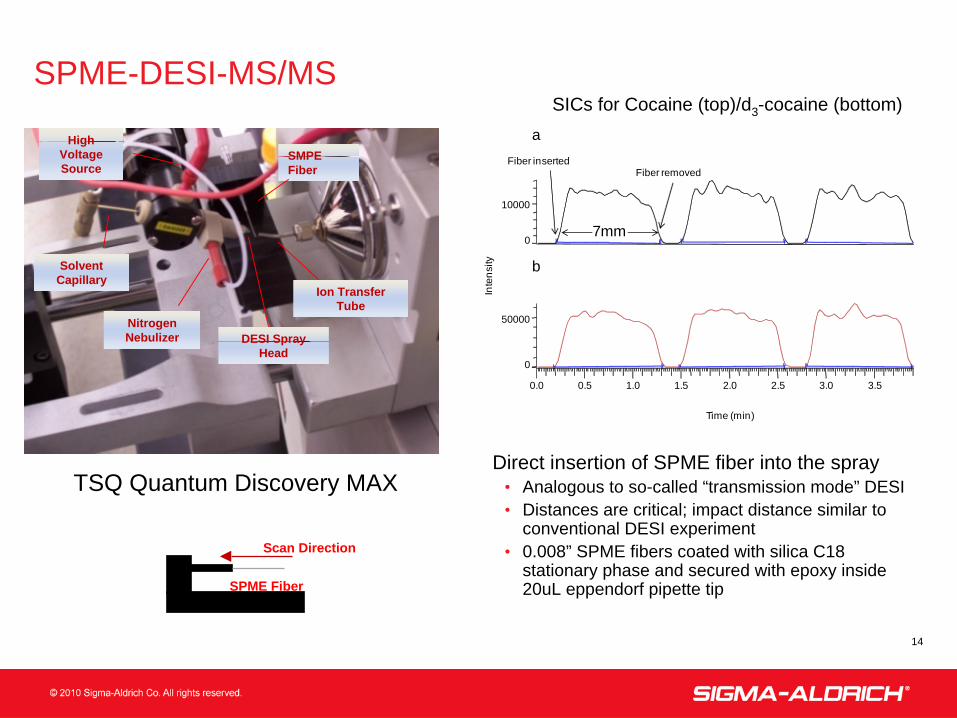
SPME-DESI-MS/MS
0
50000
Inte
nsity
0
10000
0.0 0.5 1.0 1.5 2.0 2.5 3.0 3.5
Time (min)
Fiber insertedFiber removed
a
b
7mm
SMPE Fiber
Ion TransferTube
DESI SprayHead
SolventCapillary
NitrogenNebulizer
High VoltageSource
Scan Direction
SPME Fiber
Holder
SICs for Cocaine (top)/d3 -cocaine (bottom)
TSQ Quantum Discovery MAX• Direct insertion of SPME fiber into the spray
•
Analogous to so-called “transmission mode” DESI•
Distances are critical; impact distance similar to conventional DESI experiment
•
0.008” SPME fibers coated with silica C18 stationary phase and secured with epoxy inside 20uL eppendorf pipette tip
15
Methods:
• Drug free urine samples were spiked with opiates along with stable isotope internal standards.
•Sample were then and extracted using recently developed biocompatible SPME fibers coated with functionalized silica particles.
•After extraction, fibers were rinsed with water and secured in a prototype device for positioning the SPME fiber in the DESI spray.
•Analysis by scanning with a 1- D Automated DESI source coupled to a Thermo TSQ Quantum Discovery Max triple quadrupole mass spectrometer
•Analysis was completed in approximately 1 minute.
Analysis of Opiates by SPME-DESI- MS/MS
16
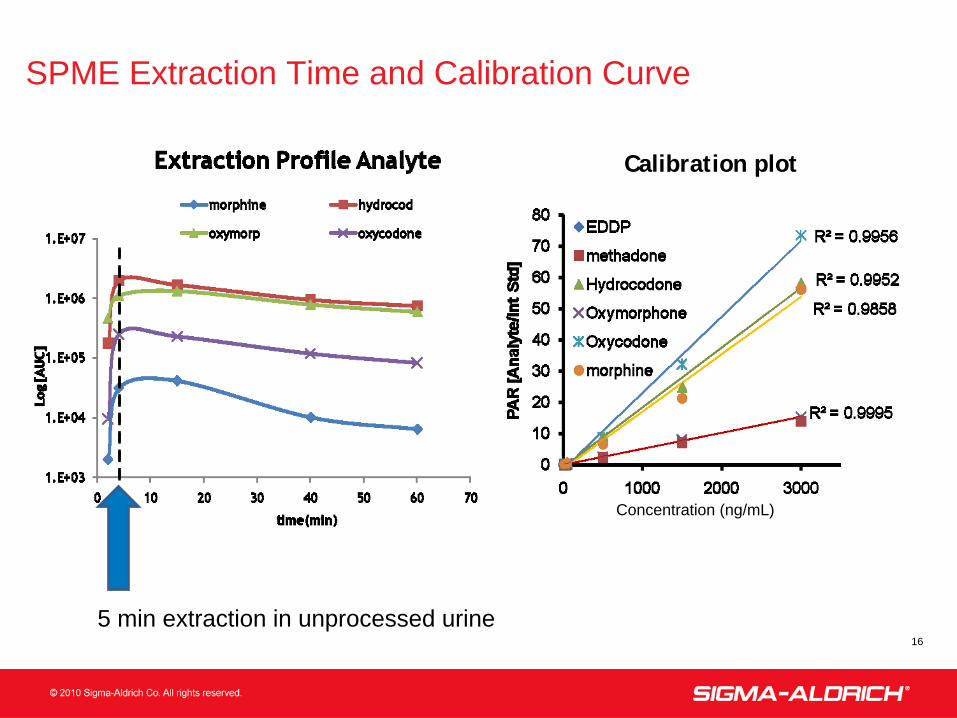
SPME Extraction Time and Calibration Curve
5 min extraction in unprocessed urine
Calibration plot
Concentration (ng/mL)
17
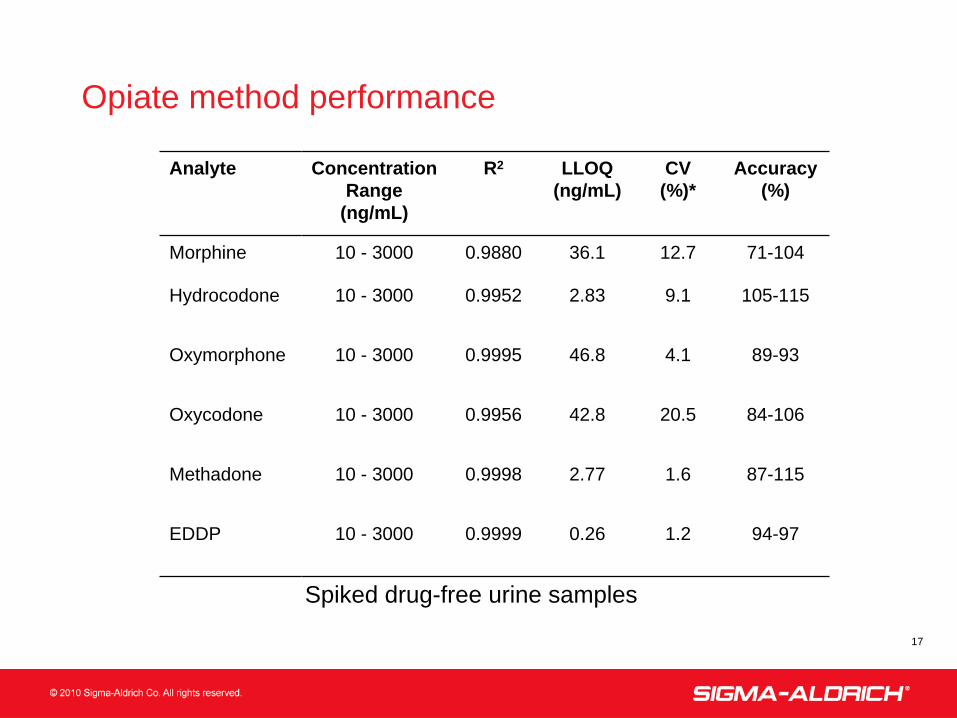
Opiate method performance
Analyte Concentration Range
(ng/mL)
R2 LLOQ (ng/mL)
CV (%)*
Accuracy (%)
Morphine 10 - 3000 0.9880 36.1 12.7 71-104
Hydrocodone 10 - 3000 0.9952 2.83 9.1 105-115
Oxymorphone 10 - 3000 0.9995 46.8 4.1 89-93
Oxycodone 10 - 3000 0.9956 42.8 20.5 84-106
Methadone 10 - 3000 0.9998 2.77 1.6 87-115
EDDP 10 - 3000 0.9999 0.26 1.2 94-97
Spiked drug-free urine samples
18
Methods:
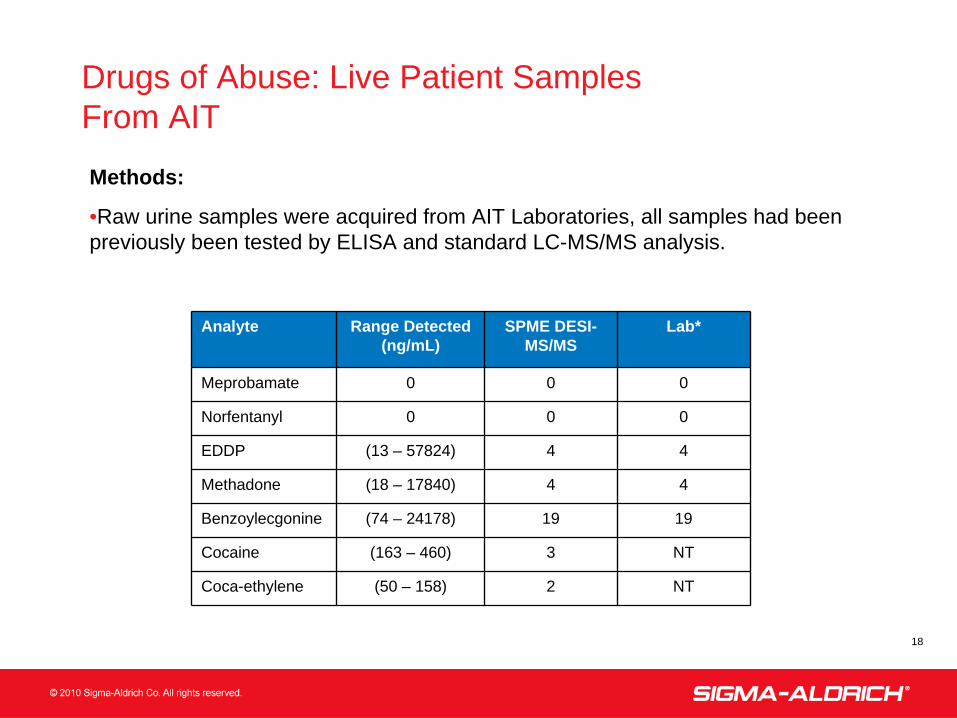
•Raw urine samples were acquired from AIT Laboratories, all samples had been previously been tested by ELISA and standard LC-MS/MS analysis.
Drugs of Abuse: Live Patient Samples From AIT
Analyte Range Detected(ng/mL)
SPME DESI- MS/MS
Lab*
Meprobamate 0 0 0
Norfentanyl 0 0 0
EDDP (13 – 57824) 4 4
Methadone (18 – 17840) 4 4
Benzoylecgonine (74 – 24178) 19 19
Cocaine (163 – 460) 3 NT
Coca-ethylene (50 – 158) 2 NT
19
• The approach of performing SPME-DESI-MS/MS demonstrated a unique approach for rapid analysis of biological samples.
•The results from SPME-DESI-MS/MS indicate that this methodology is suitable for direct screening of urine samples with minimal sample preparation.
• The SPME-DESI-MS/MS combination provides a suitable method for combination for screening as well as quantitation of opiates in urine.
SPME-DESI CONCLUSIONS
20
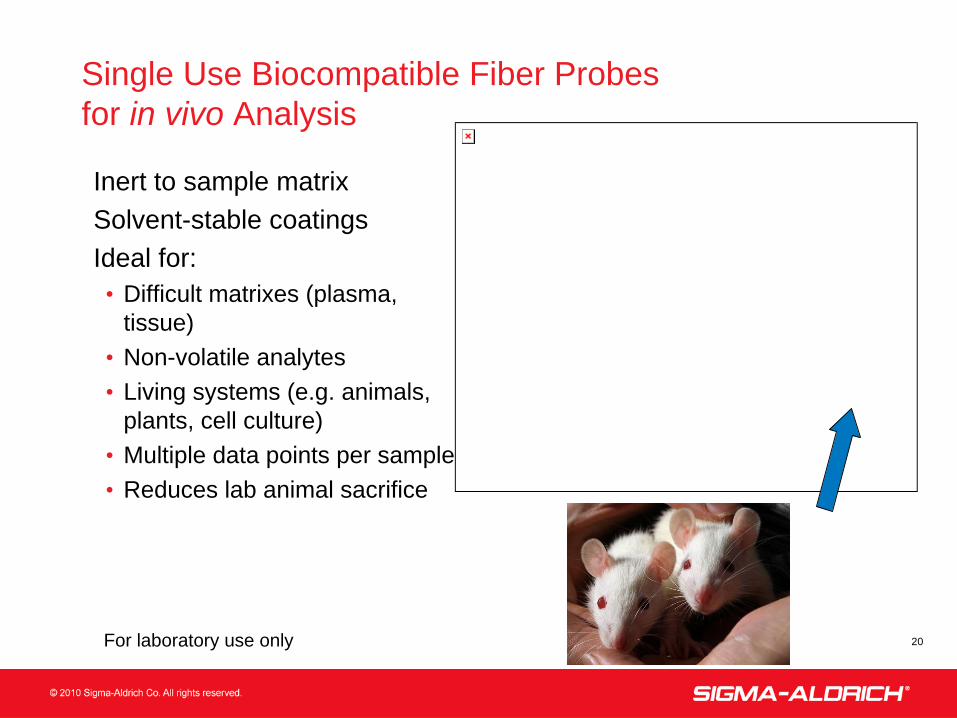
Single Use Biocompatible Fiber Probes for in vivo Analysis
•Inert to sample matrix•Solvent-stable coatings•Ideal for:
•
Difficult matrixes (plasma, tissue)
•
Non-volatile analytes•
Living systems (e.g. animals, plants, cell culture)
•
Multiple data points per sample•
Reduces lab animal sacrifice
For laboratory use only
21
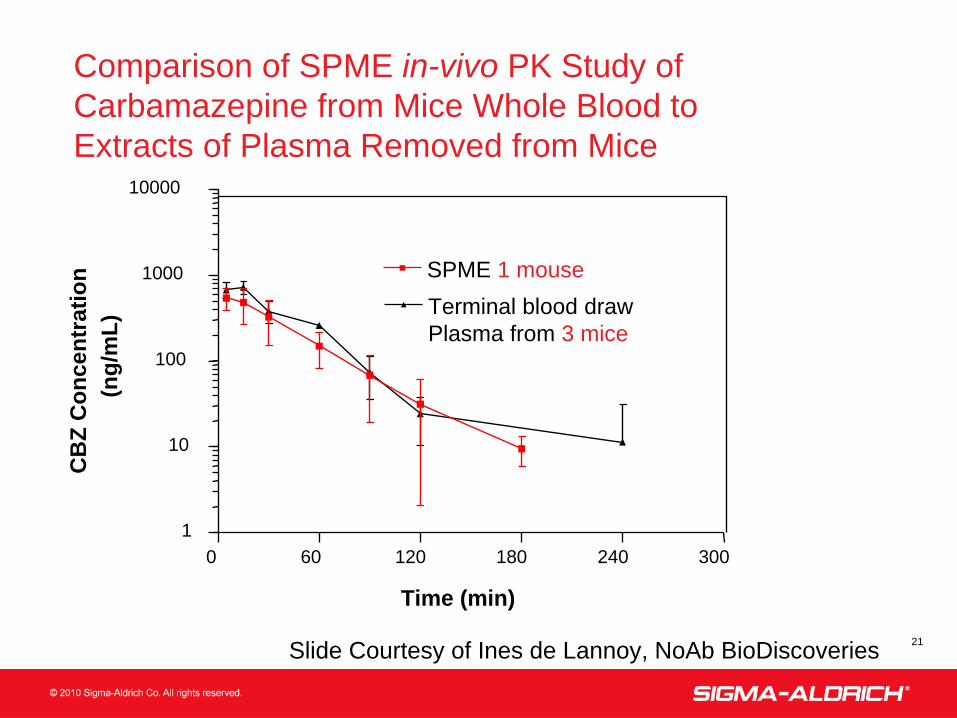
Comparison of SPME in-vivo PK Study of Carbamazepine from Mice Whole Blood to Extracts of Plasma Removed from Mice
Slide Courtesy of Ines de Lannoy, NoAb BioDiscoveries
SPME 1 mouseTerminal blood drawPlasma from 3 mice
0 60 120 180 240 3001
10
100
1000
10000
Time (min)
CB
Z C
once
ntra
tion
(ng/
mL)
22
Summary
• Classically GC, GC/MS• New developments in SPME coatings and devices coupled with the sensitivity of MS promises expanded utility
•
Biofluid compatible proof-of-concept example•
in-vivo example• Imagine new specific chemistries…..simultaneous PL removal?• Imagine new uses – formats similar to DBS?
• Challenge – what can we devise for your work?
23
Acknowledgements
• Joseph H Kennedy Prosolia, Inc• Justin M Wiseman• Brian Laughlin
• Craig Aurand Supelco/Sigma Aldrich• Robert Shirey
• Brenda Sweeney AIT Laboratories