Embed Size (px)
Citation preview

Global Horizonal Irradiation - long-term average © 2020 Solargis
© 2020 SolargisReport number: None
Solargis® Report
Solar Resource Overview
Site name:
Plataforma Solar de Almeria, Spain
Type of Data:
Monthly time series (01/1994 - 08/2020)
Customer:
Solargis s.r.o.
Date of Issue:
08 September 2020
Issued by:
Solargis s.r.o.Tel: +421 2 43 191 708
solargis.com

SITE: 37.094416°, -2.35985° | TYPE OF DATA: Monthly time series | CUSTOMER: Solargis s.r.o.
Report number: None © 2020 Solargis
1. Site Info
Site name: Plataforma Solar de Almeria, Spain
Latitude: 37.094416°
Longitude: -2.35985°
Elevation: 497 m a.s.l.
Location on the map: http://solargis.info/imaps/#tl=Google:satellite&loc=37.094416,-2.359850&z=14
Google Maps © 2020 Google
Page 2 of 13

SITE: 37.094416°, -2.35985° | TYPE OF DATA: Monthly time series | CUSTOMER: Solargis s.r.o.
Report number: None © 2020 Solargis
2. Executive Summary
Long-term average yearly values calculated from time series (TS) representing 26 complete calendar years (1994-2019):
Global Horizontal Irradiation 1883 kWh/m²
Diffuse Horizontal Irradiation 610 kWh/m²
Global Tilted Irradiation (fixed inclination: 33° azimuth: 180°, rel. rowspacing: 2.6)
2187 kWh/m²
Air Temperature at 2 m 17.5 °C
3. Solargis Database Description
This report and data is based on Solargis high-resolution database operated by Solargis s.r.o. company. Solar resource data(GHI, DIF, DNI and GTI) is calculated by a suit of solar models, and the data inputs are derived from geostationarymeteorological satellites and global meteorological models. Meteorological data (TEMP, RH, WS, WD, AP and PWAT) areprocessed from the outputs of global meteorological models. All Solargis parameters are validated by quality-controlledground measurements acquired by high-accuracy meteorological equipment worldwide. The spatial and time resolution ofthe original input data are harmonized during the model processing to achieve the best possible.
Output from the database Solargis v2.2.10
Solar Resource
Description: Data calculated from Meteosat MSG and MFG satellite data (© 2020 EUMETSAT) and fromatmospheric data (© 2020 ECMWF, NOAA and NASA) by Solargis method
Spatial resolution: 250 m
Meteorological Data
Description: Spatially disaggregated from CFSv2 and GFS (© 2020 NOAA) and ERA5 (© 2020 ECMWF) bySolargis method
Spatial resolution: Temperature 1 km, other meteorological parameters 33 km to 55 km
Terrain shading is not considered in this delivery. Occasional deviations in calculations may occur as a result ofmathematical rounding and cannot be considered as a defect of algorithms. Acronyms used later in this report: TS - timeseries, TMY - typical meteorological year, LTA - long-term average, STDEV - standard deviation.
Page 3 of 13
SITE: 37.094416°, -2.35985° | TYPE OF DATA: Monthly time series | CUSTOMER: Solargis s.r.o.
Report number: None © 2020 Solargis
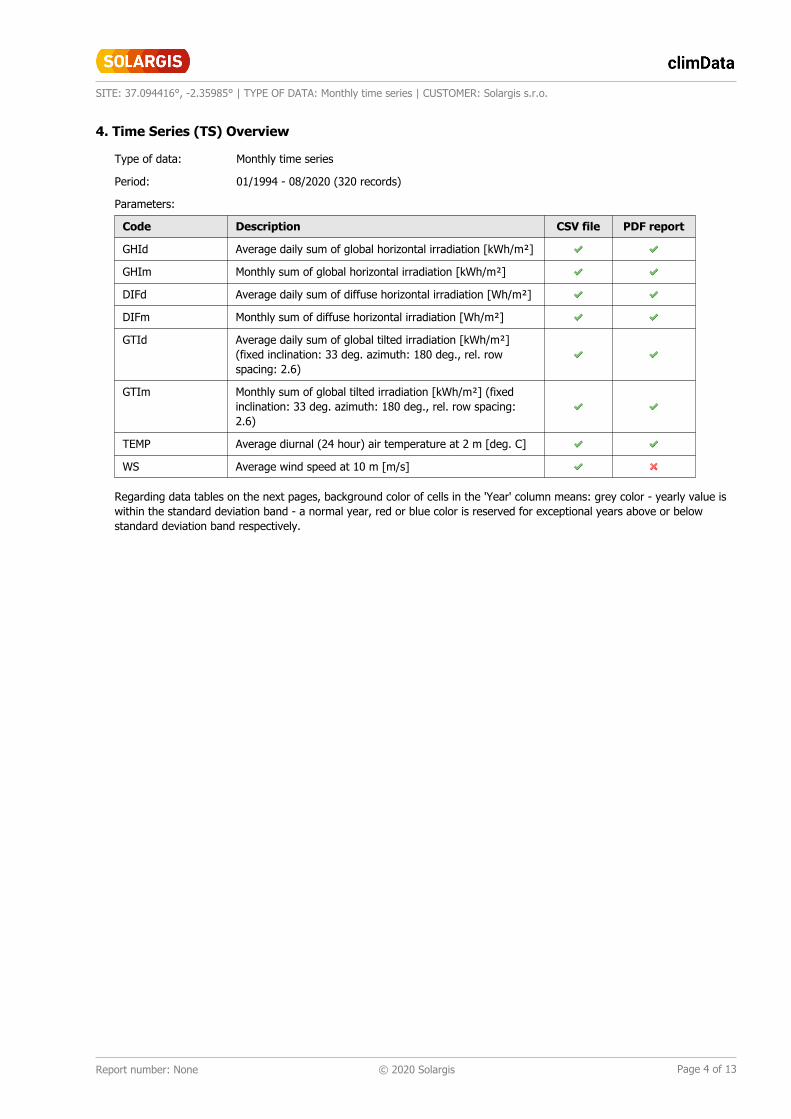
4. Time Series (TS) Overview
Type of data: Monthly time series
Period: 01/1994 - 08/2020 (320 records)
Parameters:
Code Description CSV file PDF report
GHId Average daily sum of global horizontal irradiation [kWh/m²]
GHIm Monthly sum of global horizontal irradiation [kWh/m²]
DIFd Average daily sum of diffuse horizontal irradiation [Wh/m²]
DIFm Monthly sum of diffuse horizontal irradiation [Wh/m²]
GTId Average daily sum of global tilted irradiation [kWh/m²](fixed inclination: 33 deg. azimuth: 180 deg., rel. rowspacing: 2.6)
GTIm Monthly sum of global tilted irradiation [kWh/m²] (fixedinclination: 33 deg. azimuth: 180 deg., rel. row spacing:2.6)
TEMP Average diurnal (24 hour) air temperature at 2 m [deg. C]
WS Average wind speed at 10 m [m/s]
Regarding data tables on the next pages, background color of cells in the 'Year' column means: grey color - yearly value iswithin the standard deviation band - a normal year, red or blue color is reserved for exceptional years above or belowstandard deviation band respectively.
Page 4 of 13
SITE: 37.094416°, -2.35985° | TYPE OF DATA: Monthly time series | CUSTOMER: Solargis s.r.o.
Report number: None © 2020 Solargis
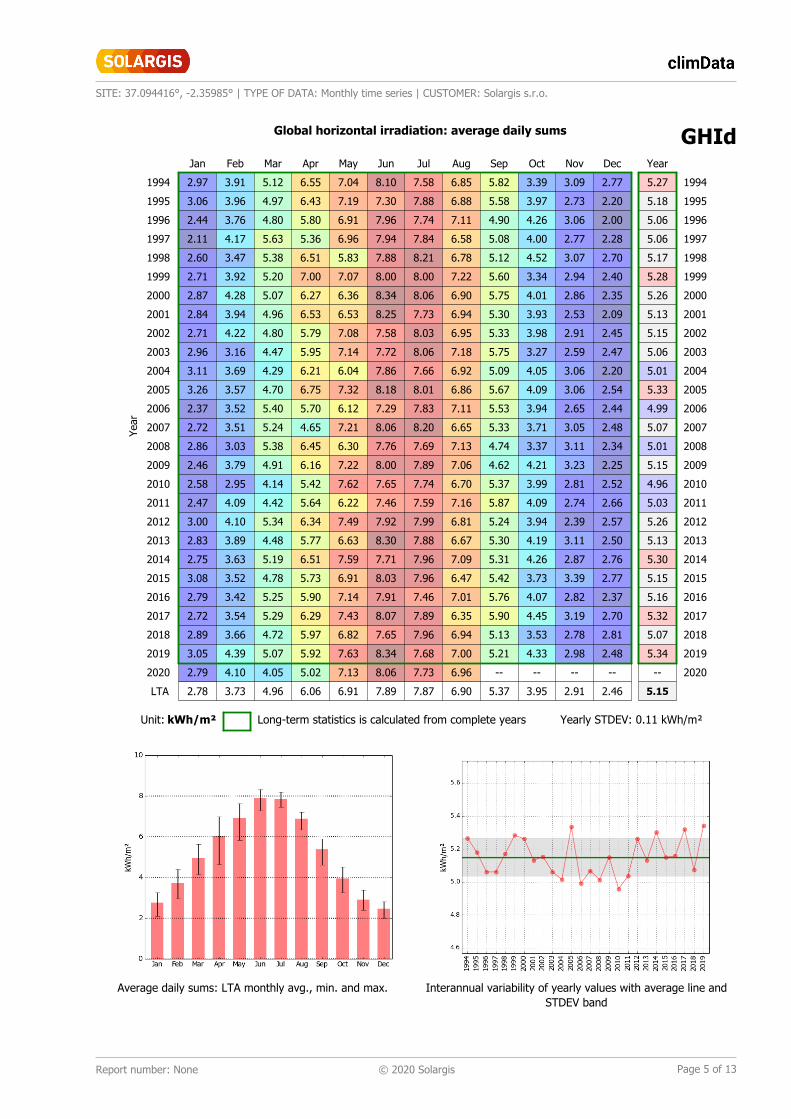
Global horizontal irradiation: average daily sums GHIdYe
ar
Jan Feb Mar Apr May Jun Jul Aug Sep Oct Nov Dec Year
1994 2.97 3.91 5.12 6.55 7.04 8.10 7.58 6.85 5.82 3.39 3.09 2.77 5.27 1994
1995 3.06 3.96 4.97 6.43 7.19 7.30 7.88 6.88 5.58 3.97 2.73 2.20 5.18 1995
1996 2.44 3.76 4.80 5.80 6.91 7.96 7.74 7.11 4.90 4.26 3.06 2.00 5.06 1996
1997 2.11 4.17 5.63 5.36 6.96 7.94 7.84 6.58 5.08 4.00 2.77 2.28 5.06 1997
1998 2.60 3.47 5.38 6.51 5.83 7.88 8.21 6.78 5.12 4.52 3.07 2.70 5.17 1998
1999 2.71 3.92 5.20 7.00 7.07 8.00 8.00 7.22 5.60 3.34 2.94 2.40 5.28 1999
2000 2.87 4.28 5.07 6.27 6.36 8.34 8.06 6.90 5.75 4.01 2.86 2.35 5.26 2000
2001 2.84 3.94 4.96 6.53 6.53 8.25 7.73 6.94 5.30 3.93 2.53 2.09 5.13 2001
2002 2.71 4.22 4.80 5.79 7.08 7.58 8.03 6.95 5.33 3.98 2.91 2.45 5.15 2002
2003 2.96 3.16 4.47 5.95 7.14 7.72 8.06 7.18 5.75 3.27 2.59 2.47 5.06 2003
2004 3.11 3.69 4.29 6.21 6.04 7.86 7.66 6.92 5.09 4.05 3.06 2.20 5.01 2004
2005 3.26 3.57 4.70 6.75 7.32 8.18 8.01 6.86 5.67 4.09 3.06 2.54 5.33 2005
2006 2.37 3.52 5.40 5.70 6.12 7.29 7.83 7.11 5.53 3.94 2.65 2.44 4.99 2006
2007 2.72 3.51 5.24 4.65 7.21 8.06 8.20 6.65 5.33 3.71 3.05 2.48 5.07 2007
2008 2.86 3.03 5.38 6.45 6.30 7.76 7.69 7.13 4.74 3.37 3.11 2.34 5.01 2008
2009 2.46 3.79 4.91 6.16 7.22 8.00 7.89 7.06 4.62 4.21 3.23 2.25 5.15 2009
2010 2.58 2.95 4.14 5.42 7.62 7.65 7.74 6.70 5.37 3.99 2.81 2.52 4.96 2010
2011 2.47 4.09 4.42 5.64 6.22 7.46 7.59 7.16 5.87 4.09 2.74 2.66 5.03 2011
2012 3.00 4.10 5.34 6.34 7.49 7.92 7.99 6.81 5.24 3.94 2.39 2.57 5.26 2012
2013 2.83 3.89 4.48 5.77 6.63 8.30 7.88 6.67 5.30 4.19 3.11 2.50 5.13 2013
2014 2.75 3.63 5.19 6.51 7.59 7.71 7.96 7.09 5.31 4.26 2.87 2.76 5.30 2014
2015 3.08 3.52 4.78 5.73 6.91 8.03 7.96 6.47 5.42 3.73 3.39 2.77 5.15 2015
2016 2.79 3.42 5.25 5.90 7.14 7.91 7.46 7.01 5.76 4.07 2.82 2.37 5.16 2016
2017 2.72 3.54 5.29 6.29 7.43 8.07 7.89 6.35 5.90 4.45 3.19 2.70 5.32 2017
2018 2.89 3.66 4.72 5.97 6.82 7.65 7.96 6.94 5.13 3.53 2.78 2.81 5.07 2018
2019 3.05 4.39 5.07 5.92 7.63 8.34 7.68 7.00 5.21 4.33 2.98 2.48 5.34 2019
2020 2.79 4.10 4.05 5.02 7.13 8.06 7.73 6.96 -- -- -- -- -- 2020
LTA 2.78 3.73 4.96 6.06 6.91 7.89 7.87 6.90 5.37 3.95 2.91 2.46 5.15
Unit: kWh/m² Long-term statistics is calculated from complete years Yearly STDEV: 0.11 kWh/m²
Average daily sums: LTA monthly avg., min. and max. Interannual variability of yearly values with average line andSTDEV band
Page 5 of 13

SITE: 37.094416°, -2.35985° | TYPE OF DATA: Monthly time series | CUSTOMER: Solargis s.r.o.
Report number: None © 2020 Solargis
Global horizontal irradiation: monthly and yearly sums GHImYe
ar
Jan Feb Mar Apr May Jun Jul Aug Sep Oct Nov Dec Year
1994 92 109 159 197 218 243 235 212 174 105 93 86 1924 1994
1995 95 111 154 193 223 219 244 213 167 123 82 68 1892 1995
1996 76 109 149 174 214 239 240 220 147 132 92 62 1853 1996
1997 65 117 174 161 216 238 243 204 152 124 83 71 1849 1997
1998 81 97 167 195 181 236 255 210 154 140 92 84 1891 1998
1999 84 110 161 210 219 240 248 224 168 104 88 74 1930 1999
2000 89 124 157 188 197 250 250 214 172 124 86 73 1925 2000
2001 88 110 154 196 202 248 240 215 159 122 76 65 1874 2001
2002 84 118 149 174 219 228 249 216 160 123 87 76 1882 2002
2003 92 88 138 178 222 232 250 223 173 101 78 77 1851 2003
2004 96 107 133 186 187 236 238 214 153 126 92 68 1836 2004
2005 101 100 146 203 227 245 248 213 170 127 92 79 1950 2005
2006 73 98 167 171 190 219 243 220 166 122 80 76 1824 2006
2007 84 98 162 139 223 242 254 206 160 115 91 77 1853 2007
2008 89 88 167 193 195 233 238 221 142 104 93 73 1836 2008
2009 76 106 152 185 224 240 245 219 139 131 97 70 1882 2009
2010 80 83 128 163 236 229 240 208 161 124 84 78 1814 2010
2011 77 114 137 169 193 224 235 222 176 127 82 82 1839 2011
2012 93 119 166 190 232 238 248 211 157 122 72 80 1927 2012
2013 88 109 139 173 206 249 244 207 159 130 93 78 1874 2013
2014 85 102 161 195 235 231 247 220 159 132 86 86 1939 2014
2015 96 99 148 172 214 241 247 201 163 116 102 86 1882 2015
2016 86 99 163 177 221 237 231 217 173 126 85 73 1889 2016
2017 84 99 164 189 230 242 245 197 177 138 96 84 1944 2017
2018 90 102 146 179 211 229 247 215 154 110 84 87 1854 2018
2019 94 123 157 178 236 250 238 217 156 134 89 77 1951 2019
2020 87 119 126 151 221 242 240 216 -- -- -- -- -- 2020
LTA 86 105 154 182 214 237 244 214 161 122 87 76 1883
Unit: kWh/m² Long-term statistics is calculated from complete years Yearly STDEV: 42 kWh/m²
Monthly long-term average, minimum and maximum Interannual variability of yearly values with average line andSTDEV band
Page 6 of 13

SITE: 37.094416°, -2.35985° | TYPE OF DATA: Monthly time series | CUSTOMER: Solargis s.r.o.
Report number: None © 2020 Solargis
Diffuse horizontal irradiation: average daily sums DIFdYe
ar
Jan Feb Mar Apr May Jun Jul Aug Sep Oct Nov Dec Year
1994 0.93 1.23 1.79 1.70 2.21 2.33 2.85 2.36 1.55 1.56 0.97 0.80 1.69 1994
1995 0.81 1.12 1.50 1.93 2.38 2.57 2.34 2.15 1.60 1.71 1.26 0.91 1.69 1995
1996 1.05 1.09 1.54 2.19 2.05 2.52 2.40 2.01 1.80 1.25 0.96 0.89 1.65 1996
1997 1.08 1.06 1.44 1.94 2.38 2.06 2.13 2.03 1.83 1.43 1.04 0.81 1.60 1997
1998 1.01 1.14 1.54 1.75 2.55 2.40 2.14 2.37 1.74 1.19 0.88 0.69 1.62 1998
1999 0.84 0.94 1.51 1.62 2.42 2.29 2.26 2.04 1.72 1.52 0.91 0.82 1.57 1999
2000 0.82 0.94 1.94 1.88 2.18 2.25 2.32 2.39 1.71 1.34 0.96 0.91 1.64 2000
2001 0.98 1.25 1.77 1.87 2.21 2.33 2.37 2.27 2.00 1.47 1.16 0.86 1.71 2001
2002 0.93 1.01 1.58 2.00 2.22 2.86 2.35 2.29 2.01 1.46 0.98 0.87 1.71 2002
2003 0.81 1.21 1.70 2.05 2.29 2.69 2.41 2.06 1.76 1.57 1.08 0.82 1.70 2003
2004 0.78 1.23 1.59 1.74 2.65 2.38 2.41 2.13 1.96 1.48 0.94 0.85 1.68 2004
2005 0.69 1.01 1.86 1.98 2.33 2.41 2.36 2.18 1.81 1.39 1.00 0.74 1.65 2005
2006 0.95 1.26 1.43 2.49 2.72 2.66 2.58 2.02 1.95 1.64 1.04 0.92 1.80 2006
2007 0.90 1.22 1.46 2.30 2.20 2.24 2.15 2.44 2.07 1.48 0.99 0.79 1.69 2007
2008 0.85 1.31 1.41 1.93 2.69 2.38 2.46 2.05 1.95 1.62 0.95 0.79 1.70 2008
2009 0.95 1.18 1.60 1.92 2.37 2.25 2.23 2.11 1.94 1.33 0.98 0.80 1.64 2009
2010 0.95 1.30 1.61 2.46 2.12 2.36 2.36 2.23 1.78 1.32 0.86 0.93 1.69 2010
2011 0.96 1.09 1.73 2.24 2.48 2.34 2.49 2.29 1.69 1.46 1.09 0.77 1.72 2011
2012 0.84 1.00 1.64 1.95 2.17 2.58 2.38 2.48 1.88 1.35 1.12 0.84 1.68 2012
2013 0.91 1.12 1.67 2.00 2.42 2.29 2.29 2.23 1.83 1.50 0.95 0.86 1.67 2013
2014 0.90 1.21 1.52 1.93 2.00 2.54 2.36 2.07 1.73 1.45 1.04 0.68 1.62 2014
2015 0.85 1.18 1.49 2.10 2.37 2.15 2.32 2.39 1.78 1.50 0.80 0.85 1.65 2015
2016 0.97 1.46 1.46 1.96 2.25 2.45 2.44 2.12 1.79 1.53 1.03 0.75 1.68 2016
2017 0.83 1.38 1.48 1.94 2.42 2.24 2.32 2.20 1.69 1.29 0.85 0.75 1.62 2017
2018 0.86 1.20 1.52 1.96 2.48 2.51 2.37 2.13 1.91 1.41 0.98 0.68 1.67 2018
2019 0.79 1.00 1.55 1.87 2.00 2.15 2.60 2.38 2.00 1.31 0.98 0.83 1.62 2019
2020 0.89 1.20 1.72 2.24 2.33 2.42 2.56 2.19 -- -- -- -- -- 2020
LTA 0.89 1.16 1.59 1.99 2.33 2.39 2.37 2.21 1.83 1.44 0.99 0.82 1.67
Unit: kWh/m² Long-term statistics is calculated from complete years Yearly STDEV: 0.05 kWh/m²
Average daily sums: LTA monthly avg., min. and max. Interannual variability of yearly values with average line andSTDEV band
Page 7 of 13
SITE: 37.094416°, -2.35985° | TYPE OF DATA: Monthly time series | CUSTOMER: Solargis s.r.o.
Report number: None © 2020 Solargis
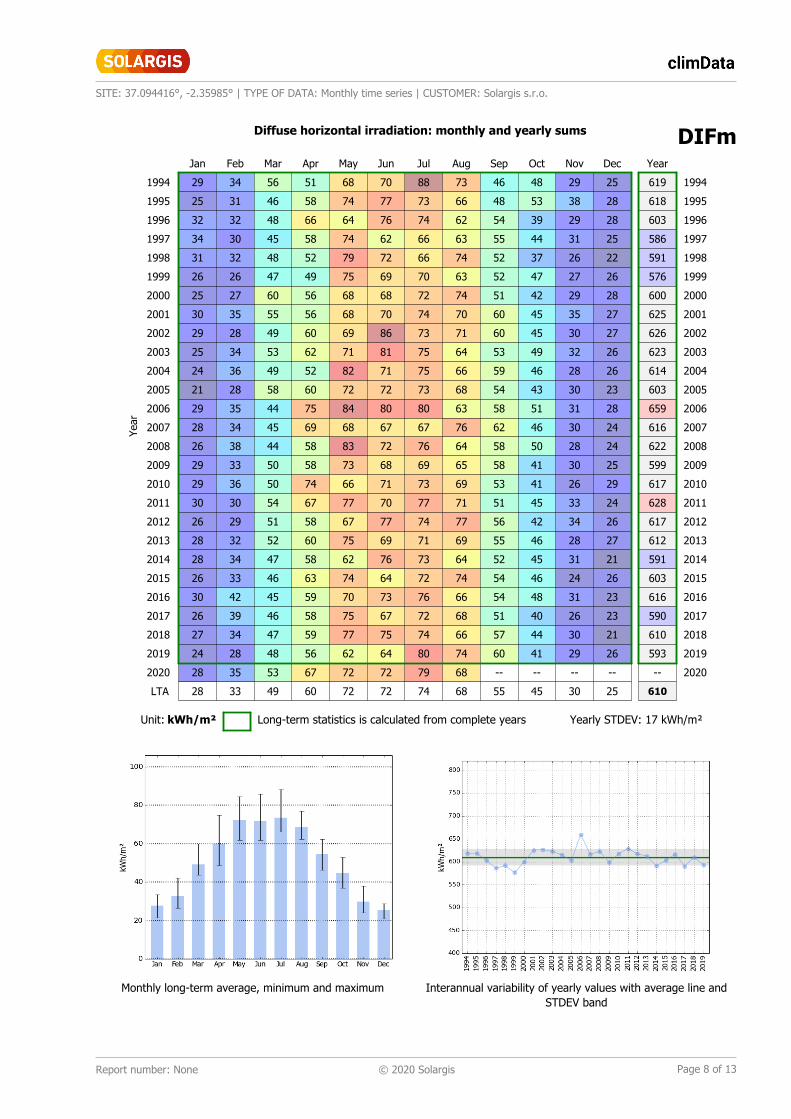
Diffuse horizontal irradiation: monthly and yearly sums DIFmYe
ar
Jan Feb Mar Apr May Jun Jul Aug Sep Oct Nov Dec Year
1994 29 34 56 51 68 70 88 73 46 48 29 25 619 1994
1995 25 31 46 58 74 77 73 66 48 53 38 28 618 1995
1996 32 32 48 66 64 76 74 62 54 39 29 28 603 1996
1997 34 30 45 58 74 62 66 63 55 44 31 25 586 1997
1998 31 32 48 52 79 72 66 74 52 37 26 22 591 1998
1999 26 26 47 49 75 69 70 63 52 47 27 26 576 1999
2000 25 27 60 56 68 68 72 74 51 42 29 28 600 2000
2001 30 35 55 56 68 70 74 70 60 45 35 27 625 2001
2002 29 28 49 60 69 86 73 71 60 45 30 27 626 2002
2003 25 34 53 62 71 81 75 64 53 49 32 26 623 2003
2004 24 36 49 52 82 71 75 66 59 46 28 26 614 2004
2005 21 28 58 60 72 72 73 68 54 43 30 23 603 2005
2006 29 35 44 75 84 80 80 63 58 51 31 28 659 2006
2007 28 34 45 69 68 67 67 76 62 46 30 24 616 2007
2008 26 38 44 58 83 72 76 64 58 50 28 24 622 2008
2009 29 33 50 58 73 68 69 65 58 41 30 25 599 2009
2010 29 36 50 74 66 71 73 69 53 41 26 29 617 2010
2011 30 30 54 67 77 70 77 71 51 45 33 24 628 2011
2012 26 29 51 58 67 77 74 77 56 42 34 26 617 2012
2013 28 32 52 60 75 69 71 69 55 46 28 27 612 2013
2014 28 34 47 58 62 76 73 64 52 45 31 21 591 2014
2015 26 33 46 63 74 64 72 74 54 46 24 26 603 2015
2016 30 42 45 59 70 73 76 66 54 48 31 23 616 2016
2017 26 39 46 58 75 67 72 68 51 40 26 23 590 2017
2018 27 34 47 59 77 75 74 66 57 44 30 21 610 2018
2019 24 28 48 56 62 64 80 74 60 41 29 26 593 2019
2020 28 35 53 67 72 72 79 68 -- -- -- -- -- 2020
LTA 28 33 49 60 72 72 74 68 55 45 30 25 610
Unit: kWh/m² Long-term statistics is calculated from complete years Yearly STDEV: 17 kWh/m²
Monthly long-term average, minimum and maximum Interannual variability of yearly values with average line andSTDEV band
Page 8 of 13

SITE: 37.094416°, -2.35985° | TYPE OF DATA: Monthly time series | CUSTOMER: Solargis s.r.o.
Report number: None © 2020 Solargis
Global tilted irradiation: average daily sums GTIdfixed inclination: 33° azimuth: 180°, rel. row spacing: 2.6Ye
ar
Jan Feb Mar Apr May Jun Jul Aug Sep Oct Nov Dec Year
1994 4.99 5.70 6.33 7.08 6.83 7.47 7.23 7.10 6.85 4.45 4.98 4.98 6.16 1994
1995 5.28 5.88 6.16 6.95 6.93 6.77 7.46 7.07 6.60 5.25 4.09 3.67 6.01 1995
1996 3.84 5.52 5.87 6.21 6.55 7.33 7.33 7.34 5.79 5.88 4.95 3.27 5.82 1996
1997 3.18 6.18 7.13 5.70 6.74 7.28 7.37 6.77 5.84 5.44 4.36 3.91 5.83 1997
1998 4.23 4.94 6.77 7.01 5.57 7.26 7.74 6.97 5.93 6.37 5.03 4.94 6.06 1998
1999 4.58 5.93 6.51 7.61 6.84 7.35 7.57 7.45 6.62 4.32 4.72 4.17 6.14 1999
2000 4.92 6.50 6.24 6.72 6.13 7.65 7.63 7.15 6.78 5.46 4.56 3.99 6.14 2000
2001 4.68 5.76 6.07 7.08 6.22 7.60 7.28 7.18 6.15 5.34 3.82 3.49 5.89 2001
2002 4.42 6.32 5.90 6.12 6.80 7.05 7.58 7.20 6.16 5.44 4.64 4.25 5.99 2002
2003 5.04 4.50 5.50 6.38 6.87 7.15 7.62 7.42 6.76 4.18 3.96 4.33 5.81 2003
2004 5.42 5.33 5.29 6.65 5.79 7.26 7.25 7.13 5.97 5.47 4.99 3.75 5.86 2004
2005 5.78 5.26 5.69 7.27 7.08 7.56 7.59 7.12 6.68 5.58 4.91 4.54 6.25 2005
2006 3.82 5.04 6.79 6.06 5.95 6.73 7.42 7.37 6.49 5.23 4.13 4.16 5.77 2006
2007 4.59 5.01 6.62 4.86 6.93 7.42 7.74 6.85 6.19 4.92 4.85 4.36 5.86 2007
2008 4.85 4.26 6.75 6.90 6.09 7.12 7.28 7.40 5.43 4.34 5.05 4.11 5.80 2008
2009 3.93 5.50 6.07 6.58 6.96 7.36 7.45 7.32 5.24 5.83 5.21 3.86 5.94 2009
2010 4.22 4.09 5.00 5.73 7.35 7.04 7.33 6.95 6.29 5.46 4.52 4.30 5.69 2010
2011 4.03 6.13 5.36 6.04 5.99 6.86 7.16 7.42 6.92 5.48 4.22 4.76 5.87 2011
2012 5.16 6.14 6.68 6.80 7.23 7.32 7.56 7.08 6.08 5.36 3.59 4.51 6.13 2012
2013 4.77 5.79 5.45 6.20 6.38 7.65 7.46 6.87 6.20 5.69 5.04 4.37 5.99 2013
2014 4.58 5.28 6.49 6.96 7.33 7.10 7.52 7.33 6.15 5.87 4.47 5.08 6.18 2014
2015 5.30 5.11 5.98 6.10 6.68 7.35 7.51 6.69 6.35 5.00 5.69 4.92 6.06 2015
2016 4.64 4.75 6.58 6.31 6.83 7.27 7.07 7.25 6.82 5.48 4.43 4.17 5.97 2016
2017 4.60 5.02 6.60 6.85 7.17 7.42 7.46 6.53 7.00 6.22 5.24 4.87 6.25 2017
2018 4.94 5.32 5.78 6.43 6.54 7.04 7.52 7.19 6.00 4.71 4.39 5.16 5.92 2018
2019 5.30 6.64 6.36 6.34 7.36 7.66 7.28 7.25 6.09 5.97 4.77 4.34 6.28 2019
2020 4.71 6.03 4.95 5.27 6.87 7.40 7.33 7.24 -- -- -- -- -- 2020
LTA 4.66 5.46 6.15 6.50 6.66 7.27 7.44 7.13 6.28 5.34 4.64 4.32 5.99
Unit: kWh/m² Long-term statistics is calculated from complete years Yearly STDEV: 0.17 kWh/m²
Average daily sums: LTA monthly avg., min. and max. Interannual variability of yearly values with average line andSTDEV band
Page 9 of 13

SITE: 37.094416°, -2.35985° | TYPE OF DATA: Monthly time series | CUSTOMER: Solargis s.r.o.
Report number: None © 2020 Solargis
Global tilted irradiation: monthly and yearly sums GTImfixed inclination: 33° azimuth: 180°, rel. row spacing: 2.6Ye
ar
Jan Feb Mar Apr May Jun Jul Aug Sep Oct Nov Dec Year
1994 155 160 196 212 212 224 224 220 205 138 149 154 2250 1994
1995 164 165 191 209 215 203 231 219 198 163 123 114 2193 1995
1996 119 160 182 186 203 220 227 228 174 182 148 101 2131 1996
1997 99 173 221 171 209 218 228 210 175 169 131 121 2125 1997
1998 131 138 210 210 172 218 240 216 178 197 151 153 2216 1998
1999 142 166 202 228 212 220 235 231 198 134 142 129 2239 1999
2000 152 188 193 202 190 230 237 222 203 169 137 124 2247 2000
2001 145 161 188 212 193 228 226 223 184 165 115 108 2149 2001
2002 137 177 183 184 211 212 235 223 185 169 139 132 2185 2002
2003 156 126 171 191 213 214 236 230 203 130 119 134 2123 2003
2004 168 155 164 199 180 218 225 221 179 170 150 116 2144 2004
2005 179 147 176 218 219 227 235 221 201 173 147 141 2284 2005
2006 118 141 210 182 184 202 230 228 195 162 124 129 2106 2006
2007 142 140 205 146 215 223 240 212 186 153 145 135 2142 2007
2008 150 124 209 207 189 214 226 230 163 135 152 127 2125 2008
2009 122 154 188 197 216 221 231 227 157 181 156 120 2169 2009
2010 131 114 155 172 228 211 227 215 189 169 136 133 2080 2010
2011 125 172 166 181 186 206 222 230 208 170 127 148 2140 2011
2012 160 178 207 204 224 220 234 220 182 166 108 140 2243 2012
2013 148 162 169 186 198 230 231 213 186 176 151 136 2186 2013
2014 142 148 201 209 227 213 233 227 184 182 134 157 2258 2014
2015 164 143 185 183 207 220 233 207 191 155 171 152 2212 2015
2016 144 138 204 189 212 218 219 225 204 170 133 129 2185 2016
2017 143 141 204 205 222 222 231 202 210 193 157 151 2283 2017
2018 153 149 179 193 203 211 233 223 180 146 132 160 2162 2018
2019 164 186 197 190 228 230 226 225 183 185 143 135 2291 2019
2020 146 175 153 158 213 222 227 224 -- -- -- -- -- 2020
LTA 144 154 191 195 206 218 231 221 189 165 139 134 2187
Unit: kWh/m² Long-term statistics is calculated from complete years Yearly STDEV: 60 kWh/m²
Monthly long-term average, minimum and maximum Interannual variability of yearly values with average line andSTDEV band
Page 10 of 13
SITE: 37.094416°, -2.35985° | TYPE OF DATA: Monthly time series | CUSTOMER: Solargis s.r.o.
Report number: None © 2020 Solargis
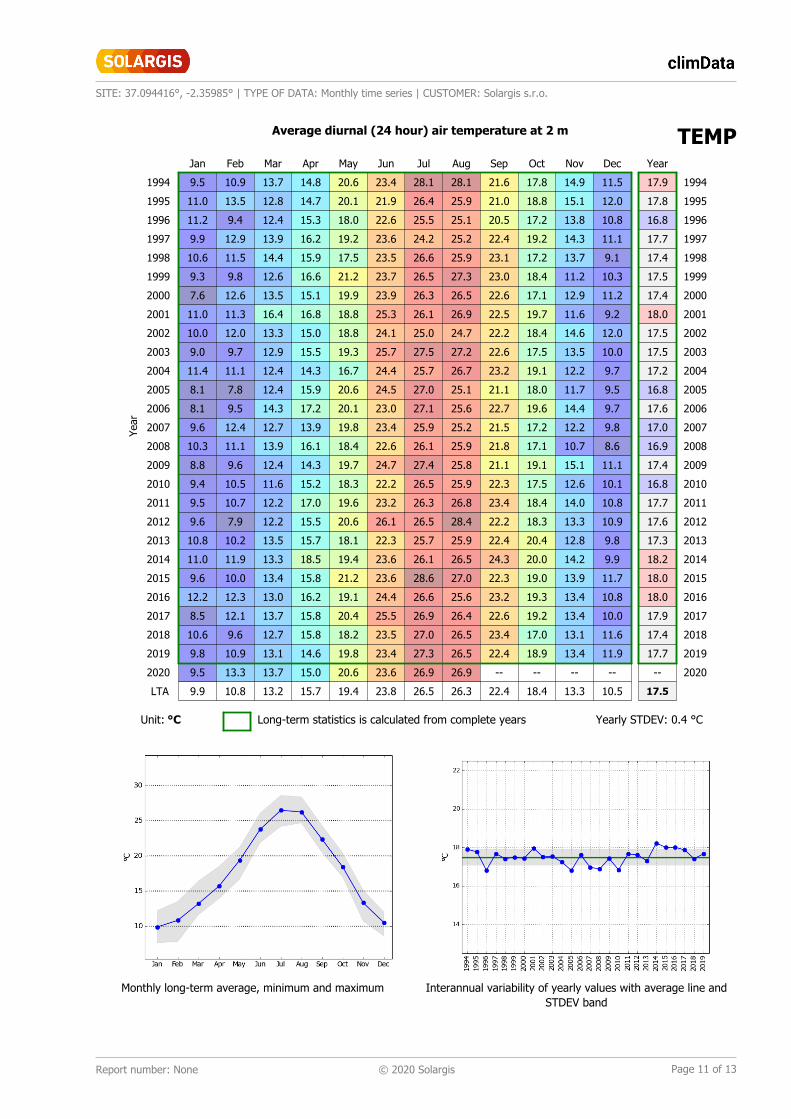
Average diurnal (24 hour) air temperature at 2 m TEMPYe
ar
Jan Feb Mar Apr May Jun Jul Aug Sep Oct Nov Dec Year
1994 9.5 10.9 13.7 14.8 20.6 23.4 28.1 28.1 21.6 17.8 14.9 11.5 17.9 1994
1995 11.0 13.5 12.8 14.7 20.1 21.9 26.4 25.9 21.0 18.8 15.1 12.0 17.8 1995
1996 11.2 9.4 12.4 15.3 18.0 22.6 25.5 25.1 20.5 17.2 13.8 10.8 16.8 1996
1997 9.9 12.9 13.9 16.2 19.2 23.6 24.2 25.2 22.4 19.2 14.3 11.1 17.7 1997
1998 10.6 11.5 14.4 15.9 17.5 23.5 26.6 25.9 23.1 17.2 13.7 9.1 17.4 1998
1999 9.3 9.8 12.6 16.6 21.2 23.7 26.5 27.3 23.0 18.4 11.2 10.3 17.5 1999
2000 7.6 12.6 13.5 15.1 19.9 23.9 26.3 26.5 22.6 17.1 12.9 11.2 17.4 2000
2001 11.0 11.3 16.4 16.8 18.8 25.3 26.1 26.9 22.5 19.7 11.6 9.2 18.0 2001
2002 10.0 12.0 13.3 15.0 18.8 24.1 25.0 24.7 22.2 18.4 14.6 12.0 17.5 2002
2003 9.0 9.7 12.9 15.5 19.3 25.7 27.5 27.2 22.6 17.5 13.5 10.0 17.5 2003
2004 11.4 11.1 12.4 14.3 16.7 24.4 25.7 26.7 23.2 19.1 12.2 9.7 17.2 2004
2005 8.1 7.8 12.4 15.9 20.6 24.5 27.0 25.1 21.1 18.0 11.7 9.5 16.8 2005
2006 8.1 9.5 14.3 17.2 20.1 23.0 27.1 25.6 22.7 19.6 14.4 9.7 17.6 2006
2007 9.6 12.4 12.7 13.9 19.8 23.4 25.9 25.2 21.5 17.2 12.2 9.8 17.0 2007
2008 10.3 11.1 13.9 16.1 18.4 22.6 26.1 25.9 21.8 17.1 10.7 8.6 16.9 2008
2009 8.8 9.6 12.4 14.3 19.7 24.7 27.4 25.8 21.1 19.1 15.1 11.1 17.4 2009
2010 9.4 10.5 11.6 15.2 18.3 22.2 26.5 25.9 22.3 17.5 12.6 10.1 16.8 2010
2011 9.5 10.7 12.2 17.0 19.6 23.2 26.3 26.8 23.4 18.4 14.0 10.8 17.7 2011
2012 9.6 7.9 12.2 15.5 20.6 26.1 26.5 28.4 22.2 18.3 13.3 10.9 17.6 2012
2013 10.8 10.2 13.5 15.7 18.1 22.3 25.7 25.9 22.4 20.4 12.8 9.8 17.3 2013
2014 11.0 11.9 13.3 18.5 19.4 23.6 26.1 26.5 24.3 20.0 14.2 9.9 18.2 2014
2015 9.6 10.0 13.4 15.8 21.2 23.6 28.6 27.0 22.3 19.0 13.9 11.7 18.0 2015
2016 12.2 12.3 13.0 16.2 19.1 24.4 26.6 25.6 23.2 19.3 13.4 10.8 18.0 2016
2017 8.5 12.1 13.7 15.8 20.4 25.5 26.9 26.4 22.6 19.2 13.4 10.0 17.9 2017
2018 10.6 9.6 12.7 15.8 18.2 23.5 27.0 26.5 23.4 17.0 13.1 11.6 17.4 2018
2019 9.8 10.9 13.1 14.6 19.8 23.4 27.3 26.5 22.4 18.9 13.4 11.9 17.7 2019
2020 9.5 13.3 13.7 15.0 20.6 23.6 26.9 26.9 -- -- -- -- -- 2020
LTA 9.9 10.8 13.2 15.7 19.4 23.8 26.5 26.3 22.4 18.4 13.3 10.5 17.5
Unit: °C Long-term statistics is calculated from complete years Yearly STDEV: 0.4 °C
Monthly long-term average, minimum and maximum Interannual variability of yearly values with average line andSTDEV band
Page 11 of 13

SITE: 37.094416°, -2.35985° | TYPE OF DATA: Monthly time series | CUSTOMER: Solargis s.r.o.
Report number: None © 2020 Solargis
5. Data Uncertainty
Solar Resource
Quality of Solargis data is determined by underlying models, spatial and temporal resolution of atmospheric andmeteorological inputs, and their accuracy. Solargis data has been validated at 250+ public and many commercial locations,where high quality measurements were available. Statistics such as bias and RMSD are used for estimation of user‘suncertainty. Solargis model demonstrates stable performance globally, and uncertainty lies within the margins describedbelow.
For objective evaluation, the model has to be evaluated with quality-controlled data measured using high standard andprofessionally maintained instruments. If validation at a particular site shows higher deviations, there is high probability thatthere are issues with local measurements.
Uncertainty of Solargis GHI and DNI yearly summaries for 80% of observations is within the range of ±4% and ±8% (±5%and ±10% for 90% of observations), respectively. In complex geographies and extreme cases, uncertainty of GHI and DNIyearly summaries can be as high as ±8% and ±15%, respectively.
Regions where lower uncertainty (below or equal to ±4% for yearly GHI and ±8% for DNI) can be typically expected: Mostof Europe and North America below latitude approx. 50° (see exceptions below), South Africa, Chile, Brazil, Australia, Japan,Morocco, Mediterranean region and Arabian Peninsula (except the Gulf region). Lower uncertainty is expected in regionswith good availability of high-quality ground measurements.
Regions where higher uncertainty can be expected (above ±4% for yearly GHI and above ±8% for DNI): high latitudes(approx. above 50°), high mountains, regions with regular snow and ice coverage, high-reflectance deserts, urbanized andindustrialized areas, regions with high and dynamically changing concentrations of atmospheric aerosols (Northern India,West Africa, Gulf region, some regions in China), coastal zone (approx. up to 15 km from water) and humid tropical climate.Higher uncertainty is also assumed in regions with limited or no availability of high-quality ground measurements.
Meteorological Data
Meteorological parameters are derived from the numerical weather models CFSR, CFSv2, MERRA-2 and GFSprod. Comparedto solar resource data, they have lower spatial and temporal resolution, and lower accuracy. They characterize widergeographic region rather than a specific site. Especially relative humidity, wind speed and wind direction values have higheruncertainty, they may not accurately characterize the local microclimate and should be used with caution. The validationprocedure was carried out to compare the modelled data with ground-measured data from the meteorological stationsavailable through NOAA Integrated Surface Database network. In the validation of air temperature, wind speed and relativehumidity, the hourly measurements at more than 11000 stations were used. Uncertainty of yearly estimates for selectedmeteorological parameters (considering 80% occurrence): air temperature ±1.3 °C, relative humidity: ±11%, wind speed±1.7 m/s.
More about Solargis models, the underlying algorithms, input data and uncertainty can be consulted at:http://solargis.com/support/knowledge-base/methodology/solar-radiation-modeling/
6. Disclaimer and Legal Information
Considering the uncertainty of data and calculations, Solargis s.r.o. does not guarantee the accuracy of estimates. Themaximum possible has been done for the assessment of weather parameters based on the best available data, software andknowledge. Solargis s.r.o. shall not be liable for any direct, incidental, consequential, indirect or punitive damages arising oralleged to have arisen out of use of the provided report.
This data and report is copyright to © 2020 Solargis. All rights reserved.
7. Service Provider
Solargis s.r.o., M. Marecka 3, 84107 Bratislava, SlovakiaCompany ID: 45 354 766, VAT Number: SK2022962766Registration: Business register, District Court Bratislava I, Section Sro, File 62765/BTel: +421 2 43 191 708solargis.com, [email protected]
Page 12 of 13

SITE: 37.094416°, -2.35985° | TYPE OF DATA: Monthly time series | CUSTOMER: Solargis s.r.o.
Report number: None © 2020 Solargis
8. Delivered Items and Data Files Originality
The complete delivery None consists of the following items (3):
CSV data files:
item format file checksum sum of all values
1 Monthly time series Solargis 91c2862f258e9f6521f102ca533b0421 135444
The originality of CSV data files can be verified by the 'file checksum' (e.g. on this web page http://onlinemd5.com/). MD5algorithm is used for the checksum. Using the 'sum of all values' is another way how to check the data originality in casethe 'file checksum' is not longer valid (e.g. the file was edited and saved in Excel). The indicative sum of all data values inSolargis CSV files is rounded to an integer.
PDF files:
item format description
2 Terms and conditions of Solargisdata use
PDF Signed/accepted terms and conditions are supplied as a separatedocument sent via e-mail.
3 Solargis Report PDF This PDF report is electronically signed by Solargis s.r.o.. Theauthenticity of this PDF report can be verified here:http://solargis.info/embedded/pdfverify.html.
Page 13 of 13