Embed Size (px)
Citation preview

1
Solar Updraft Power Plants: a new aerodynamic phenomenon in the design of
ultra-high towers
Francesca Lupi1, Claudio Borri1, Hans-Jürgen Niemann2, Udo Peil3
1University of Florence, Florence, Italy
[email protected]; [email protected]
2Ruhr-University Bochum, Bochum, Germany
3Technical University Braunschweig, Braunschweig, Germany
Abstract
Solar Updraft Towers – giga-towers of 1 km in height or even more in Solar Updraft Power Plants
(SUPPs) – were first introduced at the last EACWE in 2009 (Niemann et al., 2009). Since then, an
extensive wind tunnel investigation has been performed at WiSt laboratory at Ruhr-University
Bochum and at Criaciv laboratory (University of Florence). On the basis of the experiments, CFD
simulations are currently on-going. Relevant features for the design of ultra-high cylindrical towers
emerged throughout the whole investigation: a new aerodynamic phenomenon and its effects are
discussed in the paper.
1 Introduction
The Solar Updraft Power generation is a growing and promising technology in the field of renewable
energies, based on the combined harvesting of sun and wind. Very tall towers surrounded by a large
glass roof are the components of the power plants. Turbines and coupled generators constitute the
power conversion unit, at the tower foot.
In the collector, a large glass-covered area, solar radiation heats the collector ground and consequently
warms up the air inside the collector area. Following the increasing height of the roof, the heated air
streams towards the chimney at the collector centre, and fresh cold air is drawn into the collector at its
perimeter slot. The warm air rises up into the chimney and turns the turbines at the tower foot. In the
power conversion unit the mass stream of warm air is transformed into kinetic and further into electric
power (Niemann et al., 2009).
Figure 1 shows a recently built power plant of small size in Inner Mongolia (China). It is a 50 m tall
reinforced concrete tower with a glass collector on only one side, optimized for both sun and wind
energy harvesting during the summer and the winter, respectively (Wei & Wu, 2012). In October 2010,
the generating electricity system in Figure 1 was combined to the grid. However, the production of
energy is proportional to the volume of the cylinder having the height of the tower and the diameter of
the collector. For this reason, provided a sufficiently high solar radiation input (as it is, for example, in
the great deserts), a very good efficiency of the power plant can be reached only with extra-large
dimensions of the tower and/or the collector.

6th European and African Conference on Wind Engineering 2
Figure 1: Solar Heated Wind Updraft Tower in Wuhai Desert, Inner Mongolia (China).
Therefore, efficient and economically competitive Solar Updraft Towers should be giga-towers of 1
km in height or even more. The thin shell is made of reinforced concrete and the structural behaviour
can be optimized by stiffening rings along the height. The key role of the stiffening rings in the Solar
Tower design was presented at the last EACWE conference in 2009. Since then, an extensive wind
tunnel investigation has been performed at WiSt wind tunnel at Ruhr-University Bochum. Tests have
been also repeated at Criaciv wind tunnel, University of Florence. On the basis of the experiments,
CFD simulations are currently on-going.
The cross-checked wind tunnel investigation revealed new features in the design of ultra-high towers
and sometimes the use of stiffening rings resulted to be a double-edged sword. Under certain
conditions, the improvement of the structural behaviour achievable by applying rings along the height
may induce an even more severe wind load. This thesis led to the discovery of a new aerodynamic
phenomenon regarding the flow around circular cylinders, which is induced by the presence of rings
along the height. This is addressed by the paper.
2 The structural vulnerability of Solar Updraft Towers to the wind action
Solar towers are very high and slender circular cylinders, whose lower part usually turns into a
hyperboloid. Indeed, the use of the double-curvature surface allows to apply the benefits of shape
strengthening. Because of their high slenderness, solar chimneys are a sort of huge cantilever beams.
So far, it is known that the structural vulnerability of the solar tower to the wind action can be
significantly reduced by applying stiffening rings along the height. As explained in several
publications (Goldack, 2004; Backström et al., 2008; Krätzig et al., 2008/2009/2010; Lupi, 2009, 2011;
Niemann et al., 2009; Harte et al. 2010; Borri et al., 2010), the stiffening rings guarantee a beam like
behaviour at the first eigenmode, reduce ovalling deformations of the shell, increase buckling safety
and improve the distribution of internal forces. This is the same concept as for steel chimneys, which
was first investigated by Peil&Nölle (1988) and constitutes the basis of the rule in the German
Standard DIN 4133 for steel stacks.
Figure 2 shows the structural components of a solar tower (Niemann et al., 2009). The issue of
optimization of the tower regarding the number, stiffness, and placement of the ring beams was
investigated in previous studies under an equivalent static wind load (Niemann et al., 2009; Lupi,
2009). It resulted that only a minimum percentage of steel reinforcement is required in a well

6th European and African Conference on Wind Engineering 3
optimized tower design (≈ 0.3% in the meridional direction and 0.3-0.4% in the circumferential
direction, as suggested by the VGB guideline, 2010).
The presence of rings is also crucial to reduce the structural vulnerability of the tower to vortex
shedding. The first natural frequency of vibration of the tower with ten rings is about 0.17 Hz. It
corresponds to a very high critical velocity (Ucr = f1D/St = 0.17*150/0.2 = 127 m/s > 1.25 UH) which
is then not of concern in the design.
However, the aerodynamic effect of spanwise rings along cylindrical towers has never been
investigated before in the wind tunnel. The peculiar feature of ultra-high towers is the presence of
rings at a distance which is comparable to the tower diameter. Sometimes, like in Figure 2, the
distance between rings is even smaller than the diameter. Such a design condition deserves particular
attention because it leads to a bi-stable not-symmetric flow with spanwise inversion between different
compartments. It will be better explained in section 4.
Figure 2: 1000m solar chimney (courtesy of Krätzig & Partner, Bochum)
3 Wind tunnel investigation: experimental set-up
The experimental investigation is performed at the WiSt wind tunnel at Ruhr-University Bochum
(Germany) and the Criaciv wind tunnel at University of Florence (Italy).
WiSt wind tunnel at Ruhr-University Bochum is an open circuit wind tunnel with a total length of
about 17 m. The test section is 1.8 m in width and 1.6 m in height. The turbulent atmospheric
boundary layer (α ≈ 0.18) is created by three turbulent generators of Counihan type, a castellated
barrier and a roughness field consisting of wooden cubes. The engine allows to attain a maximum
wind speed of about 28-30 m/s. A Prandtl tube, placed at 1.3 m in height, allows to measure the
dynamic pressure of the incoming flow. Temperature sensors acquire temperature during the

6th European and African Conference on Wind Engineering 4
measurements. The pressure sensors are four-active-element piezoresistive bridges. The A/D converter
scans the pressures in a sample-and-hold modus, which produces simultaneous sampling of the
measurements. A sampling frequency of 2 kHz is used for the measurements.
Criaciv wind tunnel is an open-circuit wind tunnel located at Polo Universitario Città di Prato, which
is a branch of the University of Florence. The total length is about 22 m, the tunnel has a slightly
divergent shape from the inlet (in order to guarantee a constant pressure along the x-axis) and the test
section is 2.4 m in width and 1.6 m in height. The atmospheric boundary layer profile which is used in
these experiments is produced by three bigger turbulence generators and four smaller spires, followed
by roughness panels with wooden cubes. The motor – with a nominal power of 160 kW – and the fan
are placed at the end of the wind tunnel, followed by a T-shaped symmetric diffuser. The engine
allows to attain a maximum wind speed of about 30 m/s. The pressures on the tower are measured
with two different types of pressure scanners, at sampling frequency of either 250 or 500 Hz,
depending on the scanner.
The model for wind tunnel tests (Figure 3) is a circular cylinder with a free-end and aspect ratio H/D ≈
7. The cylinder is a rigid body of 1 m in height and 15 cm in diameter. In scale 1:1000, it represents a
prototype of 1 km in height. Pressure taps are placed at several levels along the height and at an
angular spacing of 20° in the circumferential direction. It is also possible to create an efflux inside the
cylinder like in a chimney, but the most interesting results presented in the paper refer to the condition
without efflux. Both external and internal pressures can be measured at each level.
The peculiarity of the model is the presence of ten circular rings along the height. They are equally
spaced along the height. In the wind tunnel scale the rings are at a distance of 10 cm. The width (w) of
the rings in the wind tunnel scale is 7 mm (w/D = 4.67*10-2
). Such rings along the model reproduce
the stiffening rings in the prototype (Figure 2).
Figure 3: Wind tunnel model
Due to the reduced scale of the model, in the wind tunnel the Reynolds number (Re,WT ≈ 3*105) is
around three orders of magnitude lower than in full-scale (Re,FS = 6*108). Therefore, surface
roughness (consisting of ribs) is applied on the model in order to attain a much higher effective Re.
The concept of effective Re is described in ESDU 74030.
A preliminary investigation on the circular cylinder (without rings) concerning the effect of surface
roughness was performed at WiSt wind tunnel in turbulent atmospheric boundary layer flow. It is
reported in Figure 4. It refers to z/H = 0.65 and plots the mean drag coefficient versus the Reynolds
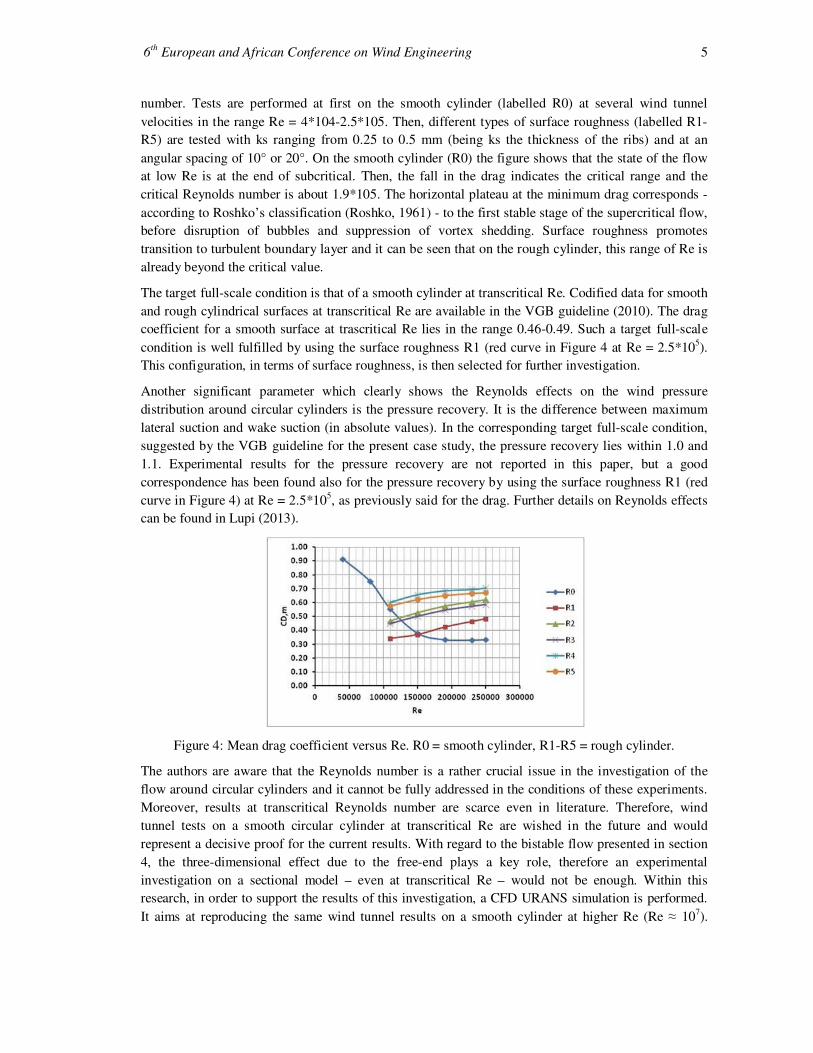
6th European and African Conference on Wind Engineering 5
number. Tests are performed at first on the smooth cylinder (labelled R0) at several wind tunnel
velocities in the range Re = 4*104-2.5*105. Then, different types of surface roughness (labelled R1-
R5) are tested with ks ranging from 0.25 to 0.5 mm (being ks the thickness of the ribs) and at an
angular spacing of 10° or 20°. On the smooth cylinder (R0) the figure shows that the state of the flow
at low Re is at the end of subcritical. Then, the fall in the drag indicates the critical range and the
critical Reynolds number is about 1.9*105. The horizontal plateau at the minimum drag corresponds -
according to Roshko’s classification (Roshko, 1961) - to the first stable stage of the supercritical flow,
before disruption of bubbles and suppression of vortex shedding. Surface roughness promotes
transition to turbulent boundary layer and it can be seen that on the rough cylinder, this range of Re is
already beyond the critical value.
The target full-scale condition is that of a smooth cylinder at transcritical Re. Codified data for smooth
and rough cylindrical surfaces at transcritical Re are available in the VGB guideline (2010). The drag
coefficient for a smooth surface at trascritical Re lies in the range 0.46-0.49. Such a target full-scale
condition is well fulfilled by using the surface roughness R1 (red curve in Figure 4 at Re = 2.5*105).
This configuration, in terms of surface roughness, is then selected for further investigation.
Another significant parameter which clearly shows the Reynolds effects on the wind pressure
distribution around circular cylinders is the pressure recovery. It is the difference between maximum
lateral suction and wake suction (in absolute values). In the corresponding target full-scale condition,
suggested by the VGB guideline for the present case study, the pressure recovery lies within 1.0 and
1.1. Experimental results for the pressure recovery are not reported in this paper, but a good
correspondence has been found also for the pressure recovery by using the surface roughness R1 (red
curve in Figure 4) at Re = 2.5*105, as previously said for the drag. Further details on Reynolds effects
can be found in Lupi (2013).
Figure 4: Mean drag coefficient versus Re. R0 = smooth cylinder, R1-R5 = rough cylinder.
The authors are aware that the Reynolds number is a rather crucial issue in the investigation of the
flow around circular cylinders and it cannot be fully addressed in the conditions of these experiments.
Moreover, results at transcritical Reynolds number are scarce even in literature. Therefore, wind
tunnel tests on a smooth circular cylinder at transcritical Re are wished in the future and would
represent a decisive proof for the current results. With regard to the bistable flow presented in section
4, the three-dimensional effect due to the free-end plays a key role, therefore an experimental
investigation on a sectional model – even at transcritical Re – would not be enough. Within this
research, in order to support the results of this investigation, a CFD URANS simulation is performed.
It aims at reproducing the same wind tunnel results on a smooth cylinder at higher Re (Re ≈ 107).

6th European and African Conference on Wind Engineering 6
These conditions are achieved in the simulation by reducing the viscosity of air. Results of the
numerical simulations will be presented in future research.
4 Results and discussion
The tests performed on the tower with ten rings revealed a surprising effect due to the compartments
created by the rings. It is a bistable flow condition, meaning that two stable states of the flow are
clearly detectable in the time histories, as it is shown in Figure 5, which plots the lift coefficient at z/H
= 0.95. The lift coefficient is obtained by integration of pressures in the across-wind direction.
Figure 5: Time history of the lift coefficient at z/H = 0.95 (WIST, Re = 2.5*105, rough cylinder R1)
Figure 5 proves that within each state of the bistable condition the mean lift is different from zero. The
existence of a not-zero mean lift force (i.e. a mean force in the across-wind direction) is due to a not-
symmetric mean pressure distribution. The result is rather astonishing, being the structure a circular
cylinder. In this regard, the cross-check of results on the same model in WiSt and Criaciv wind tunnels
is decisive to assess the physical fundamentals of the phenomenon (Figure 6).
Figure 6: Time history of the lift coefficient at z/H = 0.95 (CRIACIV, Re = 2.8*105, rough cylinder R1)
Therefore, the asymmetric mean pressure distribution, with higher suction on one side of the cylinder
(and thus non-zero mean lift force), must be considered an intrinsic characteristic of the observed case
study of the tower with rings.
By the way, the bistable flow is not a completely new phenomenon in fluid dynamics. It is well known,
for example, on smooth circular cylinders in smooth flow within the critical range of Re. In those
conditions, transition from laminar to turbulent boundary layer occurs around the separation point and
any disturbance in the flow may allow reattachment on only one side of the cylinder. Thus, the
asymmetry in the bistable flow condition is due to the formation of a laminar separation bubble on
only one side of the cylinder (Schewe, 1983). The same effect, with formation of a bubble in the wake
of the cylinder, can be hypothesized also on the solar chimney. A separation bubble on only one side
of the structure produces the asymmetric load. However, it is absolutely not a laminar separation
bubble in the classical sense, as described in literature on smooth circular cylinders. It cannot be, due
to surface roughness applied on the cylinder surface (which promotes transition to turbulence very
close to stagnation) and to turbulence of the incoming flow. Moreover, the Reynolds number of the
experiment (Re = 2.5*105) is rather high and far beyond the critical value. In addition, in the range of
Re which was possible to test in the experiments, there is not any significant dependence on Re, which

6th European and African Conference on Wind Engineering 7
may suggest disappearance of the phenomenon at higher Re. This is proved in Figure 7, which plots
the bistable mean lift coefficient as a function of the Reynolds number on the rough cylinder R1.
Figure 7: Mean bistable lift coefficient versus Re (WiSt, rough cylinder R1, z/H = 0.85)
Another typical and original feature of this new type of bistable flow is the spanwise inversion of the
asymmetry in different compartments. In other words, the sign of the bistable lift force is alternated
along the height of the cylinder. In view of the design, this has the advantage that the contribution of
the mean lift is partially balanced in the across-wind bending moments.
A more detailed description and a physical interpretation of this new type of bistable flow can be
found in (Lupi, 2013). It is now anticipated that a key role is played by the flow over the free-end,
which is responsible for reducing the Strouhal number in the tip region.
5 Conclusion
The paper presents a new aerodynamic phenomenon in the design of ultra-high towers, like Solar
Updraft Towers. It is created by ring beams along the height, when they are at a spanwise distance
which is smaller than the tower diameter. The issue of the Reynolds number has been largely
addressed in the conditions of the experiments, by relying on the concept of the effective Re.
Experiments at transcritical Re on a smooth cylinder with a free-end would represent a decisive proof.
By the way, in the Re range of the experiments, so far no reason has be found, which could suggest the
disappearance of the phenomenon at higher Re. As a further support, CFD URANS simulation at high
Re (≈ 107) are the object of current investigation. For a detailed description of the aerodynamic
phenomenon and its physical interpretation the reader should refer to Lupi (2013). It is anticipated that
a key role in the bistable phenomenon is played by the flow over the free-end, which is responsible for
reducing the Strouhal number in the tip region.
6 References
Backström von Th. W., Harte R., Höffer R., Krätzig W.B., Kröger D.G., Niemann H.-J., van Zijl
G.P.A.G., 2008. State and Recent Advances in Research and Design of Solar Chimney Power Plant
Technology, VGB PowerTech, 88, 64-71.
Borri C., Lupi F., Marino E., 2010. Optimum Shell Design of Solar Updraft Towers. Proc. 2nd Int.
Conf. Solar Chimney Power Technology, Ruhr-Universität Bochum and Bergische Universität
Wuppertal, Bochum, Germany.
DIN EN 4133 (2009). German industrial standards: Steel stack / Chimneys built of Steel.
ESDU 74030, Mean forces, pressures and flow field velocities for circular cylindrical structures:
single cylinder with two-dimensional flow, Engineering Sciences Data Unit, London.

6th European and African Conference on Wind Engineering 8
Goldack, A., 2004. Tragverhalten und Aussteifung hoher Stahlbetonrohren fuer Aufwindkraftwerke
(Load-bearing behaviour and stiffening of high-rise RC-tubes for updraft power plants). Dissertation,
University of Stuttgart.
Harte R., Graffmann M., Wörmann R., 2010. Progress in the structural design of solar chimneys,
SCPT2010, Proc. 2nd Int. Conf. Solar Chimney Power Technology, Bochum, Germany.
Krätzig W.B., Harte R., Wörmann R., 2008. Large shell structures for power generation technologies.
Proceedings of the 6th Int. Conf. IASS-IACM, Cornell University, Ithaca, NY, USA.
Krätzig W.B., Niemann H.-J., Harte R., Höffer R., 2009. Solar Updraft Power Plant with 750 m power
towers and collector diameters of 3000 m to 4000 m. Internal manual, Bochum.
Krätzig W.B., Harte R., Montag U., Woermann R., 2009. From large natural draft cooling tower shells
to chimneys of solar upwind power plants. IASS Symposium on Evolutions and Trends in Design,
Analysis and Construction of Shells. CD-Rom, University of Valencia.
Krätzig W.B., Harte R., Montag U., Graffmann M., 2010. On structural engineering problems of solar
updraft chimneys. Proc. 4th Int. Conf. Structural Engineering, Mechanics and Computation, Cape
Town, South Africa.
Lupi F., 2009. Structural behaviour, optimization and design of a solar chimney prototype under wind
loading and other actions. Master Thesis, University of Florence-Ruhr University Bochum.
Lupi F., Borri C., Krätzig W.B., Niemann H.-J., 2011. Solar Updraft Power Plant technology: basic
concepts and structural design”. In Encyclopedia Online of Life Support Systems (EOLSS) developed
under the auspices of the UNESCO, Eolss Publishers, Oxford, UK.
Lupi, F., Borri, C., Niemann, H.-J., Peil U., 2011. Non-conventional wind loading on ultra-high
Towers in Solar Updraft Power Plants, Int. Journal of shell and space structures, pp. 257-264.
Lupi F., 2013. A new aerodynamic phenomenon and its effects on the design of ultra-high cylindrical
towers, Dissertation, defended at TU Braunschweig in April 2013, in press.
Niemann H.-J., Lupi F., Höffer R., Hubert W., Borri C., 2009. The solar updraft power plant: design
and optimization of the tower for wind effects. Proceedings of the 5th European and African
Conference on Wind Engineering EACWE5, Florence, Italy.
Peil U., Nölle H., 1998. Stress distribution in steel chimneys. CICIND Proc. 6th International
Chimney Conference, 1. Brighton, England.
Roshko, A. 1961. Experiments on the flow past a circular cylinder at very high Reynolds number.
Journal of Fluid Mechanics 10 (3), 345-356.
Schewe G. 1983. On the forces acting on a circular cylinder in cross-flow from subcritical up to
transcritical Reynolds numbers. Journal Fluid Mechanics 133, 265-285.
VGB (2010) Structural design of cooling towers. Guideline VGB R 610e, VGB PowerTech, Essen.
Wie Y., Wu Z., 2012. Shed absorbability and tower structure characteristics of the Solar Heated Wind
Updraft Tower Power. Proc. 3rd Int. Conf. on Solar Updraft Power Technology SUTPT 2012, HUST,
Wuhan, China.