Embed Size (px)
Citation preview
Solar Rooftop Project Development and Net Zero Building
Company: Godrej & Boyce Mfg. Co. Ltd.
Presented By:
• Mr. Raghavendra Mirji• Mr. R. Saravanan
Agenda
• Unique Solar Rooftop Projects and Best Practices during O&M.
• Case Study on Net Zero Building
• Busduct Benefits to Solar Industry – Compact, Customized, Reliable, Low Installation time etc.
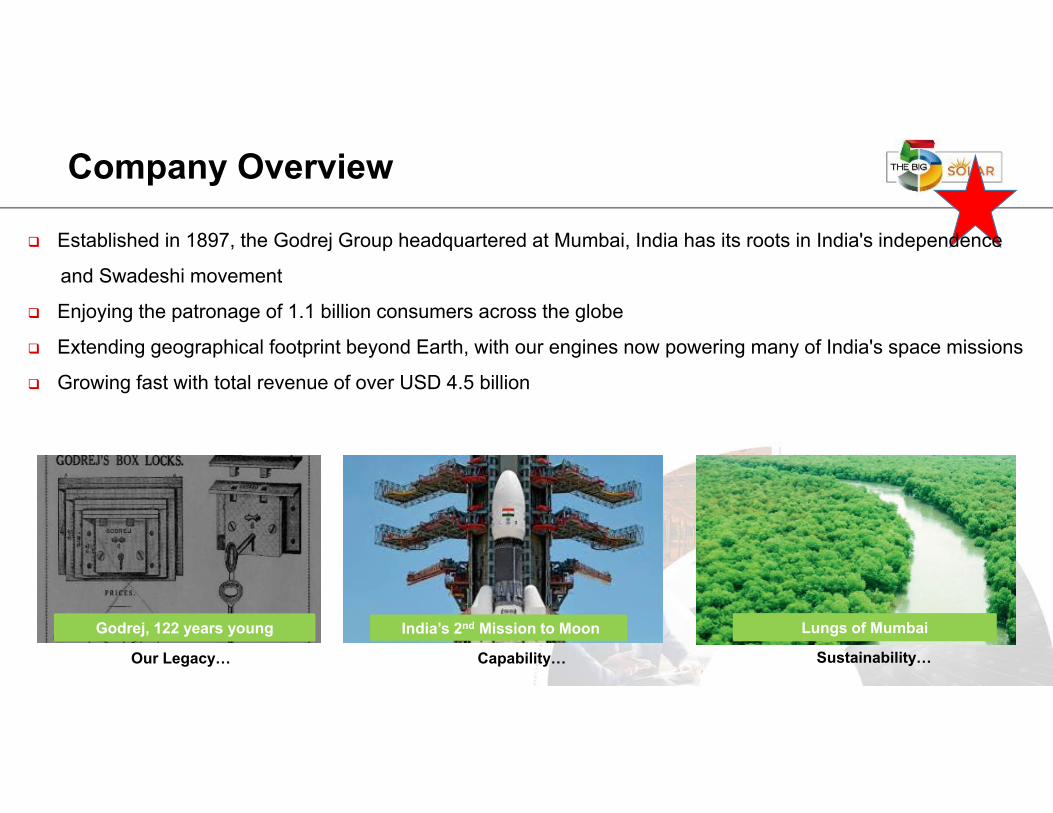
Company Overview
Established in 1897, the Godrej Group headquartered at Mumbai, India has its roots in India's independence
and Swadeshi movement
Enjoying the patronage of 1.1 billion consumers across the globe
Extending geographical footprint beyond Earth, with our engines now powering many of India's space missions
Growing fast with total revenue of over USD 4.5 billion
Our Legacy… Capability… Sustainability…
Godrej, 122 years young India’s 2nd Mission to Moon Lungs of Mumbai
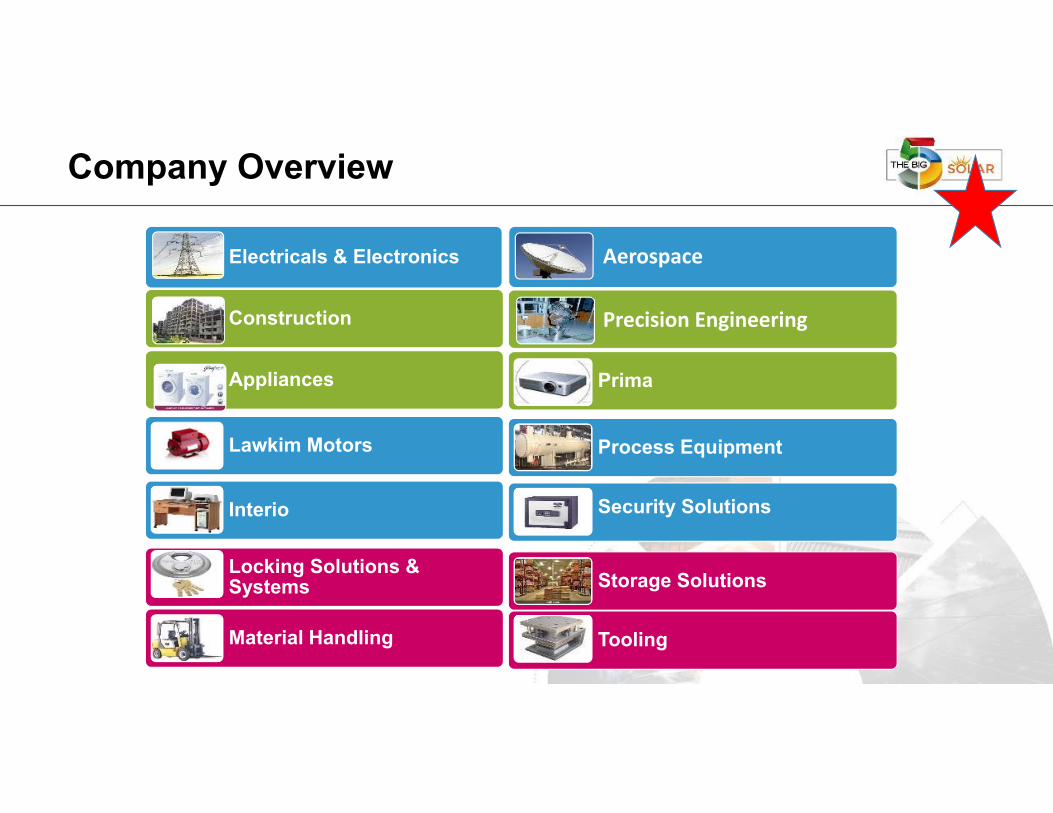
Company Overview
Appliances
Construction
Lawkim Motors
Interio
Locking Solutions & Systems
Material Handling
Precision Engineering
Electricals & Electronics Aerospace
Prima
Process Equipment
Security Solutions
Storage Solutions
Tooling
Precision Engineering
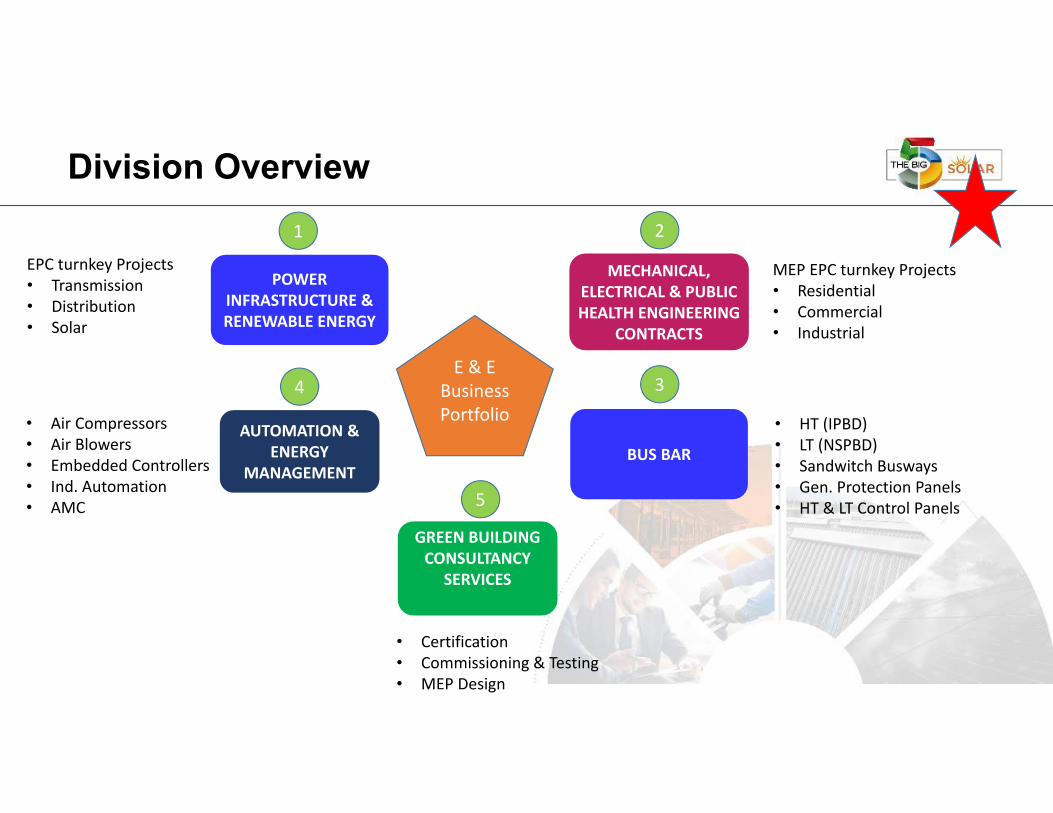
Division Overview
Precision Engineering
POWER INFRASTRUCTURE & RENEWABLE ENERGY
MECHANICAL, ELECTRICAL & PUBLIC HEALTH ENGINEERING
CONTRACTS
GREEN BUILDING CONSULTANCY
SERVICES
AUTOMATION & ENERGY
MANAGEMENTBUS BAR
E & E Business Portfolio
EPC turnkey Projects• Transmission• Distribution• Solar
MEP EPC turnkey Projects• Residential• Commercial• Industrial
• Air Compressors• Air Blowers• Embedded Controllers• Ind. Automation• AMC
• HT (IPBD)• LT (NSPBD)• Sandwitch Busways• Gen. Protection Panels• HT & LT Control Panels
• Certification• Commissioning & Testing• MEP Design
1
4
5
3
2
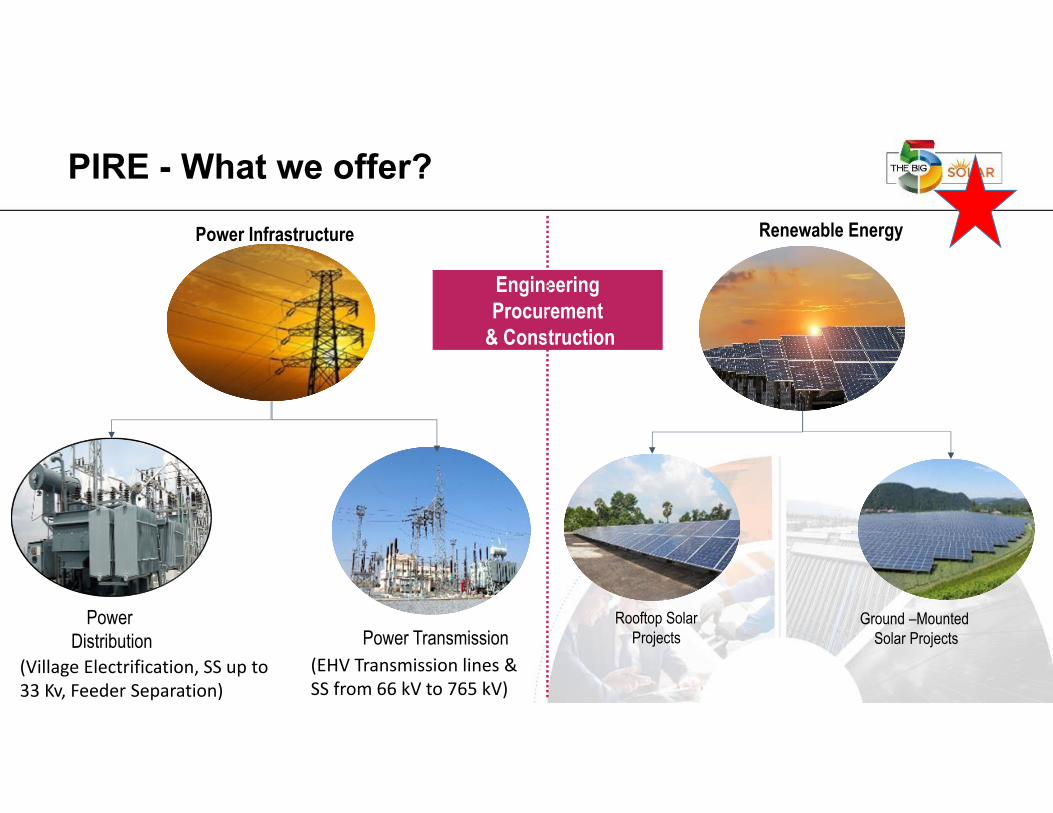
Presentation TitlePIRE - What we offer?Renewable Energy
PowerDistribution
Power Infrastructure
Power TransmissionRooftop Solar
ProjectsGround –Mounted
Solar Projects
Engineering Procurement
& Construction
(Village Electrification, SS up to 33 Kv, Feeder Separation)
(EHV Transmission lines & SS from 66 kV to 765 kV)
Presentation Title
0.00% 10.00% 20.00% 30.00% 40.00% 50.00% 60.00% 70.00% 80.00% 90.00% 100.00%
Asia Pacific
Europe & Eurasia
S. & Central America
Africa
CIS
North America
Middle East
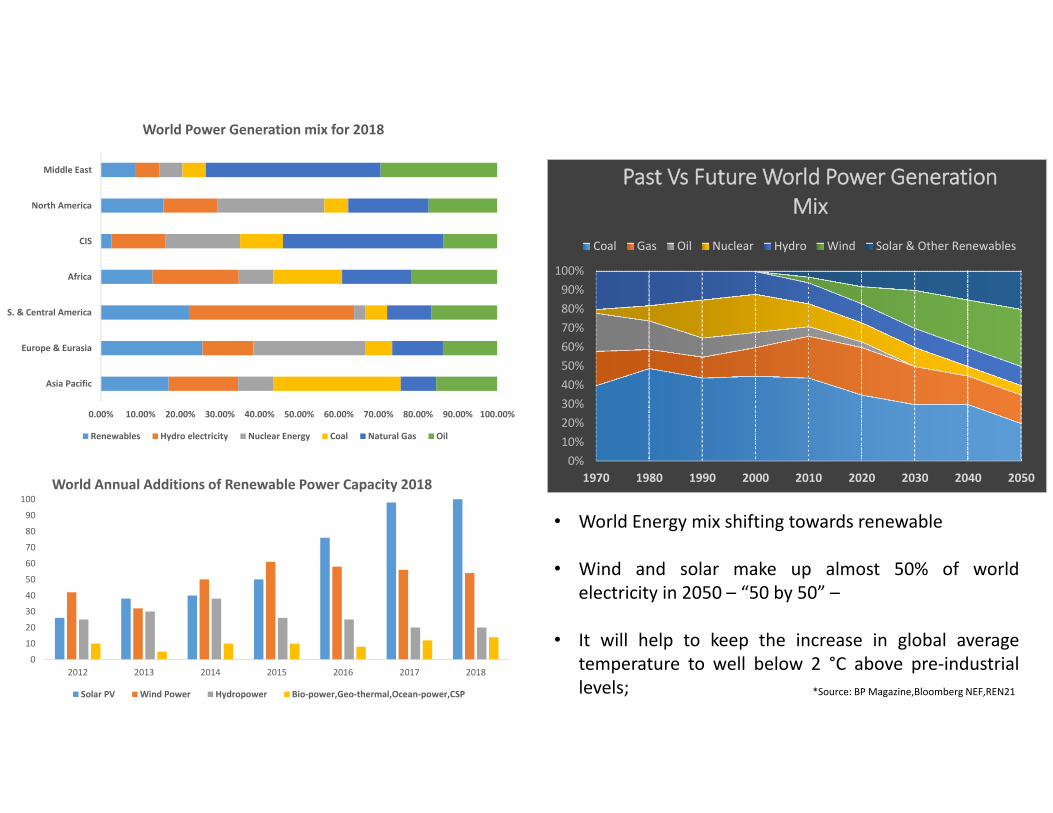
World Power Generation mix for 2018
Renewables Hydro electricity Nuclear Energy Coal Natural Gas Oil
0%10%20%30%40%50%60%70%80%90%100%
1970 1980 1990 2000 2010 2020 2030 2040 2050
Past Vs Future World Power Generation Mix
Coal Gas Oil Nuclear Hydro Wind Solar & Other Renewables
0
10
20
30
40
50
60
70
80
90
100
2012 2013 2014 2015 2016 2017 2018
World Annual Additions of Renewable Power Capacity 2018
Solar PV Wind Power Hydropower Bio‐power,Geo‐thermal,Ocean‐power,CSP
• World Energy mix shifting towards renewable
• Wind and solar make up almost 50% of worldelectricity in 2050 – “50 by 50” –
• It will help to keep the increase in global averagetemperature to well below 2 °C above pre‐industriallevels; *Source: BP Magazine,Bloomberg NEF,REN21
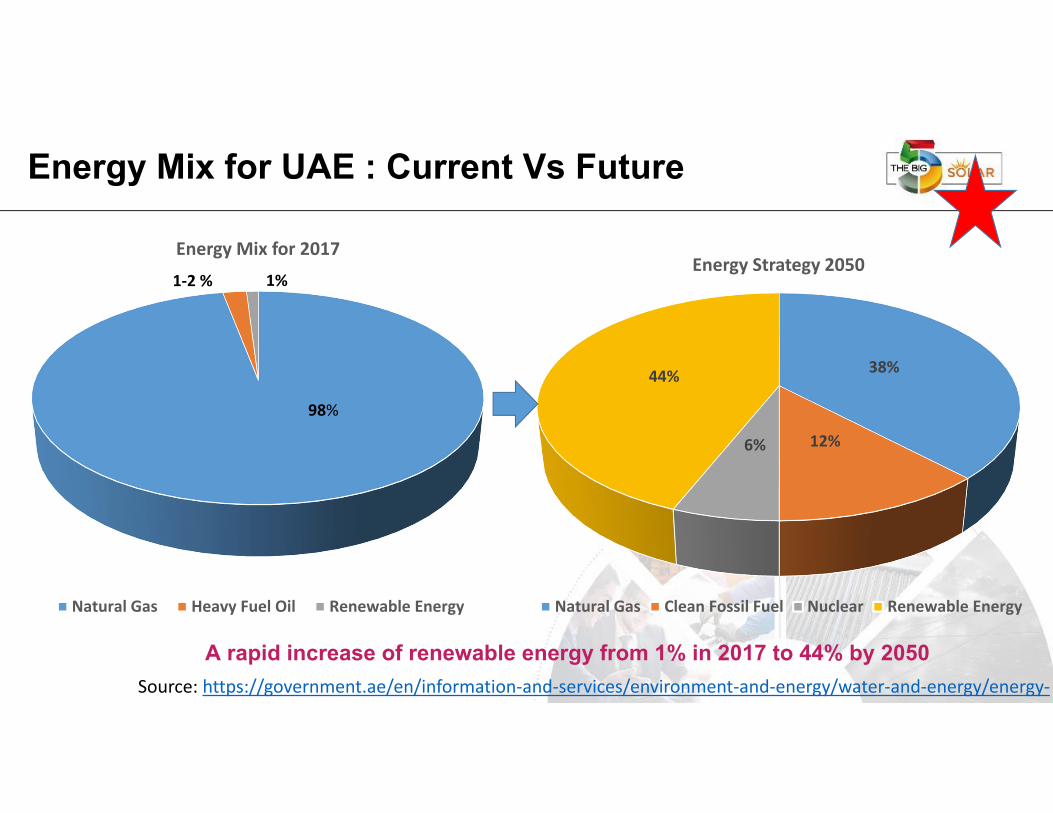
Presentation TitleEnergy Mix for UAE : Current Vs Future
38%
12%6%
44%
Energy Strategy 2050
Natural Gas Clean Fossil Fuel Nuclear Renewable Energy
Energy Mix for 2017
Natural Gas Heavy Fuel Oil Renewable Energy
98%
1‐2 % 1%
Source: https://government.ae/en/information‐and‐services/environment‐and‐energy/water‐and‐energy/energy‐
A rapid increase of renewable energy from 1% in 2017 to 44% by 2050
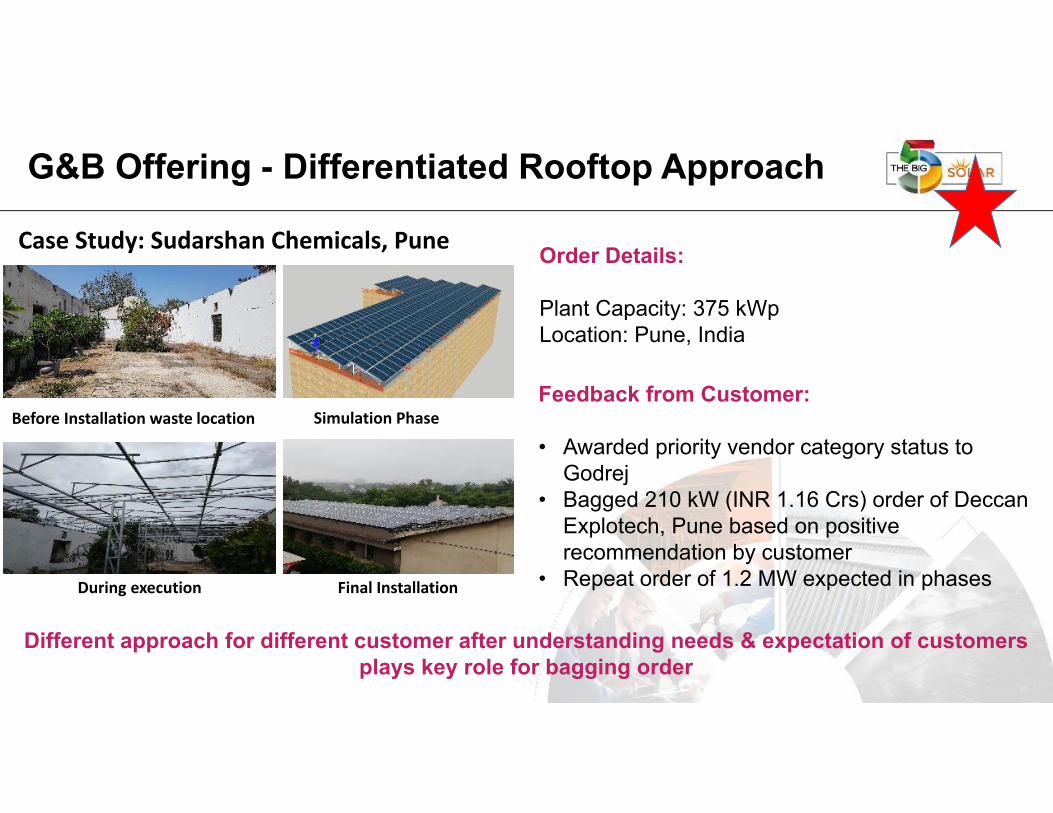
Presentation TitleG&B Offering - Differentiated Rooftop Approach
Different approach for different customer after understanding needs & expectation of customers plays key role for bagging order
Before Installation waste location Simulation Phase
Final InstallationDuring execution
Case Study: Sudarshan Chemicals, Pune
Feedback from Customer:
• Awarded priority vendor category status to Godrej
• Bagged 210 kW (INR 1.16 Crs) order of Deccan Explotech, Pune based on positive recommendation by customer
• Repeat order of 1.2 MW expected in phases
Order Details:
Plant Capacity: 375 kWp Location: Pune, India
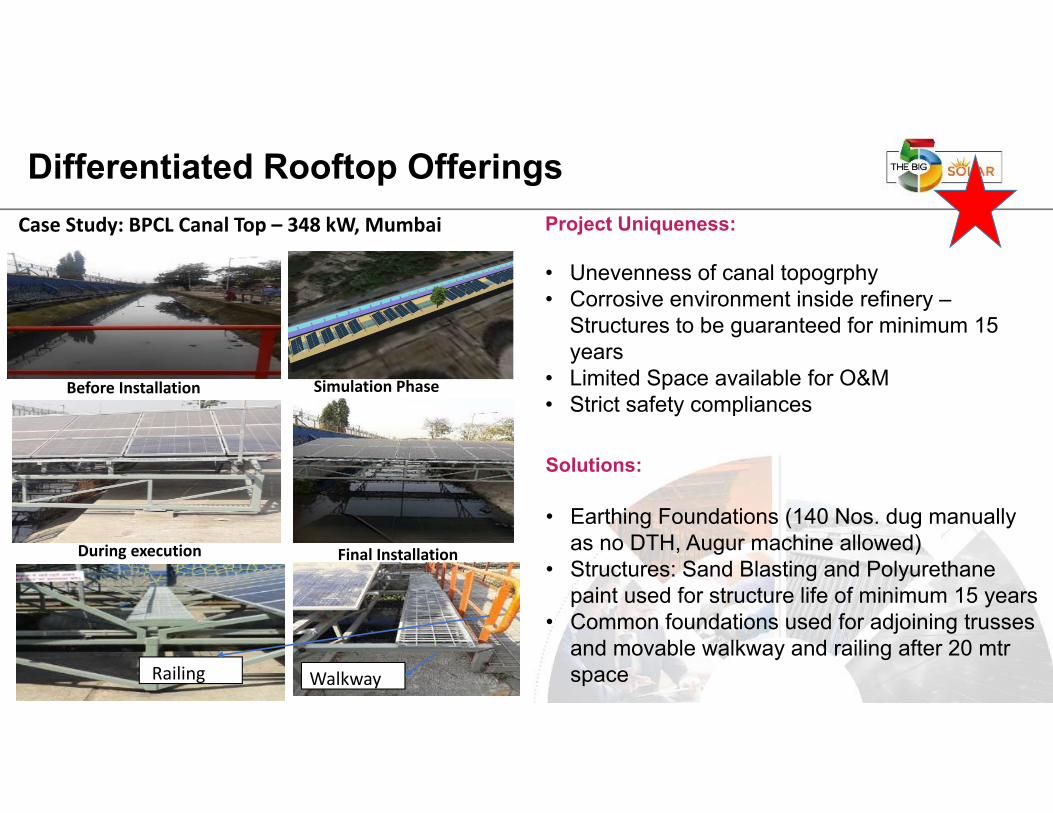
Presentation TitleDifferentiated Rooftop OfferingsProject Uniqueness:
• Unevenness of canal topogrphy• Corrosive environment inside refinery –
Structures to be guaranteed for minimum 15 years
• Limited Space available for O&M• Strict safety compliances
Before Installation Simulation Phase
Final InstallationDuring execution
Case Study: BPCL Canal Top – 348 kW, Mumbai
Solutions:
• Earthing Foundations (140 Nos. dug manually as no DTH, Augur machine allowed)
• Structures: Sand Blasting and Polyurethane paint used for structure life of minimum 15 years
• Common foundations used for adjoining trusses and movable walkway and railing after 20 mtrspace WalkwayRailing
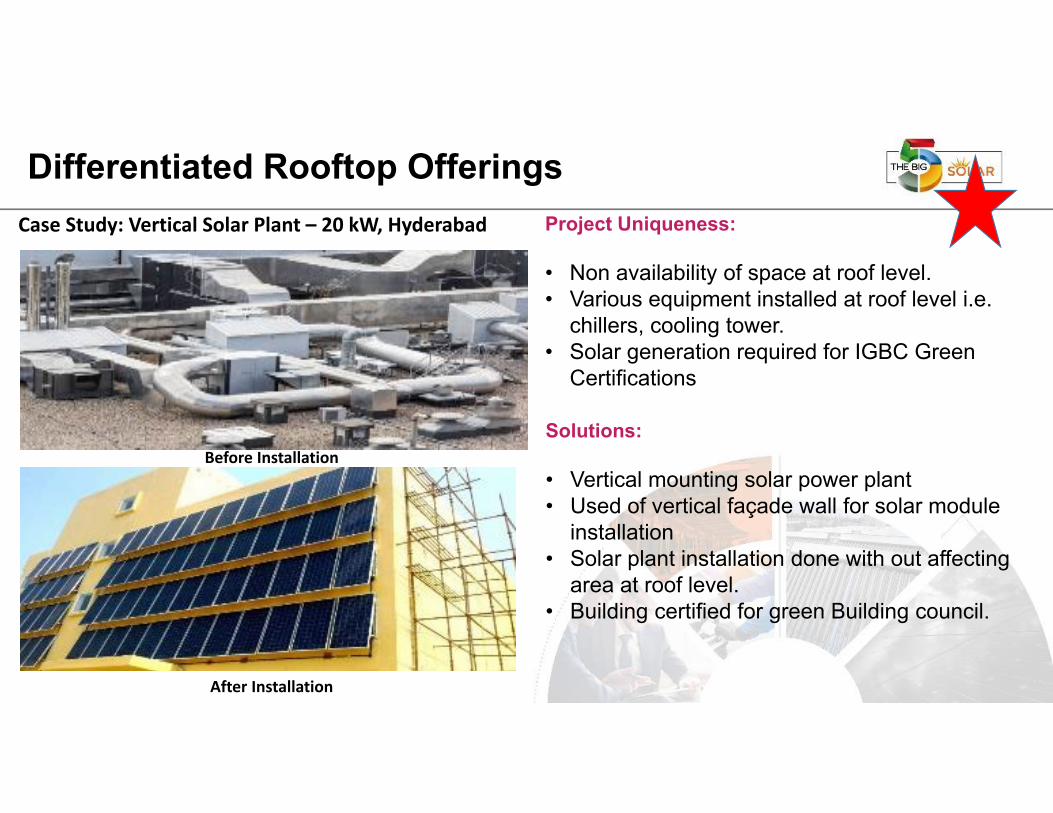
Differentiated Rooftop OfferingsProject Uniqueness:
• Non availability of space at roof level.• Various equipment installed at roof level i.e.
chillers, cooling tower.• Solar generation required for IGBC Green
Certifications
Solutions:
• Vertical mounting solar power plant• Used of vertical façade wall for solar module
installation• Solar plant installation done with out affecting
area at roof level.• Building certified for green Building council.
Case Study: Vertical Solar Plant – 20 kW, Hyderabad
Before Installation
After Installation
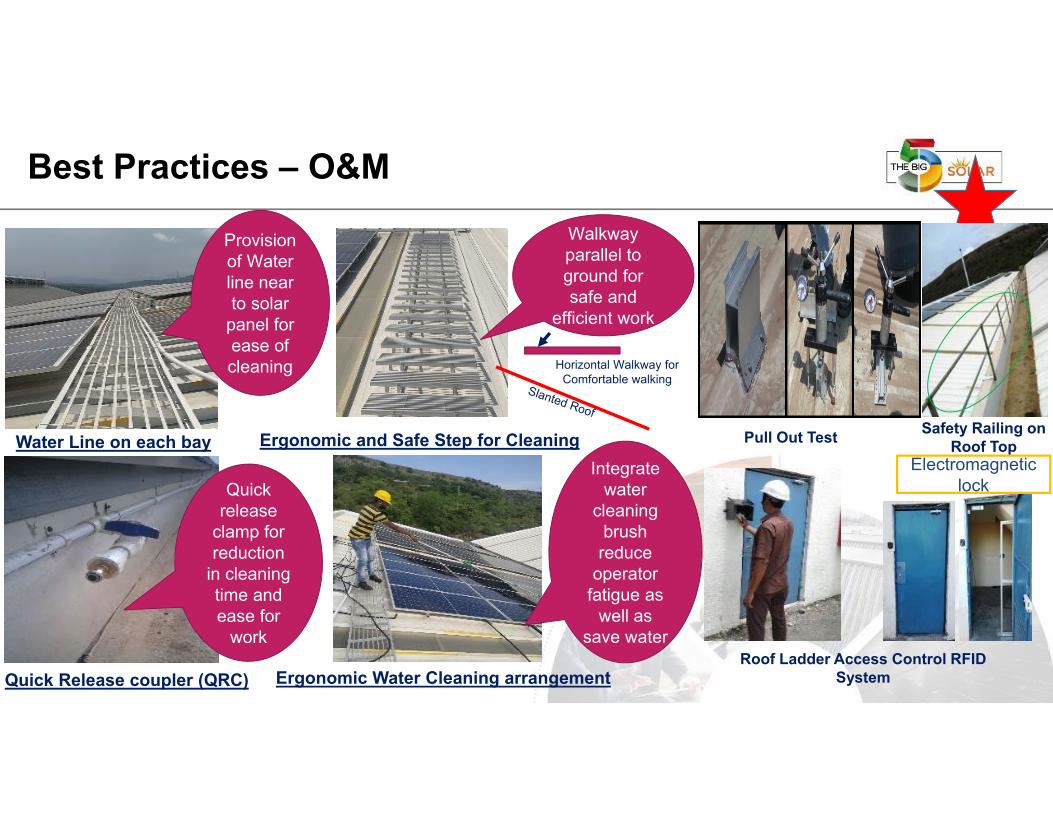
Best Practices – O&M
Provision of Water line near to solar
panel for ease of cleaning
Walkway parallel to ground for safe and
efficient work
Horizontal Walkway for Comfortable walking
Water Line on each bay Ergonomic and Safe Step for Cleaning
Quick release
clamp for reduction
in cleaning time and ease for
work
Integrate water
cleaning brush reduce
operator fatigue as
well as save water
Quick Release coupler (QRC) Ergonomic Water Cleaning arrangement
Pull Out Test Safety Railing on Roof Top
Electromagnetic lock
Roof Ladder Access Control RFID System
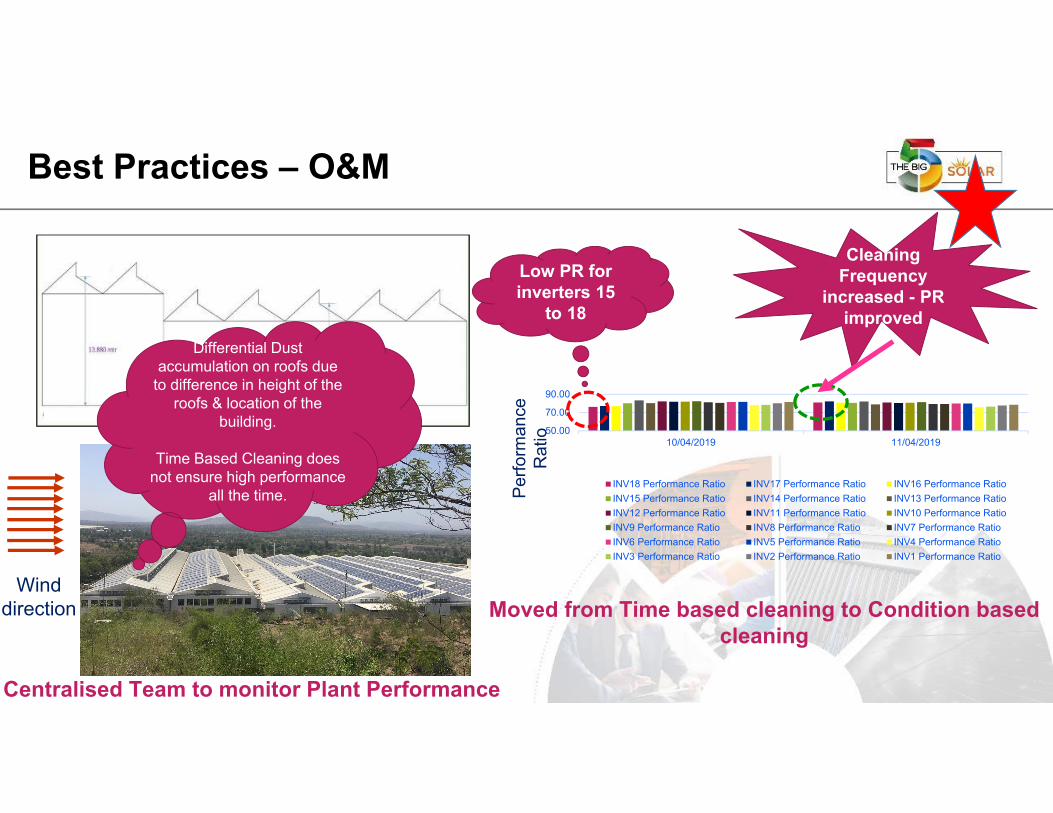
Best Practices – O&M
Wind direction
Differential Dust accumulation on roofs due
to difference in height of the roofs & location of the
building.
Time Based Cleaning does not ensure high performance
all the time.
Centralised Team to monitor Plant Performance
50.00
70.00
90.00
10/04/2019 11/04/2019
INV18 Performance Ratio INV17 Performance Ratio INV16 Performance RatioINV15 Performance Ratio INV14 Performance Ratio INV13 Performance RatioINV12 Performance Ratio INV11 Performance Ratio INV10 Performance RatioINV9 Performance Ratio INV8 Performance Ratio INV7 Performance RatioINV6 Performance Ratio INV5 Performance Ratio INV4 Performance RatioINV3 Performance Ratio INV2 Performance Ratio INV1 Performance Ratio
Low PR for inverters 15
to 18
Cleaning Frequency
increased - PR improved
Perfo
rman
ce
Rat
io
Moved from Time based cleaning to Condition based cleaning
Case Study on Net Zero Building
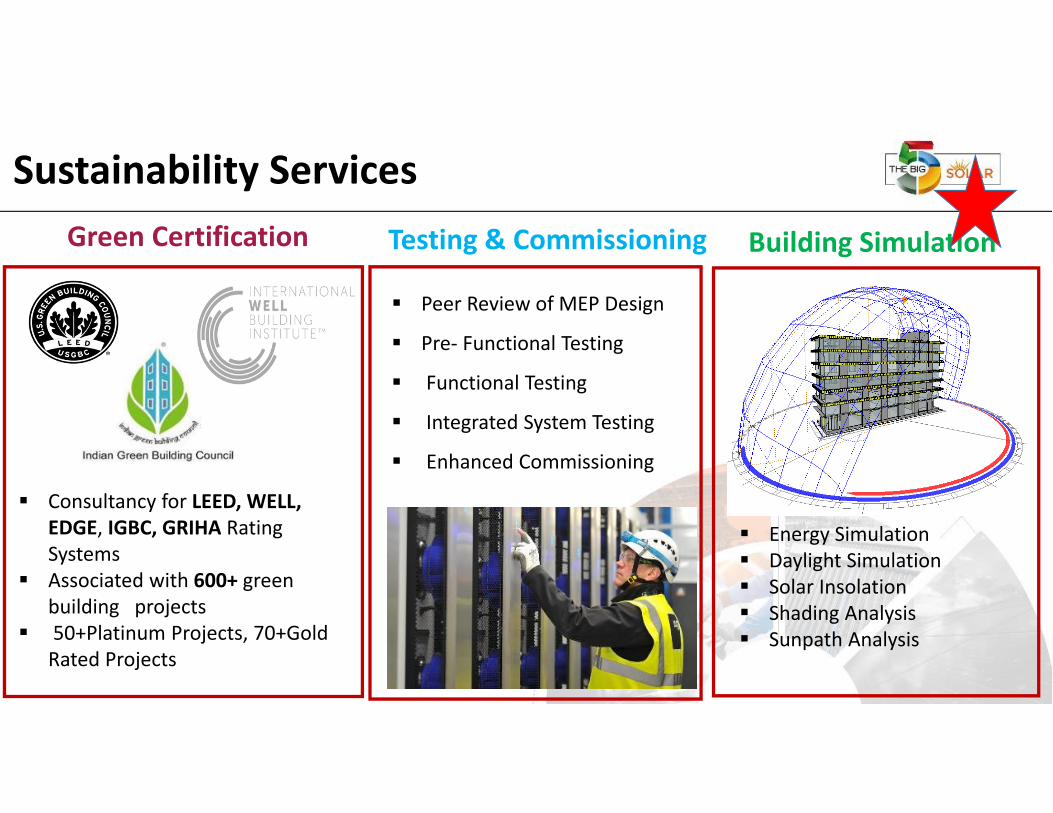
Testing & CommissioningGreen Certification
Consultancy for LEED, WELL, EDGE, IGBC, GRIHA Rating Systems
Associated with 600+ green building projects
50+Platinum Projects, 70+Gold Rated Projects
Sustainability Services
Energy Simulation Daylight Simulation Solar Insolation Shading Analysis Sunpath Analysis
Building Simulation
Peer Review of MEP Design
Pre‐ Functional Testing
Functional Testing
Integrated System Testing
Enhanced Commissioning
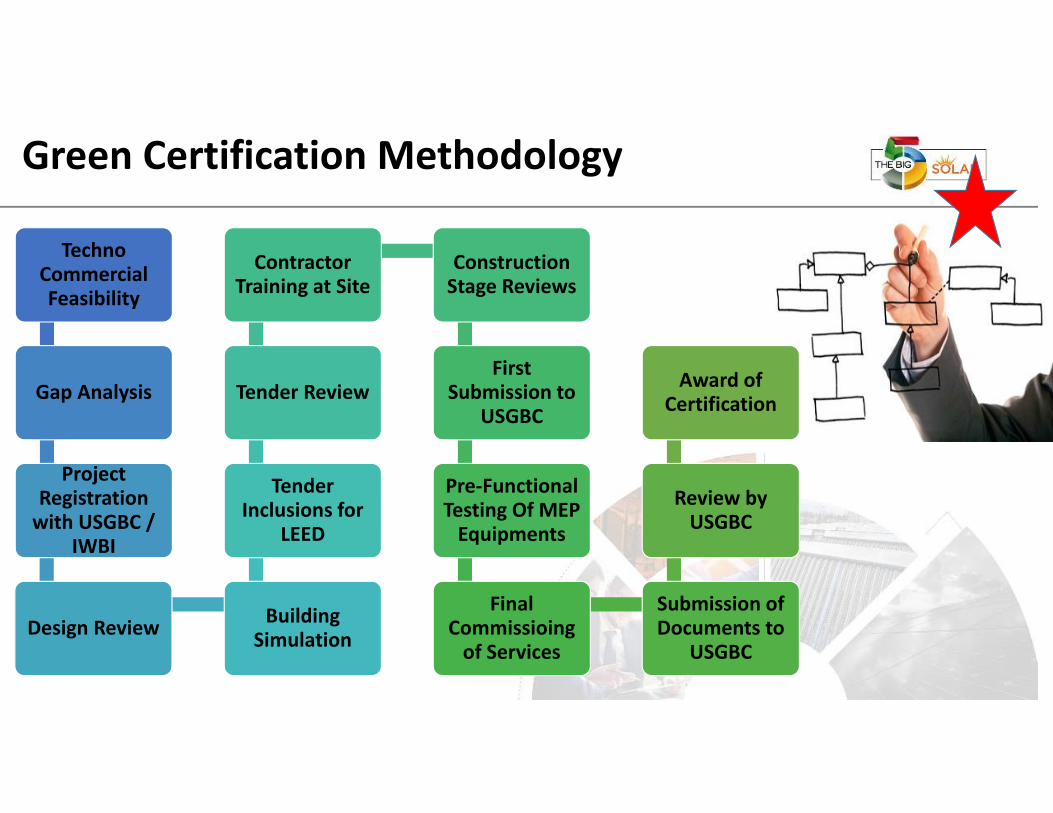
Green Certification Methodology
Techno Commercial Feasibility
Gap Analysis
Project Registration with USGBC /
IWBI
Design Review Building Simulation
Tender Inclusions for
LEED
Tender Review
Contractor Training at Site
Construction Stage Reviews
First Submission to
USGBC
Pre‐Functional Testing Of MEP Equipments
Final Commissioingof Services
Submission of Documents to
USGBC
Review by USGBC
Award of Certification
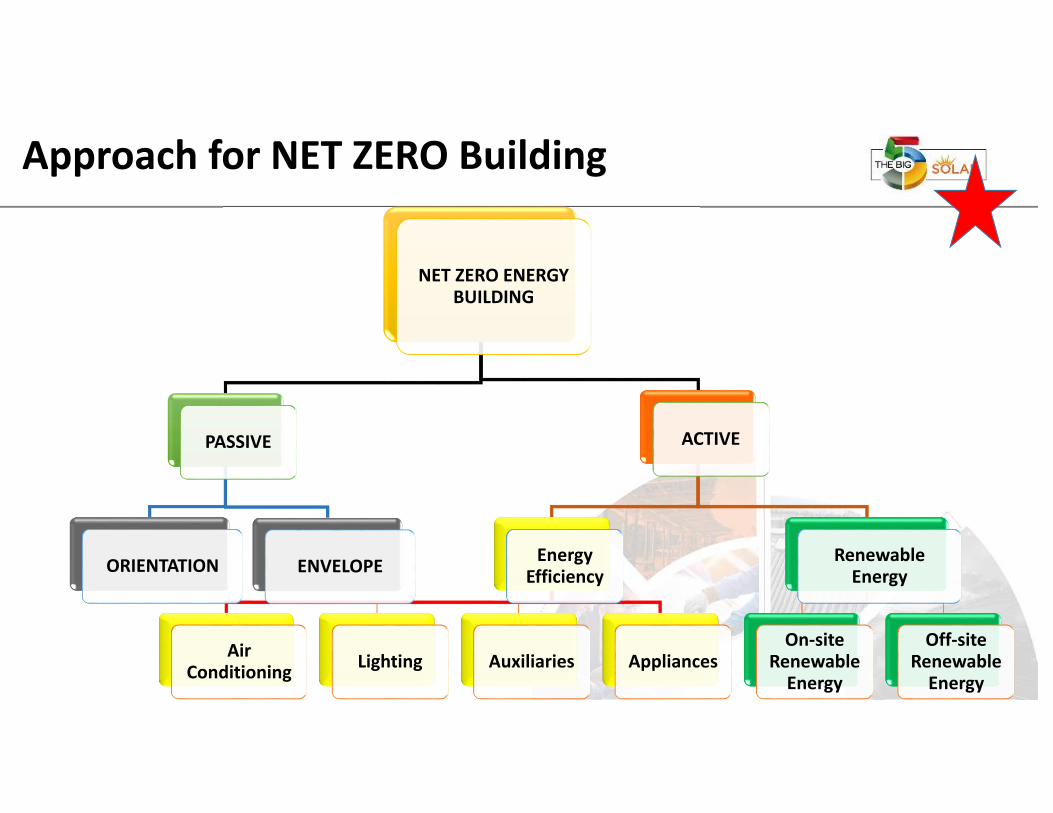
Approach for NET ZERO Building
NET ZERO ENERGY BUILDING
PASSIVE
ORIENTATION ENVELOPE
ACTIVE
Energy Efficiency
Air Conditioning Lighting Auxiliaries Appliances
Renewable Energy
On‐site Renewable Energy
Off‐site Renewable Energy
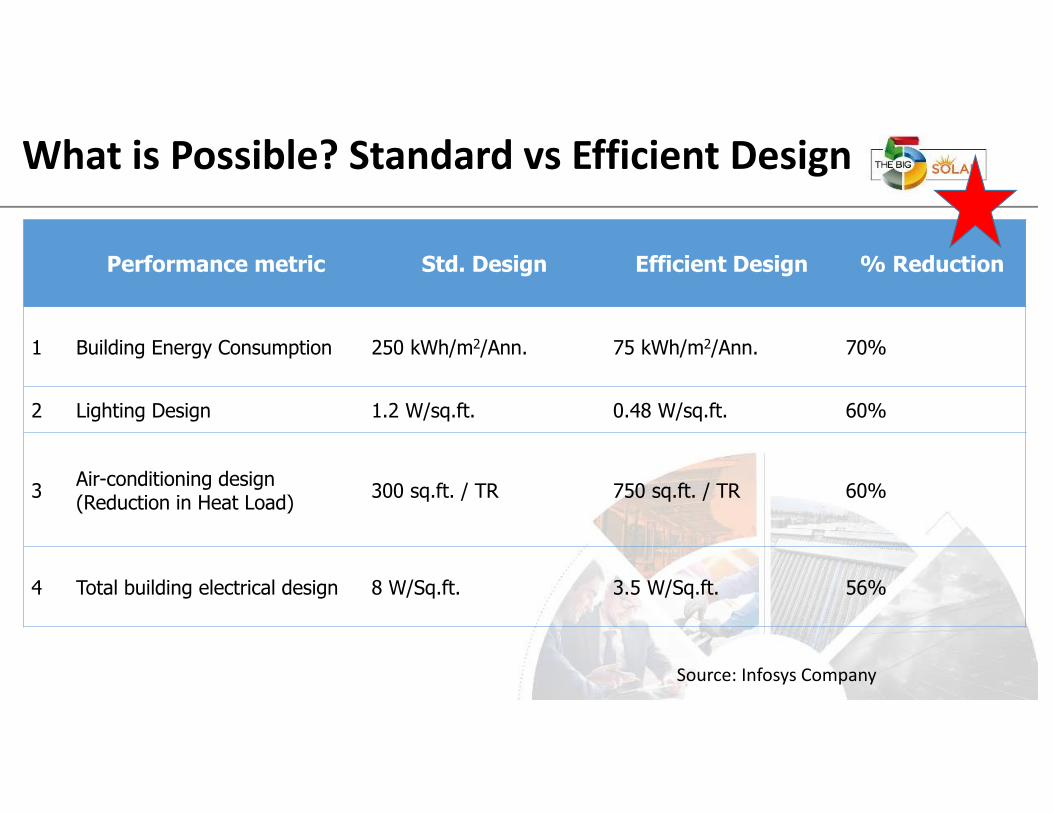
What is Possible? Standard vs Efficient Design
Performance metric Std. Design Efficient Design % Reduction
1 Building Energy Consumption 250 kWh/m2/Ann. 75 kWh/m2/Ann. 70%
2 Lighting Design 1.2 W/sq.ft. 0.48 W/sq.ft. 60%
3 Air-conditioning design (Reduction in Heat Load) 300 sq.ft. / TR 750 sq.ft. / TR 60%
4 Total building electrical design 8 W/Sq.ft. 3.5 W/Sq.ft. 56%
Source: Infosys Company
19
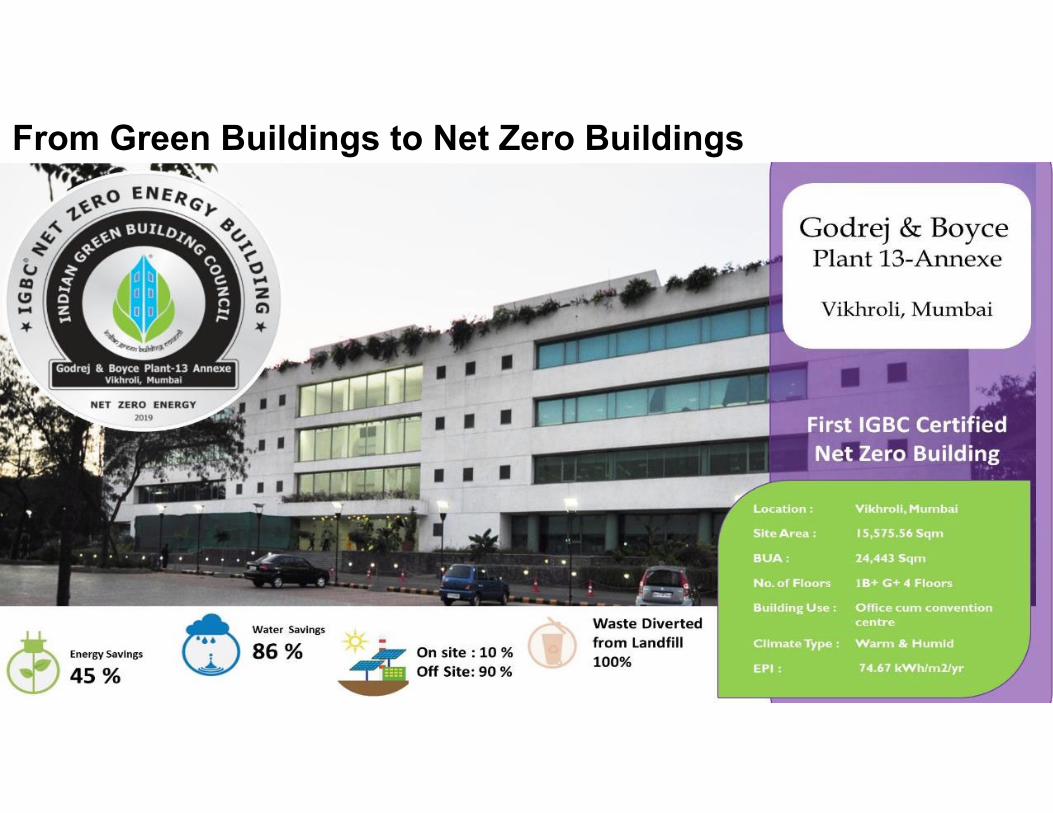
From Green Buildings to Net Zero Buildings
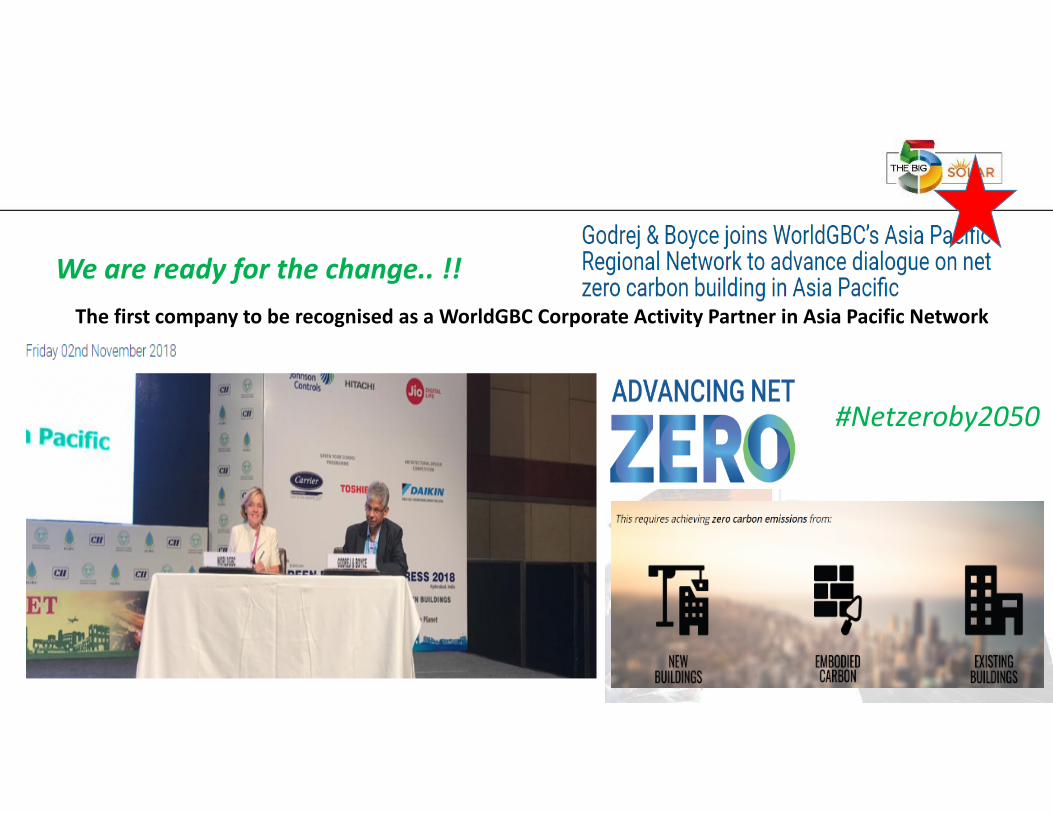
The first company to be recognised as a WorldGBC Corporate Activity Partner in Asia Pacific Network
We are ready for the change.. !!
#Netzeroby2050
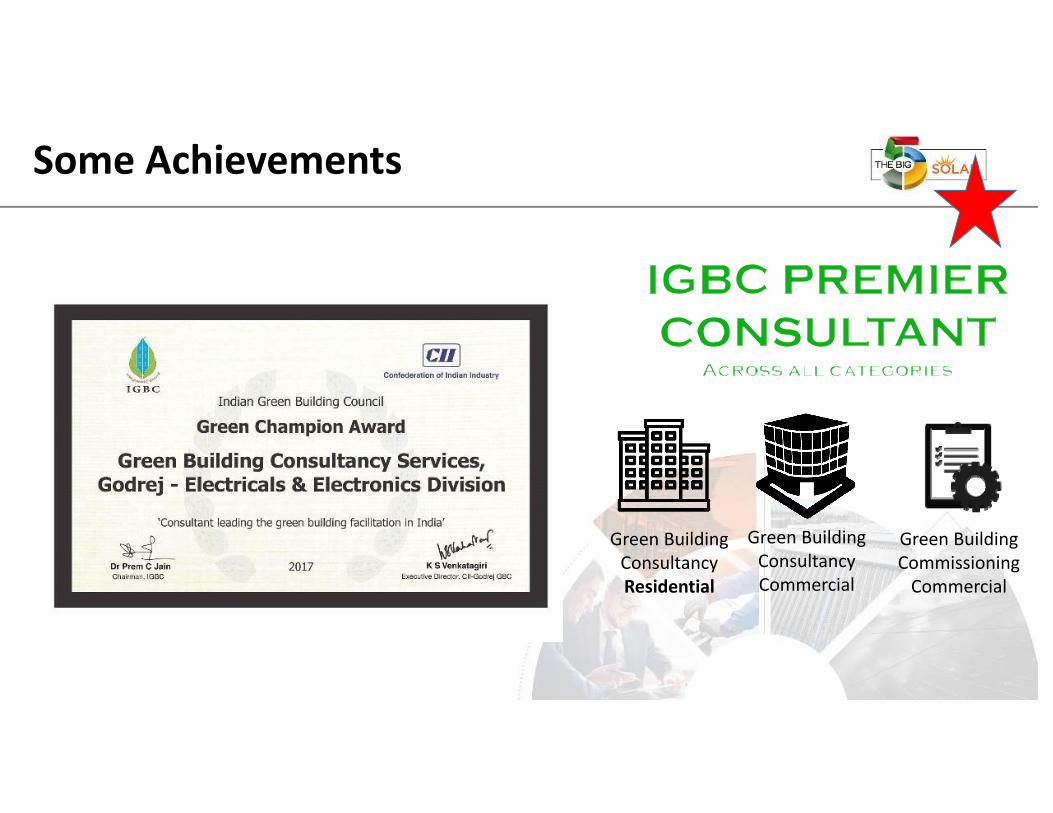
Some Achievements
Green Building ConsultancyResidential
Green Building ConsultancyCommercial
Green Building CommissioningCommercial

Our International Clients
If not NOW....WHEN?If not EARTH.....WHERE??If not YOU....WHO???
GO GREEN !!!
THANKS