Embed Size (px)
Citation preview

SOLAR PV: POLICY, MARKET &
INDUSTRY IN MALAYSIA
7th April 2018
Presented by Gladys Mak ([email protected])
Director, Feed-in Tariff Division
Sustainable Energy Development Authority (SEDA) Malaysia
50th Task 1 Meeting, Pullman Hotel, Kuching, MALAYSIA

POLICIES DRIVING THE
SOLAR PV MARKET IN
MALAYSIA
50th Task 1 Meeting, Pullman Hotel, Kuching, MALAYSIA

Policies in Support of the PV Market in Malaysia
• Capital subsidy under UNDP-GEF Malaysia Building
Integrated PV (MBIPV) Project (2006-2010) (quota 1
MW);
• Feed-in Tariff (FiT) with quota offered on 1st December
2011 and the last quota offered for Solar PV was in 2017,
except for the MySuria* programme;
• Net Metering (NEM) launched in November 2016 with a
proposed cumulative quota of 500 MW upto 2020;
• Large Scale Solar (LSS) introduced in 2016 with a
proposed quota of 1,200 MW upto 2020.
*Note: MySuria is a special programme by the GoM for a specialised group of
citizens (B40) to be implemented in 2018

RE Connected to the Grid (as of 31/12/17)
under the Feed-in Tariff
No. RE Resource Accepted (MW) Approved (MW) Connected to the
Grid (MW)
1 Biogas 268.93 220.86 55.83
2 Biomass 592.65 396.19 87.90
3 Small Hydropower 640.44 538.48 30.30
4 Geothermal 37.00 37.00 -
5 Solar Photovoltaic 523.10 440.19 354.03
• Individual 108.05 98.43 75.89
• Community 18.97 11.60 5.28
• Non-Individual (≤ 500 kW) 128.03 101.63 67.83
• Non-Individual (>500 kW) 268.05 228.53 205.03
Total 2,071.69 1,632.72 528.06

NEM – Net Metering
Total Cum. Capacity in 2017: 5.25 MW
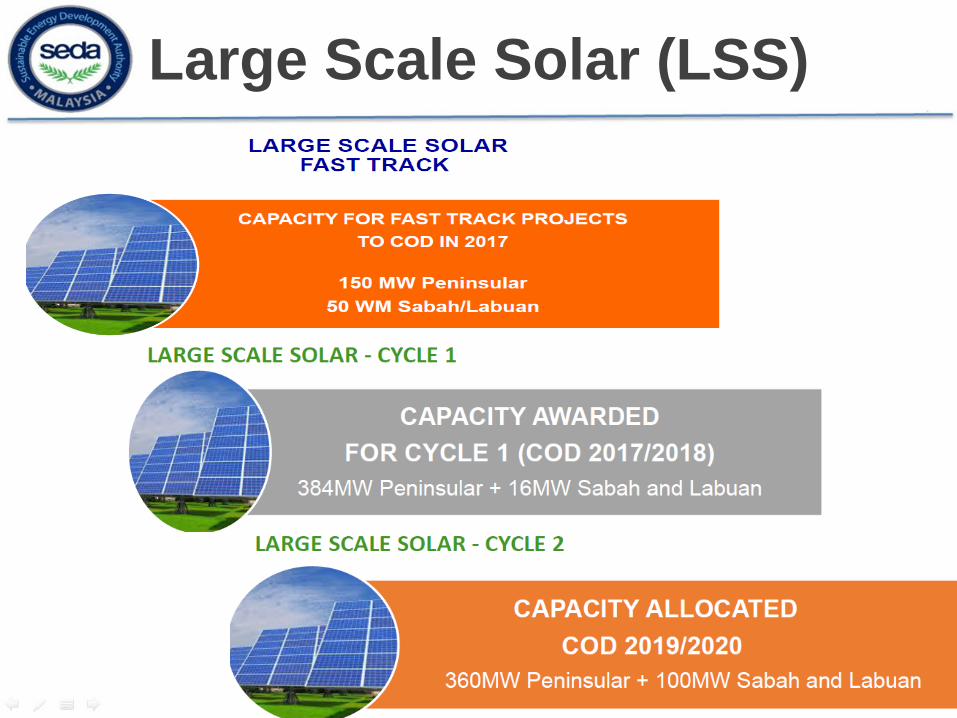
Large Scale Solar (LSS)
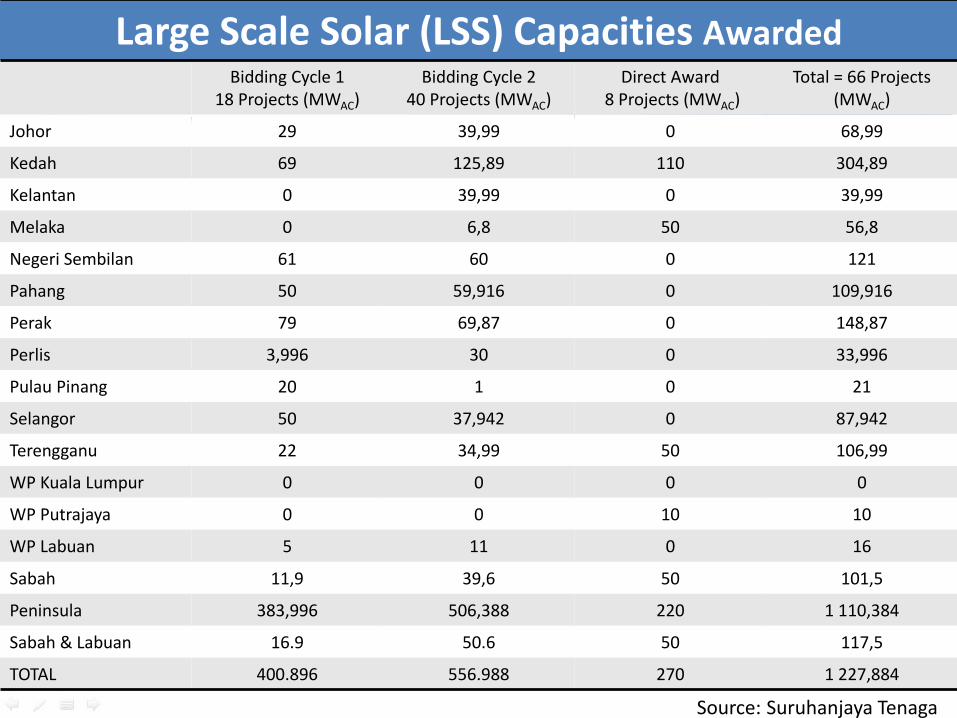
Large Scale Solar (LSS) Capacities AwardedLarge Scale Solar (LSS) Capacities AwardedBidding Cycle 1
18 Projects (MWAC) Bidding Cycle 2
40 Projects (MWAC)Direct Award
8 Projects (MWAC)Total = 66 Projects
(MWAC)
Johor 29 39,99 0 68,99
Kedah 69 125,89 110 304,89
Kelantan 0 39,99 0 39,99
Melaka 0 6,8 50 56,8
Negeri Sembilan 61 60 0 121
Pahang 50 59,916 0 109,916
Perak 79 69,87 0 148,87
Perlis 3,996 30 0 33,996
Pulau Pinang 20 1 0 21
Selangor 50 37,942 0 87,942
Terengganu 22 34,99 50 106,99
WP Kuala Lumpur 0 0 0 0
WP Putrajaya 0 0 10 10
WP Labuan 5 11 0 16
Sabah 11,9 39,6 50 101,5
Peninsula 383,996 506,388 220 1 110,384
Sabah & Labuan 16.9 50.6 50 117,5
TOTAL 400.896 556.988 270 1 227,884
Source: Suruhanjaya Tenaga

Completed LSS Projects in 2017
Source: Photo courtesy of Suruhanjaya Tenaga
Total Capacity Commissioned in 2017: 14.43 MW (12 MWAC)

The MySuria Programme
**The Honorouble PM’s Announcementin the 2017 Budget Speech for a specialSolar PV programme called “MySuria” for qualified and selected B40 Citizens** all over Malaysia
** 1 620 houses with 3 kW installed capacity under the Feed-in Tariff mechanism in 2017-18
SOLA PV INDUSTRY IN MALAYSIA:
UPDATES
50th Task 1 Meeting, Pullman Hotel, Kuching, MALAYSIA

Solar PV Industry (as of 2017)
Manufacturers (Silicon feedstock /ingots)
Process & technology
Nameplate Capacity
Elpion Si Metal Si 33,4 tonnes
Tokuyama 1 Poly-Si 20 tonnes
COMTEC 2 mc-Si ingots 124 MW[1]Sold to South Korea’s OCI Co Ltd in 2017 [2] In early 2017, LONGI agreed to buy over COMTEC Malaysia.
• In 2017, a steady growth was reported for the solar PV industry in Malaysia; captured in MIDA’s “Malaysia Investment Performance Report 2017”
• Over 90 % of the PV products were exported to Europe, US and Asia.
In 2016:
Manufacturers for SiliconProcess &
technologyNameplate Capacity
OCIM Sdn Bhd Poly-Si 9,8 kilo ton
In 2017:

Source: www.pv-tech.org
In 2018, the strategy for polysilicon by OCI:

Ingot/Wafer/Cell Technology
Production capacity (MW/yr)
20172018
(estimated)
1. Longi Ingot 1 000 1 000
Wafer (p-typemono)
1 000 1 000
TOTAL 2 000 2 000
1. Longi Cell (mono-Si) 600 650
2. Sunpower1 N-type mono-Si
826,4 764,4
3. Hanwa Q-Cells P-type mc-Si 1 600 1 800
4. TS Solartech Mono & mc-Si 240 240
5. Jinko Solar mc-Si 1 500 1 500
6. JA Solar mc-Si 1 000 1 000
TOTAL 5 766,4 5 954,4
[1] SunPower took over its joint venture (JV)solar cell manufacturing operations inMalaysia from Taiwan-based partner AUO, asubsidiary of AU Optronics Corporation at acost of US$170 million in 2016

Module manufacturer Technology
Module Production Capacity (MW/yr)
20172018
(estimated)
1. Hanwha Q-Cells P-type mc-Si 1 600 1 8002. Longi 600 9003. Jinko Solar mc-Si 1 300 13004. Flextronics c-Si 513 4735. Panasonic HiT mono-Si 469 3706. MSR Mono & mc-Si 100 1207. PV HiTech mc-Si - 38. Promelight Mono & mc-Si 100 1009. Solartif mc-Si 0,7 1
Sub-Total 4 682,7 5 067
Thin film manufacturers 20172018
(estimated)1. First Solar CdTe 2071 2344Grand Total 6 753,7 7 411

Report downloadable here: http://www.mida.gov.my/home/malaysia:-investment-performance/posts/

Key Findings on the Contribution of the Solar Industry to the Malaysian Economy


THE FEED-IN TARIFF
Impact and Outcomes

0
100
200
300
400
500
600
20102011
20122013
20142015
20162017
Cumulative Growth of Grid-Connected RE
SolarPhotovoltaic
Biomass
Biogas
Small Hydro
Geothermal
Capacity (MW)
Year
BASELINE: SREP & MBIPV
Impact 1: Increase in Grid Connected RE
58.798.44
64.45
331.67
147.93
420.94
528.26
243.36

0.00
5,000.00
10,000.00
15,000.00
20,000.00
25,000.00
30,000.00
35,000.00
2005 2006 2007 2008 2009 2010 2011 2012 2013 2014 2015 2016
31,410.00
27,550.00
23,190.0022,410.00
20,440.0019,120.00
11,000.00
9,000.00
7,500.008,500.00
7,790.008,038.00
0 0 0 0 0 0 0 0 0
80006830 6674
SOLAR INDIVIDUAL
SOLAR NON-INDIVIDUAL
Cost (MYR)/kW
Year
BASELINE: MBIPV PROJECT
Impact 2: Reduction in Costs of PV
Systems

2 2
24.93
73.3
160.03
224.74
284.35
0
50
100
150
200
250
300
2010 2011 2012 2013 2014 2015 2016
SolarPhotovoltaic
19,120.00
11,000.00
9,000.00
7,500.008,500.00
7,790.00 8,038.00
Capacity (MW)
Year
Cost (MYR)/ kW
GROWTH OF INSTALLED CAPACITIES VS SYSTEM COST 2010 - 2016
Reduction in Costs of PV Systems
with Increase in Installed Capacities

Impact 3: Increase in Renewable
Energy Jobs
SolarPhotovoltaic
Biomass
Biogas
Small Hydro
Geothermal
2000 40000 6000 27,000
27,908
6,840
4,127
4,187
555
Total Employment
43,617
*Based on figures submitted to IRENA and includes the service sectors and manufacturing

Evolution of Renewable Energy
Employment 2011 - 2017
SolarPhotovoltaic
Biomass
Biogas
Small Hydro
Geothermal
Total Employment*
25,424 Year
No. of Jobs
*Jobs Created Directly from the Generation of RE under the FiT Mechanism
-
5,000
10,000
15,000
20,000
25,000
30,000
2011 2012 2013 2014 2015 2016 2017
- - - - 555 555 555 931 1,726 1,965 3,938
4,487 4,187 4,217 312
513 653
2,492
3,538 4,127 4,144
1,989
4,389 4,005
6,837
7,740 6,840 6,405
1,923
4,224 4,797
5,686
7,941 9,913 10,103

Impact 4: Human Capital Development
Since 2012
GCPV: Grid-connected PhotovoltaicOGPV: Off-grid PhotovoltaicCDP: Continuous Development Program
31
29
3
13
17
GCPV DesignCourse
GCPV for Wiremen& Chargeman
OCPV for Wiremen& Chargeman
CDP for GCPV Design
Solar PV Installation & Maintenance
Course
Training Modules Organized by SEDAIn Renewable Energy
Publications
Total Training Sessions: 93Total Publications: 9

Impact 5: Number of Workforce
Certified Since 2011
157
253 256
469
502531 535
0 0
41
126
210
275 284
0 0 0 5
93
168 168
21 27 27 27 32 39 42
0
100
200
300
400
500
600
MBIPV/2011 2012 2013 2014 2015 2016 2017
GCPV Designer Wireman/Chargeman PV Installer OGPV DesignerNo. of Skilled Workers
Year
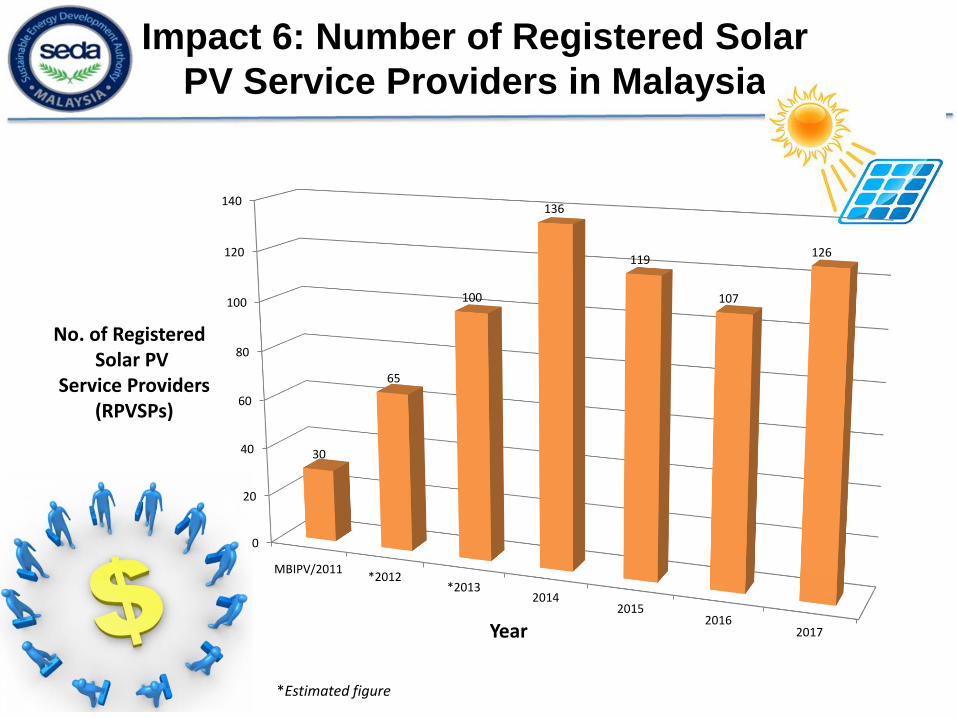
Impact 6: Number of Registered Solar
PV Service Providers in Malaysia
No. of Registered Solar PV
Service Providers(RPVSPs)
Year
0
20
40
60
80
100
120
140
MBIPV/2011*2012
*20132014
20152016
2017
30
65
100
136
119
107
126
*Estimated figure

Impact 7: Domestic/International
Recognition of our RPVSPsMalaysian Service Provider DitrolicSolar being awarded a 50MW project in Bangladesh
Recipient of a Sin Chew Award
Recipient of a Frost & Sullivan Excellence Award 2013

Impact 8: Impact of the FiT Bonus for
Local Assembly on the PV Industry
RE developers enjoy a 5 sen/kWh FiT bonus rate on top of their basic FiT rate for using locally produced/assembled modules. This has led to an increase in production capacity among PV manufacturers.
28.49 39.51 50.74454.84
2521.57
4369.93
5482.58
6286.18
0
1000
2000
3000
4000
5000
6000
7000
8000
2014 2015 2016 2017 (estimate)
Production of PV Module
Year
Production Volume
(MW)
Export market Local Market
*Statistics based on seven (7) PV module manufacturers surveyed in 2017

3%97%
28.49 39.51 50.74
454.84
0
50
100
150
200
250
300
350
400
450
500
2014 2015 2016 2017 (estimate)
However, since the local recognitioninitiative began in 2014, there is asteady stream of uptake in the localmarket.
With LSS, more production for localmarket is expected for 2017.
Export market accounts for 97% share PV module sales order
Local Market accounts for only 3% share of PV module sales order
Production of PV Module For Local Market
Year
Production Volume (MW)
Between 2014 and 2017, it is estimated that 97 % of all PV
modules assembled in Malaysia were exported for
the overseas market.
Impact 9: Impact of the FiT Bonus on
the Local Market from the PV Industry

MALAYSIA’S LANDSCAPE TODAY
A Gallery of Pictures
Of RE Plants under the
FiT Mechanism and LSS

Solar PV Installations In Malaysia
32
685kWp, Suria KLCC Sdn Bhd,
Kuala Lumpur
13.0MWp, Cypark Suria Sdn Bhd, Pajam, Negeri Sembilan
646kWp, Robert Bosch (M) Sdn Bhd, Bayan Lepas
470kWp, Maglo Steel Service Centre, Shah Alam

Transformation of Land to Solar Farm
5.3MWp (2013)Selasih Mentari Sdn BhdKuala Kawah, Negeri Sembilan

Solar Farm – Ground Mounted
Fortune 11 Sdn Bhd,
Solar Farm with Single Axis
Tracker 5 MWp
at Sepang, Selangor

Solar Farm – Ground Mounted
Amcorp Power Sdn Bhd,
10.25MWp at Gemas,
Negeri Sembilan

Solar Farm – with BIPV Application
1MWp, TTL Energy Sdn Bhd, Papar, Sabah
Solar Farm (BIPV) – Agriculture (Yam cultivation)

Solar Farm – with BIPV Application
1MWp, Green Leadership, Keningau, Sabah
Solar Farm (BIPV) – Aquaculture : Fish Cultivation
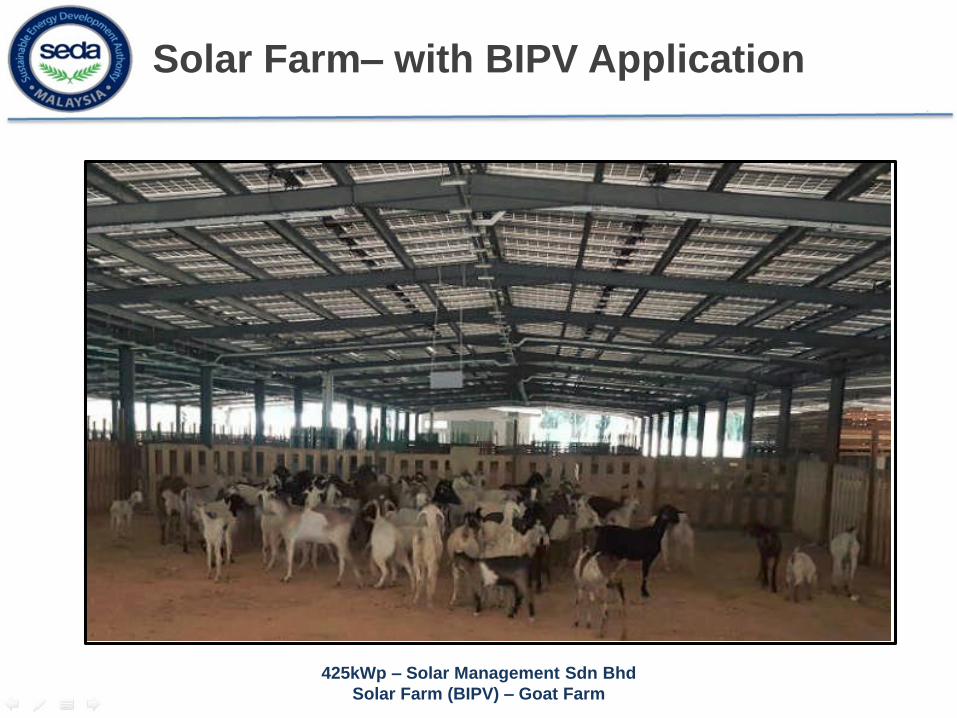
Solar Farm– with BIPV Application
425kWp – Solar Management Sdn Bhd
Solar Farm (BIPV) – Goat Farm

Solar PV - Retrofit
646kWp, Bayan Lepas, Pulau Pinang

Solar PV - Retrofit
180kWp, Lokkawi, Sabah

Solar PV in Government Buildings
Ministry Of Energy, Green Technology & Water
Malaysia Greentech Corporation
Ministry Of Agriculture
Energy Commision Headquarters

Solar PV – Residential (3 – 12kWp)

Solar PV – Residential (3 – 12kWp)

Solar PV – Community Quota

Solar PV – Community Quota
Community Rehabilitation Centre, Ranau (24kWp)

Some Photos Showing On-going LSS
Projects
Source: Photo courtesy of Suruhanjaya Tenaga

Disclaimer
The information contained in this PowerPoint slides is for general purposes only. While the
Sustainable Energy Development Authority Malaysia (“SEDA Malaysia”) endeavours to keep
the information up to date and correct, the information displayed herein is subject to
changes and may no longer be accurate after the preparation date. SEDA Malaysia is not
responsible for any errors or omissions, or for the results obtained from the use of this
information, nor do we make any representation or warranty of any kind, express or
implied, about the completeness, accuracy, reliability, suitability or availability with
respect to this PowerPoint slides or the information contained in this PowerPoint slides for
any purpose. Any reliance you place on such information is therefore strictly at your own
risk. In no event will SEDA Malaysia, the Ministry of Energy, Green Technology and Water, the
Government of Malaysia, or any of their related corporations, agents, employees or
consultants be liable to you or anyone else for any decision made or action taken in reliance
on the information in this PowerPoint slides or for any damages whatsoever, including
without limitation, special, indirect, or consequential damages arising out of or related to
the use or reliance of the information contained in this PowerPoint slides , whether by
action in contract, tort or otherwise howsoever.

Phone : +603-8870 5800Email: [email protected]: www.seda.gov.my
SEDA Malaysia,Galeria PjH, Level 9Jalan P4W, Persiaran Perdana,Presint 4, 62100 Putrajaya, Malaysia.
THANK YOU
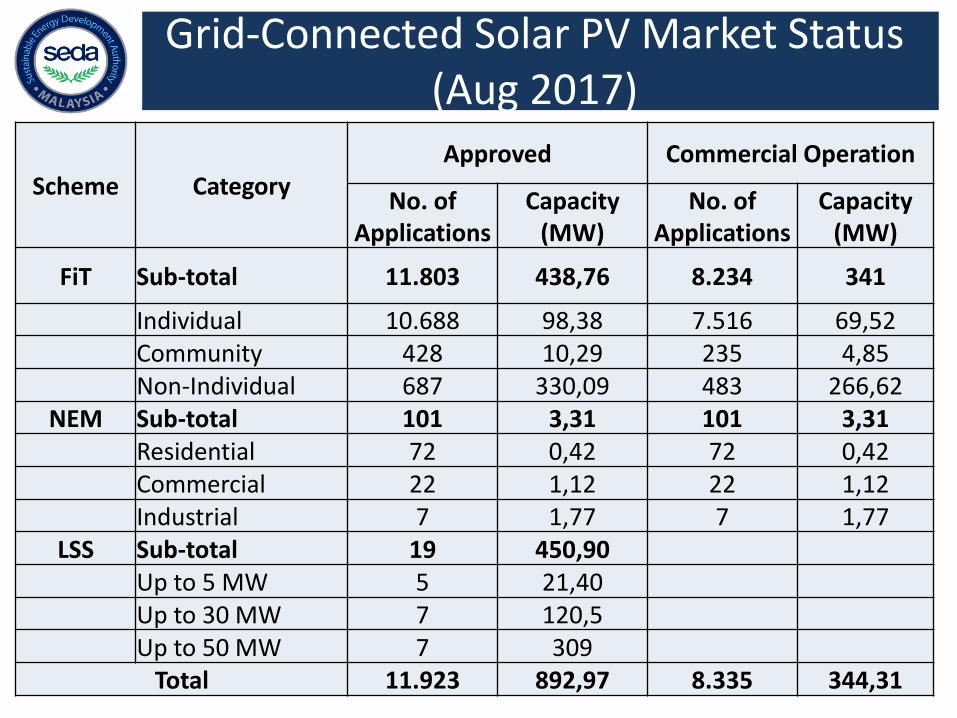
Scheme CategoryApproved Commercial Operation
No. of Applications
Capacity (MW)
No. of Applications
Capacity (MW)
FiT Sub-total 11.803 438,76 8.234 341
Individual 10.688 98,38 7.516 69,52Community 428 10,29 235 4,85Non-Individual 687 330,09 483 266,62
NEM Sub-total 101 3,31 101 3,31Residential 72 0,42 72 0,42Commercial 22 1,12 22 1,12Industrial 7 1,77 7 1,77
LSS Sub-total 19 450,90Up to 5 MW 5 21,40Up to 30 MW 7 120,5Up to 50 MW 7 309
Total 11.923 892,97 8.335 344,31
Grid-Connected Solar PV Market Status (Aug 2017)

Large Scale Solar Bid Price (Aug 2017)
Source: http://st.gov.my
Category
Peninsular Malaysia Sabah
Total Submissio
ns
No of Submissions
/MW
Lowest Bid Price RM/kWh
Highest Bid Price
RM/kWh
No of Submission
s /MW
Lowest Bid
Price RM/ kWh
Highest Bid Price
RM/
kWh
P1 (1-5.99 MWac)
25 (72,3MW) 0,375 0,4719
(78,8MW)0,371 0,53 44
P2 (6-9.99 MWac)
18(171,9MW)
0,37 0,4612
(111MW)0,39 0,49 30
P3 (10-30 MWac)
42 (1.198MW)
0,3398 0,5 na na na 42
Total85
(1442,2MW)31
(189,8MW)116
(1632MW)
Available Quota: 360MWac (x 4) in Peninsular Malaysia and 100MWac (x 2) in Sabah (commercial operational by 2019-2020);
Exchange rate: US$1 = RM4,21