Embed Size (px)
Citation preview
NREL is a national laboratory of the U.S. Department of Energy, Office of Energy Efficiency and Renewable Energy, operated by the Alliance for Sustainable Energy, LLC.
Solar PV Manufacturing Cost Analysis: U.S. Competitiveness in a Global Industry
Stanford University: Precourt Institute for Energy
Alan Goodrich†, Ted James†, and Michael Woodhouse
October 10, 2011 †Corresponding authors: [email protected], [email protected]
NREL/PR-6A20-53938
2
Analysis Disclaimer
DISCLAIMER AGREEMENT These manufacturing cost model results (“Data”) are provided by the National Renewable Energy Laboratory (“NREL”), which is operated by the Alliance for Sustainable Energy LLC (“Alliance”) for the U.S. Department of Energy (the “DOE”). It is recognized that disclosure of these Data is provided under the following conditions and warnings: (1) these Data have been prepared for reference purposes only; (2) these Data consist of forecasts, estimates or assumptions made on a best-efforts basis, based upon present expectations; and (3) these Data were prepared with existing information and are subject to change without notice. The names DOE/NREL/ALLIANCE shall not be used in any representation, advertising, publicity or other manner whatsoever to endorse or promote any entity that adopts or uses these Data. DOE/NREL/ALLIANCE shall not provide any support, consulting, training or assistance of any kind with regard to the use of these Data or any updates, revisions or new versions of these Data. YOU AGREE TO INDEMNIFY DOE/NREL/ALLIANCE, AND ITS AFFILIATES, OFFICERS, AGENTS, AND EMPLOYEES AGAINST ANY CLAIM OR DEMAND, INCLUDING REASONABLE ATTORNEYS' FEES, RELATED TO YOUR USE, RELIANCE, OR ADOPTION OF THESE DATA FOR ANY PURPOSE WHATSOEVER. THESE DATA ARE PROVIDED BY DOE/NREL/ALLIANCE "AS IS" AND ANY EXPRESS OR IMPLIED WARRANTIES, INCLUDING BUT NOT LIMITED TO, THE IMPLIED WARRANTIES OF MERCHANTABILITY AND FITNESS FOR A PARTICULAR PURPOSE ARE EXPRESSLY DISCLAIMED. IN NO EVENT SHALL DOE/NREL/ALLIANCE BE LIABLE FOR ANY SPECIAL, INDIRECT OR CONSEQUENTIAL DAMAGES OR ANY DAMAGES WHATSOEVER, INCLUDING BUT NOT LIMITED TO CLAIMS ASSOCIATED WITH THE LOSS OF DATA OR PROFITS, WHICH MAY RESULT FROM AN ACTION IN CONTRACT, NEGLIGENCE OR OTHER TORTIOUS CLAIM THAT ARISES OUT OF OR IN CONNECTION WITH THE USE OR PERFORMANCE OF THESE DATA.
2
3
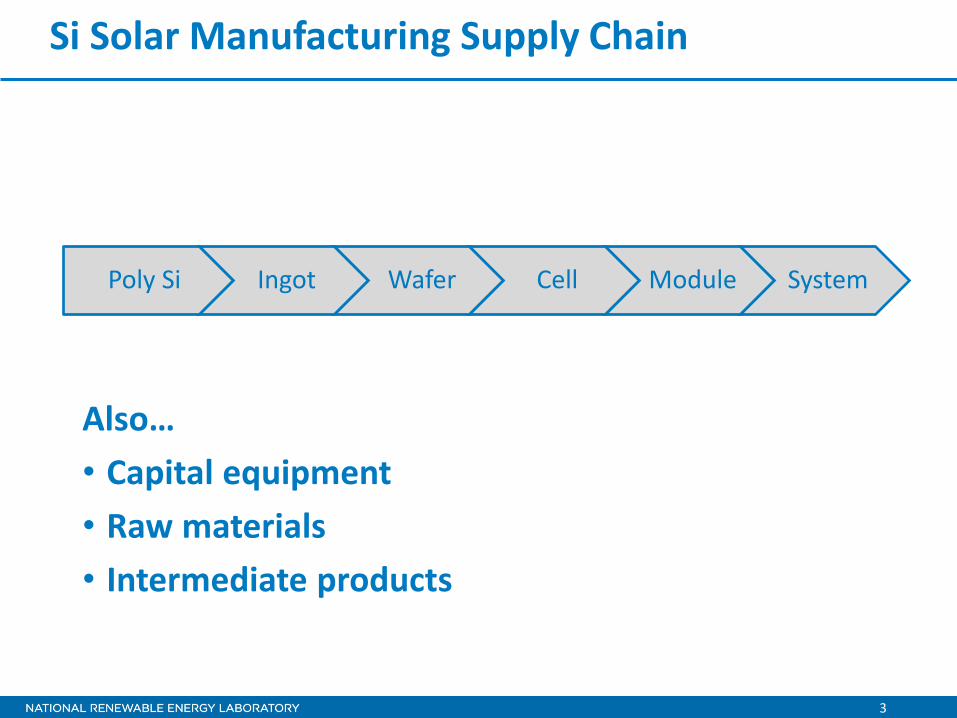
Si Solar Manufacturing Supply Chain
Also… • Capital equipment • Raw materials • Intermediate products
Poly Si Ingot Wafer Cell Module System
4
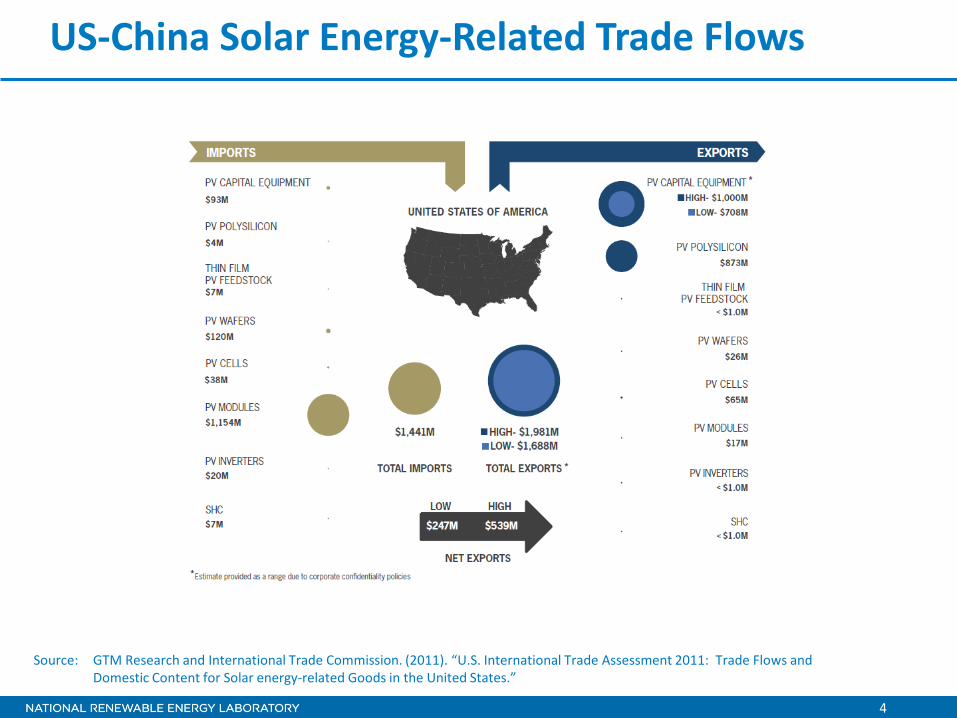
US-China Solar Energy-Related Trade Flows
Source: GTM Research and International Trade Commission. (2011). “U.S. International Trade Assessment 2011: Trade Flows and Domestic Content for Solar energy-related Goods in the United States.”
5
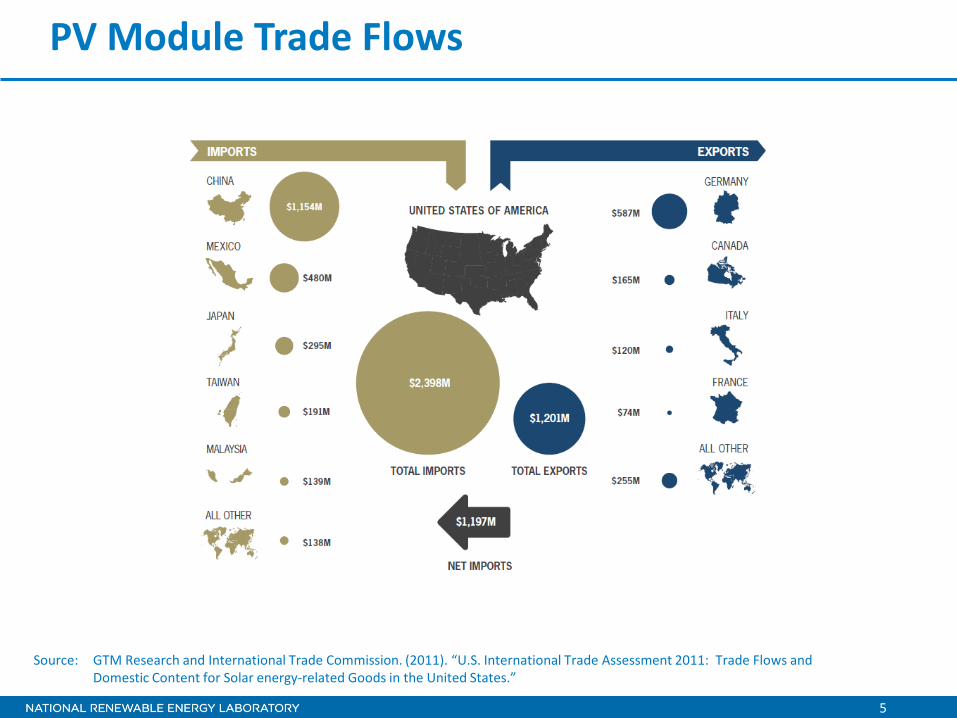
PV Module Trade Flows
Source: GTM Research and International Trade Commission. (2011). “U.S. International Trade Assessment 2011: Trade Flows and Domestic Content for Solar energy-related Goods in the United States.”
Solar PV Market Developments
7
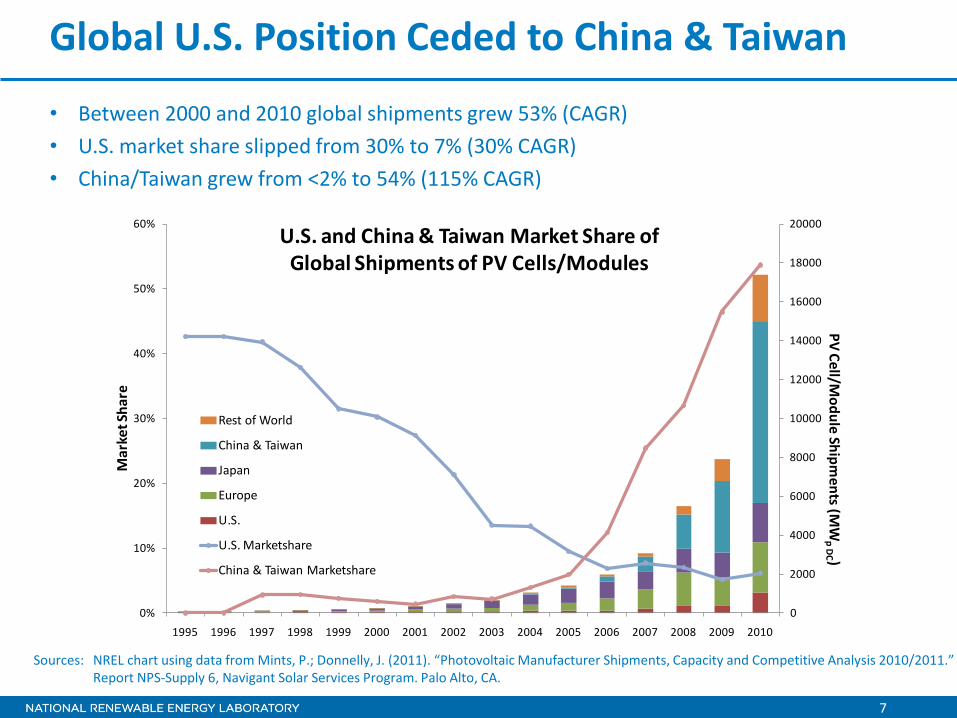
Global U.S. Position Ceded to China & Taiwan
• Between 2000 and 2010 global shipments grew 53% (CAGR) • U.S. market share slipped from 30% to 7% (30% CAGR) • China/Taiwan grew from <2% to 54% (115% CAGR)
Sources: NREL chart using data from Mints, P.; Donnelly, J. (2011). “Photovoltaic Manufacturer Shipments, Capacity and Competitive Analysis 2010/2011.” Report NPS-Supply 6, Navigant Solar Services Program. Palo Alto, CA.
0%
10%
20%
30%
40%
50%
60%
0
2000
4000
6000
8000
10000
12000
14000
16000
18000
20000
1995 1996 1997 1998 1999 2000 2001 2002 2003 2004 2005 2006 2007 2008 2009 2010
Mar
ket S
hare
PV Cell/M
odule Shipments (M
Wp DC )
U.S. and China & Taiwan Market Share of Global Shipments of PV Cells/Modules
Rest of World
China & Taiwan
Japan
Europe
U.S.
U.S. Marketshare
China & Taiwan Marketshare
8
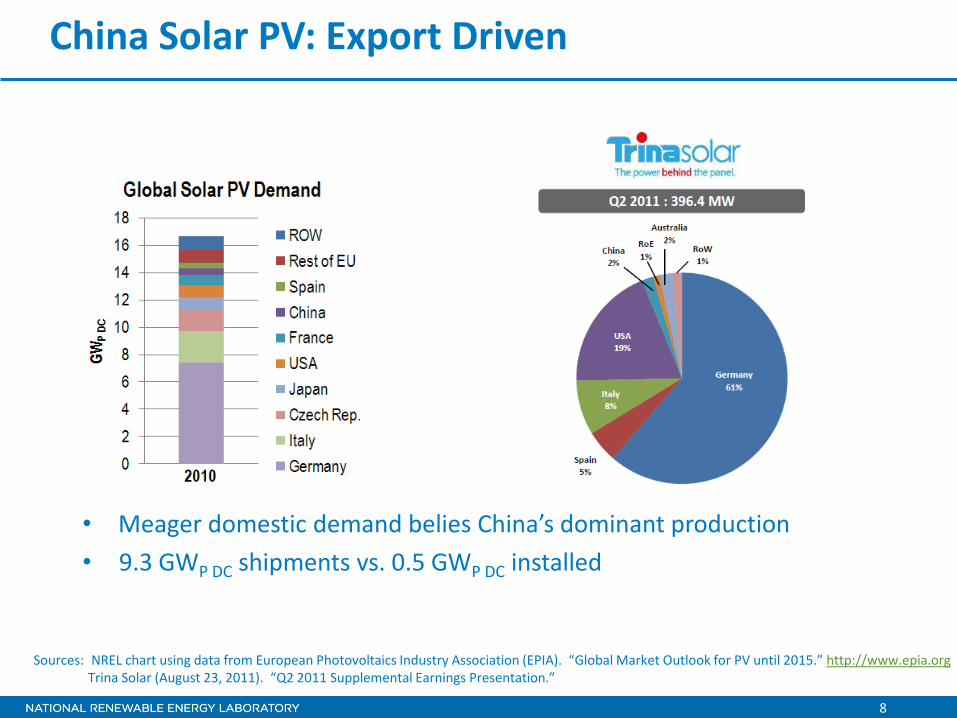
China Solar PV: Export Driven
• Meager domestic demand belies China’s dominant production • 9.3 GWP DC shipments vs. 0.5 GWP DC installed
Sources: NREL chart using data from European Photovoltaics Industry Association (EPIA). “Global Market Outlook for PV until 2015.” http://www.epia.org Trina Solar (August 23, 2011). “Q2 2011 Supplemental Earnings Presentation.”
9
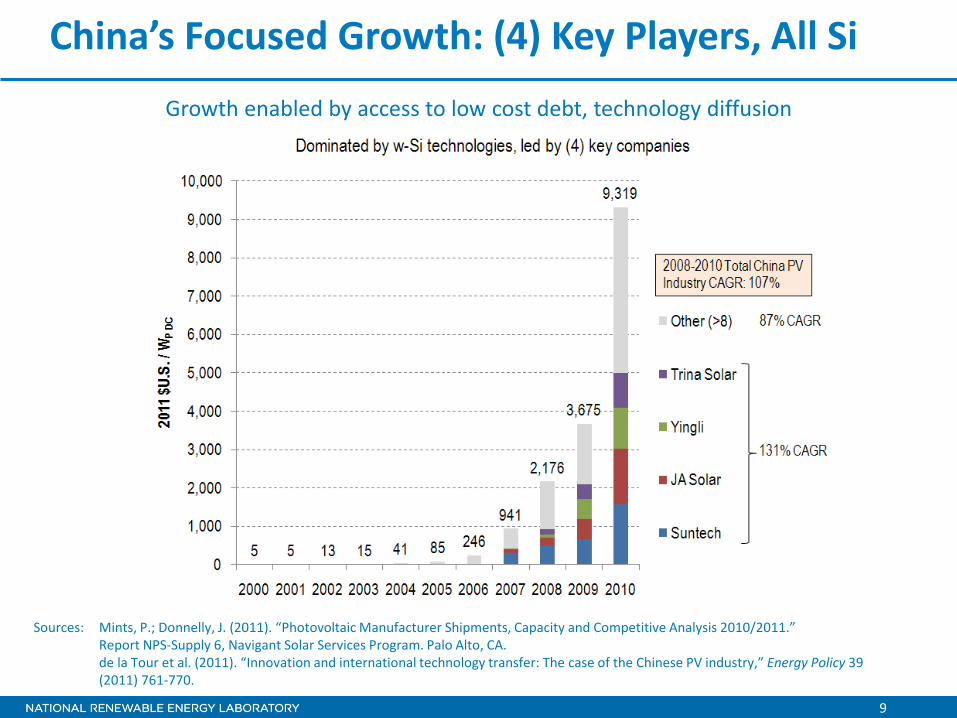
China’s Focused Growth: (4) Key Players, All Si Growth enabled by access to low cost debt, technology diffusion
Sources: Mints, P.; Donnelly, J. (2011). “Photovoltaic Manufacturer Shipments, Capacity and Competitive Analysis 2010/2011.” Report NPS-Supply 6, Navigant Solar Services Program. Palo Alto, CA. de la Tour et al. (2011). “Innovation and international technology transfer: The case of the Chinese PV industry,” Energy Policy 39 (2011) 761-770.
10
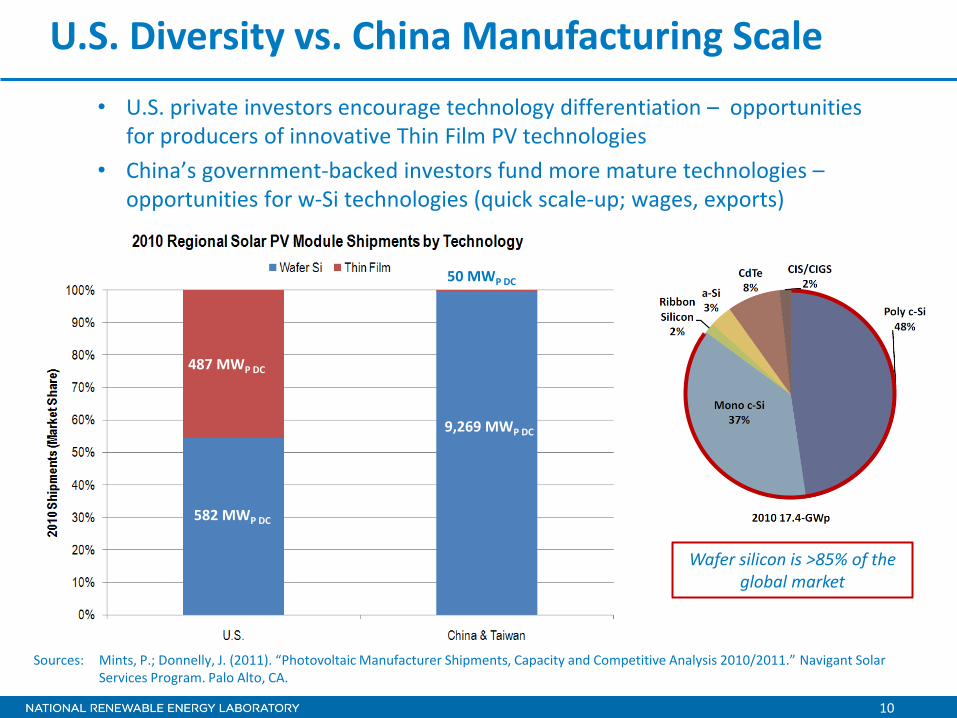
U.S. Diversity vs. China Manufacturing Scale
Sources: Mints, P.; Donnelly, J. (2011). “Photovoltaic Manufacturer Shipments, Capacity and Competitive Analysis 2010/2011.” Navigant Solar Services Program. Palo Alto, CA.
Wafer silicon is >85% of the global market
582 MWP DC
487 MWP DC
9,269 MWP DC
50 MWP DC
• U.S. private investors encourage technology differentiation – opportunities for producers of innovative Thin Film PV technologies
• China’s government-backed investors fund more mature technologies – opportunities for w-Si technologies (quick scale-up; wages, exports)
11
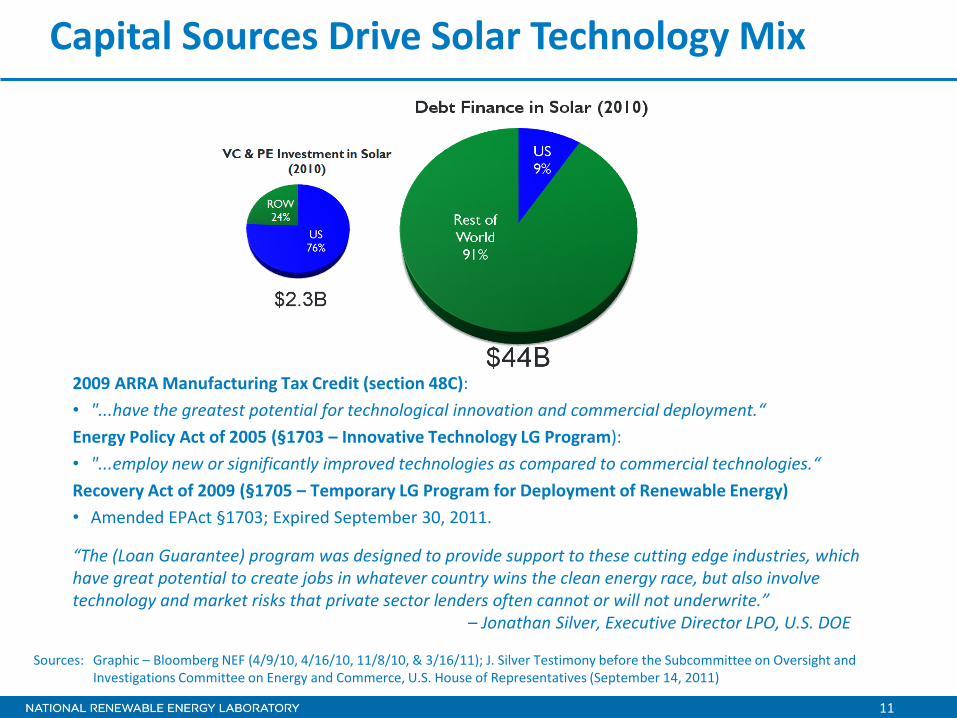
Capital Sources Drive Solar Technology Mix
Sources: Graphic – Bloomberg NEF (4/9/10, 4/16/10, 11/8/10, & 3/16/11); J. Silver Testimony before the Subcommittee on Oversight and Investigations Committee on Energy and Commerce, U.S. House of Representatives (September 14, 2011)
2009 ARRA Manufacturing Tax Credit (section 48C): • "...have the greatest potential for technological innovation and commercial deployment.“ Energy Policy Act of 2005 (§1703 – Innovative Technology LG Program): • "...employ new or significantly improved technologies as compared to commercial technologies.“ Recovery Act of 2009 (§1705 – Temporary LG Program for Deployment of Renewable Energy) • Amended EPAct §1703; Expired September 30, 2011.
“The (Loan Guarantee) program was designed to provide support to these cutting edge industries, which have great potential to create jobs in whatever country wins the clean energy race, but also involve technology and market risks that private sector lenders often cannot or will not underwrite.” – Jonathan Silver, Executive Director LPO, U.S. DOE
12
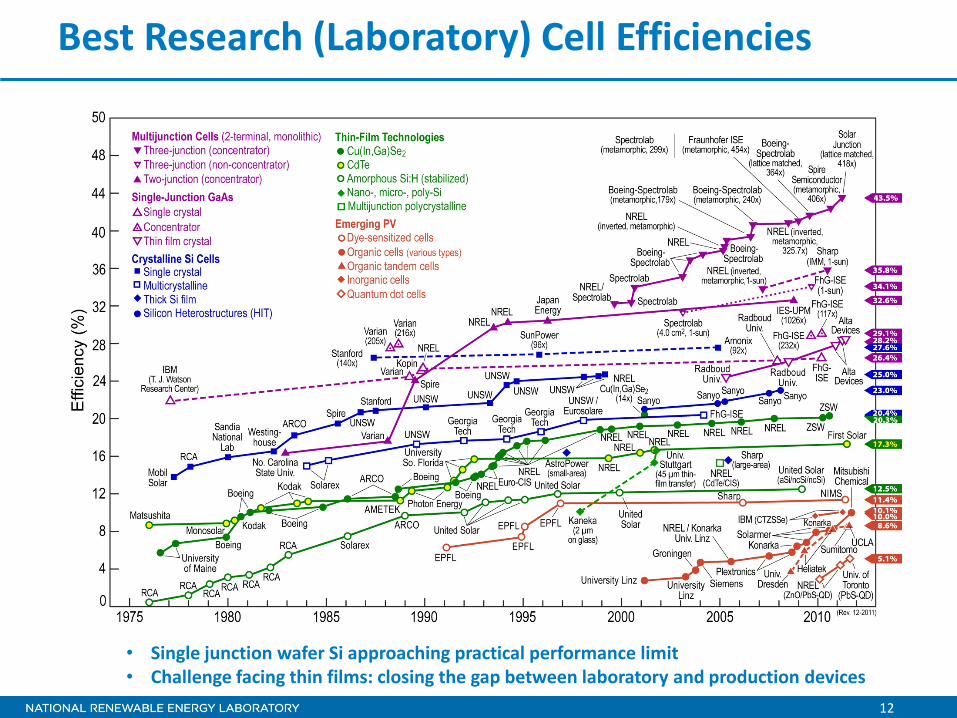
Best Research (Laboratory) Cell Efficiencies
• Single junction wafer Si approaching practical performance limit • Challenge facing thin films: closing the gap between laboratory and production devices
13
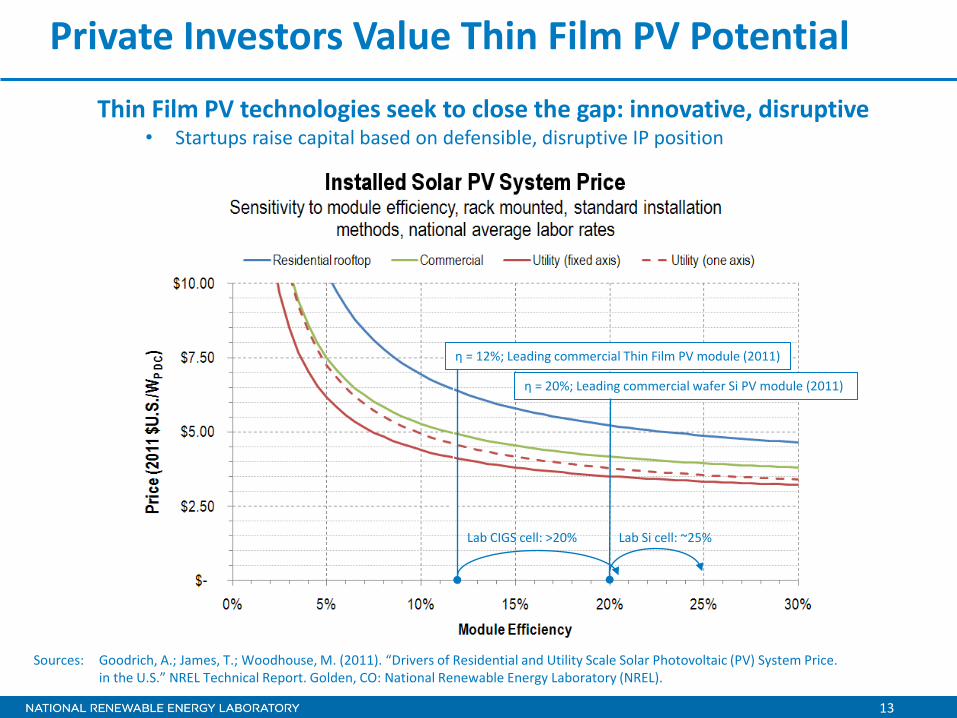
Private Investors Value Thin Film PV Potential
Thin Film PV technologies seek to close the gap: innovative, disruptive • Startups raise capital based on defensible, disruptive IP position
η = 12%; Leading commercial Thin Film PV module (2011)
η = 20%; Leading commercial wafer Si PV module (2011)
Sources: Goodrich, A.; James, T.; Woodhouse, M. (2011). “Drivers of Residential and Utility Scale Solar Photovoltaic (PV) System Price. in the U.S.” NREL Technical Report. Golden, CO: National Renewable Energy Laboratory (NREL).
Lab CIGS cell: >20% Lab Si cell: ~25%
International Investment Risk
15
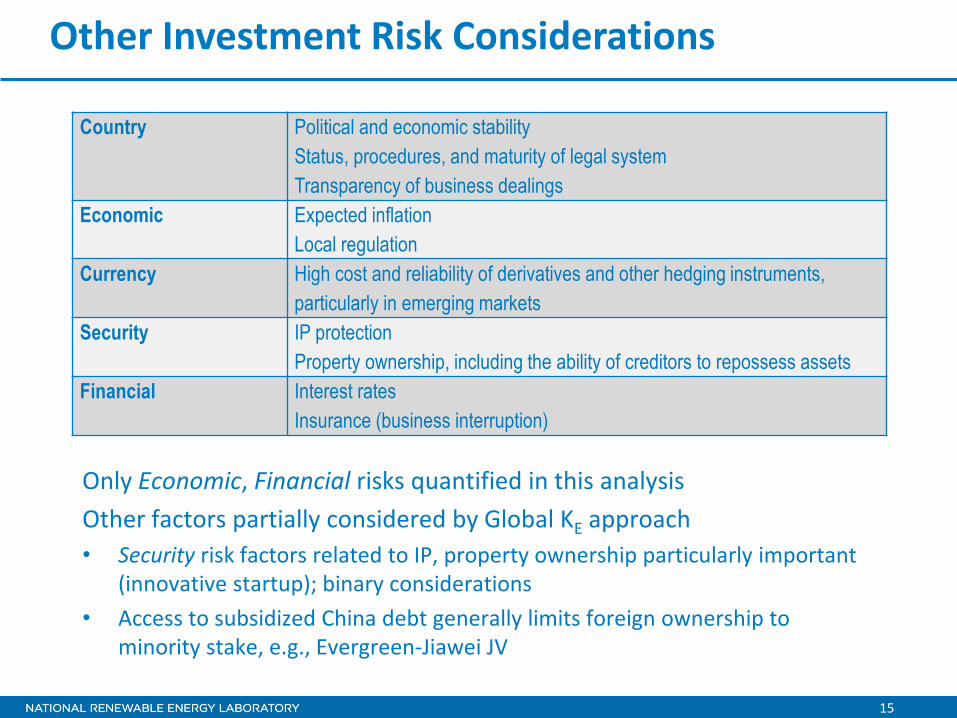
Other Investment Risk Considerations
Country Political and economic stability Status, procedures, and maturity of legal system Transparency of business dealings
Economic Expected inflation Local regulation
Currency High cost and reliability of derivatives and other hedging instruments, particularly in emerging markets
Security IP protection Property ownership, including the ability of creditors to repossess assets
Financial Interest rates Insurance (business interruption)
Only Economic, Financial risks quantified in this analysis Other factors partially considered by Global KE approach • Security risk factors related to IP, property ownership particularly important
(innovative startup); binary considerations • Access to subsidized China debt generally limits foreign ownership to
minority stake, e.g., Evergreen-Jiawei JV
16
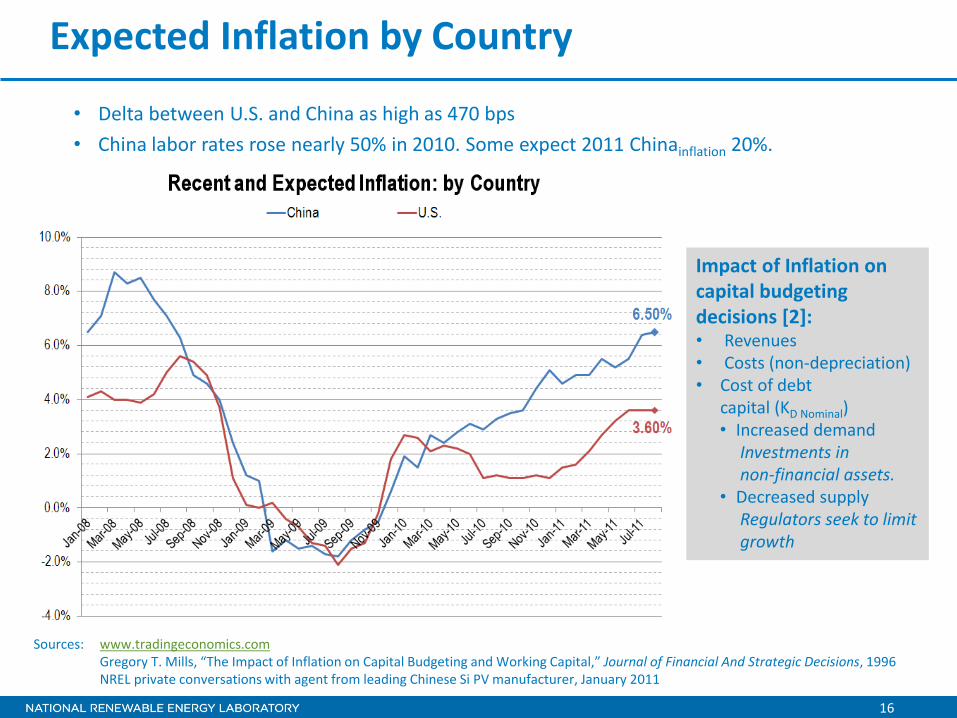
Expected Inflation by Country
• Delta between U.S. and China as high as 470 bps • China labor rates rose nearly 50% in 2010. Some expect 2011 Chinainflation 20%.
Impact of Inflation on capital budgeting decisions [2]: • Revenues • Costs (non-depreciation) • Cost of debt
capital (KD Nominal) • Increased demand
Investments in non-financial assets.
• Decreased supply Regulators seek to limit growth
Sources: www.tradingeconomics.com Gregory T. Mills, “The Impact of Inflation on Capital Budgeting and Working Capital,” Journal of Financial And Strategic Decisions, 1996 NREL private conversations with agent from leading Chinese Si PV manufacturer, January 2011
17
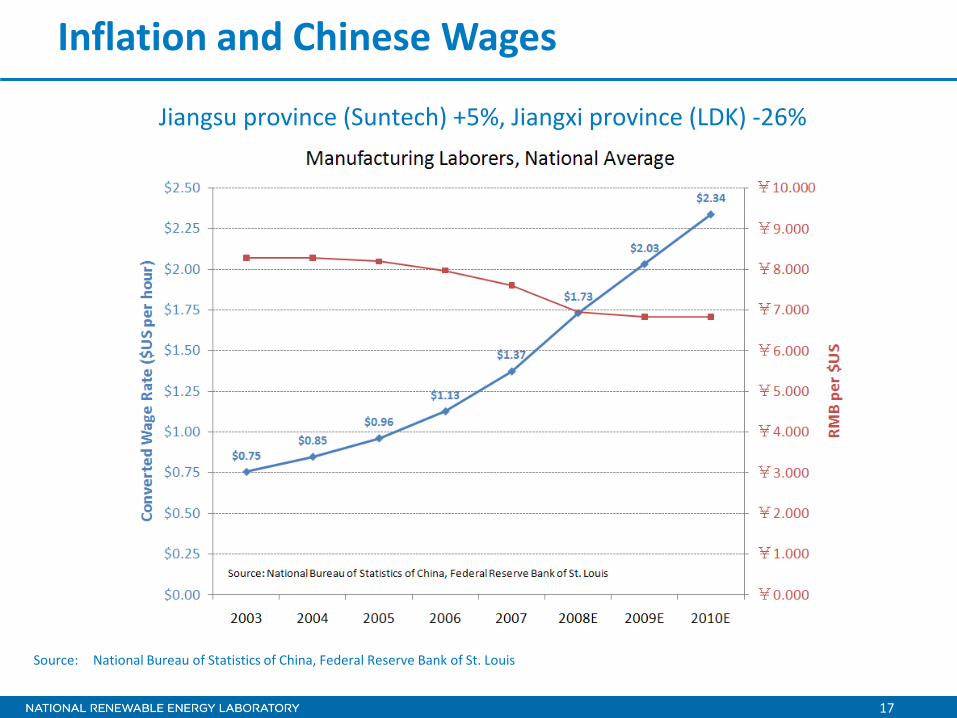
Inflation and Chinese Wages
Jiangsu province (Suntech) +5%, Jiangxi province (LDK) -26%
Source: National Bureau of Statistics of China, Federal Reserve Bank of St. Louis
18
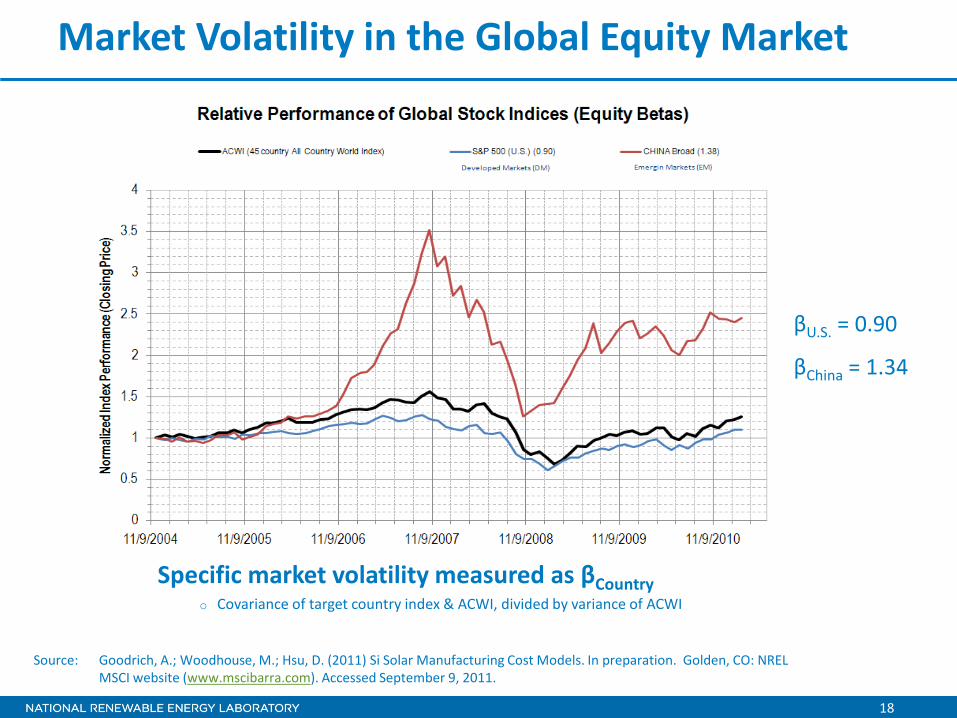
Market Volatility in the Global Equity Market
Specific market volatility measured as βCountry o Covariance of target country index & ACWI, divided by variance of ACWI
βU.S. = 0.90
βChina = 1.34
Source: Goodrich, A.; Woodhouse, M.; Hsu, D. (2011) Si Solar Manufacturing Cost Models. In preparation. Golden, CO: NREL MSCI website (www.mscibarra.com). Accessed September 9, 2011.
19
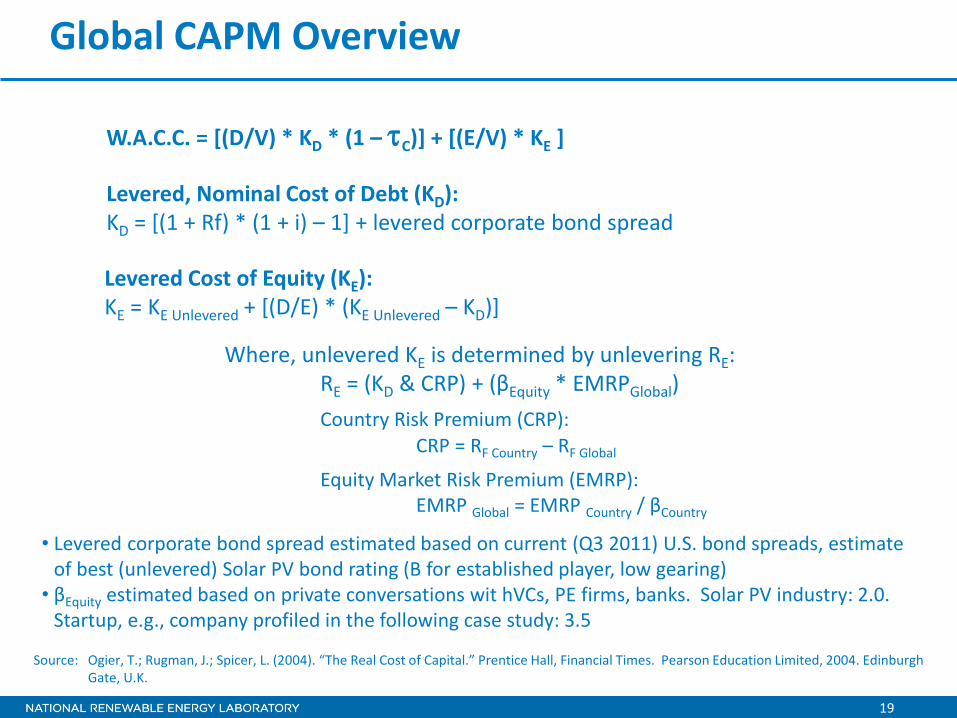
Global CAPM Overview
W.A.C.C. = [(D/V) * KD * (1 – τC)] + [(E/V) * KE ]
Levered, Nominal Cost of Debt (KD): KD = [(1 + Rf) * (1 + i) – 1] + levered corporate bond spread
Levered Cost of Equity (KE): KE = KE Unlevered + [(D/E) * (KE Unlevered – KD)]
Where, unlevered KE is determined by unlevering RE: RE = (KD & CRP) + (βEquity * EMRPGlobal)
Country Risk Premium (CRP): CRP = RF Country – RF Global
Equity Market Risk Premium (EMRP): EMRP Global = EMRP Country / βCountry
• Levered corporate bond spread estimated based on current (Q3 2011) U.S. bond spreads, estimate of best (unlevered) Solar PV bond rating (B for established player, low gearing) • βEquity estimated based on private conversations wit hVCs, PE firms, banks. Solar PV industry: 2.0.
Startup, e.g., company profiled in the following case study: 3.5
Source: Ogier, T.; Rugman, J.; Spicer, L. (2004). “The Real Cost of Capital.” Prentice Hall, Financial Times. Pearson Education Limited, 2004. Edinburgh Gate, U.K.
20
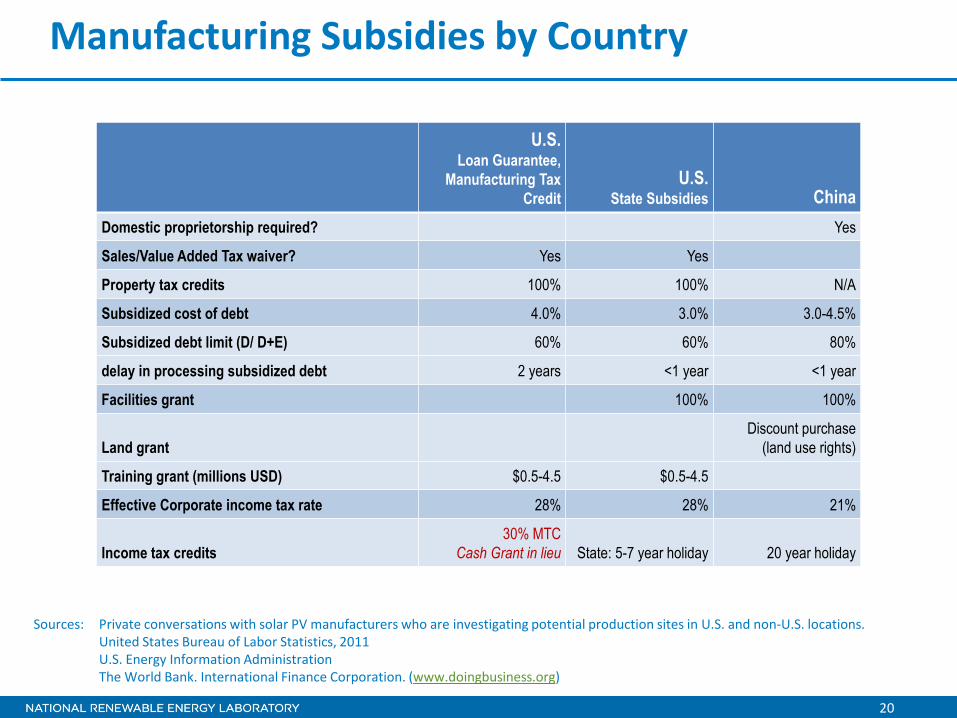
Manufacturing Subsidies by Country
U.S. Loan Guarantee,
Manufacturing Tax Credit
U.S. State Subsidies China
Domestic proprietorship required? Yes
Sales/Value Added Tax waiver? Yes Yes
Property tax credits 100% 100% N/A
Subsidized cost of debt 4.0% 3.0% 3.0-4.5%
Subsidized debt limit (D/ D+E) 60% 60% 80%
delay in processing subsidized debt 2 years <1 year <1 year
Facilities grant 100% 100%
Land grant Discount purchase
(land use rights)
Training grant (millions USD) $0.5-4.5 $0.5-4.5
Effective Corporate income tax rate 28% 28% 21%
Income tax credits 30% MTC
Cash Grant in lieu State: 5-7 year holiday 20 year holiday
Sources: Private conversations with solar PV manufacturers who are investigating potential production sites in U.S. and non-U.S. locations. United States Bureau of Labor Statistics, 2011 U.S. Energy Information Administration The World Bank. International Finance Corporation. (www.doingbusiness.org)
21
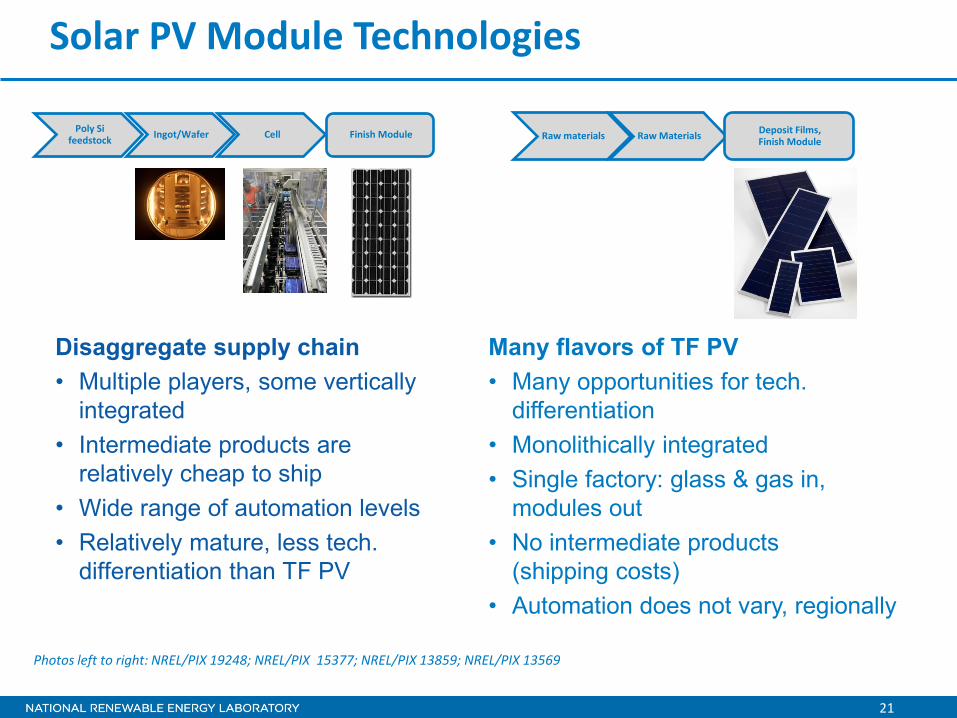
Solar PV Module Technologies
Poly Si feedstock Ingot/Wafer Cell Finish Module
Many flavors of TF PV • Many opportunities for tech.
differentiation • Monolithically integrated • Single factory: glass & gas in,
modules out • No intermediate products
(shipping costs) • Automation does not vary, regionally
Raw materials Raw Materials Deposit Films, Finish Module
Disaggregate supply chain • Multiple players, some vertically
integrated • Intermediate products are
relatively cheap to ship • Wide range of automation levels • Relatively mature, less tech.
differentiation than TF PV
Photos left to right: NREL/PIX 19248; NREL/PIX 15377; NREL/PIX 13859; NREL/PIX 13569
The Case for Foreign Direct Investment China based c-Si PV manufacturer, U.S. customer (end market)
23
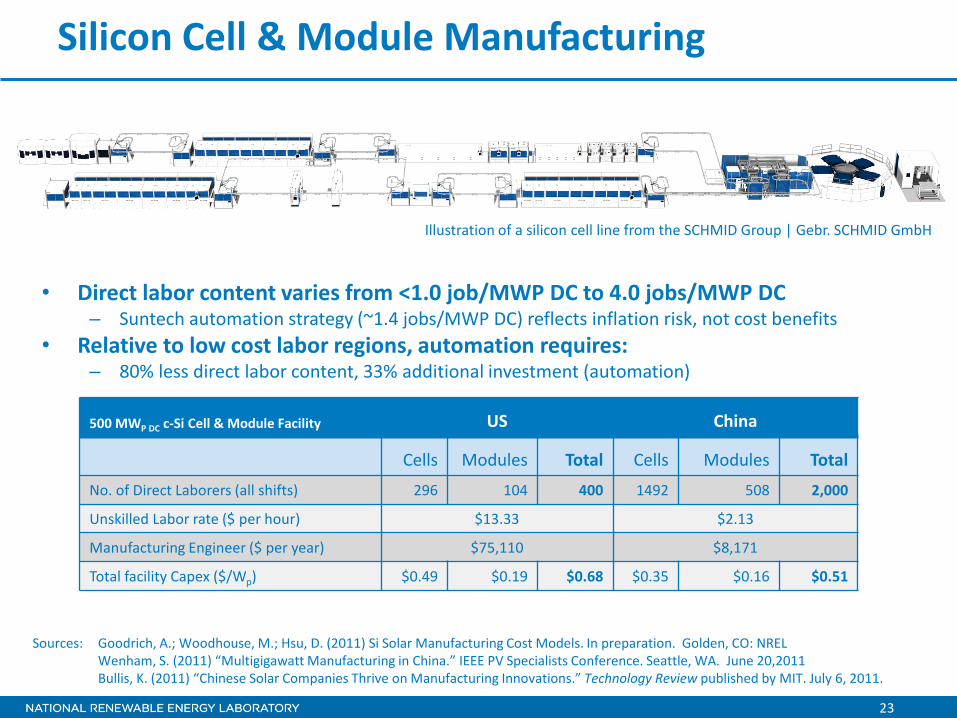
Silicon Cell & Module Manufacturing
500 MWP DC c-Si Cell & Module Facility US China
Cells Modules Total Cells Modules Total
No. of Direct Laborers (all shifts) 296 104 400 1492 508 2,000
Unskilled Labor rate ($ per hour) $13.33 $2.13
Manufacturing Engineer ($ per year) $75,110 $8,171
Total facility Capex ($/Wp) $0.49 $0.19 $0.68 $0.35 $0.16 $0.51
Illustration of a silicon cell line from the SCHMID Group | Gebr. SCHMID GmbH
Sources: Goodrich, A.; Woodhouse, M.; Hsu, D. (2011) Si Solar Manufacturing Cost Models. In preparation. Golden, CO: NREL Wenham, S. (2011) “Multigigawatt Manufacturing in China.” IEEE PV Specialists Conference. Seattle, WA. June 20,2011 Bullis, K. (2011) “Chinese Solar Companies Thrive on Manufacturing Innovations.” Technology Review published by MIT. July 6, 2011.
• Direct labor content varies from <1.0 job/MWP DC to 4.0 jobs/MWP DC – Suntech automation strategy (~1.4 jobs/MWP DC) reflects inflation risk, not cost benefits
• Relative to low cost labor regions, automation requires: – 80% less direct labor content, 33% additional investment (automation)
24
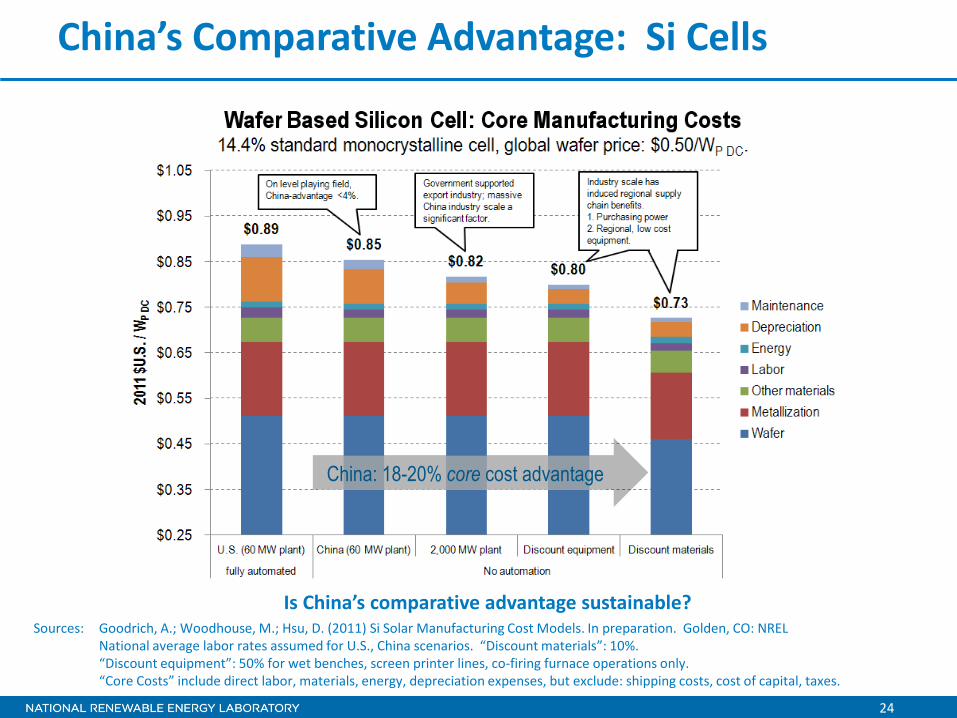
China: 18-20% core cost advantage
China’s Comparative Advantage: Si Cells
Sources: Goodrich, A.; Woodhouse, M.; Hsu, D. (2011) Si Solar Manufacturing Cost Models. In preparation. Golden, CO: NREL National average labor rates assumed for U.S., China scenarios. “Discount materials”: 10%. “Discount equipment”: 50% for wet benches, screen printer lines, co-firing furnace operations only. “Core Costs” include direct labor, materials, energy, depreciation expenses, but exclude: shipping costs, cost of capital, taxes.
Is China’s comparative advantage sustainable?
25
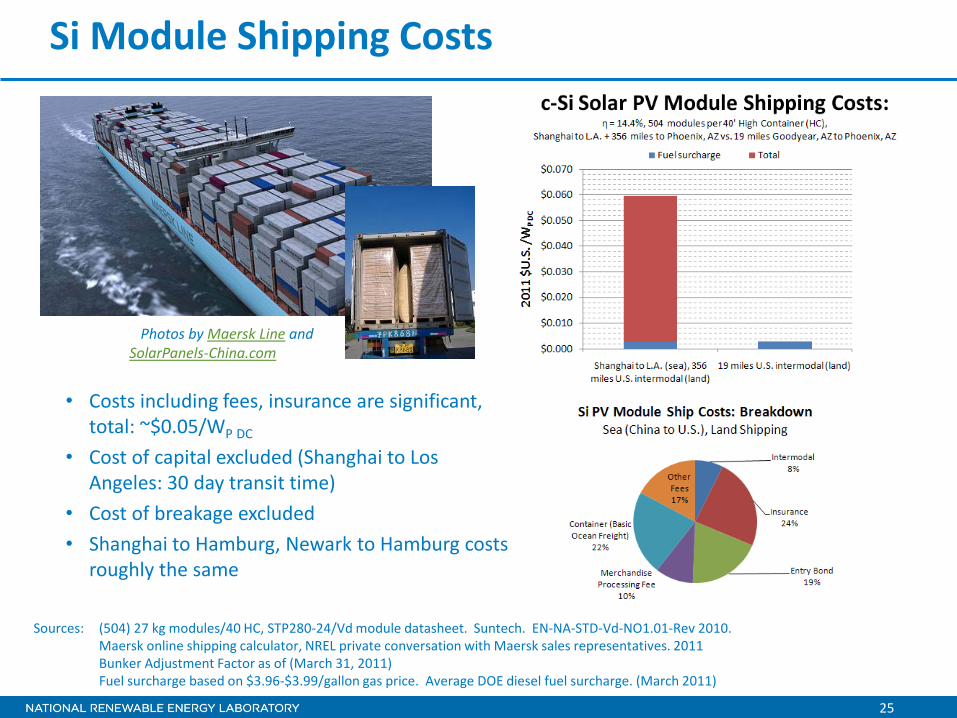
Si Module Shipping Costs
• Costs including fees, insurance are significant, total: ~$0.05/WP DC
• Cost of capital excluded (Shanghai to Los Angeles: 30 day transit time)
• Cost of breakage excluded • Shanghai to Hamburg, Newark to Hamburg costs
roughly the same
Sources: (504) 27 kg modules/40 HC, STP280-24/Vd module datasheet. Suntech. EN-NA-STD-Vd-NO1.01-Rev 2010. Maersk online shipping calculator, NREL private conversation with Maersk sales representatives. 2011 Bunker Adjustment Factor as of (March 31, 2011) Fuel surcharge based on $3.96-$3.99/gallon gas price. Average DOE diesel fuel surcharge. (March 2011)
Photos by Maersk Line and SolarPanels-China.com
26
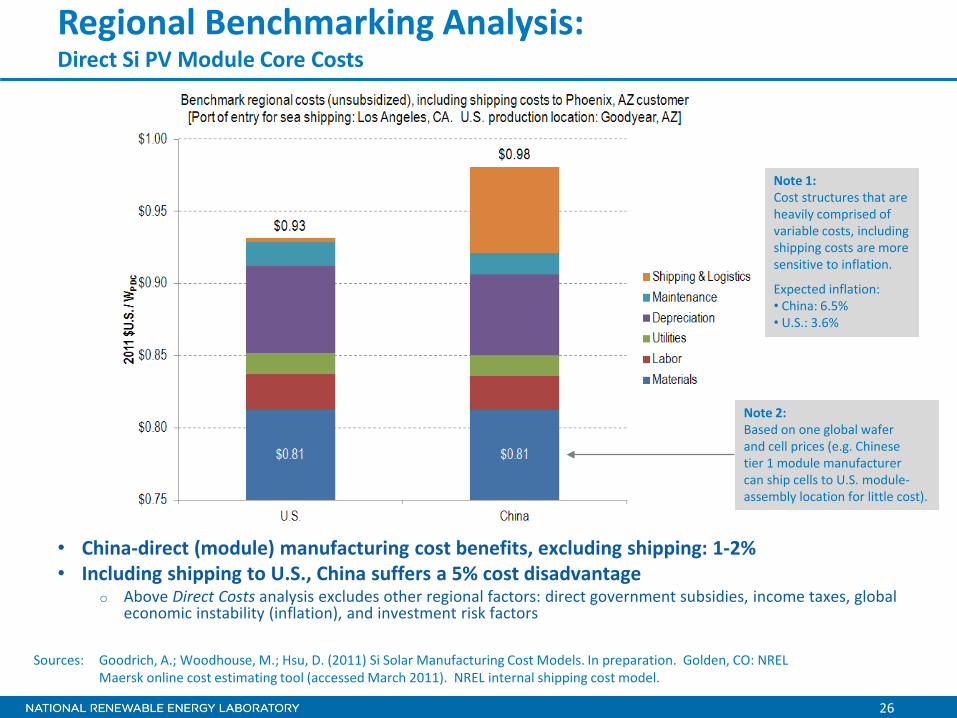
Regional Benchmarking Analysis: Direct Si PV Module Core Costs
• China-direct (module) manufacturing cost benefits, excluding shipping: 1-2% • Including shipping to U.S., China suffers a 5% cost disadvantage
o Above Direct Costs analysis excludes other regional factors: direct government subsidies, income taxes, global economic instability (inflation), and investment risk factors
Note 1: Cost structures that are heavily comprised of variable costs, including shipping costs are more sensitive to inflation.
Expected inflation: • China: 6.5% • U.S.: 3.6%
Sources: Goodrich, A.; Woodhouse, M.; Hsu, D. (2011) Si Solar Manufacturing Cost Models. In preparation. Golden, CO: NREL Maersk online cost estimating tool (accessed March 2011). NREL internal shipping cost model.
Note 2: Based on one global wafer and cell prices (e.g. Chinese tier 1 module manufacturer can ship cells to U.S. module- assembly location for little cost).
27
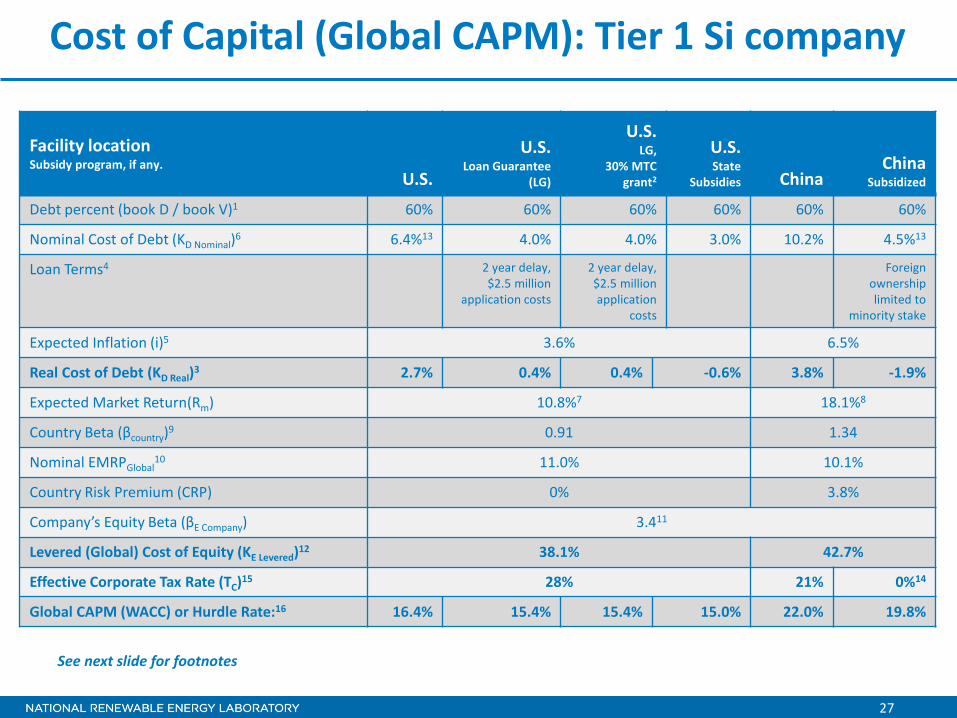
Cost of Capital (Global CAPM): Tier 1 Si company
Facility location Subsidy program, if any.
U.S.
U.S. Loan Guarantee
(LG)
U.S. LG,
30% MTC grant2
U.S. State
Subsidies China China
Subsidized
Debt percent (book D / book V)1 60% 60% 60% 60% 60% 60%
Nominal Cost of Debt (KD Nominal)6 6.4%13 4.0% 4.0% 3.0% 10.2% 4.5%13
Loan Terms4 2 year delay, $2.5 million
application costs
2 year delay, $2.5 million application
costs
Foreign ownership limited to
minority stake
Expected Inflation (i)5 3.6% 6.5%
Real Cost of Debt (KD Real)3 2.7% 0.4% 0.4% -0.6% 3.8% -1.9%
Expected Market Return(Rm) 10.8%7 18.1%8
Country Beta (βcountry)9 0.91 1.34
Nominal EMRPGlobal10 11.0% 10.1%
Country Risk Premium (CRP) 0% 3.8%
Company’s Equity Beta (βE Company) 3.411
Levered (Global) Cost of Equity (KE Levered)12 38.1% 42.7%
Effective Corporate Tax Rate (TC)15 28% 21% 0%14
Global CAPM (WACC) or Hurdle Rate:16 16.4% 15.4% 15.4% 15.0% 22.0% 19.8%
See next slide for footnotes
28
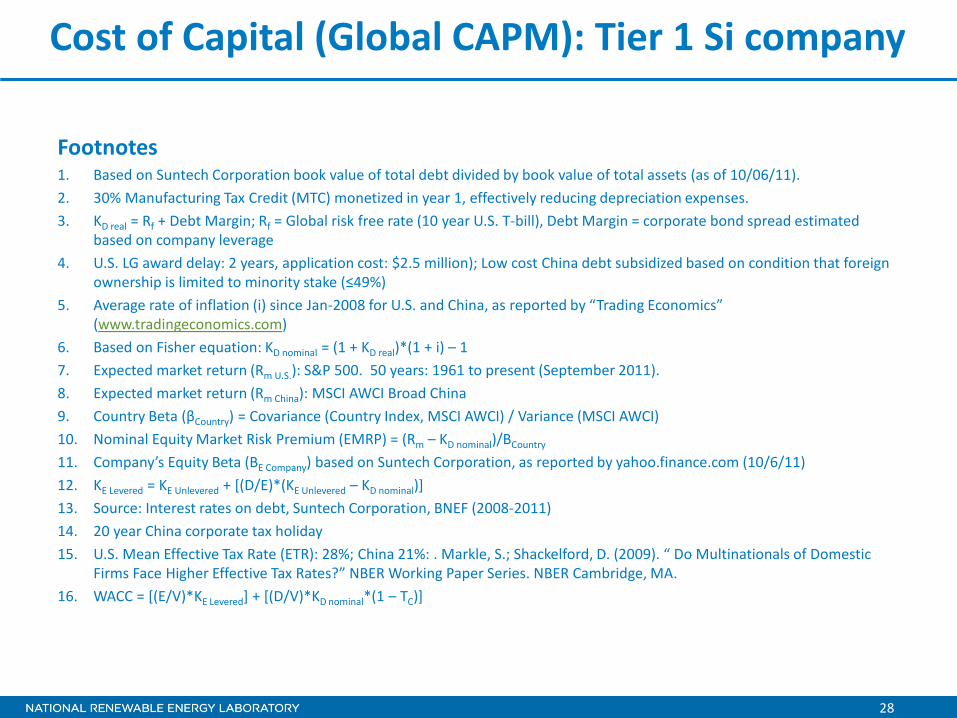
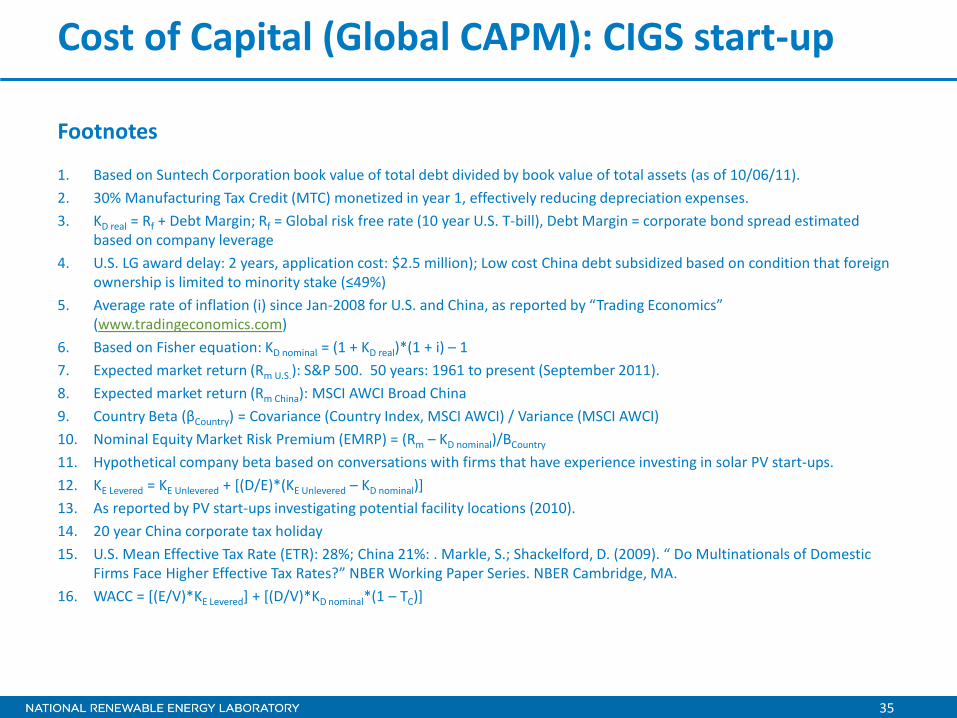
Cost of Capital (Global CAPM): Tier 1 Si company
Footnotes 1. Based on Suntech Corporation book value of total debt divided by book value of total assets (as of 10/06/11). 2. 30% Manufacturing Tax Credit (MTC) monetized in year 1, effectively reducing depreciation expenses. 3. KD real = Rf + Debt Margin; Rf = Global risk free rate (10 year U.S. T-bill), Debt Margin = corporate bond spread estimated
based on company leverage 4. U.S. LG award delay: 2 years, application cost: $2.5 million); Low cost China debt subsidized based on condition that foreign
ownership is limited to minority stake (≤49%) 5. Average rate of inflation (i) since Jan-2008 for U.S. and China, as reported by “Trading Economics”
(www.tradingeconomics.com) 6. Based on Fisher equation: KD nominal = (1 + KD real)*(1 + i) – 1 7. Expected market return (Rm U.S.): S&P 500. 50 years: 1961 to present (September 2011). 8. Expected market return (Rm China): MSCI AWCI Broad China 9. Country Beta (βCountry) = Covariance (Country Index, MSCI AWCI) / Variance (MSCI AWCI) 10. Nominal Equity Market Risk Premium (EMRP) = (Rm – KD nominal)/BCountry
11. Company’s Equity Beta (BE Company) based on Suntech Corporation, as reported by yahoo.finance.com (10/6/11) 12. KE Levered = KE Unlevered + [(D/E)*(KE Unlevered – KD nominal)] 13. Source: Interest rates on debt, Suntech Corporation, BNEF (2008-2011) 14. 20 year China corporate tax holiday 15. U.S. Mean Effective Tax Rate (ETR): 28%; China 21%: . Markle, S.; Shackelford, D. (2009). “ Do Multinationals of Domestic
Firms Face Higher Effective Tax Rates?” NBER Working Paper Series. NBER Cambridge, MA. 16. WACC = [(E/V)*KE Levered] + [(D/V)*KD nominal*(1 – TC)]
29
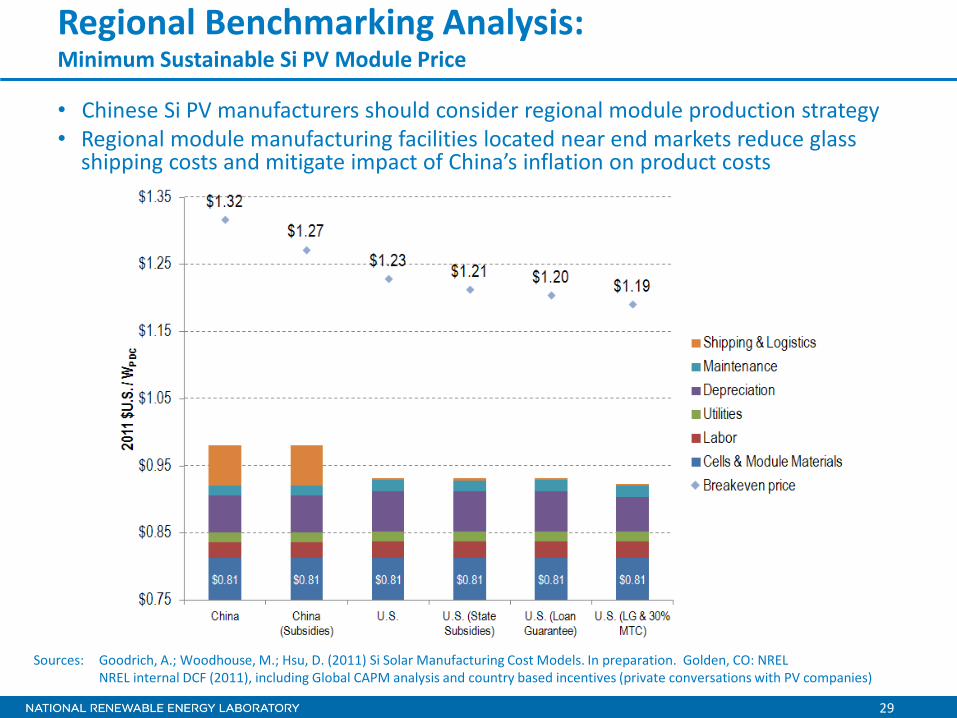
Regional Benchmarking Analysis: Minimum Sustainable Si PV Module Price
• Chinese Si PV manufacturers should consider regional module production strategy • Regional module manufacturing facilities located near end markets reduce glass
shipping costs and mitigate impact of China’s inflation on product costs
Sources: Goodrich, A.; Woodhouse, M.; Hsu, D. (2011) Si Solar Manufacturing Cost Models. In preparation. Golden, CO: NREL NREL internal DCF (2011), including Global CAPM analysis and country based incentives (private conversations with PV companies)
Capitalizing on U.S. Innovation U.S.–based thin film (CIGS) PV startup, U.S. customer (end market)
31
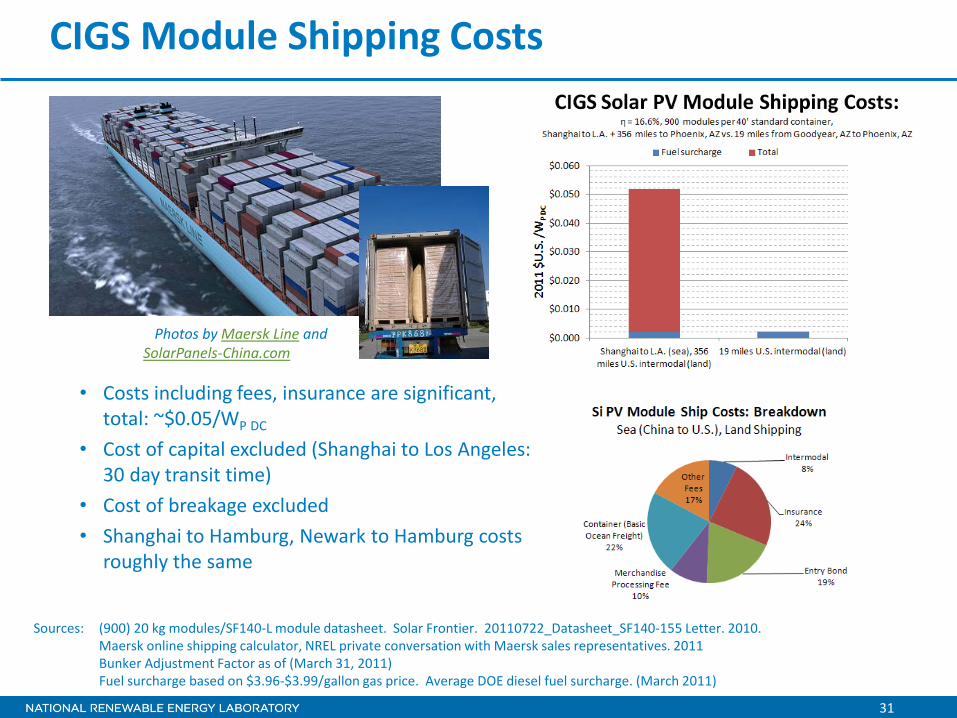
CIGS Module Shipping Costs
Photos by Maersk Line and SolarPanels-China.com
Sources: (900) 20 kg modules/SF140-L module datasheet. Solar Frontier. 20110722_Datasheet_SF140-155 Letter. 2010. Maersk online shipping calculator, NREL private conversation with Maersk sales representatives. 2011 Bunker Adjustment Factor as of (March 31, 2011) Fuel surcharge based on $3.96-$3.99/gallon gas price. Average DOE diesel fuel surcharge. (March 2011)
• Costs including fees, insurance are significant, total: ~$0.05/WP DC
• Cost of capital excluded (Shanghai to Los Angeles: 30 day transit time)
• Cost of breakage excluded • Shanghai to Hamburg, Newark to Hamburg costs
roughly the same
32
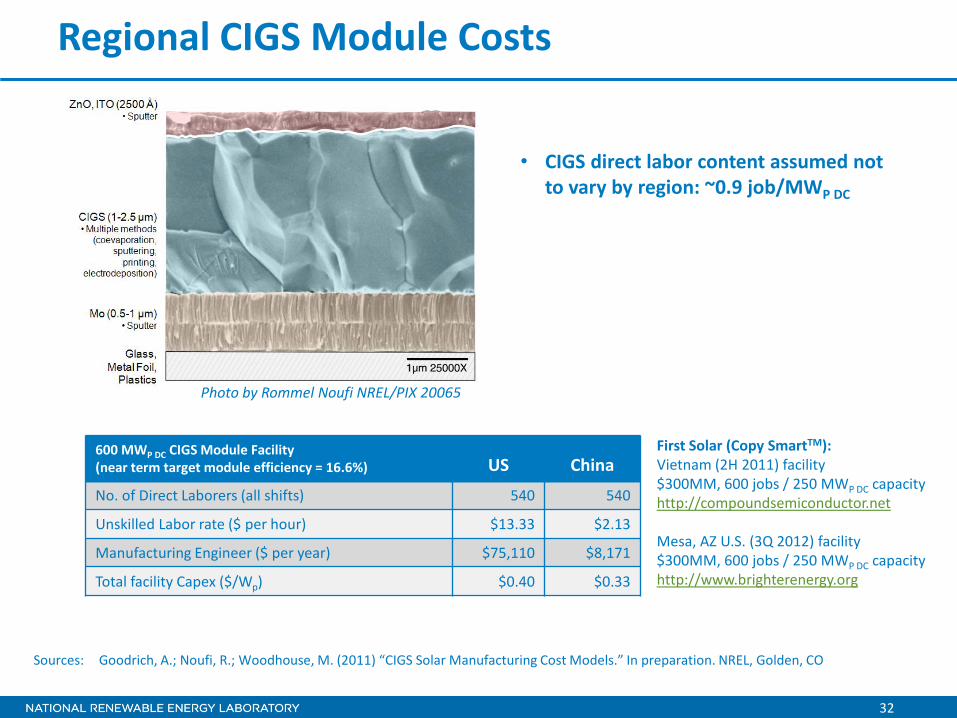
Regional CIGS Module Costs
• CIGS direct labor content assumed not to vary by region: ~0.9 job/MWP DC
600 MWP DC CIGS Module Facility (near term target module efficiency = 16.6%) US China
No. of Direct Laborers (all shifts) 540 540
Unskilled Labor rate ($ per hour) $13.33 $2.13
Manufacturing Engineer ($ per year) $75,110 $8,171
Total facility Capex ($/Wp) $0.40 $0.33
Sources: Goodrich, A.; Noufi, R.; Woodhouse, M. (2011) “CIGS Solar Manufacturing Cost Models.” In preparation. NREL, Golden, CO
First Solar (Copy SmartTM): Vietnam (2H 2011) facility $300MM, 600 jobs / 250 MWP DC capacity http://compoundsemiconductor.net Mesa, AZ U.S. (3Q 2012) facility $300MM, 600 jobs / 250 MWP DC capacity http://www.brighterenergy.org
Photo by Rommel Noufi NREL/PIX 20065
33
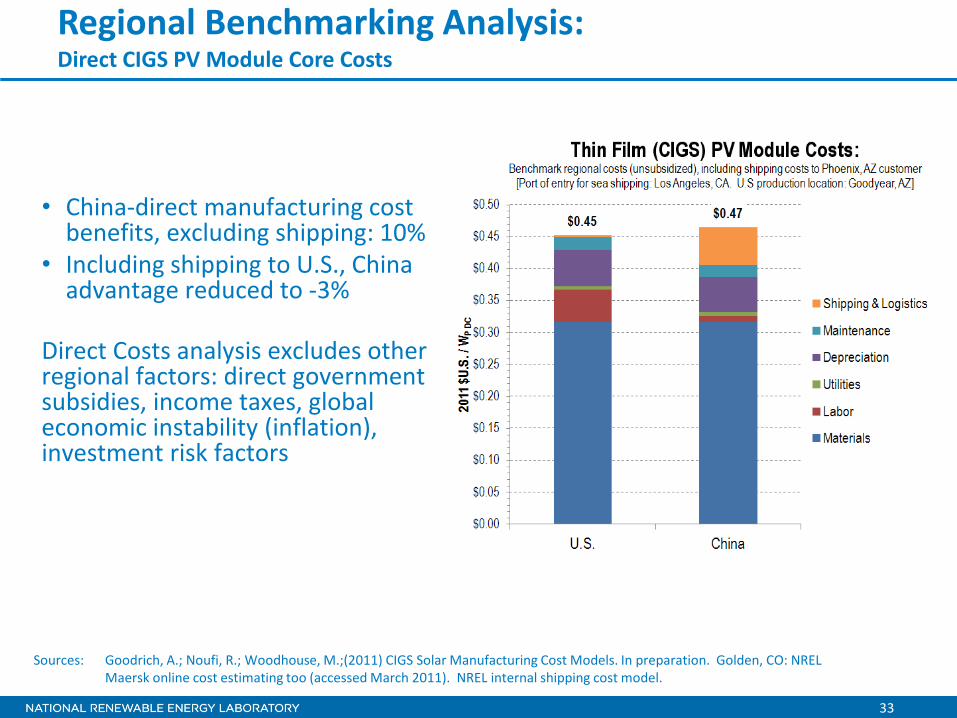
Regional Benchmarking Analysis: Direct CIGS PV Module Core Costs
• China-direct manufacturing cost benefits, excluding shipping: 10%
• Including shipping to U.S., China advantage reduced to -3%
Direct Costs analysis excludes other regional factors: direct government subsidies, income taxes, global economic instability (inflation), investment risk factors
Sources: Goodrich, A.; Noufi, R.; Woodhouse, M.;(2011) CIGS Solar Manufacturing Cost Models. In preparation. Golden, CO: NREL Maersk online cost estimating too (accessed March 2011). NREL internal shipping cost model.
34
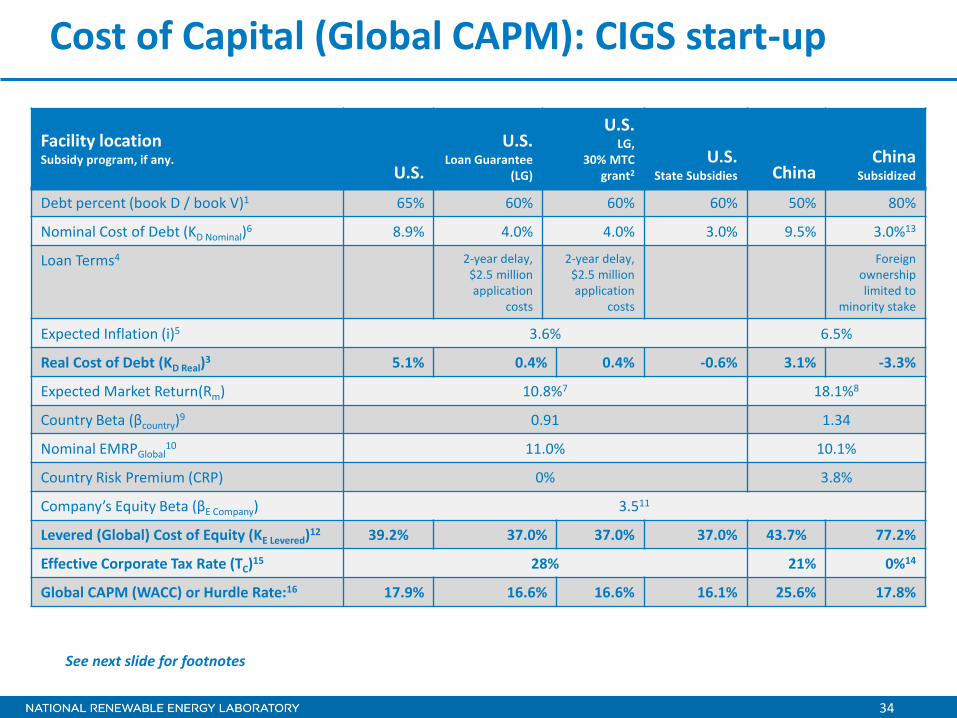
Cost of Capital (Global CAPM): CIGS start-up
Facility location Subsidy program, if any.
U.S.
U.S. Loan Guarantee
(LG)
U.S. LG,
30% MTC grant2
U.S. State Subsidies China
China Subsidized
Debt percent (book D / book V)1 65% 60% 60% 60% 50% 80%
Nominal Cost of Debt (KD Nominal)6 8.9% 4.0% 4.0% 3.0% 9.5% 3.0%13
Loan Terms4 2-year delay, $2.5 million application
costs
2-year delay, $2.5 million application
costs
Foreign ownership limited to
minority stake
Expected Inflation (i)5 3.6% 6.5%
Real Cost of Debt (KD Real)3 5.1% 0.4% 0.4% -0.6% 3.1% -3.3%
Expected Market Return(Rm) 10.8%7 18.1%8
Country Beta (βcountry)9 0.91 1.34
Nominal EMRPGlobal10 11.0% 10.1%
Country Risk Premium (CRP) 0% 3.8%
Company’s Equity Beta (βE Company) 3.511
Levered (Global) Cost of Equity (KE Levered)12 39.2% 37.0% 37.0% 37.0% 43.7% 77.2%
Effective Corporate Tax Rate (TC)15 28% 21% 0%14
Global CAPM (WACC) or Hurdle Rate:16 17.9% 16.6% 16.6% 16.1% 25.6% 17.8%
See next slide for footnotes
35
Cost of Capital (Global CAPM): CIGS start-up
Footnotes
1. Based on Suntech Corporation book value of total debt divided by book value of total assets (as of 10/06/11). 2. 30% Manufacturing Tax Credit (MTC) monetized in year 1, effectively reducing depreciation expenses. 3. KD real = Rf + Debt Margin; Rf = Global risk free rate (10 year U.S. T-bill), Debt Margin = corporate bond spread estimated
based on company leverage 4. U.S. LG award delay: 2 years, application cost: $2.5 million); Low cost China debt subsidized based on condition that foreign
ownership is limited to minority stake (≤49%) 5. Average rate of inflation (i) since Jan-2008 for U.S. and China, as reported by “Trading Economics”
(www.tradingeconomics.com) 6. Based on Fisher equation: KD nominal = (1 + KD real)*(1 + i) – 1 7. Expected market return (Rm U.S.): S&P 500. 50 years: 1961 to present (September 2011). 8. Expected market return (Rm China): MSCI AWCI Broad China 9. Country Beta (βCountry) = Covariance (Country Index, MSCI AWCI) / Variance (MSCI AWCI) 10. Nominal Equity Market Risk Premium (EMRP) = (Rm – KD nominal)/BCountry
11. Hypothetical company beta based on conversations with firms that have experience investing in solar PV start-ups. 12. KE Levered = KE Unlevered + [(D/E)*(KE Unlevered – KD nominal)] 13. As reported by PV start-ups investigating potential facility locations (2010). 14. 20 year China corporate tax holiday 15. U.S. Mean Effective Tax Rate (ETR): 28%; China 21%: . Markle, S.; Shackelford, D. (2009). “ Do Multinationals of Domestic
Firms Face Higher Effective Tax Rates?” NBER Working Paper Series. NBER Cambridge, MA. 16. WACC = [(E/V)*KE Levered] + [(D/V)*KD nominal*(1 – TC)]
36
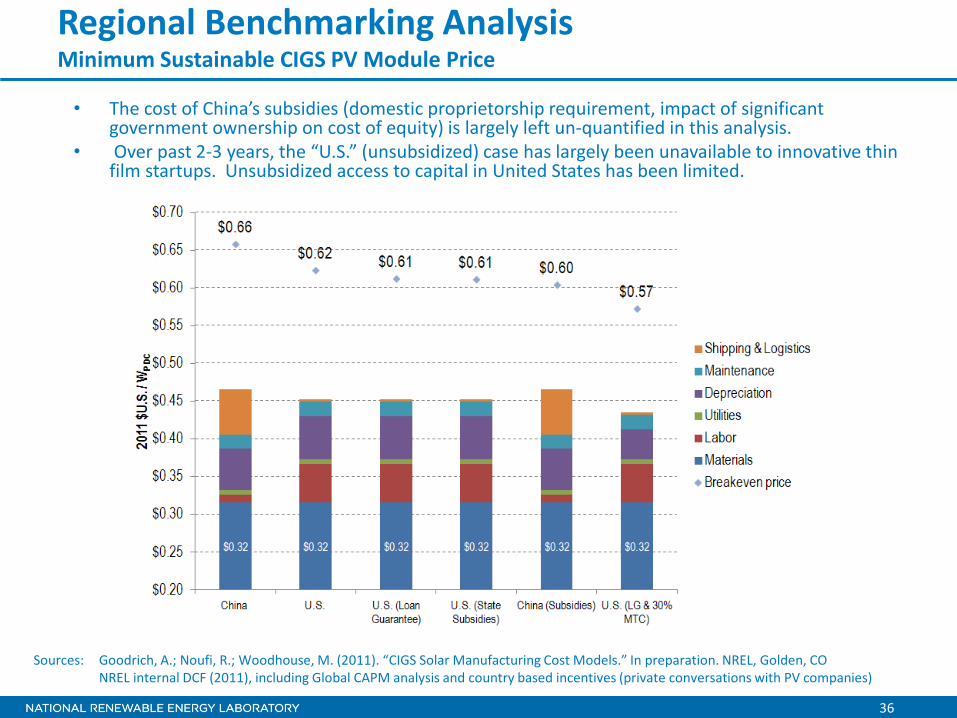
Regional Benchmarking Analysis Minimum Sustainable CIGS PV Module Price
• The cost of China’s subsidies (domestic proprietorship requirement, impact of significant government ownership on cost of equity) is largely left un-quantified in this analysis.
• Over past 2-3 years, the “U.S.” (unsubsidized) case has largely been unavailable to innovative thin film startups. Unsubsidized access to capital in United States has been limited.
Sources: Goodrich, A.; Noufi, R.; Woodhouse, M. (2011). “CIGS Solar Manufacturing Cost Models.” In preparation. NREL, Golden, CO NREL internal DCF (2011), including Global CAPM analysis and country based incentives (private conversations with PV companies)
37
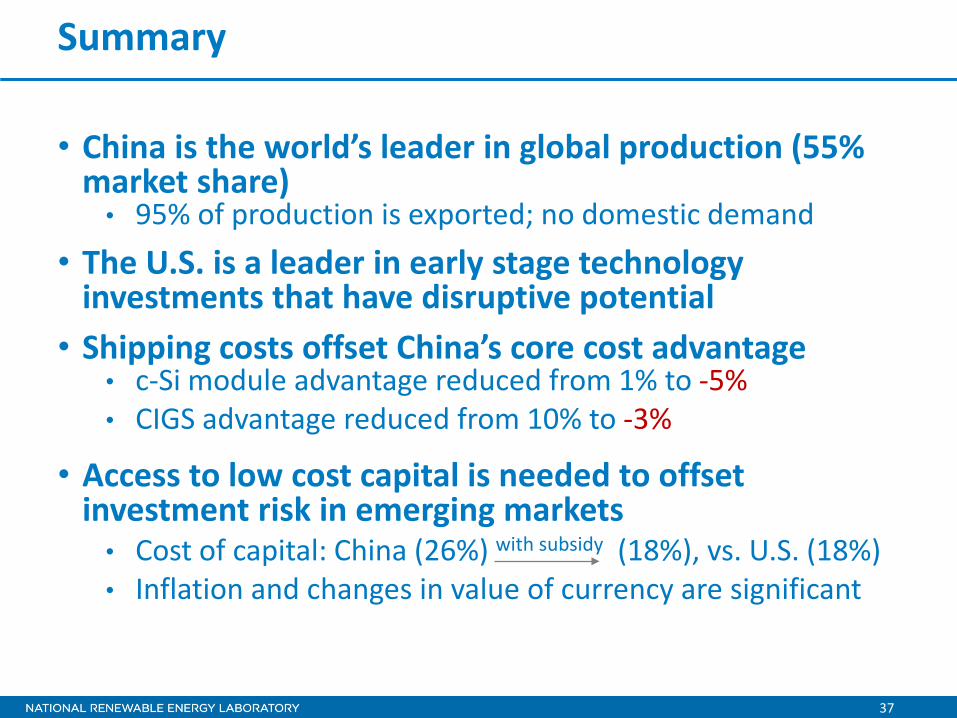
Summary
• China is the world’s leader in global production (55% market share) • 95% of production is exported; no domestic demand
• The U.S. is a leader in early stage technology investments that have disruptive potential
• Shipping costs offset China’s core cost advantage • c-Si module advantage reduced from 1% to -5% • CIGS advantage reduced from 10% to -3%
• Access to low cost capital is needed to offset investment risk in emerging markets • Cost of capital: China (26%) with subsidy (18%), vs. U.S. (18%) • Inflation and changes in value of currency are significant
38
Conclusions
• China advantage may not be sustainable • Inflation • Growing importance of shipping costs • Reliance on massive government subsidies • Lack of technology diversification
• Risk of being supplanted by disruptive non-Si technology
• U.S. incentives can level the playing field • The scale of Chinese incentives dwarf U.S. efforts • Access to capital is a critical compliment to the United
States’ capacity to innovate
39
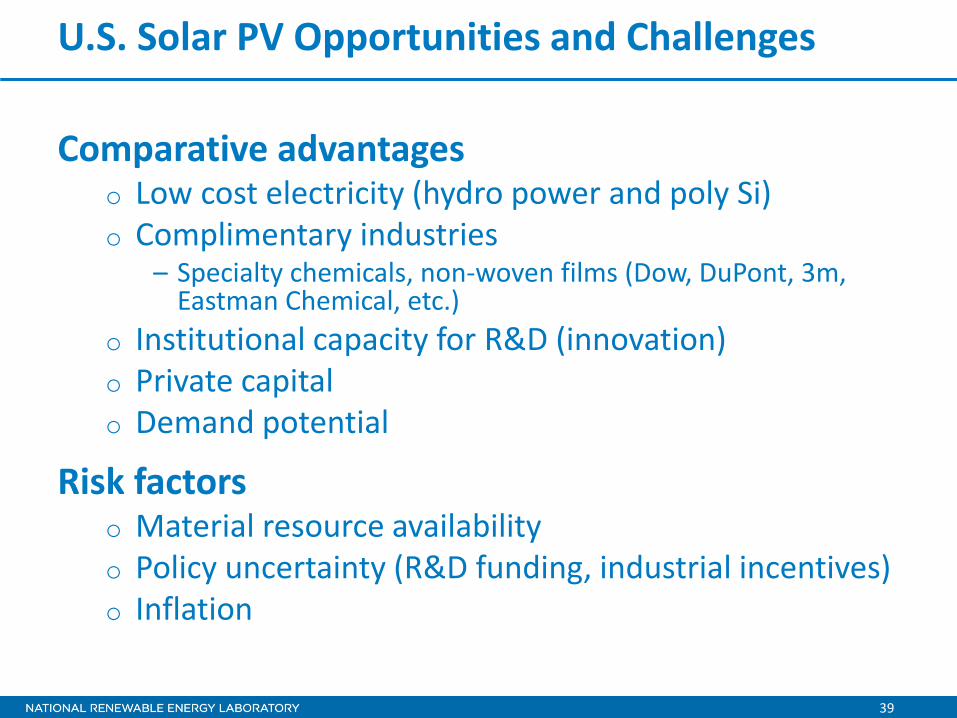
U.S. Solar PV Opportunities and Challenges
Comparative advantages o Low cost electricity (hydro power and poly Si) o Complimentary industries
– Specialty chemicals, non-woven films (Dow, DuPont, 3m, Eastman Chemical, etc.)
o Institutional capacity for R&D (innovation) o Private capital o Demand potential
Risk factors o Material resource availability o Policy uncertainty (R&D funding, industrial incentives) o Inflation
40
Acknowledgements
Colleagues at NREL who have contributed through both formal and informal discussions. Special thanks to David Feldman, Robert Margolis, and Rommel Noufi. Many industrial collaborators for their willingness to share data and provide invaluable external review.
APPENDIX
42
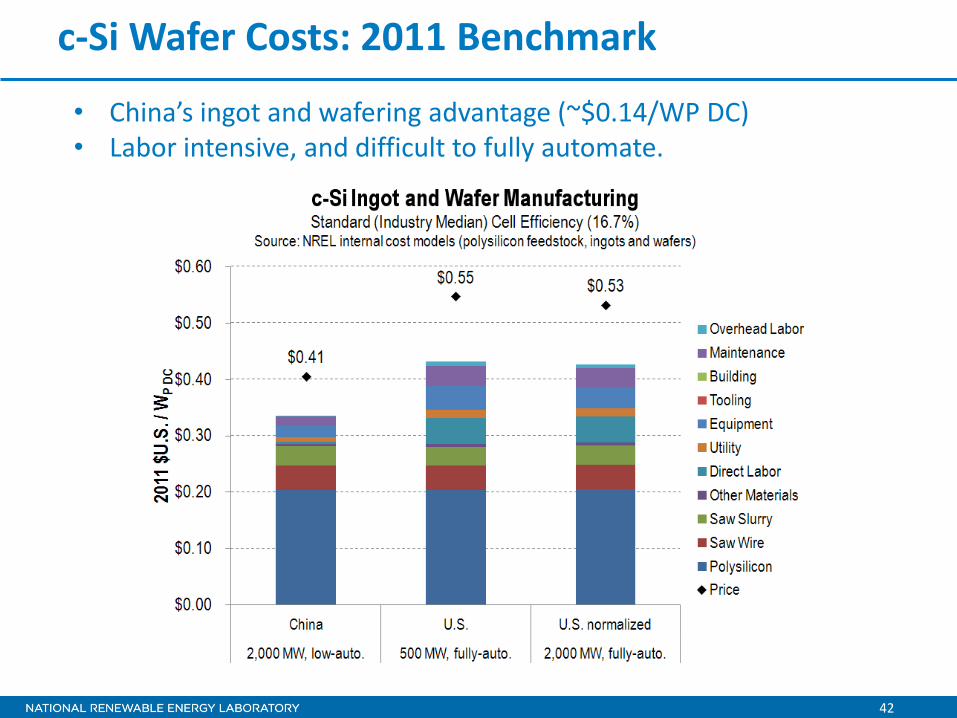
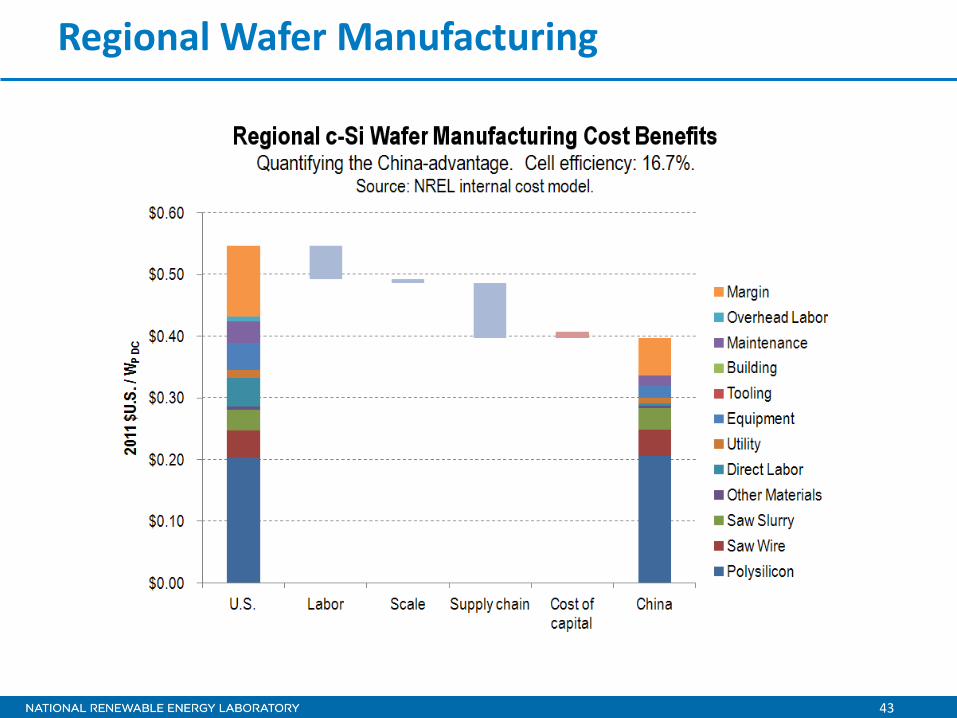
c-Si Wafer Costs: 2011 Benchmark
• China’s ingot and wafering advantage (~$0.14/WP DC) • Labor intensive, and difficult to fully automate.
43
Regional Wafer Manufacturing
44
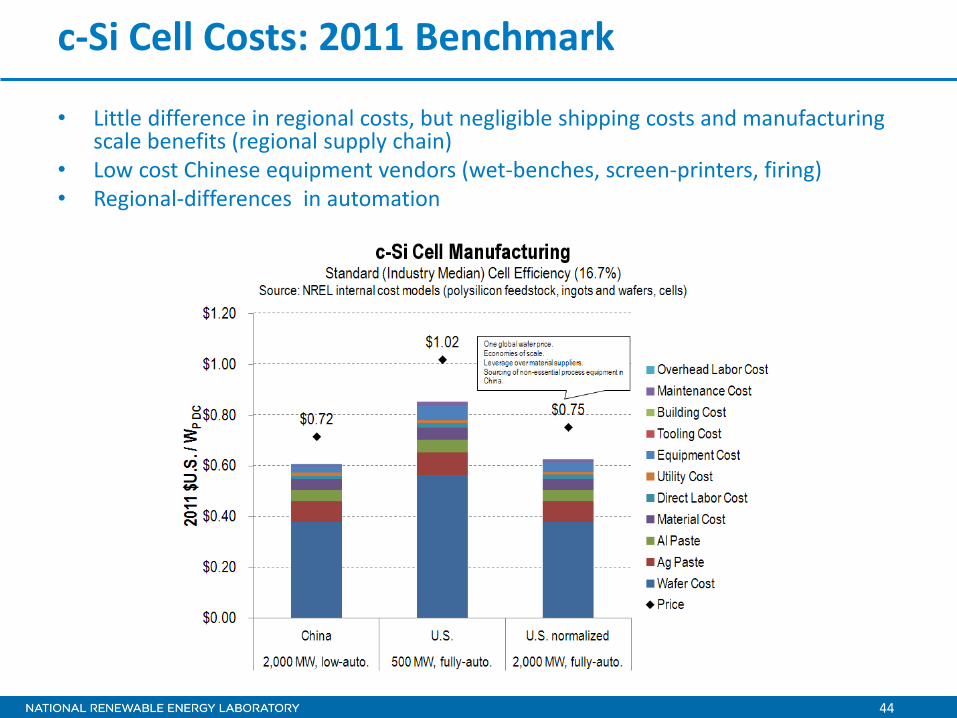
c-Si Cell Costs: 2011 Benchmark
• Little difference in regional costs, but negligible shipping costs and manufacturing scale benefits (regional supply chain)
• Low cost Chinese equipment vendors (wet-benches, screen-printers, firing) • Regional-differences in automation
45
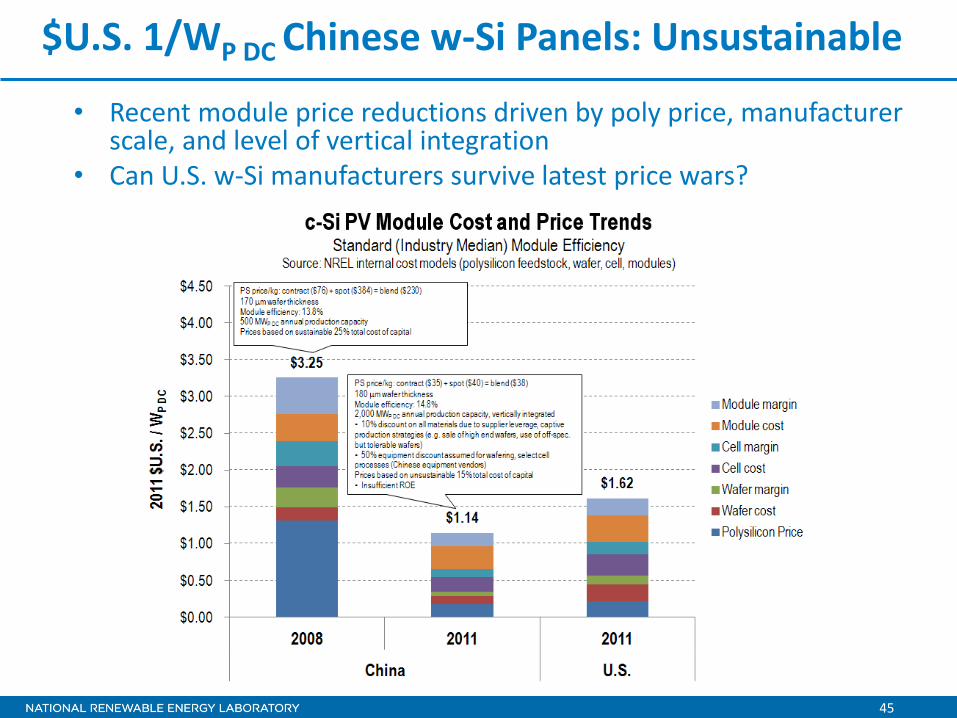
$U.S. 1/WP DC Chinese w-Si Panels: Unsustainable
• Recent module price reductions driven by poly price, manufacturer scale, and level of vertical integration
• Can U.S. w-Si manufacturers survive latest price wars?