Embed Size (px)
Citation preview

Solar potential on Auckland rooftops based on LiDARdata I
K. Suomalainena,∗, Vincent Wangb, Basil Sharpa
aThe Energy Centre, The University of Auckland, OGGB 6th Floor, 12 Grafton Rd,Auckland, New Zealand
bGeography Department, The University of Auckland, Building 201, Symonds Street,Auckland, New Zealand
Abstract
The energy system transition brought on by accessible solar power systems and
home storage technologies will have implications beyond the technical solutions.
In New Zealand solar power has been rapidly growing with the total installed
capacity increasing from just 5 MW in August 2013 to more than 35 MW in
March 2016. Most of the growth has taken place in the residential sector. Auck-
land Council has a goal of powering the equivalent of 176 565 homes by solar
photovoltaics by 2040. To assess what this might translate to in terms of the
number and size of solar installations we first need to assess the solar energy po-
tential on Auckland rooftops. In this study we have used LiDAR data to develop
a digital surface model of the city, including topography, buildings and trees.
With this model a solar radiation tool has been used to calculate the annual
solar radiation on each square meter of roof area, taking into account latitude,
time of year, time of day, average climatic conditions, surface orientation and
slope, and shading from nearby buildings and trees. This document gives some
background to the use of LiDAR data used for solar potential assessment and
the details of the methodology used to treat the data and provide the resulting
raster files.
IThis is a working paper.∗Corresponding author
Preprint submitted to Elsevier October 7, 2016
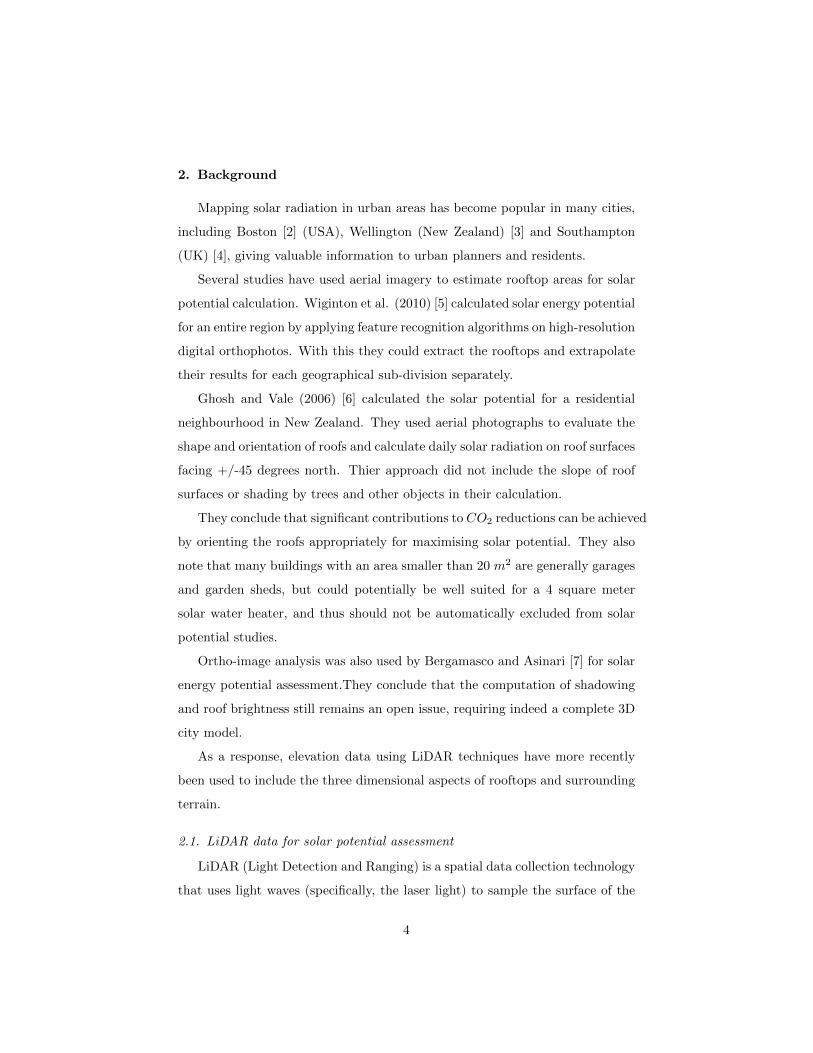
Contents
1 Introduction to the research topic 2
2 Background 4
2.1 LiDAR data for solar potential assessment . . . . . . . . . . . . . 4
2.2 Solar potential assessment in urban areas . . . . . . . . . . . . . 6
3 Methodology 8
3.1 LiDAR data processing . . . . . . . . . . . . . . . . . . . . . . . 8
3.2 Solar radiation modelling . . . . . . . . . . . . . . . . . . . . . . 9
3.3 Aggregating by house and suburb . . . . . . . . . . . . . . . . . . 9
4 Data 10
4.1 LiDAR data . . . . . . . . . . . . . . . . . . . . . . . . . . . . . . 10
4.2 Building and suburb outlines . . . . . . . . . . . . . . . . . . . . 12
5 Results 12
5.1 Solar radiation per house and neighbourhood . . . . . . . . . . . 12
6 Discussion 17
7 Conclusions 18
1. Introduction
Renewable energy and energy storage are two of twelve potentially economi-
cally disruptive technologies, with potential to disrupt the status quo, alter the
way people live and work, and ultimately lead to entirely new products and
services, as reported by the McKinsey Global Institute [1]. According to the
report lithium-ion battery packs used in electric vehicles have seen a price de-
cline of 40 percent since 2009, and the price of a solar photovoltaic (PV) cell
per watt has declined by 85 percent since 2000. It is indeed the combination of
2

a innovative technology with economic availability that allows a technology to
become potentially disruptive.
Solar power has been rapidly growing in New Zealand with total installed
capacity increasing from just 5 MW in August 2013 to more than 40 MW in
August 2016. Most of the growth has taken place in the residential sector.
Auckland Council has a goal of generating the power equivalent of 176 565
homes by solar PV by 2040, yet in August 2016 the installed solar PV capacity
was just 2700 installations (or 10 MW).
If the current growth trend continues, the electricity retail sector is likely
to experience significant changes in its operation and pricing mechanisms. New
Zealand retailars have already shifted away from paying their customers for solar
power fed into the grid, while some lines companies have introduced a higher
fixed charge to customers with solar power. While this might discourage uptake,
the decrease in price of both solar cells and batteries is likely to incentivise
consumers to invest in solar installations, and possibly, with the current signals
from the market, to take a step further and invest in storage and a back-up
system, such as a small-scale diesel generator, enabling them to go off-grid
althogether.
Not only would this have a potentially negative impact on the carbon emis-
sions of New Zealand’s electricity generation, it would also leave a lower number
of people paying for the costs of maintaining the grid, those generally being the
customers who can’t afford to invest in solar, battery and back-up technologies.
To assess the potential magnitude of such a shift and initiate any discussion on
its policy implications, it is necessary to accurately assess the solar radiation in
the residential sector of the region, with a spatial resolution that is relevant for
assessing solar potential in relation to demographics such as household income
in different suburbs.
Section 2 provides the background and motivation for the research, section 3
goes through the various steps in our methodology, section 4 presents the data
we have used, section 5 provides some examples from results.
3
2. Background
Mapping solar radiation in urban areas has become popular in many cities,
including Boston [2] (USA), Wellington (New Zealand) [3] and Southampton
(UK) [4], giving valuable information to urban planners and residents.
Several studies have used aerial imagery to estimate rooftop areas for solar
potential calculation. Wiginton et al. (2010) [5] calculated solar energy potential
for an entire region by applying feature recognition algorithms on high-resolution
digital orthophotos. With this they could extract the rooftops and extrapolate
their results for each geographical sub-division separately.
Ghosh and Vale (2006) [6] calculated the solar potential for a residential
neighbourhood in New Zealand. They used aerial photographs to evaluate the
shape and orientation of roofs and calculate daily solar radiation on roof surfaces
facing +/-45 degrees north. Thier approach did not include the slope of roof
surfaces or shading by trees and other objects in their calculation.
They conclude that significant contributions to CO2 reductions can be achieved
by orienting the roofs appropriately for maximising solar potential. They also
note that many buildings with an area smaller than 20 m2 are generally garages
and garden sheds, but could potentially be well suited for a 4 square meter
solar water heater, and thus should not be automatically excluded from solar
potential studies.
Ortho-image analysis was also used by Bergamasco and Asinari [7] for solar
energy potential assessment.They conclude that the computation of shadowing
and roof brightness still remains an open issue, requiring indeed a complete 3D
city model.
As a response, elevation data using LiDAR techniques have more recently
been used to include the three dimensional aspects of rooftops and surrounding
terrain.
2.1. LiDAR data for solar potential assessment
LiDAR (Light Detection and Ranging) is a spatial data collection technology
that uses light waves (specifically, the laser light) to sample the surface of the
4

earth. It is a powerful earth observation tool that provides highly accurate
3D information of target areas. By recording reflected pulses of laser light
from ground objects along with the signal return time, LiDAR systems directly
measure the height of ground objects and store it in high-dense points that also
contain other attributes such as classification, planar coordinates, GPS time,
scan angle, etc.
From the aggregation of these points, also know as point cloud, high-resolution
spatial information in both planar and vertical dimensions can be derived. This
high-resolution spatial information can be used to delineate building footprints
and structures with high accuracy [8]. Ultimately, based on the high-dense
point cloud, a high resolution digital elevation model (DEM) can be generated
to enhance the delineation of terrain features [8]. Therefore, LiDAR data has
been successively used for building footprints and height extraction in a variety
of urban areas [9, 10]. LiDAR technology is also cost-effective. It can be up to
70% cheaper than traditional photogrammetric methods in terms of generating
DEM products [11]. It is also less time-consuming and has a higher degree of
automation in data collection, processing and information extraction [12].
Solar radiation tools have previously been combined with digital terrain
models to assess the influx of solar radiation on a surface over a day and over
seasons. Nguyeg and Pearce (2010) [13] used r.sun software package and Geo-
graphical Resources Analysis Support System to calculate the solar potential for
large scale solar power projects in fourteen counties in South-eastern Ontario,
Canada at a spatial resolution on 1 square km.
To calculate solar potential on rooftops a trade off between total area size and
building details is common. Izquierdo et al. (2008) estimated the photovoltaic
potential in all regions of Spain based on a finite set of average building types
[14].
Several other studies use a small area such as a block of houses or a neigh-
bourhood, to calculate solar energy potential on rooftops, taking in to account
the shapes and orientations of every rooftop individually [6, 15, 16, 17]. Redweik
et al. (2013) [18] used LiDAR data to assess solar potential of both rooftops
5

and building facades for university campus area, with a spatial resolution of 1
square meter. Brito et al. (2012) [19] used LiDAR data for a neighbourhood of
538 buildings to estimate the solar PV potential of the rooftops.
Thus, LiDAR data has been been increasingly used in solar energy system
assessment and design [15, 20, 21], and given the above-mentioned advantages of
the LiDAR technology, coupled with the availability of LiDAR data in our study
area, it is quite cost-effective and feasible to conduct building roof extraction
based on LiDAR data.
Where we have taken this methodology a step further is in covering an area
of 2250 square kilometers, assessing the solar potential on each rooftop with a
spatial resolution of 1 square meter. To demonstrate the value of this approach
to policy making, we have aggregated solar radiation data per rooftop to a
suburb level, which is relevant when comparing to demographic data such as
household income.
2.2. Solar potential assessment in urban areas
Various approaches have been applied to estimate the solar energy potential
in urban areas for policy insights. Hofierka and Kanuk [22] used a combina-
tion of topographic maps, orthophotomaps and building footprints to assess the
photovoltaic potential on various urban zones characterised by morphology and
functionality. With a spatial resolution of 1 square meter they covered a total of
1444 buildings. Their 3-D city model comprises of topographic information, not
including the shading from trees and other nearby objects, and they conclude
that a more complete 3-D model together with for example socio-demographic
statistics could better reflect properties of various intra-urban structures.
Ordonez et al. [23] analised the photovoltaic solar energy capacity of res-
idential rooftops in Andalusia, Spain, by categorising the building sector on
building characteristics and calculating the useful roof surface area for pho-
tovoltaic system installations. They analised a total of 18,520 buildings and
show the importance of the design of roof-mounted elements when it comes to
optimising energy production.
6

Hachem et al. [24] investigate the influence of geometric shapes of housing
units, the density of units and different neighbourhood layouts on solar energy
potential. The results indicate that total electricity generation is affected by
both shape and orientation. Based on differences in roof shapes and neighbour-
hood layouts, we expect our results to differentiate between neighbourhoods in
this manner as well.
Wiginton et al. (2010) [5] also assessed the solar energy rooftop potential
in their region of study in relation to population density, finding a near linear
relationship between roof area and population, although roof area per capita
shows an increase in the less densely populated regions. They indicate that
the more rural regions offer a particularly large opportunity for rooftop PV
deployment, especially given the higher electricity transmission costs in rural
regions. This also reflects the necessity for lines companies to weigh costs of
solar PV and storage systems against the costs of maintenance and upgrades of
existing lines or the installment of new lines for potentially fewer customers.
More recently, neighbourhood-scale has become a commonly used approach
for studies concerning urban planning and design in growing cities. The po-
tential to generate renewable energy within city boundaries is a topic of wide
interest both in research and municipal planning. Sarralde et al. [25] studied
the relationship between aggregated urban form descriptors and the potential to
harvest solar energy within Greater London. To model urban morphology they
used so called Lower Layer Super Output Areas (LSOA), which are assumed to
represent typical neighbourhoods of Greater London.
Berg [26] describes seven dynamic aspects of sustainability, including physi-
cal resources, economic resources, social and organisational resources, that were
used to model a community and study how the management of these aspects can
be used to optimise the sustainability conditions of unique local communities
of the city. They conclude that the dynamic model allowed them to compare
different parts of the city with different site and situation-specific properties.
Therefore the neighbourhood unit was a useful base, being small enough to be
studied thoroughly and large enough to represent the different townscape types
7

of the city.
This indicates the potential of our results, which are aggregated to the neigh-
bourhood level, to be relevant for future research, beyond the study of solar
potential to a broader assessment of local opportunities. In fact, as LiDAR
data is becoming commonly available in most metropolitan areas, our research
presents a reliable bottom-up tool for detailed analysis of the solar energy po-
tential of the existing individual rooftops for a region or municipality, which
can be readily aggregated to the relevant area unit, commonly the neighbour-
hood level. As we present in this paper, such results can be combined with
socio-economic data, such as household income, to assess potential opportuni-
ties, challenges and policy needs to assure an equitable transition to distributed
generation that optimises the use of local resources, in this case solar energy.
3. Methodology
3.1. LiDAR data processing
Given the large amount of data points in the LiDAR point cloud dataset,
a LiDAR dataset is typically separated into tiles for further data handling.
However, processing the data points at the tile edges can be problematic as many
of the algorithms, such as distinguishing between ground and above-ground
points, need to consider the 3-D spatial relationship of the current point and
surrounding ones. To avoid this edge effect, the whole dataset was redivided
into tiles of 1000 m by 1000 m with a 50 m buffer zone among adjacent tiles.
In each tile, the data points were classified into two categories: ground and
above-ground points. The height of above-ground points is given as the absolute
elevation above the ground, which was defined by the ground points. The height
of the ground points is given as the elevation above mean sea level, and, in our
case, the datum is defined as the New Zealand Traverse Mercator. The ground
and above-ground points were then used to generate a digital terrain model
(DTM) and a digital surface model (DSM), respectively.
8

The resulting raster files, one per neighbourhood, contain four bands which
correspond to:
1. Annual solar radiation, kWh/m2,
2. Slope of the rooftop area, in degrees (Note that some values may reflect
vertical surfaces, or trees overlaying roof areas.),
3. Aspect of the rooftop, orientation clockwise from north, in degrees,
4. Elevation from sea level, m.
3.2. Solar radiation modelling
To calculate the solar radiation on each square meter of roof area, we use the
solar radiation toolkit in ArcGIS software. This model takes in to account cli-
matic features such as atmospheric transmissivity and the proportion of diffuse
radiation. The details of the solar radiation modelling can be found at [27].
The amount of solar radiation received by the surface is only a portion of
what would be received outside the atmosphere. Transmittivity of the atmo-
sphere is expressed as the ratio of the energy reaching the earth’s surface to that
which is received at the upper limit of the atmosphere. Values range from 0 (no
transmission) to 1 (complete transmission). Typically observed values are 0.6
or 0.7 for very clear sky conditions and 0.5 for a generally clear sky. To estimate
the atmospheric conditions of Auckland, we apply an atmospheric transmissivity
factor of 0.5. Similarly, the factor for the proportion of global normal radiation
flux that is diffuse can take values from 0 to 1. We have applied the default
value of 0.3, which corresponds to ”generally clear sky conditions”.
3.3. Aggregating by house and suburb
To estimate the solar radiation potential for an individual house, we consider
current residential scale solar power technologies, and the areas that different
size systems would occupy on the rooftop. Currently the average size of solar
PV installation in New Zealand in roughly two to three kilo-Watts (kW). We
estimate a 2 kW system to require a roof top area of roughly 14 m2 and a 3
9

kW system to require 20 m2 of roof area and calculate the total annual so-
lar radiatiom on the 14 and 20 m2 of roof area with the highest annual solar
radiation.
To reflect future systems with batteries, we also calculate results for the 28
and 36 m2 roof areas with highest solar radiation, roughly corresponding to 5
kW and 7 kW sized PV systems.
Thus, for each roof top we calculate the annual radiation of the 14, 20, 28
and 36 m2 that receive the highest annual solar radiation. These calculations
reflect the assumption that eventual solar panels are placed on the area of roof
that receives most solar radiation over the year. We do not account for a case
where the m2 that receive the highest total annual radiation may be located on
different segments of the roof, but could be on several different segments of the
roof, meaning that optimising the solar installation to maximise total annual
solar radiation, may require installing the panels in several smaller arrays.
To compare aggregate the solar energy potential of individual houses per
suburb, we calculate the average annual solar radiation for the 14, 20, 28 and
36 m2 of roof area with the highest annual solar radiation of all the buildings
in each suburb. Since our study focuses on residential areas, we have excluded
suburbs with mainly industrial buildings, but we have not distiguished between
different building types in the suburbs that we have included in this study.
4. Data
4.1. LiDAR data
The LiDAR data used in this study were provided by Auckland Council,
delivered by NZ Aerial Mapping and Aerial Surveys Ltd. This dataset was col-
lected during July to November, 2013, using Optech LiDAR sensors (models
ALTM3100, Orion M200 and Orion H300). The final LiDAR point cloud prod-
uct was featured by minimum 1.5 points per square meter (in open areas) and
+/- 0.1 m vertical accuracy. This point cloud product that consists of 6511 tiles
of 480 m by 720 m was stored in .las format files.
10
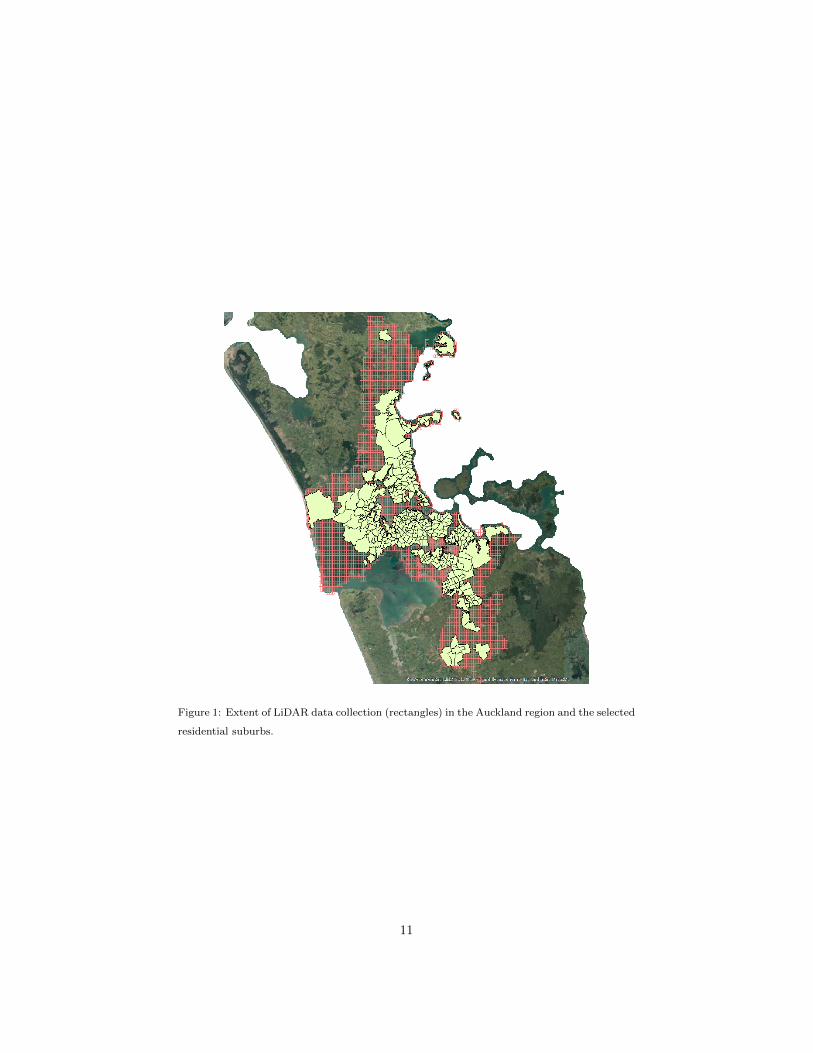
Figure 1: Extent of LiDAR data collection (rectangles) in the Auckland region and the selected
residential suburbs.
11

4.2. Building and suburb outlines
To define which points are from rooftops we used shapefiles for building foot-
prints, provided by Auckland Council. To define suburbs, we use 2013 census
geographical boundaries of so called area units [29]. Area units within urban
areas normally contain a population of 3,000-5,000 people, and are generally
recognised by name by residents. We select the suburbs with mainly residen-
tial buildings, resulting in 334 area units, holding a total of 649,141 building
rooftops. Due to the possibility of using roof areas as small as four square meters
for solar hot water or small solar power installations, we have not set a minimum
roof area when calculating solar radiation per square meter of rooftop. Thus
our building set includes separate garages and garden sheds, as long as they are
included in the council’s building footprints database. However, smaller than
20 m2 buildings are excluded from the results for solar PV potential, due to the
size of typical residential PV installations.
Figure 6 shows the extent of the original LiDAR data and the regional area
units included in our study. Excluded areas are either sparesly populated, in-
dustrial, or have only partial LiDAR data coverage.
5. Results
5.1. Solar radiation per house and neighbourhood
Figure 2 shows the distribution of total annual solar radiation on the top
14, 20, 28 and 36 m2 of roof area. As can be expected, the distribution spreads
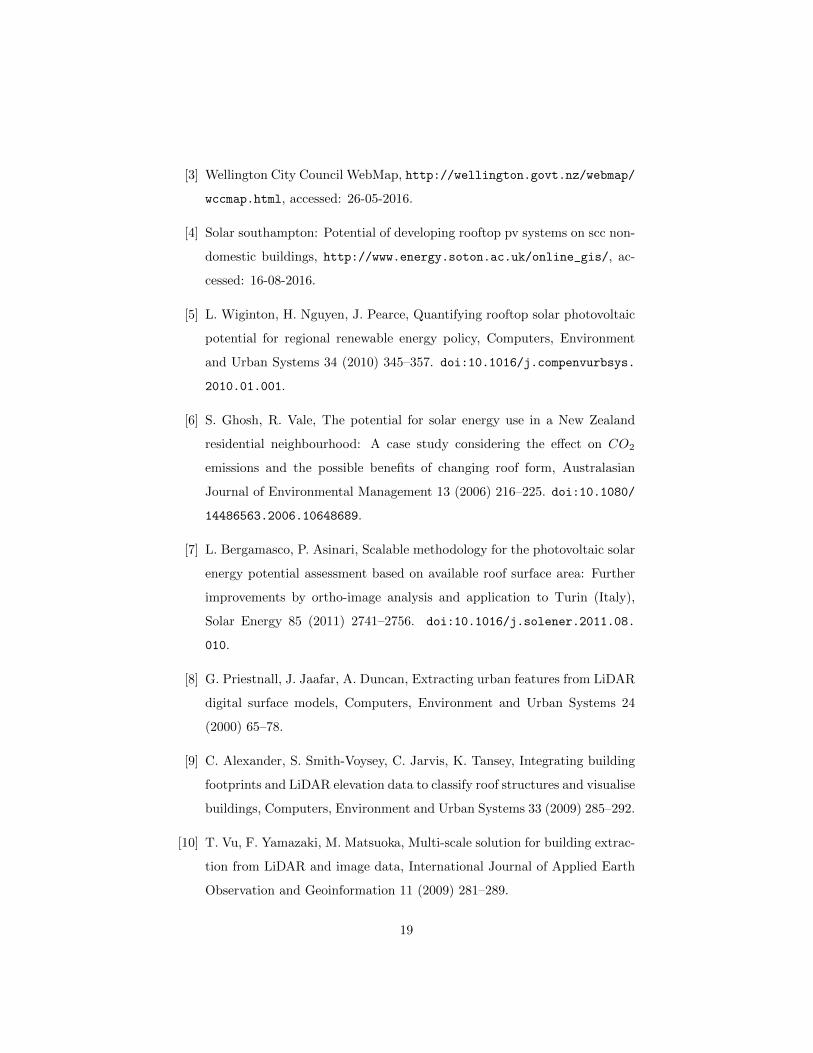
out towards the left as larger rooftop areas are covered. Figure 3 shows the
annual radiation results for a subset of rooftops from one suburb and how those
rooftops can be rated by annual solar radiation based on the area with the
highest results. The figure also confirms that most often the square meters
with the highest solar radiation results are adjacent to each other, indicating it
is a reasonable statistical metric for the radiation that a solar PV installation
would receive if placed on that location on the rooftop. However, if looking
at an individual rooftop with the intention of installing a solar PV system of
12

Table 1: Rating scheme for rooftops based on annual solar radiation, which can be applied to
the average solar radiation on a given area of highest solar radiation.
Rating Annual radiation Share of rooftops
kWh/m2
1 <1100 3.7%
2 1100–1200 4.6%
3 1200–1300 18.0%
4 1300–1400 71.8%
5 1400–1500 1.9%
a certain size, it is important to assess the results in relation to the actual
roof configuration and see whether the results are indeed from one or several
segments of that roof.
Figure 4 shows the results of a simple rating scheme used to visually compare
suburbs. The ratings are given in table 5.1. The figure shows how the buildings
constructed more systematically with a north-south orientation (figure 4 right)
in a newer suburb have a higher rating than the rooftops in the older suburb
with more variety in building orientation and larger, more mature trees.
Figure 5 gives the annual solar radiation on the selected roof areas ordered
from highest to lowest, with the plot cropped at 1000 kWh/m2. While few
houses have a solar potential of over 1400 kWh/m2, this graph provides an esti-
mate of buildings feasible for PV installations given a certain minimum annual
radiation level.
The average annual solar radiation of the buildings’ top 14, 20, 28 and 36 m2
gives an indicative rating of the rooftops in a suburb, by potential PV system
size. Figure 6 these results for small PV systems i.e. the top 14 m2 of rooftops.
The results range from 1121 kWh/m2/yr to 1372 kWh/m2/yr. However, the
resulting number is unimportant to individual houses, and this figure should
rather be used as a starting point to understand the differences in building
types, topography and vegetation between different suburbs.
13
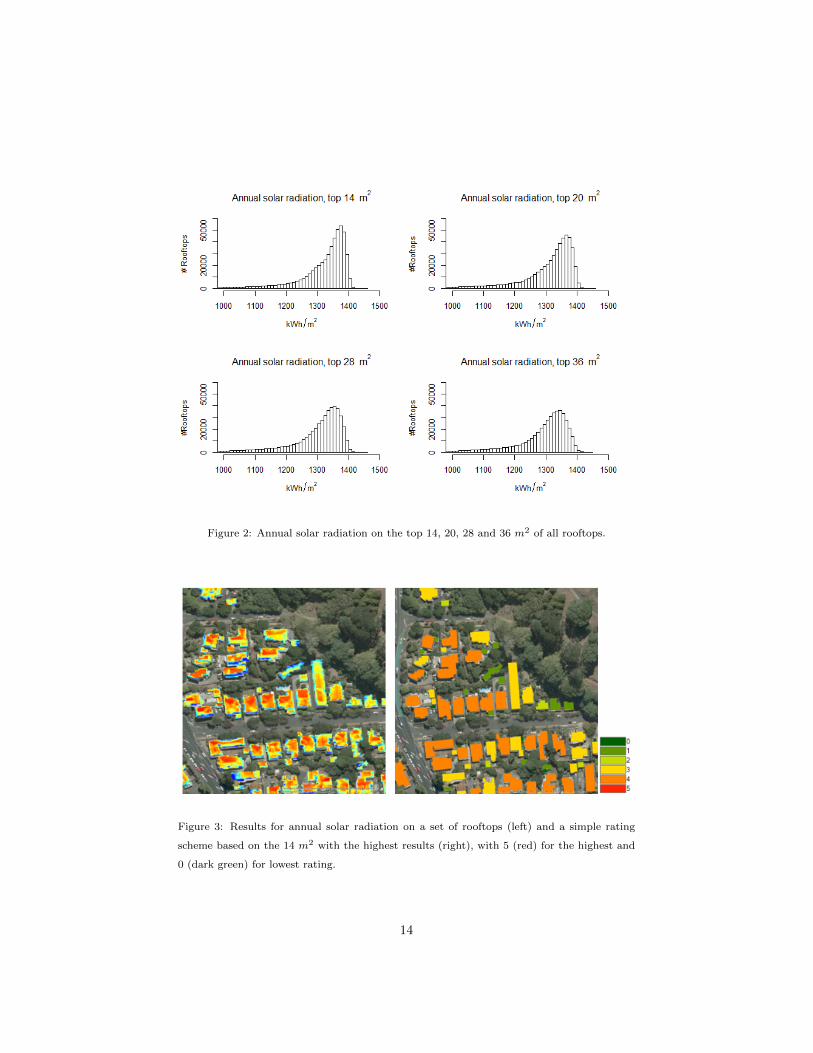
Figure 2: Annual solar radiation on the top 14, 20, 28 and 36 m2 of all rooftops.
Figure 3: Results for annual solar radiation on a set of rooftops (left) and a simple rating
scheme based on the 14 m2 with the highest results (right), with 5 (red) for the highest and
0 (dark green) for lowest rating.
14

Figure 4: Results from rating rooftops based on the annual solar radiation on the 14 m2 with
the highest results in an older suburb (left) and a more recently built suburb (right).
Figure 5: All rooftops sorted by annual solar radiation on for the four selected areas.
15

Figure 6: Rating of suburbs by average annual solar radiation on the top 14 m2 of rooftops.
16

6. Discussion
This paper demonstrated the use of LiDAR data for bottom-up assessment
of rooftop solar potential for a larger area than is typically found in literature.
We have aggregated results to a suburb level to provide information for policy
and municipal planning purposes. Although visualisation of results at house
level gives direct information to residents about the level of annual solar ra-
diation and the sunniest location on their rooftop, these results should not be
used for investment decisions. The approach we have used is statistical and
assumes certain parameters for transmissivity that may need correction. Also,
local climatic effect such as typical cloudiness during a certain time of day, or
local seasonal effects, are not accounted for. Thus, rather than being highly ac-
curate on local weather, our model is highly accurate on rooftop shapes and the
shapes and heights of, and hence shading by, nearby objects. We expect the re-
sults to accurately reflect the relative annual solar energy potential of rooftops.
However, a detailed assessment of any individual site should be carried out for
actual decision making purposes.
A comparison with a solar radiation tool based on measured solar radiation
data has showed that our results underestimate the annual solar radiation by
3-5% on the sunniest spots on the roof. Also, our model assumes trees to be
opaque, which is not entirely true in general, especially in winter for deciduous
trees. As a next step to improve the model, we suggest linking the LiDAR based
digital elevation model with a solar radiation calculator using measured solar
radiation data.
Using NIWA’s SolarView data with the digital elevation model we have
developed would be a reasonable next step in developing the approach for solar
potential assessment of individual houses. This would provide a tool with high
spatial resolution coupled with locally measured solar radiation data, which
would better account for local effects of nearby buildings, trees and variable
cloudiness across days and seasons.
17

7. Conclusions
LiDAR data has become increasingly available and is commonly used solar
radiation assessment. It provides a cost-effective technique to generate a detailed
digital elevation model of a roof and its surroundings, whoch often used digital
terrain models do not provide.
Based on our aggregated results we conclude that there are large differences
of solar energy potential between individual houses and even at the suburb level.
Some neighbourhoods are more systematically built with north-south oriented
roofs, which is generally best suited for solar energy applications. Also, older,
historical neighbourhoods tend to have more fully grown trees that cause more
shading than more recently developed residential areas, which can also have
some impact on results.
Future research could include developing a model for individual rooftops
and/or investigation of market models for low-income customers to participate
in solar energy generation.
Acknowledgements
We would like to acknowledge the Energy Education Trust of New Zealand
for funding the post-doctoral research position of the corresponding author.
We would also like to acknowledge Auckland Council for providing us with the
LiDAR data.
References
[1] J. Manyika, M. Chui, J. Bughin, R. Dobbs, P. Bisson, A. Marrs, Disryptive
technologies: Advances that will transform life, business, and the global
economy, Tech. rep., McKinsey Global Institute (05 2013).
[2] mapdwell r Solar System tm, Boston, MA, www.mapdwell.com/en/boston,
accessed: 26-05-2016.
18
[3] Wellington City Council WebMap, http://wellington.govt.nz/webmap/
wccmap.html, accessed: 26-05-2016.
[4] Solar southampton: Potential of developing rooftop pv systems on scc non-
domestic buildings, http://www.energy.soton.ac.uk/online_gis/, ac-
cessed: 16-08-2016.
[5] L. Wiginton, H. Nguyen, J. Pearce, Quantifying rooftop solar photovoltaic
potential for regional renewable energy policy, Computers, Environment
and Urban Systems 34 (2010) 345–357. doi:10.1016/j.compenvurbsys.
2010.01.001.
[6] S. Ghosh, R. Vale, The potential for solar energy use in a New Zealand
residential neighbourhood: A case study considering the effect on CO2
emissions and the possible benefits of changing roof form, Australasian
Journal of Environmental Management 13 (2006) 216–225. doi:10.1080/
14486563.2006.10648689.
[7] L. Bergamasco, P. Asinari, Scalable methodology for the photovoltaic solar
energy potential assessment based on available roof surface area: Further
improvements by ortho-image analysis and application to Turin (Italy),
Solar Energy 85 (2011) 2741–2756. doi:10.1016/j.solener.2011.08.
010.
[8] G. Priestnall, J. Jaafar, A. Duncan, Extracting urban features from LiDAR
digital surface models, Computers, Environment and Urban Systems 24
(2000) 65–78.
[9] C. Alexander, S. Smith-Voysey, C. Jarvis, K. Tansey, Integrating building
footprints and LiDAR elevation data to classify roof structures and visualise
buildings, Computers, Environment and Urban Systems 33 (2009) 285–292.
[10] T. Vu, F. Yamazaki, M. Matsuoka, Multi-scale solution for building extrac-
tion from LiDAR and image data, International Journal of Applied Earth
Observation and Geoinformation 11 (2009) 281–289.
19

[11] B. Petzold, P. Reiss, W. Stossel, Laser scanning – surveying and mapping
agencies are using a new technique for the derivation of digital terrain
models, ISPRS Journal of Photogrammetry and Remote Sensing 54 (1999)
95–104. doi:10.1016/S0924-2716(99)00005-2.
[12] E. Baltsavias, A comparison between photogrammetry and laser scanning,
ISPRS Journal of photogrammetry and Remote Sensing 54 (1999) 83–94.
[13] H. Nguyen, J. Pearce, Estimating potential photovoltaic yield with r.sun
and the open source Geographical Resources Analysis Support System,
Solar Energy 84 (2010) 831–843. doi:10.1016/j.solener.2010.02.009.
[14] S. Iquierdo, M. Rodrigues, N. Fueyo, A method for estimating the ge-
ographical distribution of the available roof surface area for large-scale
photovoltaic energy-potential evaluations, Solar Energy 82 (2008) 929–939.
doi:10.1016/j.solener.2008.03.007.
[15] N. Lukac, S. Seme, D. Zlaus, G. Stumberger, B. Zalik, Buildings roofs
photovoltaic potential assessment based on LiDAR (Light Detection And
Ranging) data, Energy 66 (2014) 598–609. doi:10.1016/j.energy.2013.
12.066.
[16] H. Nguyen, J. Pearce, R. Harrap, G. Barber, The application of LiDAR to
assessment of rooftop solar photovoltaic deployment potential in a munici-
pal district unit, sensors 12 (2012) 4534–4558. doi:10.3390/s120404534.
[17] R. Kassner, W. Koppe, T. Schuttenberg, G. Bareth.
[18] P. Redweik, C. Catita, M. Brito, Solar energy potential on roofs and facades
in an urban landscape, Solar Energy 97 (2013) 332–341. doi:10.1016/j.
solener.2013.08.036.
[19] M. Brito, N. Gomes, T. Santos, J. Tenedorio, Photovoltaic potential in a
Lisbon suburb using LiDAR data, Solar Energy 86 (2012) 283–288. doi:
10.1016/j.solener.2011.09.031.
20

[20] T. Le, D. Kholdi, H. Xie, B. Dong, R. Vega, LiDAR-based solar mapping for
distributed solar plant design and grid integration in San Antonio, Texas,
Remote Sensing 8 (2016) 247. doi:10.3390/rs8030247.
[21] S. Szabo, P. Enyedi, M. Horvath, Z. Kovacs, P. Burai, T. Csoknyai,
G. Szabo, Automated registration of potential locations for solar energy
production with Light Detection And Ranging (LiDAR) and small format
photogrammetry, Journal of Cleaner Production 112: Part 5 (2016) 3820–
3829.
[22] J. Hofierka, J. Kanuk, Assessment of photovoltaic potential in urban areas
using open-source solar radiation tools, Renewable Energy 34 (2009) 2206–
2214. doi:10.1016/j.renene.2009.02.021.
[23] J. Ordonez, E. Jadraque, J. Alegre, G. Martınez, Analysis of the photo-
voltaic solar energy capacity of residential rooftops in Andalusia (Spain),
Renewable and Sustainable Energy Reviews 14 (2010) 2122–2130. doi:
10.1016/j.rser.2010.01.001.
[24] C. Hachem, A. Athienitis, P. Fazio, Investigation of solar potential of hous-
ing units in different neighborhood designs, Energy and Buildings 43 (2011)
2262–2273. doi:10.1016/j.enbuild.2011.05.008.
[25] J. Sarralde, D. Quinn, D. Wiesmann, K. Steemers, Solar energy and urban
morphology: Scenarios for increasing the renewable energy potential of
neighbourhoods in london, Renewable Energy 73 (2015) 10–17. doi:10.
1016/j.renene.2014.06.028.
[26] P. Berg, Sustainability resources in Swedish townscape neighbourhoods:
Results from the model project Hagaby and comparisons with three com-
mon residential areas, Landscape and Urban Planning 68 (2004) 29–52.
doi:10.1016/S0169-2046(03)00117-8.
[27] ArcGIS for Desktop – modeling solar radiation, http://desktop.
21

arcgis.com/en/arcmap/10.3/tools/spatial-analyst-toolbox/
modeling-solar-radiation.htm, accessed: 26-05-2016.
[28] NIWA – SolarView, https://solarview.niwa.co.nz/, accessed: 26-09-
2016.
[29] Statistics New Zealand, census-based files, esri geodatabase, 2013,
http://www.stats.govt.nz/browse_for_stats/Maps_and_geography/
Geographic-areas/digital-boundary-files.aspx, accessed: 08-07-
2016.
[30] Statistics New Zealand, 2013 Census meshblock dataset,
http://www.stats.govt.nz/Census/2013-census/data-tables/
meshblock-dataset.aspx, accessed: 08-07-2016.
22