Embed Size (px)
Citation preview
Solar Physics and Fits to Gamma-Ray Spectra
Gerry Share
University of Maryland
Fermi Solar Data Analysis Workshop GSFC, August 22, 2012

Left panel: Cartoon representing particle acceleration and transport on loops to the chromosphere and release of particles to space via a shock. Reacceleration in the chromosphere? (Brown and Turkmani, 2012). Plasma waves? (Hudson and Fletcher). Right panel: Representative solar-flare gamma-ray spectrum and components. Pion-decay not shown.
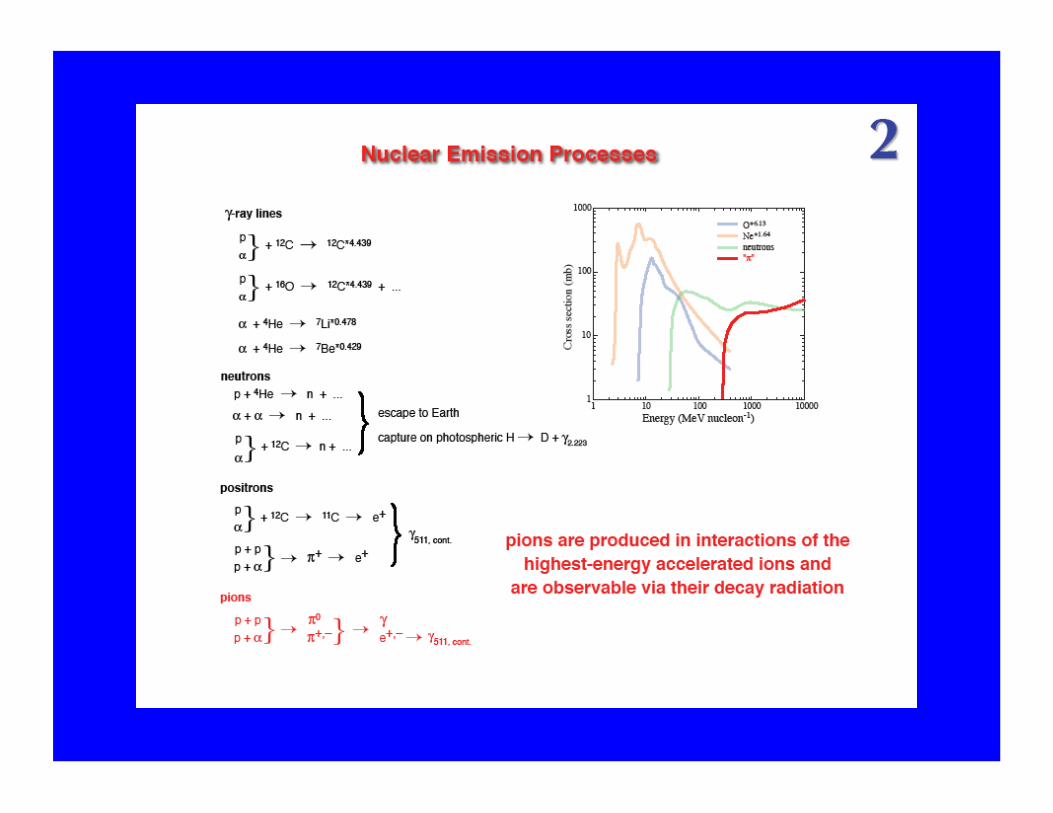
Depth distribution at the Sun for production of gamma rays in flares (Murphy et al. 2009)
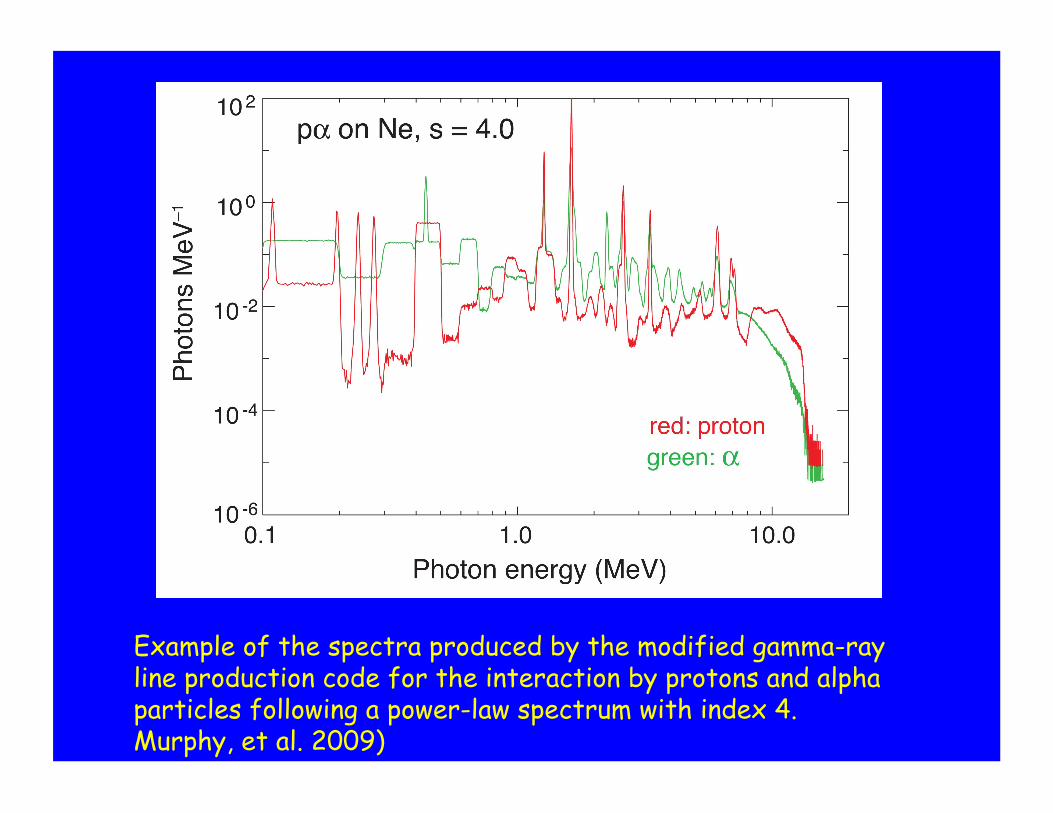
Example of the spectra produced by the modified gamma-ray line production code for the interaction by protons and alpha particles following a power-law spectrum with index 4. Murphy, et al. 2009)
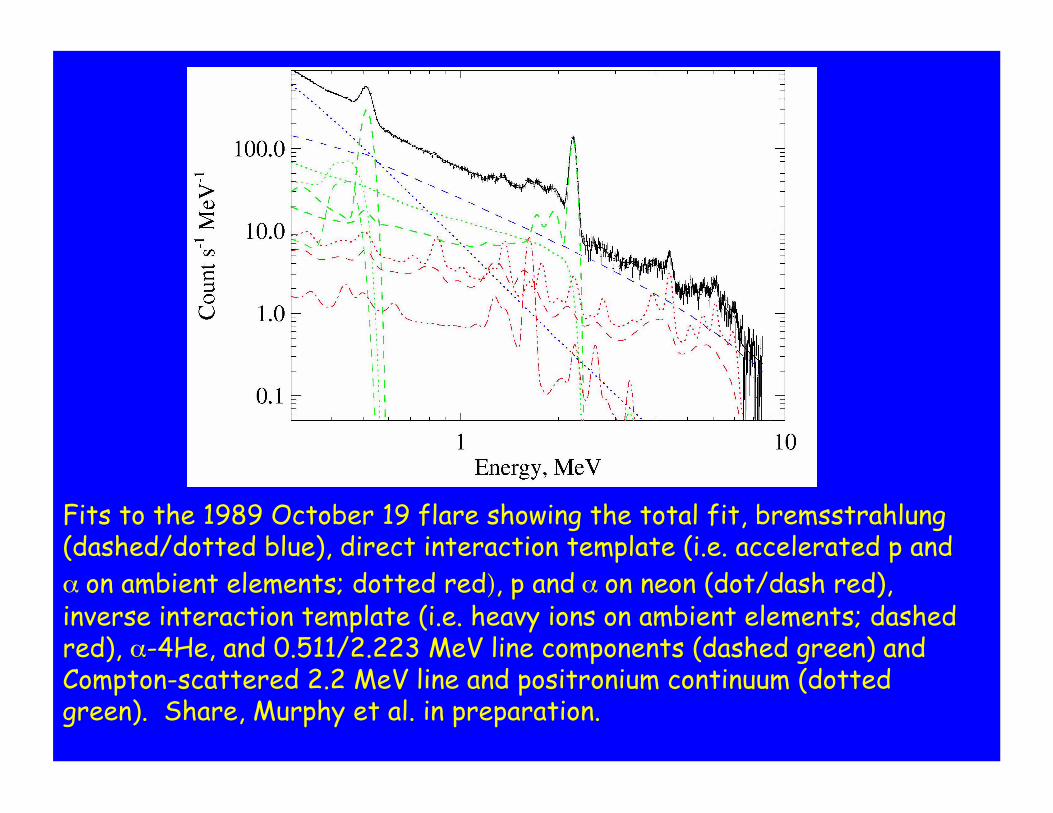
Fits to the 1989 October 19 flare showing the total fit, bremsstrahlung (dashed/dotted blue), direct interaction template (i.e. accelerated p and α on ambient elements; dotted red), p and α on neon (dot/dash red), inverse interaction template (i.e. heavy ions on ambient elements; dashed red), α-4He, and 0.511/2.223 MeV line components (dashed green) and Compton-scattered 2.2 MeV line and positronium continuum (dotted green). Share, Murphy et al. in preparation.

chi2 contour plots for spectral index and α/p ratio. From Monte Carlo studies a δ χ2 = 3.8 has a 68% probability. Uses best fit coronal ambient abundances and coronal accelerate- particle tmeplates.
Upper plot: RHESSI 03 October 28
Share, Murphy, Shih, et al. in preparation
Lower plot: SMM 89 October 19, best fit photospheric ambient-coronal accelerated templates. Red (blue) curves show the indices and α/p ratios consistent with photospheric He/O for Asplund 2004 abundances based on fits to the flux measured in the α-4He fusion lines (dotted curves show the 1 sigma statistical uncertainties).

When statistics, good spectral resolution, and good photopeak efficiency allow we can fit individual element templates. Shown are the resulting ambient element abundances from a fit to the SMM 1989 October 19 flare (Share & Murphy in preparation).

Characteristics of the Chromosphere and Accelerated-Particles Interacting at the Sun from γ-Ray Observations (Share, Murphy, et al. in preparation)
• Ne/O ratio (0.15-0.20) measured for first time in the chromosphere
• Chromospheric composition: 3 flare-observations favor a photospheric heavy-element composition while 3 favor a coronal composition (enhanced low FIP (Mg, Fe, Si) abundance. Evidence for variability.
• Composition of accelerated particles with Q > 2 has only been measured in a few SMM flares to date. All suggest that the heavy/(proton + alpha) ratio is enhanced by a factor of ~2 over a coronal composition. Only one favors presence of enhanced Fe (heavy ions) expected for an impulsive SEP composition (Reames, 1995).
• Enhanced (factor of ~2) alpha/proton ratio relative to photospheric He/H.
• Spectral indices of ~3.4 to 4.8 in the ~3-30 MeV range.
• Limited capability for these studies with the GBM and with the current state of RHESSI

High-energy (>10 MeV) gamma-rays from solar flares and time-extended emission.
Time-extended >50 MeV and 2.22 MeV emission from the 1991 June 11 flare observed by CGRO EGRET and COMPTEL (Kanbach et al. 1993, Rank, Ryan, et al. 2001)
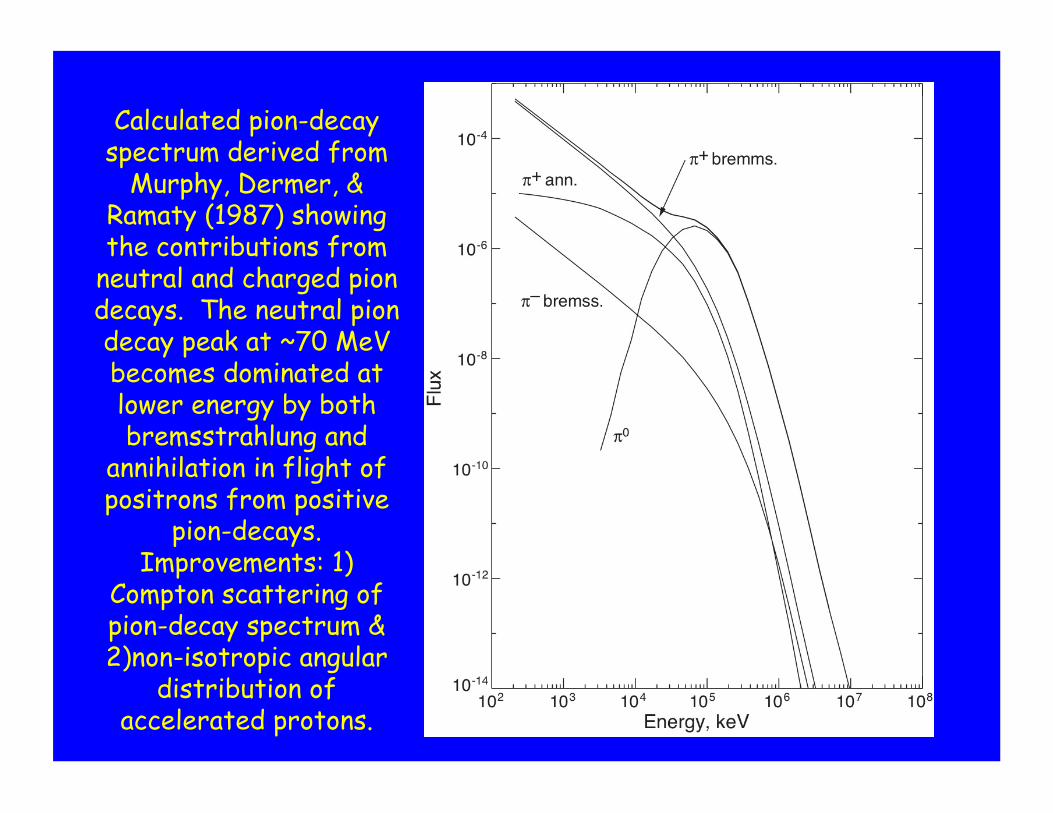
Calculated pion-decay spectrum derived from
Murphy, Dermer, & Ramaty (1987) showing the contributions from
neutral and charged pion decays. The neutral pion decay peak at ~70 MeV becomes dominated at lower energy by both bremsstrahlung and
annihilation in flight of positrons from positive
pion-decays. Improvements: 1)
Compton scattering of pion-decay spectrum & 2)non-isotropic angular
distribution of accelerated protons. 11
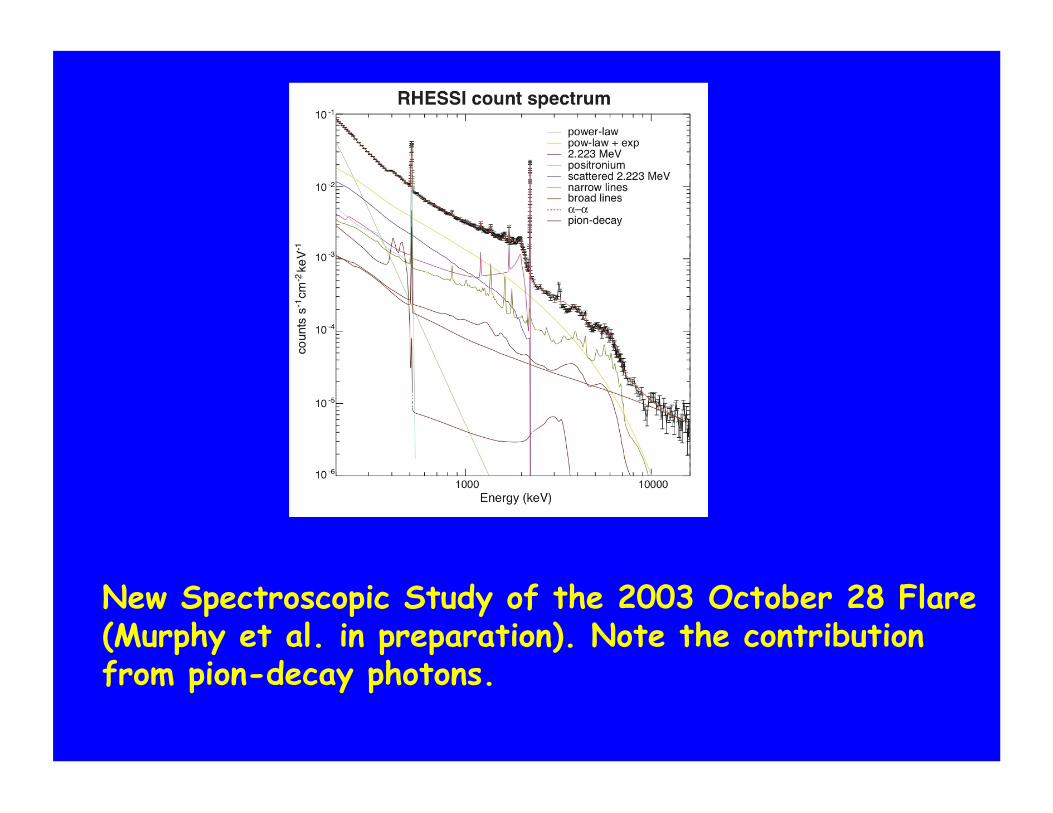
New Spectroscopic Study of the 2003 October 28 Flare (Murphy et al. in preparation). Note the contribution from pion-decay photons.
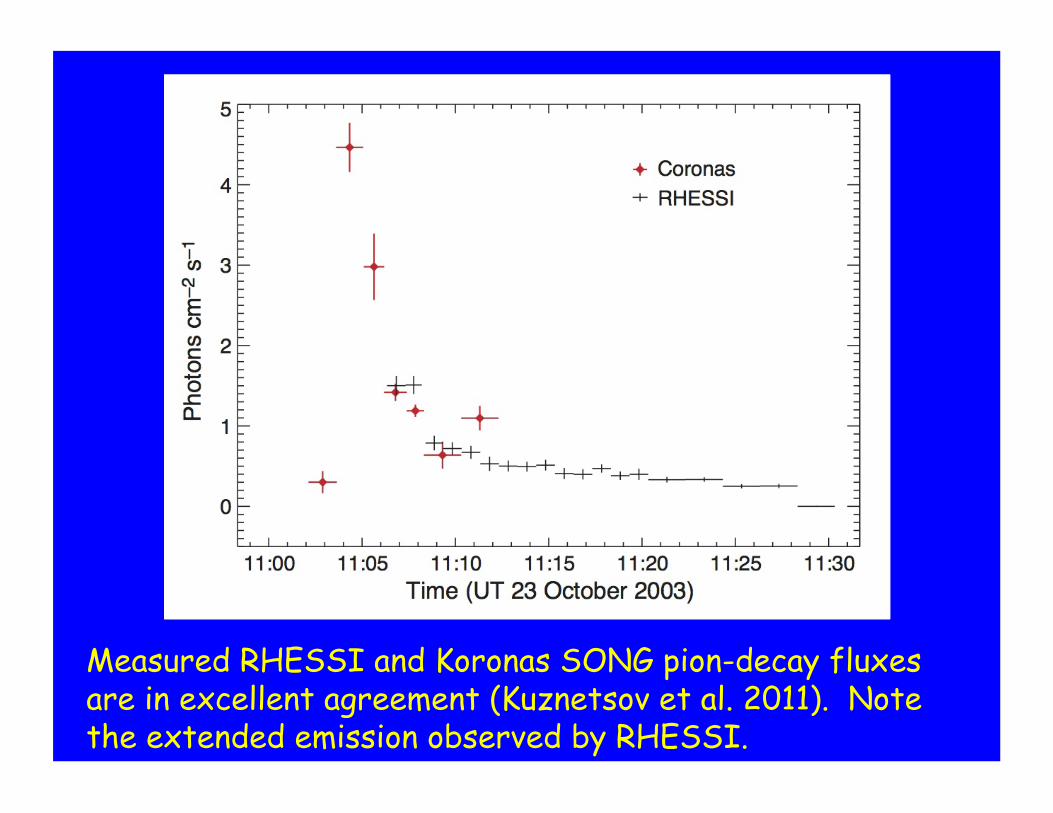
Measured RHESSI and Koronas SONG pion-decay fluxes are in excellent agreement (Kuznetsov et al. 2011). Note the extended emission observed by RHESSI.
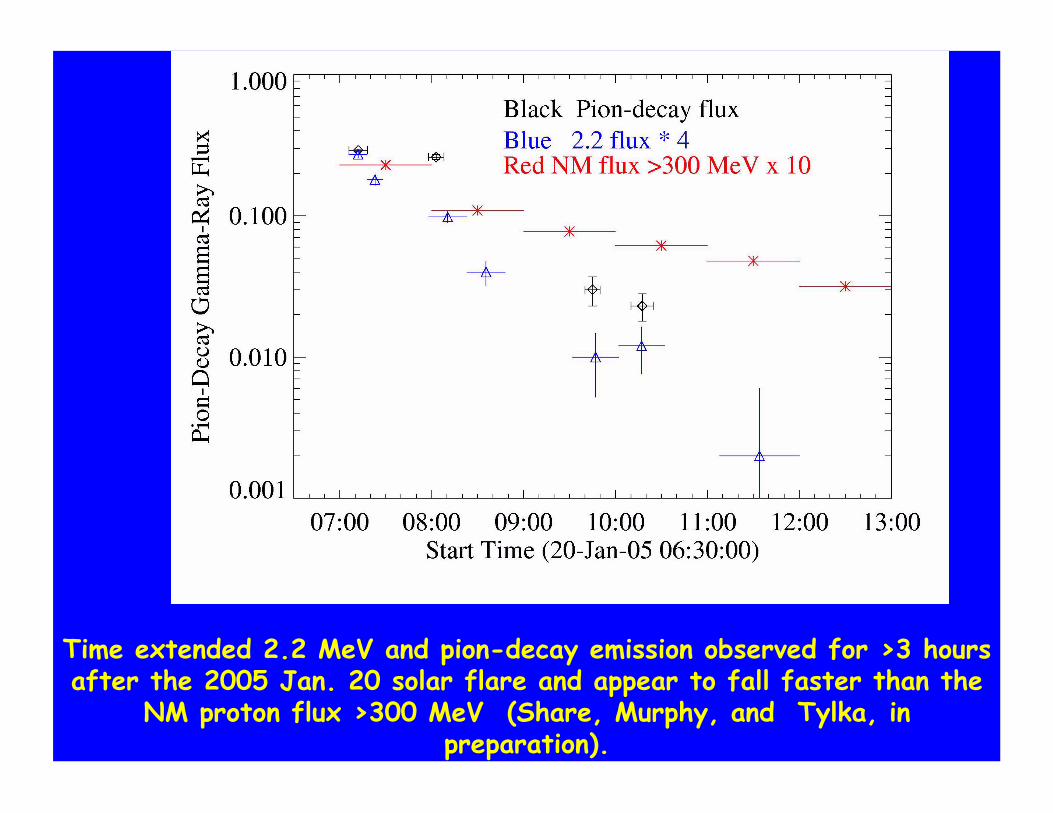
Time extended 2.2 MeV and pion-decay emission observed for >3 hours after the 2005 Jan. 20 solar flare and appear to fall faster than the
NM proton flux >300 MeV (Share, Murphy, and Tylka, in preparation).
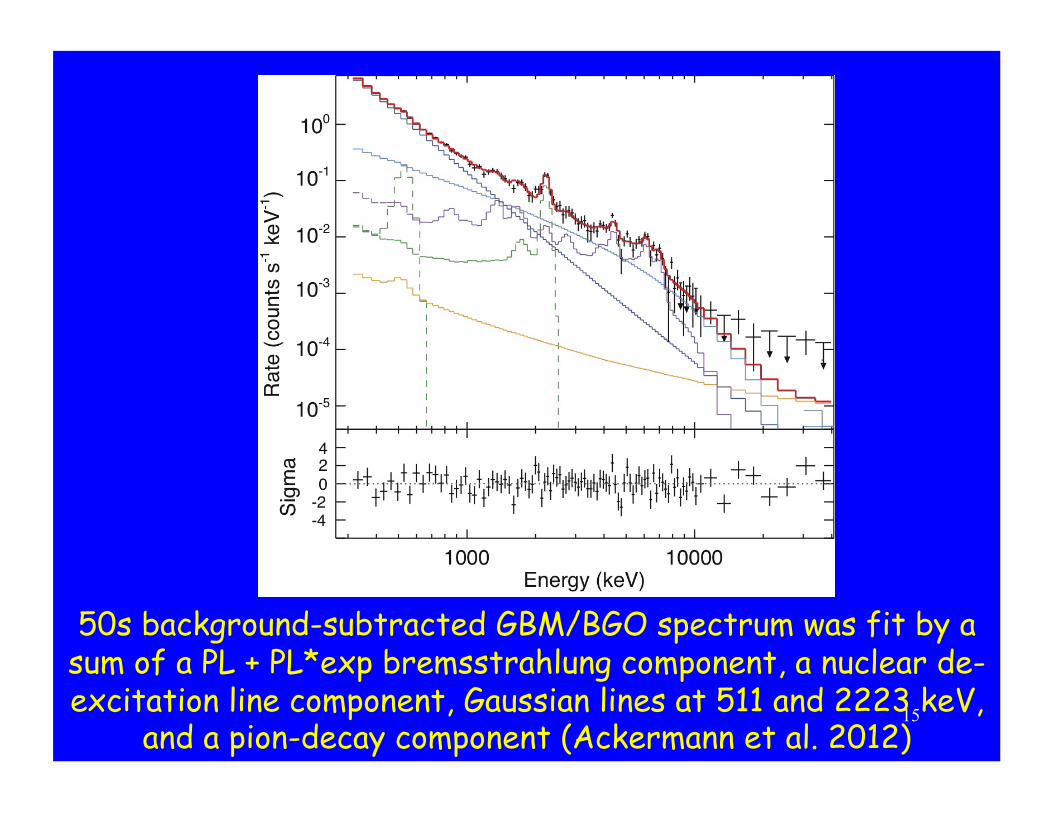
50s background-subtracted GBM/BGO spectrum was fit by a sum of a PL + PL*exp bremsstrahlung component, a nuclear de-excitation line component, Gaussian lines at 511 and 2223 keV,
and a pion-decay component (Ackermann et al. 2012) 15
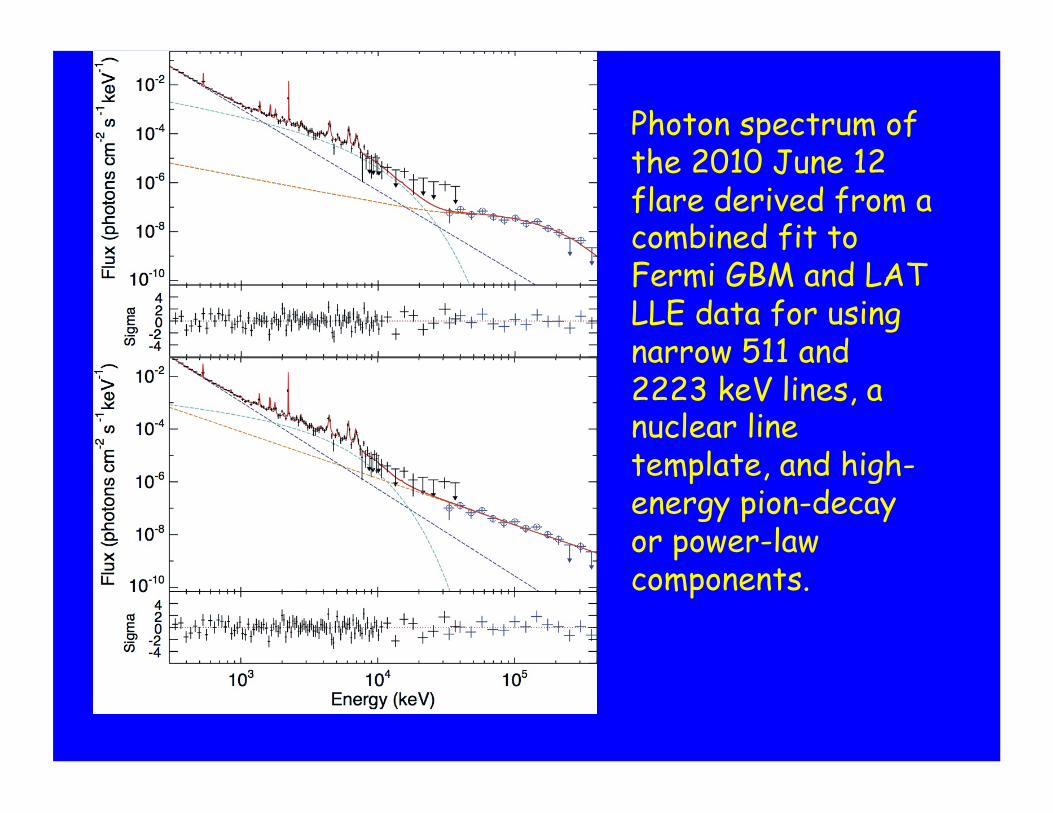
Photon spectrum of the 2010 June 12 flare derived from a combined fit to Fermi GBM and LAT LLE data for using narrow 511 and 2223 keV lines, a nuclear line template, and high-energy pion-decay or power-law components.

7 hours preceding and 22 hours following the 2010 June 12 flare. Dashed line is the 6/11/91 time history of the 2.223 MeV neutron-capture line
observed by CGRO COMPTEL and diamonds are EGRET >50 MeV data both normalized to the peak >100 MeV flux measured by the LAT for the June
12 flare. There is no evidence for time-extended emission. 17
Preliminary

Related solar science:
Correlation of >300 keV bremsstrahlung and neutron-capture line fluences.
Imaging of gamma-ray line flares using the neutron capture line.
Compton scattering of the neutron capture line
Width of the annihilation line.
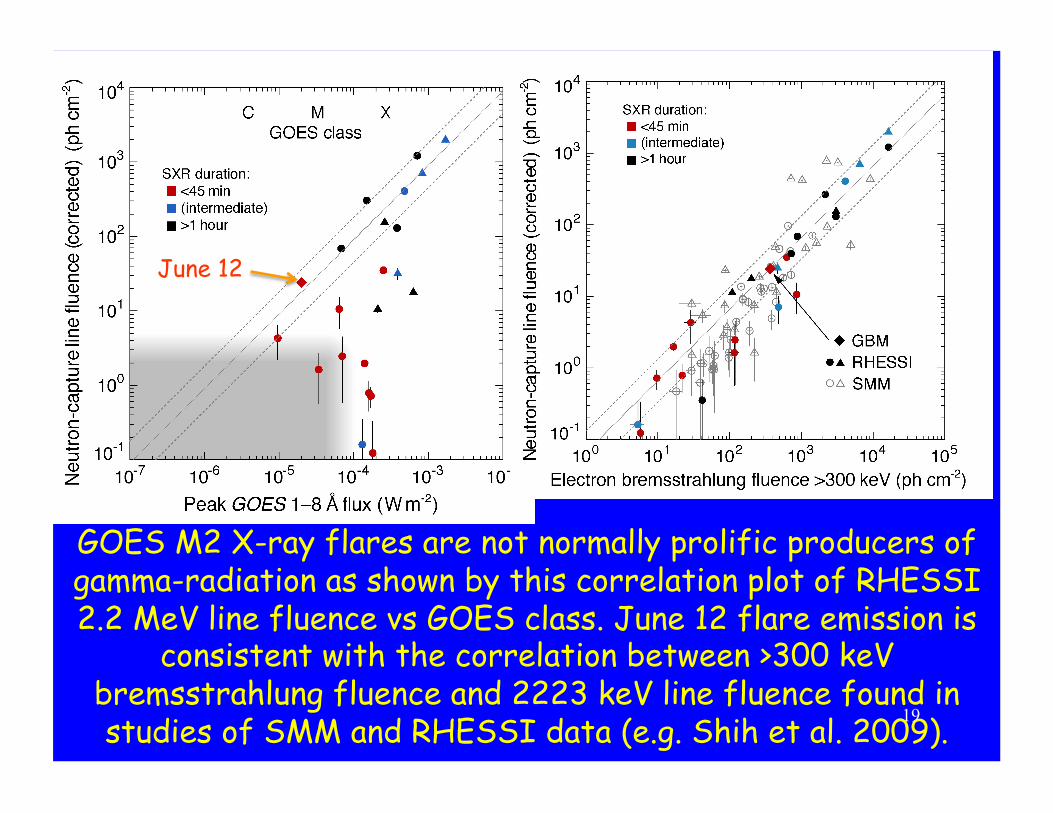
GOES M2 X-ray flares are not normally prolific producers of gamma-radiation as shown by this correlation plot of RHESSI 2.2 MeV line fluence vs GOES class. June 12 flare emission is
consistent with the correlation between >300 keV bremsstrahlung fluence and 2223 keV line fluence found in studies of SMM and RHESSI data (e.g. Shih et al. 2009).
June 12
19
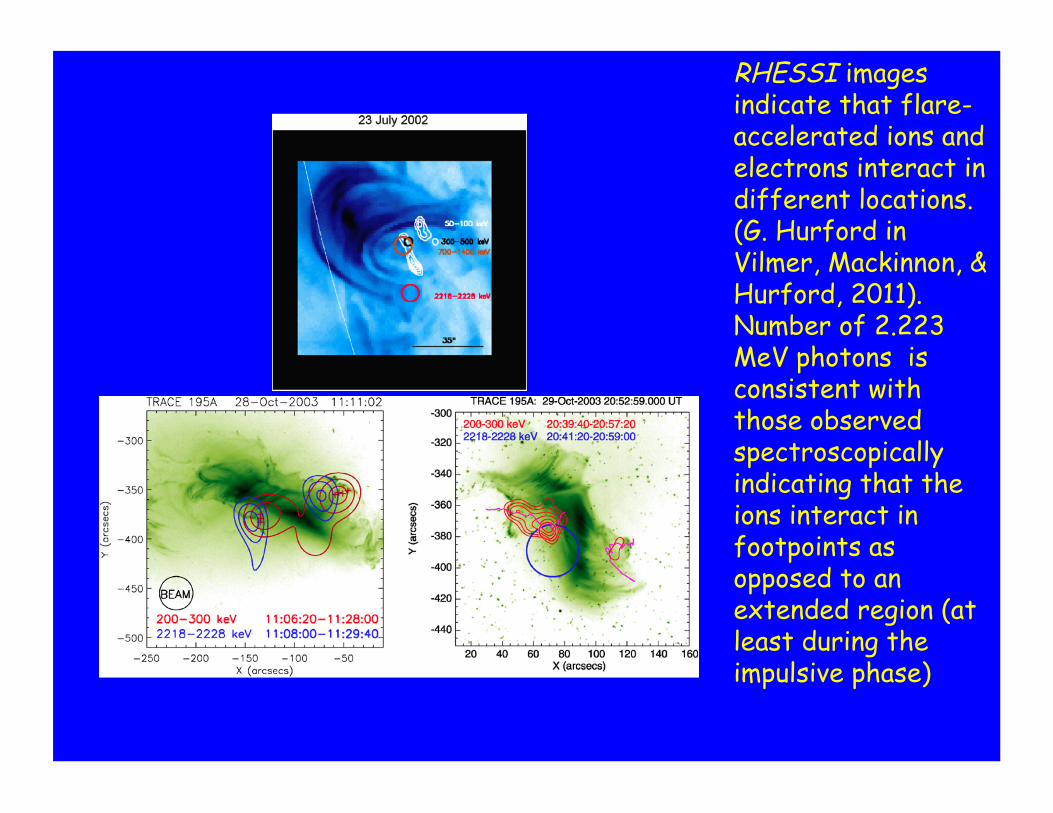
RHESSI images indicate that flare-accelerated ions and electrons interact in different locations. (G. Hurford in Vilmer, Mackinnon, & Hurford, 2011). Number of 2.223 MeV photons is consistent with those observed spectroscopically indicating that the ions interact in footpoints as opposed to an extended region (at least during the impulsive phase)

Compton Scattering of the Solar 2.223 MeV Line
Below we compare the ratio of the measured solar 2.223 Compton scattered continuum >200 keV to the 2.223 MeV line flux in some SMM and RHESSI flares
Flare Ratio (statistical error) 1989 Oct. 19 (30o) 0.7 +- 0.1 1982 June 3 (70o) 0.7 +- 0.2 2003 Oct. 28 (30o) 1.8 +- 0.2 2002 July 23 (70o) 1.9 +- 0.9 2005 Jan. 20 (60o) 1.2 +- 0.2
Calculations suggest that the ratio should be <~1.0 (Murphy, Share, et al, in preparation.; see also Vestrand 1990.)
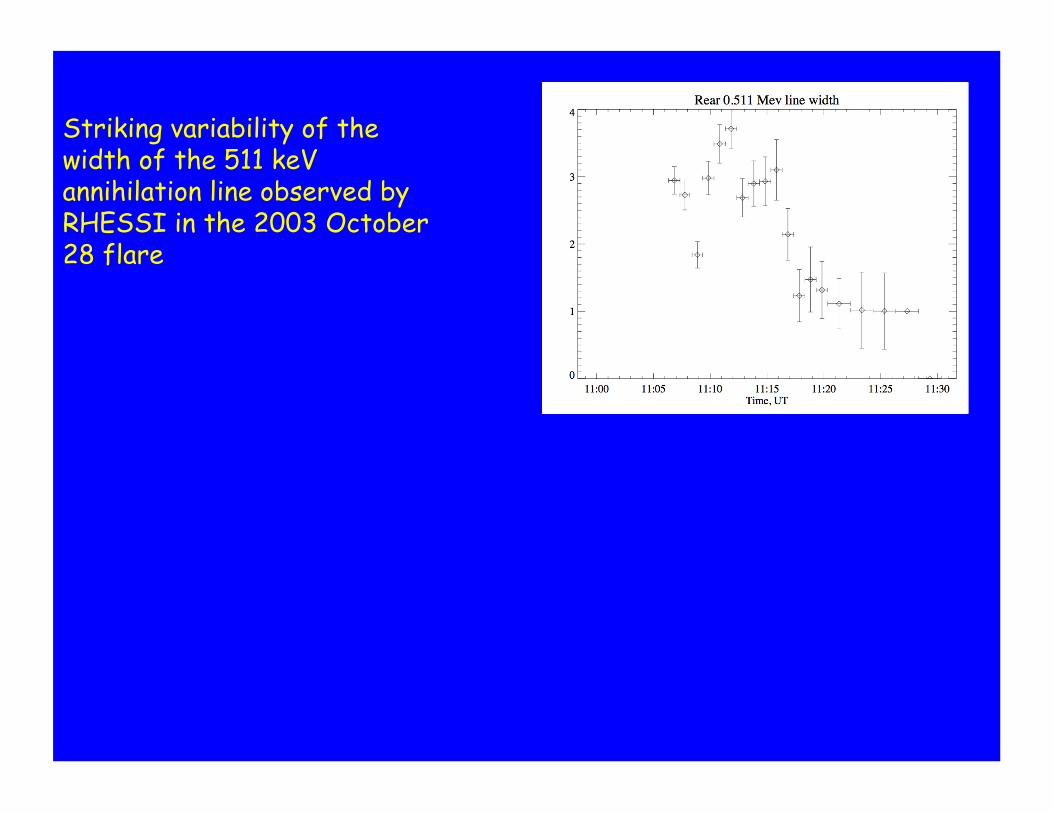
Striking variability of the width of the 511 keV annihilation line observed by RHESSI in the 2003 October 28 flare


![Solar cell actual - ntmdt-si.com · NTEGRA Spectra: Solar Cell Diagnostics distributions of the external voltage applied to contacts of the structure [ , ] and surface photovoltage](https://img.pdfslide.us/doc/110x75/5e801d3369b7520c451652f4/solar-cell-actual-ntmdt-sicom-ntegra-spectra-solar-cell-diagnostics-distributions.jpg)