Embed Size (px)
Citation preview

U.S. Department of the Interior Bureau of Reclamation September 2014
Solar Photovoltaic Desalination Using Distillation Research and Development Office Science and Technology Program Final Report 2014, Project ID 4850
Mitchell Haws – Principle Investigator

Mission Statements The mission of the Department of the Interior is to protect and provide access to our Nation’s natural and cultural heritage and honor our trust responsibilities to Indian Tribes and our commitments to island communities. The mission of the Bureau of Reclamation is to manage, develop, and protect water and related resources in an environmentally and economically sound manner in the interest of the American public.

REPORT DOCUMENTATION PAGE Form Approved OMB No. 0704-0188
T1. REPORT DATE MONTH YEAR T2. REPORT TYPE Research T3. DATES COVERED 2011 to 2014
T4. TITLE AND SUBTITLE Solar Photovoltaic Desalination Using Distillation
5a. CONTRACT NUMBER RY1541AW20.11204850
5b. GRANT NUMBER
5c. PROGRAM ELEMENT NUMBER 1541 (S&T)
6. AUTHOR(S) Mitchell Haws
5e. TASK NUMBER
5f. WORK UNIT PXAO-7000
7. PERFORMING ORGANIZATION NAME(S) AND ADDRESS(ES) Mitchell Haws Bureau of Reclamation 6150 W. Thunderbird Rd Glendale, Arizona 85308
8. PERFORMING ORGANIZATION REPORT NUMBER
9. SPONSORING / MONITORING AGENCY NAME(S) AND ADDRESS(ES) Research and Development Office U.S. Department of the Interior, Bureau of Reclamation, PO Box 25007, Denver CO 80225-0007
10. SPONSOR/MONITOR’S ACRONYM(S) R&D: Research and Development Office BOR/USBR: Bureau of Reclamation DOI: Department of the Interior 11. SPONSOR/MONITOR’S REPORT NUMBER(S)
ID4850 12. DISTRIBUTION / AVAILABILITY STATEMENT
Final report can be downloaded from Reclamation’s website: https://www.usbr.gov/research/ 13. SUPPLEMENTARY NOTES
14. ABSTRACT (Maximum 200 words) In an effort to further the research in Solar Desalination a test facility was developed at well site 5T-529 near Leupp Arizona. A solar power plant was developed which produced 5.4 kW of electricity and 8 Therms of heat (800,000 btu). A weather station to gather meteorological data was install at the site. A dedicated solar pumping system was developed to insure adequate water supplies for the test facility and local livestock populations. The power plants and pumping systems were commissioned and are working continuously. A membrane distillation advanced water treatment system was developed and installed at the site. This system is anticipated to be commissioned in the 2015 funding cycle.
15. SUBJECT TERMS Solar, Photovoltaic, Desalination, Distillation, Membrane, Native American, Advanced Water Treatment 16. SECURITY CLASSIFICATION OF:
unclassified 17. LIMITATION OF ABSTRACT
U
18. NUMBER OF PAGES
86
19a. NAME OF RESPONSIBLE PERSON Mitchell Haws
a. REPORT U
b. ABSTRACT U
c. THIS PAGE U
19b. TELEPHONE NUMBER 623-773-6274
S Standard Form 298 (Rev. 8/98) P Prescribed by ANSI Std. 239-18
PEER REVIEW DOCUMENTATION
Project and Documentation Information
Project Name: Solar Photovoltaic Desalination Using Distillation WOID: DC8EB_________________________________________ Document: ___Solar Photovoltaic Desalination Using Distillation Final Report___ Document Author(s): Mitchell Haws_Document Date: __9-30-2014___ Peer Reviewer: ____Ardeth Barnhart________________________
Review Certification
Peer Reviewer: I have reviewed the assigned items/sections noted for the above document and believe them to be in accordance with the project requirements, standards of profession, and Reclamation policy.
Reviewer ___Date Reviewed_09/30/2014
(Signature)

BUREAU OF RECLAMATION Phoenix Area Office Program Development, PXAO-7000 Final Report
Solar Photovoltaic Desalination Using Distillation Mitchell Haws Prepared: Mitchell Haws Principle Investigator – Program Development Division Phoenix Area Office, Glendale Arizona 623-773-6274

Solar Desalination Using Distillation
iii
Contents
Page
Executive Summary .................................................................................................... 1 Regional Assessment ................................................................................................. 3
Well Site Assessment Report .................................................................................... 5 Well Analysis .................................................................................................................. 10 Solar Pump Installation ................................................................................................ 11
Site Development ...................................................................................................... 13 Site Development Design ......................................................................................... 13 Site Development Requisition............................................................................... 14 Site Development Contract ..................................................................................... 14 CPVTHS Design .............................................................................................................. 15 CPVTHS Requisition.................................................................................................... 15 CPVTHS Contract .......................................................................................................... 15 System Operational Equipment ................................................................................ 17 Weather Station .............................................................................................................. 27
Membrane Distillation ............................................................................................ 30 Membrane Distillation (MD) Conceptual Design for Site Development .................................................................................................................. 30 Mass Balance Model .................................................................................................... 30 Membrane Distillation Conceptual Design for this Application ......... 30 Membrane Distillation Procurement ................................................................ 30 Membrane Distillation .............................................................................................. 31
Cost Benefit Analysis and Technology Transfer ............................................. 33 Cost Share .................................................................................................................... 34 Conclusions ................................................................................................................. 34 Attachements .............................................................................................................. 36
Attachment A – Navajo Nation Solar Desalination Research Pilot Demonstration Project ................................................................................................. 37 Attachment B – Site Assessment Report................................................................ 76

Solar Desalination Using Distillation
iv
Table of Figures Figure 1 - University of Arizona students gathering data ......................................... 4 Figure 2 - Water Samples taken from 5 wells and characterized at the University of Arizona............................................................................................................... 4 Figure 3 - Well site identified in the Southwestern Navajo Nation ....................... 5 Figure 4 - Down-hole camera taking video at Well Site 5T-529 ............................. 6 Figure 5 - Obtaining water samples from Well 5T-529 ............................................. 7 Figure 6 - Flow meter monitoring potential water volumes ................................... 9 Figure 7 - Water chemistry at Well 5T-529 ................................................................. 10 Figure 8 - Solar well pump controllers .......................................................................... 11 Figure 9 - Solar well pump ................................................................................................. 11 Figure 10 - Dedicated solar panels for pumping ....................................................... 12 Figure 11 - Site development plant................................................................................. 13 Figure 12 - Test facility being development ................................................................ 14 Figure 13 - Constructing the CPVTHS ............................................................................ 15 Figure 14 - Finished CPVTHS ............................................................................................ 16 Figure 15 - Master power controls ................................................................................. 17 Figure 16 - Sunny Island ..................................................................................................... 18 Figure 17 - Smart Former ................................................................................................... 19 Figure 18 - Sunny Boy inverters ...................................................................................... 20 Figure 19 - Communication cabinet ............................................................................... 21 Figure 20 - Output from CoGenra website about the Leupp project ................. 22 Figure 21 - Batteries "State of Charge" from the SMA Sunny Portal .................. 22 Figure 22 - Battery shut-off ............................................................................................... 23 Figure 23 - Site Equipment Control Cabinet ............................................................... 24 Figure 24 - Programmable Logic Controller Data Remote Readout .................. 25 Figure 25 - iBOS ...................................................................................................................... 26 Figure 26 - Battery Storage ................................................................................................ 27 Figure 27 - Weather station console .............................................................................. 28 Figure 28 - Weather station equipment ........................................................................ 28 Figure 29 - Mass balance model ....................................................................................... 30 Figure 30 - Treatment train fabricated at the University of Arizona ................ 31 Figure 31 - Treatment train fabricated at the Leupp test facility with UA development team ................................................................................................................. 32 Figure 32 - Desalination equipment protective shelter .......................................... 32

ID 4850 - Solar Photovoltaic Desalination
1
2014 Final Report
Executive Summary The work elements completed thus far for this project under Science and Technology, ID 4850 “Solar Photovoltaic Desalination Using Distillation,” including cost share partners are as follows:
• Regional Assessment • Navajo Well 5T-529 Site Assessment Report • Site Development
o Design o Contract Requisition o Contract Development o Solicitation o Contract Award o Contract Completion
• Concentrated Photovoltaic – Thermal Hybrid System (CPVTHS) o CPVTHS Design o CPVTHS Requisition o Contract Solicitation o CPVTHS Contract Award o Contract Completion
• Membrane Distillation System o Mass Balance Model o System parameters o Conceptual Design o Cooperative Agreement Requisition o Cooperative Agreement Award Under CESU (September 2013) o Design of Desalination Equipment o Shop Fabrication and Testing of Desalination Equipment o Installation of Desalination Equipment at Well Site 5T-592 o Testing and Commissioning
• Cost Share Partners o Denver Research Office under Science and Technologies o The University of Arizona o The Grand Canyon Trust o The Navajo Nation o Reclamation Native American Affairs Office o The Provo Area Office

ID 4850 - Solar Photovoltaic Desalination
2
The overall project under this phase of the work will be complete on September 30, 2014. It is anticipated that additional study work will be undertake in FY 2015 under Science and Technologies, Proposal No. 6808. The details of that proposal are available from the Science and Technologies website. A summary of the activities described above are as follows: A test facility was constructed at well site 5T-529 near Leupp, Arizona. The test facility includes site equipment, a secured fenced-in area with concrete a pad, secure storage building and control house, anchorage for solar power plant and all necessary piping from the existing water storage tank to the test site discharge pond. A CoGenra SunPack 12 power plant was installed which produces photovoltaic power and usable BTU’s. A structure was constructed on the concrete pad to protect the advance water treatment system. Finally the advanced water treatment system or membrane distillation system was constructed inside the protective structure. A weather station was installed for monitoring meteorological condition including insulation. The data is periodically downloaded for dissemination. The system is capable of being connected to the Nation Weather Service but is not currently because of the data transfer protocol is being developed. A dedicated solar pumping system was designed and constructed as a stand-alone system to insure the 24,000 gallon water storage tank will remain full. This dedicated system also enables that releases can be made to the 24,000 gallon tank connect by a 7-mile long pipeline down gradient from this site. Three separate remote monitoring systems have been connected to the site providing critical data to insure this system is functioning. These systems are: a CoGenra interface, a SMA Sunny Portal, and a Programmable Logic Controller (PLC) all with password protected secure internet connections. All of the equipment at the site have been commissioned and are operating. The solar pumping system and the CoGenra power plant are operating continuously. The advance water treatment system or membrane distillation system is only operating when the University of Arizona student and faculty are present. The first distilled water from the system was produced on July 10, 2014. It is anticipated that during the next funding cycle the advance water treatment system will be configured to operate continuously. This entire system is anticipated to be an off-grid advanced water treatment system capable of providing better quality water for livestock with prospect of upgrading the system to a potable water treatment system for the local population.

ID 4850 - Solar Photovoltaic Desalination
3
Regional Assessment The University of Arizona (UA) contracted with the Phoenix Area Office to cost-share the assessment of renewable energy powered advanced water treatment technologies. Researchers developed parameters to assess the water resource problems, opportunities and constraints. An array of options emerged utilizing solar energy systems and membrane water treatment technologies. The UA graduate and Phd candidate students developed a “bench scale” solar powered multi-effect distillation system, utilizing local brackish water, in the laboratory of the Department of Chemical and Environmental Engineering. Scale factors impeded success to meet water quality thresholds within the range of operation, maintenance and replacement costs defined as suitable for a sample of remote and rural water users on the Navajo Nation in northeastern Arizona. The research team subsequently developed a membrane distillation system at a pilot scale that met parameters that could be developed within the laboratory and local field site setting. The team prepared to deploy a system within the Navajo Nation to evaluate scale, regulatory, economic and social/cultural sustainability factors. UA, Bureau of Reclamation and Navajo Department of Water Resources team members identified wells known to have water quality problems within the region as potential candidates for the solar membrane distillation application. Five wells representing known water quality problems for both livestock and public water systems were chosen for sampling as follows:
• 17T-583 Public Water System well known to have elevated levels of iron and manganese.
• 07T- 554 Livestock well known to have elevated levels of uranium and nitrates.
• 07T-522 Public Water System well known to have elevated levels of arsenic.
• 05T-537 Livestock well known to have elevated levels of total dissolved solids.
• 05T-529 Livestock well known to have elevated levels of total dissolved solids.

ID 4850 - Solar Photovoltaic Desalination
4
Figure 1 - University of Arizona students gathering data
Figure 2 - Water Samples taken from 5 wells and characterized at the University of Arizona

ID 4850 - Solar Photovoltaic Desalination
5
Water samples were taken from the 5 wells and chemically characterized in the UA laboratory in Tucson, Arizona. The water quality analysis confirmed elevated levels of chemical constituents that summary of the water quality analysis confirmed the
Figure 3 - Well site identified in the Southwestern Navajo Nation
Well Site Assessment Report
Stockwell 05T-529 - Summary of Downhole Video Survey and Pumping August 15-18, 2011 Video Logging A video survey was conducted for well 05T-529 on August 15, 2011. The video camera lens (depth) was zeroed out at ground level, a centralizer installed and the survey was recorded to high definition DVD. The steel well casing is 6-5/8-inch diameter. The sucker rod had been removed the previous week and the well brushed and cleaned by the Navajo Nation Leupp pump crew on August 11-12. This only left the weekend for the water column to clear up.
Solar Desalination Pilot Project

ID 4850 - Solar Photovoltaic Desalination
6
Figure 4 - Down-hole camera taking video at Well Site 5T-529 The steel casing appeared to be in good condition and clean for most of its length, especially the first 300 feet, which is documented in Title 1 (19:49 minutes duration). Some minor pitting was observed below about 100 feet. Welded casing joints were encountered about every 20-21 feet. The recording continued as Title 2 (42:53) from 300 to 483 feet where the camera apparently bottomed out on sediment (the well is reported to be 500-foot deep from the Navajo Well database). Welded joints continued at about 312 feet and at 333 feet were some patchy rust spots. The camera encountered the static water level at 326.5 feet and once below water, visibility via the down view lens was poor to non-existent. The remaining survey used the side view lens to observe the casing wall, joints and slotted features. At approximately 358 feet, began picking up noticeable encrustation (coating or plating) of calcium carbonate deposits. The first feature, which initially was thought to be the top of a wire wrapped well screen, was subsequently interpreted to be exposed casing threads, as any well screen would be expected to continue for many feet (there are no known well screen or slotting records for this well). Several more intervals were seen of these casing threads, at 393.5, 415.1, 457.1, and 478.4 feet. Each interval was estimated to be about 0.1-0.2 feet thick. Often seen were “windows” through the coatings to clean casing steel and brush or scratch marks through the coatings, presumably from the Navajo crew’s brushing efforts and/or from when the submersible pump/flex hose dropped to the well bottom in the November 2010 work. The first possible perforation feature (vertical torch cut slot) seen was at about 397.9 feet and the bottom of the slot at about 399.5 feet. It is interpreted the casing had been torch cut slotted in the lower 100 feet (about
ID 4850 - Solar Photovoltaic Desalination
7
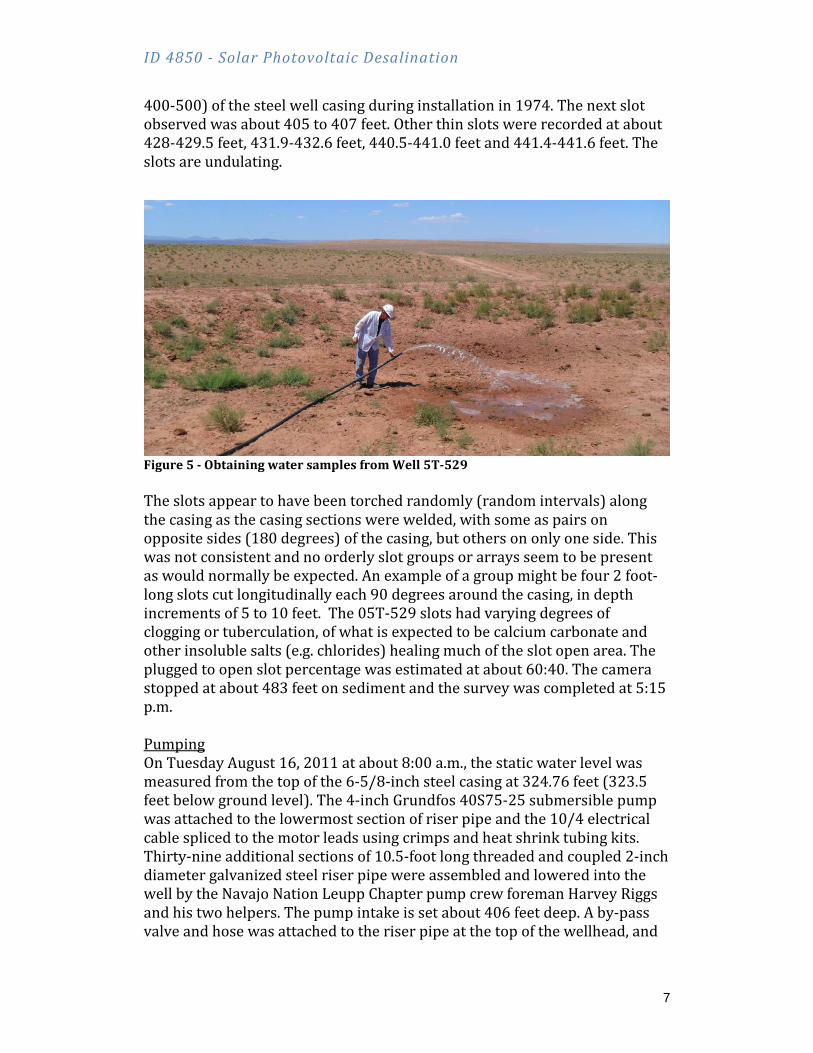
400-500) of the steel well casing during installation in 1974. The next slot observed was about 405 to 407 feet. Other thin slots were recorded at about 428-429.5 feet, 431.9-432.6 feet, 440.5-441.0 feet and 441.4-441.6 feet. The slots are undulating.
Figure 5 - Obtaining water samples from Well 5T-529 The slots appear to have been torched randomly (random intervals) along the casing as the casing sections were welded, with some as pairs on opposite sides (180 degrees) of the casing, but others on only one side. This was not consistent and no orderly slot groups or arrays seem to be present as would normally be expected. An example of a group might be four 2 foot-long slots cut longitudinally each 90 degrees around the casing, in depth increments of 5 to 10 feet. The 05T-529 slots had varying degrees of clogging or tuberculation, of what is expected to be calcium carbonate and other insoluble salts (e.g. chlorides) healing much of the slot open area. The plugged to open slot percentage was estimated at about 60:40. The camera stopped at about 483 feet on sediment and the survey was completed at 5:15 p.m. Pumping On Tuesday August 16, 2011 at about 8:00 a.m., the static water level was measured from the top of the 6-5/8-inch steel casing at 324.76 feet (323.5 feet below ground level). The 4-inch Grundfos 40S75-25 submersible pump was attached to the lowermost section of riser pipe and the 10/4 electrical cable spliced to the motor leads using crimps and heat shrink tubing kits. Thirty-nine additional sections of 10.5-foot long threaded and coupled 2-inch diameter galvanized steel riser pipe were assembled and lowered into the well by the Navajo Nation Leupp Chapter pump crew foreman Harvey Riggs and his two helpers. The pump intake is set about 406 feet deep. A by-pass valve and hose was attached to the riser pipe at the top of the wellhead, and

ID 4850 - Solar Photovoltaic Desalination
8
at 12:33 p.m. the pump was activated using a rented 34 Kw three-phase Multiquip generator through the three-phase electrical control panel. The discharge water cleared rapidly which was directed into the charco. Two bucket tests determined the discharge as 5.71 and 5.83 seconds per 5 gallons or about 53 gpm. At 1:15 p.m. a water level sounder measurement showed the pumping level at about 370 feet below top of casing, or about 45 feet of drawdown. By 1:30 p.m. the discharge had dropped off to about one-half the initial rate, likely more representative of aquifer storage rather than casing storage. At this time a 2-inch Neptune totalizing meter was attached to the discharge line to begin filling the 24,000 gallon storage tank. The starting meter reading was 8363700 gallons. By 1:55 p.m. the pump rate was 27-28 gpm according to the meter. A bucket test at 3:24 p.m. was 9.61 sec/5 gal or 31.2 gpm. Temperature of bypass discharge was 66 degrees. Pumping continued until 5:30 p.m. and the generator was hauled back to the Leupp Chapter yard for security. On August 17, 2011 the static water level was measured at 324.77 feet below top of casing (323.5 feet bgl), showing that the aquifer had recovered fully. Pumping began again at 10:33 a.m. after the UA staff repaired one of the water level sounders. A bucket test showed 5.63 sec/5 gal or 53.3 gpm, very similar to the initial discharge rate the previous day. At this time the UA collected water samples from the by-pass discharge hose. At 11:30 a.m. the pumping depth to water was 373.25 feet (48.48 feet of drawdown) at 27-28 gpm, for a specific capacity of 0.58, a fairly low production rate, but representative of many tests in the C-Aquifer. The pump rate remained consistent at 27-28 gpm throughout the day, and at 4:10 p.m. the drawdown had increased to 52.06 feet. The pumping water level at this time was 377.71 feet from TOC or 376.83 feet bgl. Pumping stopped at 5:00 p.m. The storage tank had filled halfway to about the 10,000-11,000 gallon level. The generator was then taken to the Leupp yard for storage. Pumping continued the next day to continue filling the storage tank. The static water level was measured first thing on August 18, 2011 at 324.94 feet below top of casing (323.7 feet bgl). The well had likely recovered back to static level and the 0.2-foot difference from the previous day is attributed to difficulties in obtaining repeatable water level indicator readings due to variable probe sensitivities. The probe tends to pick up moisture and cascading or dribbling flows from higher levels which are sometimes difficult to separate from the actual water table in the well. The water meter continued to show 28 gpm discharge rate, and the final pumping water level reading was 379.27 feet below top of casing or 378 feet below ground level at 9:10 a.m. The ending meter reading was 8380200 gallons. At least 16,500 gallons was pumped from the C-Aquifer through the meter. An additional approximately 1800 gallons was pumped to the charco

ID 4850 - Solar Photovoltaic Desalination
9
and cattle troughs prior to incorporating the meter, for a total volume of about 18,000 gallons. The pump and riser pipe including submersible pump cable was left in the well for future stock-tank filling by the Navajo Nation DWR. The three-phase electrical control panel was disconnected from the pump cable and generator, placed in its box and wrapped with a plastic garbage bag. It was placed into the 4-foot CMP culvert to try and keep it out of sight for upcoming installation by the NNDWR Leupp pump crew. This is government equipment.
Figure 6 - Flow meter monitoring potential water volumes

ID 4850 - Solar Photovoltaic Desalination
10
Well Analysis
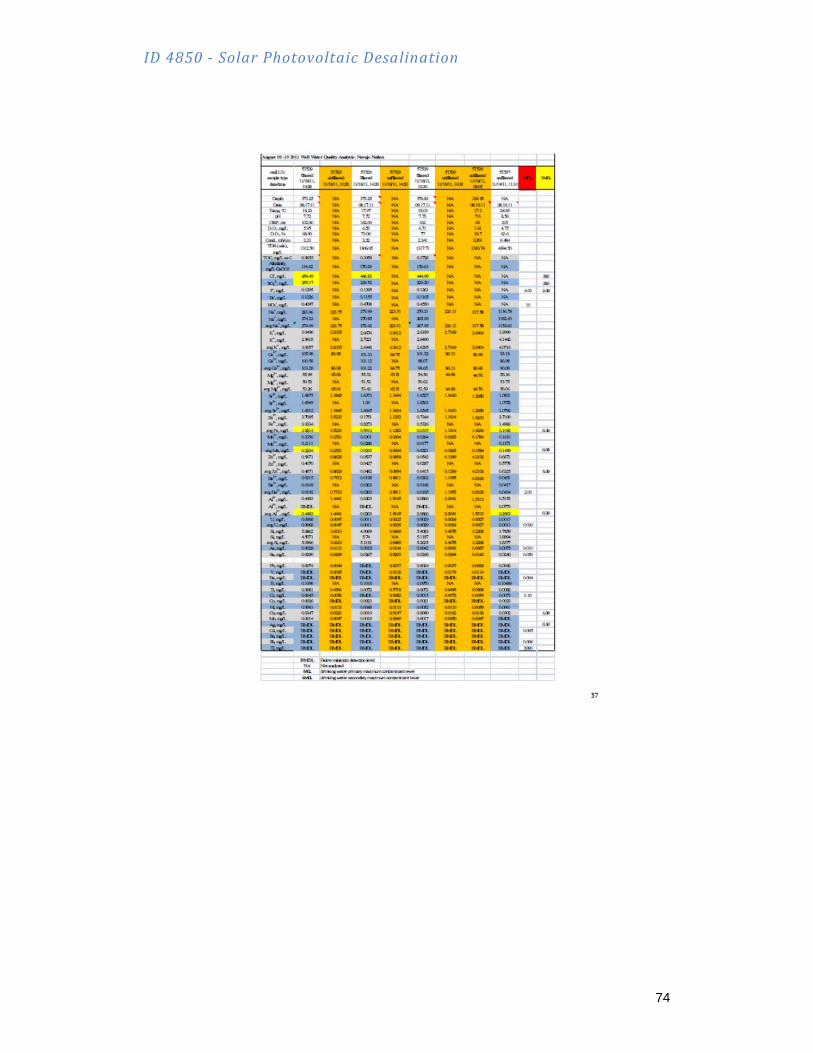
BMDL Below minimum detection limitAugust 18 -19 2011 Well Water Quality Analysis: Navajo Nation NA Not available
5T529(pumped)
10:28
5T529(pumped)
digested 10:28
5T529(pumped)
14:20
5T529(pumped)
digested 14:20
5T529(pumped)
16:30
5T529(pumped)
digested 16:30
5T529(pumped)
digested 8:05
5T537(windmill/open
tank) 11:10MCL SMCL
Depth 373.25 NA 373.25 NA 376.83 NA 324.95 NADate 08.17.11 NA 08.17.11 NA 08.17.11 NA 08.18.11 08.18.11
Temp, °C 18.23 NA 17.97 NA 18.03 NA 17.3 24.89pH 7.72 NA 7.72 NA 7.73 NA 7.6 8.56
ORP, mv 102.00 NA 162.00 NA 162 NA 60 215D.O., mg/L 5.95 NA 6.53 NA 6.71 NA 1.61 4.75
D.O., % 68.90 NA 73.00 NA 77 NA 18.7 63.6Cond., mS/cm 2.23 NA 2.22 NA 2.241 NA 2.261 6.484
TDS (calc),mg/L
1312.50 NA 1306.65 NA 1317.71 NA 1330.74 4384.50
TOC, mg/L as C 0.5655 NA 0.3958 NA 0.3728 NA NA NAAlkalinity,
mg/L CaCO3134.62 NA 170.29 NA 150.63 NA NA NA
Cl-, mg/L 454.49 NA 446.83 NA 444.99 NA NA NA 250SO4
2-, mg/L 255.17 NA 229.52 NA 229.20 NA NA NA 250F-, mg/L 0.1295 NA 0.1295 NA 0.1261 NA NA NA 4.00 2.00Br-, mg/L 0.1226 NA 0.1155 NA 0.1165 NA NA NA
NO3-, mg/L 0.4097 NA 0.4708 NA 0.4550 NA NA NA 10
Na+, mg/L 283.96 223.75 273.99 223.51 270.21 223.13 217.58 1136.78
Na+, mg/L 274.22 NA 270.85 NA 265.69 1182.43
avg Na+, mg/L 279.09 223.75 272.42 223.51 267.95 223.13 217.58 1159.60K+, mg/L 3.0496 2.8335 2.6676 3.0012 2.6189 2.7169 2.6904 3.9990
K+, mg/L 2.9618 NA 2.7221 NA 2.6400 4.1442
avg K+, mg/L 3.0057 2.8335 2.6948 3.0012 2.6295 2.7169 2.6904 4.0716Ca2+, mg/L 105.98 86.08 101.33 84.75 101.22 86.13 80.48 93.18
Ca2+, mg/L 100.58 101.12 NA 98.07 86.98
avg Ca2+, mg/L 103.28 86.08 101.22 84.75 99.65 86.13 80.48 90.08Mg2+, mg/L 55.99 45.06 55.32 45.51 54.56 44.98 44.76 58.36
Mg2+, mg/L 50.52 NA 51.52 NA 50.62 53.75
avg Mg2+, mg/L 53.26 45.06 53.42 45.51 52.59 44.98 44.76 56.06Sr2+, mg/L 1.6875 1.3845 1.6373 1.3434 1.6527 1.3430 1.2856 1.0831
Sr2+, mg/L 1.6949 NA 1.69 NA 1.6563 1.0752
avg Sr2+, mg/L 1.6912 1.3845 1.6645 1.3434 1.6545 1.3430 1.2856 1.0792Fe3+, mg/L 3.7095 3.5233 0.1751 1.1252 0.7344 1.1814 1.9230 2.7100
Fe3+, mg/L 3.9334 NA 0.8273 NA 0.5326 NA NA 1.4983avg Fe, mg/L 3.8214 3.5233 0.5012 1.1252 0.6335 1.1814 1.9230 2.1042 0.30Mn3+, mg/L 0.2356 0.2521 0.0301 0.0304 0.0264 0.0265 0.1584 0.1610
Mn3+, mg/L 0.2111 NA 0.0286 NA 0.0177 NA NA 0.1371avg Mn, mg/L 0.2234 0.2521 0.0293 0.0304 0.0221 0.0265 0.1584 0.1490 0.05
Zn2+, mg/L 0.5671 0.8629 0.0537 0.0954 0.0542 0.1299 4.2102 0.6671
Zn2+, mg/L 0.4070 NA 0.0427 NA 0.0287 NA NA 0.5778
avg Zn2+, mg/L 0.4871 0.8629 0.0482 0.0954 0.0415 0.1299 4.2102 0.6225 5.00Ba2+, mg/L 0.0215 0.7512 0.0198 0.9811 0.0202 1.1955 0.8329 0.0451
Ba2+, mg/L 0.0169 NA 0.0203 NA 0.0168 NA NA 0.0417
avg Ba2+, mg/L 0.0192 0.7512 0.0200 0.9811 0.0185 1.1955 0.8329 0.0434 2.00Al3+, mg/L 0.4483 1.4441 0.0203 1.9145 0.0866 2.2041 1.5313 0.5153
Al3+, mg/L BMDL NA BMDL NA BMDL NA NA 0.0773avg Al3+, mg/L 0.4483 1.4441 0.0203 1.9145 0.0866 2.2041 1.5313 0.2963 0.20
U, mg/L 0.0068 0.0047 0.0011 0.0025 0.0029 0.0024 0.0027 0.0013avg U, mg/L 0.0068 0.0047 0.0011 0.0025 0.0029 0.0024 0.0027 0.0013 0.030
Si, mg/L 5.6862 3.6210 4.9009 3.6469 5.4083 3.4678 3.2208 3.7859Si, mg/L 4.5071 NA 5.74 NA 5.1187 NA NA 3.8894
avg Si, mg/L 5.0966 3.6210 5.3181 3.6469 5.2635 3.4678 3.2208 3.8377As, mg/L 0.0028 0.0112 0.0018 0.0104 0.0042 0.0093 0.0087 0.0075 0.010Se, mg/L 0.0290 0.0209 0.0267 0.0293 0.0248 0.0294 0.0160 0.0240 0.050
P, mg/L NA NA NA NA NA NA NA NAPb, mg/L 0.0074 0.0044 none detected 0.0037 0.0024 0.0037 0.0029 0.0042V, mg/L none detected 0.0095 none detected 0.0138 none detected 0.0174 0.0114 none detectedBe, mg/L none detected none detected none detected none detected none detected none detected none detected none detected 0.004B, mg/L 0.1006 NA 0.1018 NA 0.0970 NA NA 0.10489Ti, mg/L 0.0081 0.4541 0.0072 0.5718 0.0072 0.6495 0.0208 0.0082Cr, mg/L 0.0045 0.0056 none detected 0.0082 0.0015 0.0072 0.0054 0.0073 0.10Co, mg/L 0.0026 none detected 0.0023 none detected 0.0021 none detected none detected 0.0023Ni, mg/L 0.0063 0.0133 0.0048 0.0133 0.0052 0.0110 0.0059 0.0061Cu, mg/L 0.0347 0.0221 0.0019 0.0147 0.0090 0.0162 0.0136 0.0302 1.00Ge, mg/L NA NA NA NA NA NA NA NAZr, mg/L NA NA NA NA NA NA NA NANb, mg/l NA NA NA NA NA NA NA NAMo, mg/L 0.0014 0.0047 0.0018 0.0069 0.0017 0.0050 0.0047 none detectedAg, mg/L none detected none detected none detected none detected none detected none detected none detected none detected 0.10Cd, mg/L none detected none detected none detected none detected none detected none detected none detected none dectected 0.005Sn, mg/L none detected none detected none detected none detected none detected none detected none detected none dectectedSb, mg/L none detected none detected none detected none detected none detected none detected none detected none dectected 0.006Ta, mg/L NA NA NA NA NA NA NA NAW, mg/L NA NA NA NA NA NA NA NARe, mg/L NA NA NA NA NA NA NA NAHg, ng/L NA NA NA NA NA NA NA NA 2000Tl, mg/L none detected none detected none detected none detected none detected none detected none detected none detected 2000
Figure 7 - Water chemistry at Well 5T-529

ID 4850 - Solar Photovoltaic Desalination
11
Solar Pump Installation
The solar pumping system was purchase and installed in the Well 5T-529 near Leupp Arizona. The pump and required equipment was deployed in the well on May 2-3, 2012. The system consists of:
• Grundfos 11SQF-2 solar pump
• Grundfos CU200
• Grundfos I.O. 101 status/level switch and termination/generator interface control boxes
• CU 200 level switch
• 500 feet of control cable
Figure 8 - Solar well pump controllers
Figure 9 - Solar well pump This pump system works with an AC generator, with AC line power, with 12-volt or, 24-volt solar power and 120-volt and 240 volt coming from the CPVTHS System installed for operating the solar desalination system equipment under this research. In order to produce a reliable supply of water for the local livestock and not interrupt the research, a dedicated 12-volt solar photovoltaic system was installed for well pumping and is currently operational which keeps the 24,000 gallon water storage tank full. This system also maintains a water

ID 4850 - Solar Photovoltaic Desalination
12
supply in “Tank B” another 24,000 gallon water storage tank located 7 miles down gradient from well site 5T-529.
Figure 10 - Dedicated solar panels for pumping

ID 4850 - Solar Photovoltaic Desalination
13
Site Development
In order to continue this research at the chosen well site 5T-529 a test facility was developed. A pad for the membrane distillation systems, the anchoring system for the solar photovoltaic thermo hybrid system, an out building for the electronic controllers, and a secure fenced in area was constructed beginning in September 2012 and completed in December of the same year.
Site Development Design The site development design consisted of constructing a test facility for desalination process intended to increase the supply and quality of water for the Navajo Nation. The facility is located 15 miles northwest of Leupp, Arizona in a remote location west of Indian Route 6722. Existing structures at the current location consist of a 24 thousand gallon water storage tank, a watering trough used to provide water for livestock in the area, an existing groundwater well, and a decommissioned windmill powered pump system which has been replaced by a submersible solar pumping system.
Figure 11 - Site development plant SCOPE OF WORK PERFORMED INCLUDES:
1. Furnish and install 300 ft of 6’ tall fence, 3 strand barb wire on top, a vehicle gate and a pedestrian gate.
2. Furnishing and installing 50 yd3 of gravel surfacing.

ID 4850 - Solar Photovoltaic Desalination
14
3. Furnish and install 8 yd3 of concrete with wire mesh reinforcement. 4. Furnish and install a 7’x 7’ waterproof shed. 5. Furnish and install approximately 430-450 feet of 1” pipe, 4 solenoid
valves, 9 ball valves, unions, elbows and other fittings. 6. Install a government furnished 1/3 HP pump, 75 gallon tank and a
float switch in the 24k gallon tank. 7. Welding for weld-o-lets in the 24k gallon tank and L-Brackets to a
corrugated metal pipe vault. 8. Trenching and backfilling approximately 160- 170 ft of trench for
burying pipe and wire. 9. Electrical installing of a relay, circuit breaker, 4 solenoid valves and
two pumps. 10. Furnish and install 5 yd3 of unformed concrete with rebar anchors. 11. Furnish and install a corrugated metal pipe vault of 5’ tall x 4’
diameter with a steel lid of 1/8” thick x 5’ diameter. and
12. Minor details not listed above.
Site Development Requisition The site development contract requisition was signed and submitted for processing on April 6, 2012. Requisition No. 2012320700005
Site Development Contract
The site development contract No. R12PS32025 was advertised June 15, 2012 and closed on June 29, 2012. The contract was awarded July 24, 2012,
Figure 12 - Test facility being development

ID 4850 - Solar Photovoltaic Desalination
15
to Oden Construction Company, with the notice to proceed provided on August 31, 2012. The contractor mobilized and performed all aspects of the contract. The contact was considered substantially complete on December 3, 2012. Concentrated Photovoltaic – Thermal Hybrid System (CPVTHS)
CPVTHS Design The initial CPCTHS design was submitted to Reclamation in conjunction with the requirements for heat and electricity identified in the mass balance model prepared by the University of Arizona. Eric Brown who represents the renewable energy company CoGenra as their Senior Sales Engineer provided an initial quote for the system on March 29, 2012 which was based on the mass balance design.
CPVTHS Requisition The CPVTHS requisition was approved on May 15, 2012. Requisition No. 2012320700008 was transmitted in the procurement office and approved for action on June 14, 2012.
CPVTHS Contract The specification and drawings were transmitted to the procurement office
on June 5, 2012. The cost estimate provided by CoGenra was provided to the procurement office on June 18, 2012. The CPVTHS system contract was awarded on September 18, 2012 to Ace Solar Systems. Ace Solar Systems elected to use the Cogenra SunDeck 2.0 Modules. These modules have a name plate production capacity of 5.2 kW/day for power generation and will produce 4.5 therms (1therm= 100,000 btu’s). The system was constructed on site and tested. The final commissioning of the Cogenra CPVTHS system was complete on January 31, 2013. The system has
Figure 13 - Constructing the CPVTHS been operational capable since commissioning with average output

ID 4850 - Solar Photovoltaic Desalination
16
running in the range of the name plate values. The system has not been run continually because of the lack of demand for the electricity and heat.
Figure 14 - Finished CPVTHS

ID 4850 - Solar Photovoltaic Desalination
17
System Operational Equipment
Various equipment to operate and control the system was installed at the site. The list and their function are: Master switch panel – Separates the renewable power from the site equipment
Figure 15 - Master power controls
ID 4850 - Solar Photovoltaic Desalination
18
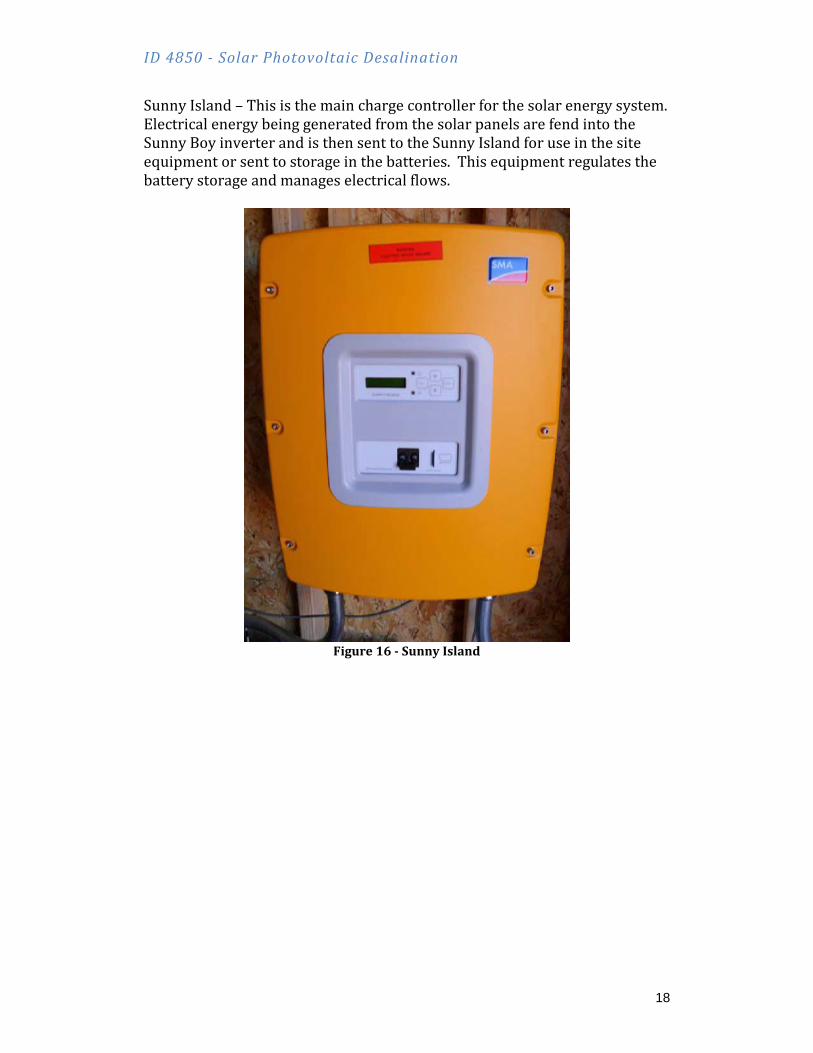
Sunny Island – This is the main charge controller for the solar energy system. Electrical energy being generated from the solar panels are fend into the Sunny Boy inverter and is then sent to the Sunny Island for use in the site equipment or sent to storage in the batteries. This equipment regulates the battery storage and manages electrical flows.
Figure 16 - Sunny Island
ID 4850 - Solar Photovoltaic Desalination
19
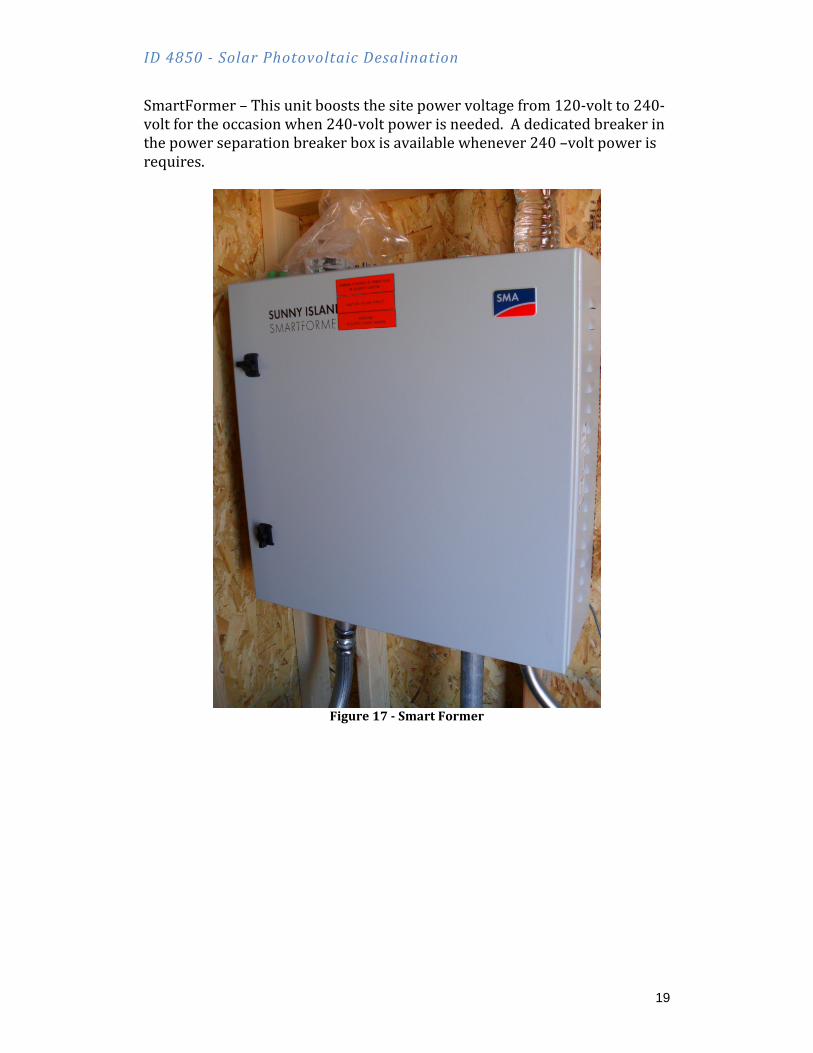
SmartFormer – This unit boosts the site power voltage from 120-volt to 240-volt for the occasion when 240-volt power is needed. A dedicated breaker in the power separation breaker box is available whenever 240 –volt power is requires.
Figure 17 - Smart Former

ID 4850 - Solar Photovoltaic Desalination
20
Sunny Boy – The Sunny Boy inverts are located on each of the CoGenra solar arrays. These Sunny Boy units convert 12-volt direct current (DC) power being generated by the solar photovoltaic panel to a standard 120-volt alternating current (AC). This electrical output is for use on various power consuming site equipment.
Figure 18 - Sunny Boy inverters

ID 4850 - Solar Photovoltaic Desalination
21
Communication Cabinet – The COGENRA Solar depicted below contains the Sunny Web Box. The Sunny Web Box allows for remote communication with the various systems at the site. This is accomplished with a wireless cellular modem. This allows remote access to the CoGenra equipment for monitoring and adjustments to the system as needed. This Sunny Web Box is connected and linked to the iBOS box which is depicted on page 23. This is also connected to the Sunny Island in order to monitor power production and the “State of Charge” of the battery storage system so remote monitoring of these systems can also occur.
Figure 19 - Communication cabinet

ID 4850 - Solar Photovoltaic Desalination
22
Figure 20 reflects the output coming from the CoGenra website showing the electrical generation and the heat production being produced from the CPVTHS. During this time of year the system was producing nearly 8 kWh per day and nearly 8 therms which is 800,000 British Thermo Units (btu’s).
Figure 20 - Output from CoGenra website about the Leupp project Figure 21 depicts the “State of Charge” for the battery storage system.
Figure 21 - Batteries "State of Charge" from the SMA Sunny Portal
ID 4850 - Solar Photovoltaic Desalination
23
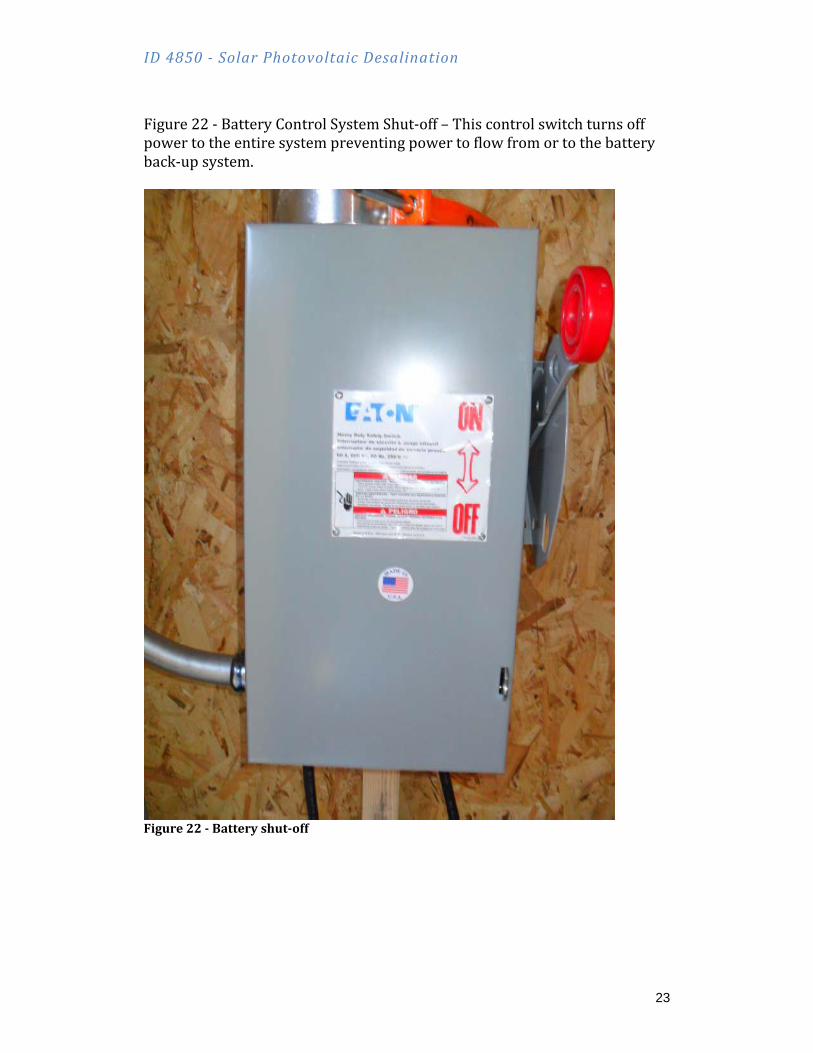
Figure 22 - Battery Control System Shut-off – This control switch turns off power to the entire system preventing power to flow from or to the battery back-up system.
Figure 22 - Battery shut-off
ID 4850 - Solar Photovoltaic Desalination
24
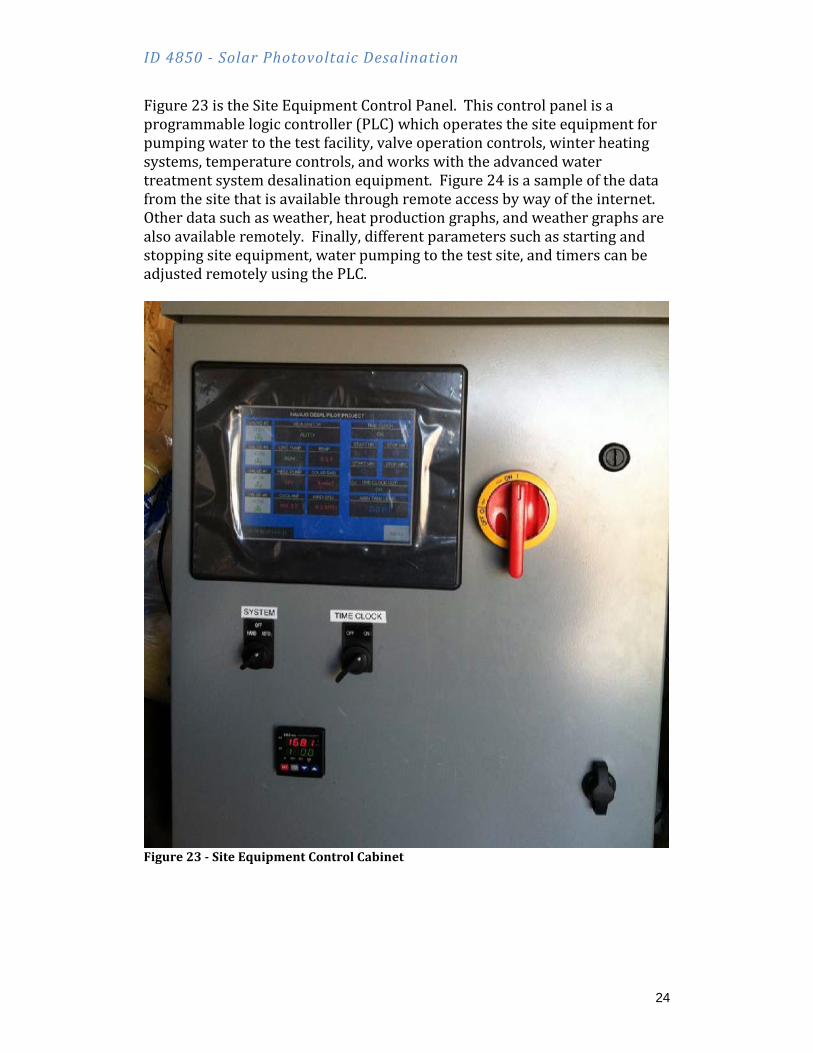
Figure 23 is the Site Equipment Control Panel. This control panel is a programmable logic controller (PLC) which operates the site equipment for pumping water to the test facility, valve operation controls, winter heating systems, temperature controls, and works with the advanced water treatment system desalination equipment. Figure 24 is a sample of the data from the site that is available through remote access by way of the internet. Other data such as weather, heat production graphs, and weather graphs are also available remotely. Finally, different parameters such as starting and stopping site equipment, water pumping to the test site, and timers can be adjusted remotely using the PLC.
Figure 23 - Site Equipment Control Cabinet

ID 4850 - Solar Photovoltaic Desalination
25
Figure 24 - Programmable Logic Controller Data Remote Readout

ID 4850 - Solar Photovoltaic Desalination
26
The iBOS control system for the CoGenra CPVTHS are located below the solar arrays. These units control the tracking system, the flow of the glycol for heat production, communicate to the Sunny Web Box, and communicate with CoGenra’s home office in Mountain View, California. These are essentially the brain or operating system for the CPVTHS.
Figure 25 - iBOS

ID 4850 - Solar Photovoltaic Desalination
27
The solar desalination system in powered by renewable energy in an off-grid location. The enire system is dependant on the battery storage system. All power at the site runs throught the battery system. These are SunXtender 12-volt 129-amp batteries and total 1039 amp capacity. The battery state of charge is managed by the Sunny Island, Figure 16 and can be monitoried through the Sunny Portal indicated in Figure21.
Figure 26 - Battery Storage
Weather Station
A weather station was installed at the site to monitor various meteorological data. The weather station is a David Instrument’s VantagePro-2 weather station control system including a solar radiation sensor for monitoring insulation. An Ocean Controls remote SCADA system was also installed for remote access to the meteorological data. The weather station monitors:
• Temperature o Inside the building o Outside the building
• Rain • Barometric pressure • Wind speed • Humidity • Sun location

ID 4850 - Solar Photovoltaic Desalination
28
• Insolation (watts per meter squared) • Other meteorological data (sun rise, sun set, . . .)
Figure 27 - Weather station console Figure 28 - Weather station equipment

ID 4850 - Solar Photovoltaic Desalination
29
The weather station is self-contained and can operate independently of the site power system. A solar recharging unit along with self-contained backup batteries was installed to insure weather data is always available regardless of the state of the other site equipment.
ID 4850 - Solar Photovoltaic Desalination
30
Membrane Distillation
Membrane Distillation (MD) Conceptual Design for Site Development The basic Membrane Distillation conceptual design was developed by Dr. Wendell Ela. A bench scale prototype was tested at Reclamation’s Marana, Arizona test facility by Wendell and his student team. Under this research the pilot demonstration test is being deployed and constructed at the Well sited 5T-529 for the applied research application.
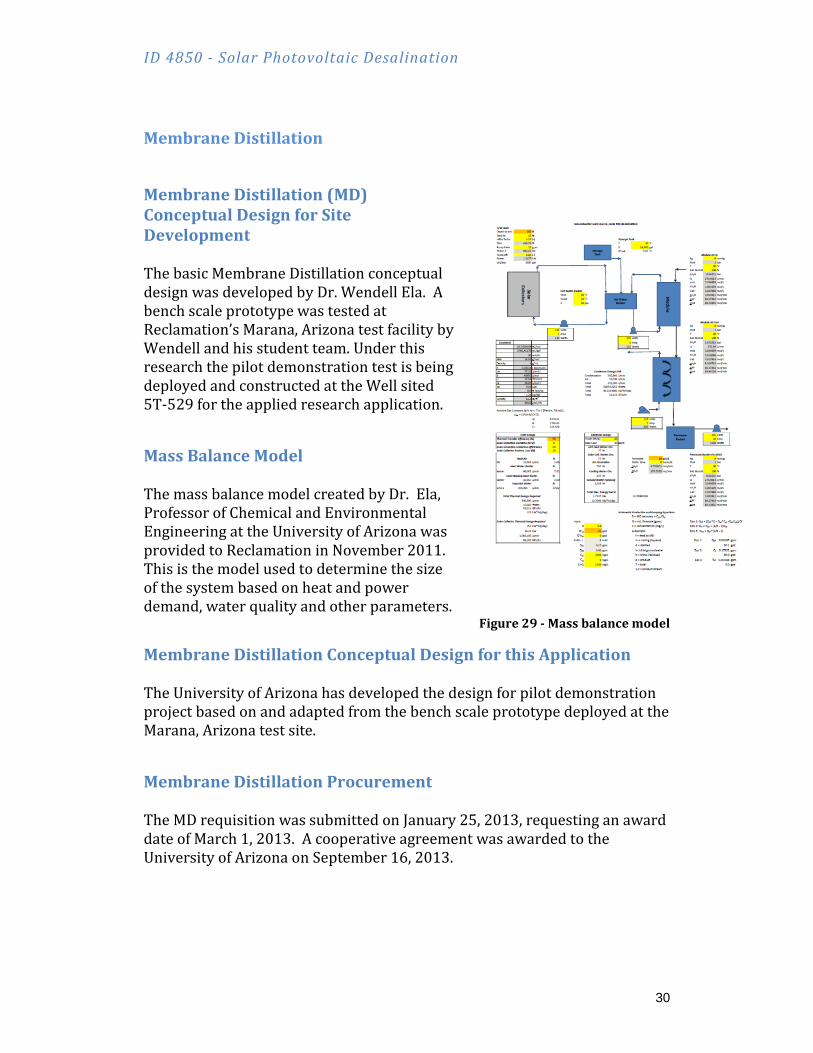
Mass Balance Model The mass balance model created by Dr. Ela, Professor of Chemical and Environmental Engineering at the University of Arizona was provided to Reclamation in November 2011. This is the model used to determine the size of the system based on heat and power demand, water quality and other parameters.
Figure 29 - Mass balance model
Membrane Distillation Conceptual Design for this Application The University of Arizona has developed the design for pilot demonstration project based on and adapted from the bench scale prototype deployed at the Marana, Arizona test site.
Membrane Distillation Procurement The MD requisition was submitted on January 25, 2013, requesting an award date of March 1, 2013. A cooperative agreement was awarded to the University of Arizona on September 16, 2013.

ID 4850 - Solar Photovoltaic Desalination
31
Membrane Distillation
The University of Arizona began planning and developing the requirements to construct the membrane distillation system. They developed the final design and constructed the working units in the lab at the University of Arizona in Tucson. It was built with a modular design in order to fit the requirements for constructing at the Leupp test facility. The units were separated and ready for transport to the Leupp test site. On June 3, 2014 the membrane distillation system was transported to the Leupp test facility. During that week the University of Arizona students and staff re-assembled the
Figure 30 - Treatment train fabricated at the University of Arizona desalination equipment at the site and began commission testing the system. System Programmable Logic Controllers were installed and connected to the desalination equipment. In an effort to protect the desalination equipment the University of Arizona purchased and installed a structure which is portable fabric covered building which and can be moved to other locations but is durable for the local conditions. This structure will protect the equipment for the harsh conditions that exist at this site. Wind in the area at times reach 60 mile per hour. Therefore, it was necessary to protect this equipment from the potential damage these conditions may cause.

ID 4850 - Solar Photovoltaic Desalination
32
Figure 31 - Treatment train fabricated at the Leupp test facility with UA development team
Figure 32 - Desalination equipment protective shelter It is anticipated that there will be about three-months’ worth of data gathered on this system before the expiration of this research period under the existing Science and Technologies funding. A request for additional time and funds will be requested during the next Science and Technologies funding cycle in order to gather a full 12-months’ worth of data about the capability and robustness of this concept.

ID 4850 - Solar Photovoltaic Desalination
33
Because of delays in the Reclamation’s procurement office processing the cooperative agreement request, the award to the University of Arizona was nine month late. We had anticipated the work would have been awarded to the University of Arizona in March for development and construction of the desalination equipment in the warm months. However, the agreement was awarded in late September and the University was not able to prepare the design for constructions before the freezing temperatures at the site occurred. The University delayed deployment for the equipment to the test site for nearly nine month because of the potential freeze damage that will occur to an untested system. A time extension was granted to the University of Arizona until September 30, 2015, with the hope that additional funds will be made available for the additional months of data gathering and equipment fine tuning.
Cost Benefit Analysis and Technology Transfer
The project also includes the development of a benefits and cost analysis of the solar energy powered desalination system by applying a triple bottom line (TBL) approach to assess the social, economic and observed environmental impacts of the solar desalination system in the area. A model is created to assess the value of the system to the community and inform a broader energy and water resource management strategy. The evaluation of the water supply reliability, energy savings, avoided water supply costs, system lifetime costs and financial analysis for the project will be included in the analysis. Technology transfer for the field-based solar-powered MD system will be conducted through training , information sessions with the residents and key stakeholders of the project and an online manual of the system operations to ensure operations, maintenance and parts replacement after the study period ends.

ID 4850 - Solar Photovoltaic Desalination
34
Cost Share
There is a great deal of interest in this project. The following organizations are financial contributors to this project: Denver Research Office through the Science and Technologies program The University of Arizona – Renewable Energy Network (REN) and the Department of Engineering The Navajo Nation – Department of Water Resources The Grand Canyon Trust The Phoenix Area - Office Native American Affairs Office The Provo Area Office – Planning Office
Conclusions
In the proposal for this research there were three research questions: 1. Are there opportunities to use impaired or brackish water resources not currently being used because of their marginal quality and treat them to potable standards in areas that are outside the traditional water and electrical power infrastructure grid? 2. Can a renewable energy treatment system be used in treating these marginal water supplies? 3. Can concentrating solar panels be used in a desalination treatment train to produce potable water supplies in these off- grid locations? All three of these questions have been answered with this research. A survey of the potential brackish water well was inventoried in the Southwestern Navajo Nation. One well was identified as the location where brackish groundwater could be improved by an off-grid renewable energy desalination system. That was is Navajo well 5T-529. This well is located about 15 miles northwest of the town of Leupp, Arizona. A dedicated solar pumping system was designed and constructed as a stand-alone system to insure the 24,000 gallon water storage tank will remain full. This dedicated system also enables that releases can be made to the 24,000 gallon tank connect by a 7-mile long pipeline down gradient from this site.

ID 4850 - Solar Photovoltaic Desalination
35
A test facility was constructed at well site 5T-529. The test facility includes site equipment, a secured fenced-in area with concrete a pad, secure storage building and control house, anchorage for solar power plant and all necessary piping from the existing water storage tank to the test site and discharge pond. The renewable energy system that was selected for this project was a Concentrated Photovoltaic Thermal Hybrid System (CPVTHS), CoGenra SunPack 12 plant which is a concentrating solar system. This system was installed which is a low-concentration, photovoltaic and thermal power system that produces low-grade thermal energy (<100oC) and electrical energy for operating fluid transfer and control system devices. The system has parts that are easily replaced and utilizes a water/glycol mixture in a closed loop that cools the PV cell, capturing excess solar energy as heat. A structure was constructed on the concrete pad to protect the advance water treatment system which was developed by the University of Arizona under the direction of the Principle Investigator for the university, Ms. Ardeth Barnhart. Finally the advanced water treatment system or membrane distillation system was constructed inside the protective structure under the guidance from Dr. Wendell Ela. All of the equipment at the site have been commissioned and are operating. The solar pumping system and the CoGenra power plant are operating continuously. The advance water treatment system or membrane distillation system is only operating when the University of Arizona student and faculty are present. The first distilled water from the system was produced on July 10, 2014, which contained 5 part per million (ppm) total dissolved solids (tds). It is anticipated that during the next funding cycle the advance water treatment system will be configured to operate continuously. This entire system is anticipated to be an off-grid advanced water treatment system capable of providing better quality water for livestock with prospect of upgrading the system to a potable water treatment system for the local population.

ID 4850 - Solar Photovoltaic Desalination
36
Attachements

ID 4850 - Solar Photovoltaic Desalination
37
Attachment A – Navajo Nation Solar Desalination Research Pilot Demonstration Project

ID 4850 - Solar Photovoltaic Desalination
38

ID 4850 - Solar Photovoltaic Desalination
39

ID 4850 - Solar Photovoltaic Desalination
40

ID 4850 - Solar Photovoltaic Desalination
41

ID 4850 - Solar Photovoltaic Desalination
42

ID 4850 - Solar Photovoltaic Desalination
43

ID 4850 - Solar Photovoltaic Desalination
44

ID 4850 - Solar Photovoltaic Desalination
45

ID 4850 - Solar Photovoltaic Desalination
46
ID 4850 - Solar Photovoltaic Desalination
47

ID 4850 - Solar Photovoltaic Desalination
48

ID 4850 - Solar Photovoltaic Desalination
49

ID 4850 - Solar Photovoltaic Desalination
50

ID 4850 - Solar Photovoltaic Desalination
51

ID 4850 - Solar Photovoltaic Desalination
52

ID 4850 - Solar Photovoltaic Desalination
53

ID 4850 - Solar Photovoltaic Desalination
54

ID 4850 - Solar Photovoltaic Desalination
55

ID 4850 - Solar Photovoltaic Desalination
56

ID 4850 - Solar Photovoltaic Desalination
57

ID 4850 - Solar Photovoltaic Desalination
58

ID 4850 - Solar Photovoltaic Desalination
59
ID 4850 - Solar Photovoltaic Desalination
60

ID 4850 - Solar Photovoltaic Desalination
61

ID 4850 - Solar Photovoltaic Desalination
62

ID 4850 - Solar Photovoltaic Desalination
63

ID 4850 - Solar Photovoltaic Desalination
64
ID 4850 - Solar Photovoltaic Desalination
65

ID 4850 - Solar Photovoltaic Desalination
66

ID 4850 - Solar Photovoltaic Desalination
67

ID 4850 - Solar Photovoltaic Desalination
68

ID 4850 - Solar Photovoltaic Desalination
69

ID 4850 - Solar Photovoltaic Desalination
70

ID 4850 - Solar Photovoltaic Desalination
71

ID 4850 - Solar Photovoltaic Desalination
72
ID 4850 - Solar Photovoltaic Desalination
73
ID 4850 - Solar Photovoltaic Desalination
74

ID 4850 - Solar Photovoltaic Desalination
75

ID 4850 - Solar Photovoltaic Desalination
76
Attachment B – Site Assessment Report
Well Assessment for Navajo Nation - Leupp Chapter Stockwell 05T-529
Summary of Downhole Video Survey and Pumping August 15-18, 2011
Video Logging A video survey was conducted for well 05T-529 beginning at 2:30 p.m. on August 15, 2011. The video camera lens (depth) was zeroed out at ground level, a centralizer installed and the survey was recorded to high definition DVD. The steel well casing is 6-5/8-inch diameter. The sucker rod had been removed the previous week and the well brushed and cleaned by the Navajo Nation Leupp pump crew on August 11-12. This only left the weekend for the water column to clear up. The steel casing appeared to be in good condition and clean for most of its length, especially the first 300 feet, which is documented in Title 1 (19:49 minutes duration). Some minor pitting was observed below about 100 feet. Welded casing joints were encountered about every 20-21 feet at approximate depths of 17, 37, 59, 80, 102, 123, 145, 166, 185, 210, 227, 249, 269, and 290 feet. The recording continued as Title 2 (42:53) from 300 to 483 feet where the camera apparently bottomed out on sediment (the well is reported to be 500-foot deep from the Navajo Well database). Welded joints continued at about 312 feet and at 333 feet were some patchy rust spots. The camera encountered the static water level at 326.5 feet and once below water, visibility via the down view lens was poor to non-existent. The remaining survey used the side view lens to observe the casing wall, joints and slotted features. At approximately 358 feet, began picking up noticeable encrustation (coating or plating) of calcium carbonate deposits. The first feature, which initially was thought to be the top of a wire wrapped well screen, was subsequently interpreted to be exposed casing threads, as any well screen would be expected to continue for many feet (there are no known well screen or slotting records for this well). Several more intervals were seen of these casing threads, at 393.5, 415.1, 457.1, and 478.4 feet. Each interval was estimated to be about 0.1-0.2 feet thick. Often seen were “windows” through the coatings to clean casing steel and brush or scratch marks through the coatings, presumably from the Navajo crew’s brushing efforts and/or from when the submersible pump/flex hose dropped to the well bottom in the November 2010 work.

ID 4850 - Solar Photovoltaic Desalination
77
The first possible perforation feature (vertical torch cut slot) seen was at about 397.9 feet and the bottom of the slot at about 399.5 feet. It is interpreted the casing had been torch cut slotted in the lower 100 feet (about 400-500) of the steel well casing during installation in 1974. The next slot observed was about 405 to 407 feet. Other thin slots were recorded at about 428-429.5 feet, 431.9-432.6 feet, 440.5-441.0 feet and 441.4-441.6 feet. The slots are undulating. The slots appear to have been torched randomly (random intervals) along the casing as the casing sections were welded, with some as pairs on opposite sides (180 degrees) of the casing, but others on only one side. This was not consistent and no orderly slot groups or arrays seem to be present as would normally be expected. An example of a group might be four 2 foot-long slots cut longitudinally each 90 degrees around the casing, in depth increments of 5 to 10 feet. The 05T-529 slots had varying degrees of clogging or tuberculation, of what is expected to be calcium carbonate and other insoluble salts (e.g. chlorides) healing much of the slot open area. The plugged to open slot percentage was estimated at about 60:40. The camera stopped at about 483 feet on sediment and the survey was completed at 5:15 p.m. Pumping On Tuesday August 16, 2011 at about 8:00 a.m., the static water level was measured from the top of the 6-5/8-inch steel casing at 324.76 feet (323.5 feet below ground level). The 4-inch Grundfos 40S75-25 submersible pump was attached to the lowermost section of riser pipe and the 10/4 electrical cable spliced to the motor leads using crimps and heat shrink tubing kits. Thirty-nine additional sections of 10.5-foot long threaded and coupled 2-inch diameter galvanized steel riser pipe were assembled and lowered into the well by the Navajo Nation Leupp Chapter pump crew foreman Harvey Riggs and his two helpers. The pump intake is set about 406 feet deep. A by-pass valve and hose was attached to the riser pipe at the top of the wellhead, and at 12:33 p.m. the pump was activated using a rented 34 Kw three-phase Multiquip generator through the three-phase electrical control panel. The discharge water cleared rapidly which was directed into the charco. Two bucket tests determined the discharge as 5.71 and 5.83 seconds per 5 gallons or about 53 gpm. At 1:15 p.m. a water level sounder measurement showed the pumping level at about 370 feet below top of casing, or about 45 feet of drawdown. By 1:30 p.m. the discharge had dropped off to about one-half the initial rate, likely more representative of aquifer storage rather than casing storage. At this time a 2-inch Neptune totalizing meter was attached to the discharge line to begin filling the 24,000 gallon storage tank. The starting meter reading was 8363700 gallons. By 1:55 p.m. the pump rate was 27-28 gpm according to the meter. A bucket test at 3:24 p.m. was 9.61 sec/5 gal or

ID 4850 - Solar Photovoltaic Desalination
78
31.2 gpm. Temperature of bypass discharge was 66 degrees. Pumping continued until 5:30 p.m. ? and the generator was hauled back to the Leupp Chapter yard for security. On August 17, 2011 the static water level was measured at 324.77 feet below top of casing (323.5 feet bgl), showing that the aquifer had recovered fully. Pumping began again at 10:33 a.m. after the UA staff repaired one of the water level sounders. A bucket test showed 5.63 sec/5 gal or 53.3 gpm, very similar to the intial discharge rate the previous day. At this time the UA collected water samples from the by-pass discharge hose. At 11:30 a.m. the pumping depth to water was 373.25 feet (48.48 feet of drawdown) at 27-28 gpm, for a specific capacity of 0.58, a fairly low production rate, but representative of many tests in the C-Aquifer. The pump rate remained consistent at 27-28 gpm throughout the day, and at 4:10 p.m. the drawdown had increased to 52.06 feet. The pumping water level at this time was 377.71 feet from TOC or 376.83 feet bgl. Pumping stopped at 5:00 p.m. The storage tank had filled halfway to about the 10,000-11,000 gallon level. The generator was then taken to the Leupp yard for storage. Pumping continued the next day to continue filling the storage tank. The static water level was measured first thing on August 18, 2011 at 324.94 feet below top of casing (323.7 feet bgl). The well had likely recovered back to static level and the 0.2-foot difference from the previous day is attributed to difficulties in obtaining repeatable water level indicator readings due to variable probe sensitivities. The probe tends to pick up moisture and cascading or dribbling flows from higher levels which are sometimes difficult to separate from the actual water table in the well. The water meter continued to show 28 gpm discharge rate, and the final pumping water level reading was 379.27 feet below top of casing or 378 feet below ground level at 9:10 a.m. The ending meter reading was 8380200 gallons. At least 16,500 gallons was pumped from the C-Aquifer through the meter. An additional approximately 1800 gallons was pumped to the charco and cattle troughs prior to incorporating the meter, for a total volume of about 18,000 gallons. The pump and riser pipe including submersible pump cable was left in the well for future stock-tank filling by the Navajo Nation DWR. The three-phase electrical control panel was disconnected from the pump cable and generator, placed in its box and wrapped with a plastic garbage bag. It was placed into the 4-foot CMP culvert to try and keep it out of sight for upcoming installation by the NNDWR Leupp pump crew. This is government equipment.
8/23/11