Embed Size (px)
Citation preview

Southern Alliance for Clean EnergyP.O. Box 1842 | Knoxville, TN 37901 | 865.637.6055
SOLAR IN THE SOUTHEAST2018 Annual Report

2
Solar in the Southeast 2018 Annual Report
I N T R O D U C T I O N
A B O U T S A C EThe Southern Alliance for Clean Energy (SACE) is anonprofit organization that promotes responsible energychoices to ensure clean, safe, and healthy communitiesthroughout the Southeast. As a leading voice for energypolicy in our region, SACE is a regional organizationfocused on transforming the way we produce andconsume energy in the Southeast.
Solar in the Southeast illuminates the critical role ofutilities in the growing southeastern solar market.Southeastern states, particularly Alabama, Florida,Georgia, Mississippi, North Carolina, South Carolina,and Tennessee, grant monopoly utilities, rather thana competitive marketplace, the responsibility andcontrol over power supplies. Consequently, thelocation of a home or business is the primarydeterminant not only of which utility will supply theelectricity, but also the amount of solar within thatportfolio.To provide an equitable, unbiased comparison ofvarious-sized utilities throughout the Southeast,SACE has ranked utilities on the basis of watts percustomer (W/C) of solar power sourced to thecustomer. SACE has also calculated and forecasttotal installed capacity of solar power (inmegawatts, MW) particularly for state comparisons.
Proper citation for this report: “Southern Alliance for Clean Energy (2019). Solar in the Southeast, 2018 Annual Report.”
The purpose of this report is to document currentprogress and trends at both utility and state levels,as well as identify policies and practices to drivecontinued solar growth in the Southeast.
3
Solar in the Southeast 2018 Annual Report
T A B L E O F C O N T E N T S1. Executive Summary 42. Southeast Solar Capacity Forecast 53. Large Utility System Rankings 64. Forecast for Select Utility Systems 75. Southeast Solar Momentum: “SunRisers” 86. 2018 Southeast Solar Snapshot 97. Forecast for Southeast States 118. State Profiles 139. Data Sources, Methods & Assumptions 2110. Contact Information 2211. Appendices 23

4
Solar in the Southeast 2018 Annual Report
E X E C U T I V E S U M M A R YUTILITIES- South Carolina Electric & Gas (SCE&G)emerged as a solar power player in 2018,joining Duke Energy Progress, Duke EnergyCarolinas, and Georgia Power at the top of ourleaderboard. Each of these utilities offers morethan 400 watts of solar per customer (W/C).- Fellow Palmetto State utility, Santee Cooper,resides at the bottom of the board for both2018 and our 2022 forecast.- Florida Power & Light (FPL) announced a boldcommitment in 2019 that will propel it to solarleadership for the next decade.
STATES- Florida is beginning to live up to its reputationas the Sunshine State, surpassing Georgia oninstalled capacity (MW) in 2018. By 2022, wealso forecast solar capacity in Florida toexceed that of North Carolina.- Even with major announcements fromFacebook and Google, Tennessee andAlabama exhibit less than half the regionalaverage throughout our forecast period (2022).
CONTINUED GROWTHSolar growth continues in the Southeast (adding 65% in 2018). The region willsurpass 10,000 MW in 2019. SACE now anticipates 19,000 MW by 2022, up fromour prior projection of 15,000 by 2021.
CURRENT AND FUTURE LEADERSDuke Energy Progress, SCE&G, Duke Energy Carolinas and Georgia Power arethe current utility leaders ranked by watts per customer (W/C) offering unbiasedidentification of leaders in the southeast solar market. Walton EMC, FPL andOrlando Utilities Commission (OUC) join four returning "SunRisers" demonstratingleading levels of planned solar growth.
CORPORATE LEADERSHIP2018 was a banner year for corporate leadership on solar (nationwide 2.8gigawatts, GW according to Rocky Mountain Institute)1 and the Southeast wasno exception. Facebook drove major solar commitments in Georgia (203 MW),Alabama (227 MW) and Tennessee (150 MW). Google announced projects forTennessee and Alabama (150 MW each) and also joined with Target, Walmart,and Johnson & Johnson, to contract with Georgia Power for 177 MW of solar.
“SUNBLOCKERS”Santee Cooper, North Carolina Electric Cooperatives, and Seminole ElectricCooperative are sticking with outdated plans for low levels of solar. Despite beinghome to several of the corporate projects above, TVA falls into this category, aswell. We project that solar W/C for these four utilities will remain below today'sregional average W/C through at least 2022.
1. PV Magazine, December 18, 2018Corporatesolarprocurementknocks itoutoftheparkin2018

5
Solar in the Southeast 2018 Annual Report
0
2,500
5,000
7,500
10,000
12,500
15,000
17,500
20,000
2011 2012 2013 2014 2015 2016 2017 2018 2019 2020 2021 2022
Sola
r PV
Ca
pa
cit
y,
MW
(ac
)
2 0 1 8269 watts/customer
Generation ~1.7% of Retail Sales
2 0 2 2631 watts/customer
Generation ~3.8% of Retail Sales
S O U T H E A S T S O L A R C A P A C I T Y F O R E C A S TGROWTH CONTINUESThe seven-state Southeast region featured over 8,000 MW ofsolar in 2018 and will comfortably surpass 10,000 MW in 2019.Based on utility and other industry forecasts, SACE hasincreased its forecast to 17,000 MW by 2021 and nearing 20,000MW for 2022. Much of this growth represents existing contractsand commitments that remain highly certain.
UTILITY-SCALE SOLAR DOMINATESUtility-scale solar is favored by an economic advantage,policies, and discretionary utility practices that discouragecustomer-sited solar (“behind the meter”). Individual projectsas large as 200 MW are underway in the Southeast.
INCREASED ACCESSCertain markets are poised for growth in distributed generation solar, as well. Legislation pending in South Carolina will extend net metering. The Florida Public Service Commission (PSC) approved solar lease designs that should promote further growth and opportunity. Florida utilities are also advancing shared/community solar programs that should expand access for customers interested in solar.
LIMITED GRID IMPACTSEven with over 19,000 MW in 2022, the corresponding solargeneration is less than 4% of retail sales, considerably belowlevels that could trigger changes in grid operation practices.F O RE CA S TH I S TO RI C
DISTRIBUTED SOLAR
UTILITY-SCALE SOLAR

Drivers of solar leadership vary. Currently the top three utilities(DEP, SCE&G, DEC) all hail from the Carolinas – NorthCarolina with a renewable energy and energy efficiencyportfolio standard and South Carolina where major solarlegislation is poised to pass for the second time in five years.
SCE&G leapt from below the Southeast regional average in2017 to nearly double the regional average in 2018.
Georgia Power has continued deployment of its RenewableEnergy Development Initiative (REDI). The Georgia PublicService Commission (PSC) has an opportunity to reinforcethat legacy of leadership with comparable ambition in the2019 Integrated Resource Plan (IRP).
A four-year forecast to 2022 showcases three Florida utilitiesmaking great strides. FPL embarks on the boldest 10-yearsolar commitment of any utility in the country; Tampa Electricincreases solar penetration almost six-fold; and the portfolioof Duke Energy Florida (DEF) starts to resemble that of itsCarolina brethren.
Some southeastern utilities, however, fail to exhibit significantsolar ambition. Of these largest utility systems (each serving >500,000 customers), the bottom four (Santee Cooper, theNorth Carolina Electric Cooperatives, Seminole Electric, andthe Tennessee Valley Authority, TVA) are each forecast in2022 to remain below the 2018 regional average.
The 13 largest utility systems in the Southeast each serve more than 500k customers. This includes individual investor owned utilities like Georgia Power, as well as thecombination of utilities organized into cooperatives like Oglethorpe and the federally-owned Tennessee Valley Authority. Also studied, but not exceeding the 500kcustomer benchmark, are several regional municipal power agencies.
SYSTEMS WITH > 500,000 CUSTOMERS
2018WATTS/
CUSTOMER
DUKEENERGYPROGRESSS 1,625
SCELECTRIC&GAS 512
DUKEENERGYCAROLINAS 508
GEORGIAPOWER 426
SOUTHEAST AVERAGE 269
DUKEENERGYFLORIDA 188
FLORIDAPOWER&LIGHT 167
TAMPAELECTRIC 157
OGLETHORPEPOWER 152
TENNESSEEVALLEYAUTHORITY 84
ALABAMAPOWER 67
NCELECTRICCOOPERATIVES 45
SEMINOLEELECTRICCO-OP 24
SANTEECOOPER 22
SYSTEMS WITH > 500,000 CUSTOMERS
2022 FORECAST
DUKEENERGYPROGRESSS 2,618
SCELECTRIC&GAS 1,706
TAMPAELECTRIC 934
DUKEENERGYCAROLINAS 903
GEORGIAPOWER 809
FLORIDAPOWER&LIGHT 734
DUKEENERGYFLORIDA 676
SOUTHEAST AVERAGE 631
ALABAMAPOWER 335
OGLETHORPEPOWER 286
TENNESSEEVALLEYAUTHORITY 251
SEMINOLEELECTRICCO-OP 120
NCELECTRICCOOPERATIVES 71
SANTEECOOPER 42
L A R G E U T I L I T Y S Y S T E M R A N K I N G S 6

7
Solar in the Southeast 2018 Annual Report
F O R E C A S T F O R S E L E C T U T I L I T Y S Y S T E M SDUKE ENERGY LEADS THE SOUTHEASTDuke Energy has more than half of all the solar in the Southeast. DukeEnergy Progress (DEP) remains atop our leaderboard. Duke’s Carolinasand Florida utilities (DEC and DEF) are both forecast to be above theregional average in 2022.
SOUTHERN COMPANYMississippi Power serves the smallest customer base but exhibits thehighest solar ratio within Southern Company. The Georgia PublicService Commission has an opportunity with Georgia Power’s 2019Integrated Resource Plan (IRP) to ensure a legacy of solar leadership.Alabama Power is not yet demonstrating solar ambition comparable tothe rest of Southern Company.
FLORIDA POWER & LIGHTFPL recently announced the boldest 10-year solar commitment of anyutility in the country. This will more than double the annual pace of solarexpansion for the largest utility in the Southeast (4.9 million customers),FPL will exceed 3,500 MW of solar by 2022 (over 9,000 MW by 2029).
OGLETHORPE POWERThe increase in Oglethorpe’s solar ratio over the next two years islargely attributable to the Walton EMC projects for Facebook (3projects, 202.5 MW total).
TENNESSEE VALLEY AUTHORITYTVA is planning solar exclusively for large corporate customers ratherthan serving its public power obligation. Despite being home toprojects for Facebook and Google, TVA’s forecast is just 251 W/C by2022, well below the Southeast average.
These five utility systems serve 74% of retail customers in the Southeast.
* Note: Gulf Power remained a unit of the Southern Company through 2018. That ownership transfer to NextEra will be reflected in the next update. Blue and green shaded areas illustrate the subtle effect that transaction will have on the forecast for both entities.
-100
100
300
500
700
900
1,100
1,300
2010 2011 2012 2013 2014 2015 2016 2017 2018 2019 2020 2021 2022
Sola
r W
att
s p
er
Cu
sto
me
r (W
/C)
Duke Energy
Southern Company
Southeast Average
FPL (NextEra Energy)
Oglethorpe
TVA

8
Solar in the Southeast 2018 Annual Report
S O U T H E A S T S O L A R M O M E N T U M : S U N R I S E R SSUNRISERS :Walton EMC burst onto the SunRiser list by commissioning three major solar projects (202.5 MW total with two different developers) to serve a new Facebook datacenter in Georgia. The other new entrants on the list include FPL with plans to double its annual pace of solar expansion (~750 MW per year for the next decade) and Orlando Utilities Commission (OUC) as the anchor tenant in a 223.5 MW project FMPA commissioned for 12 Florida municipal utilities.Through fulfillment of their ambitious plans, SCE&G, DEP, TECO, and JEA continue to earn distinction as SunRisers.
UTILITY 2018 W/C 2022 W/CWALTONEMC 115 1,569
SCELECTRIC&GAS 512 1,706
DUKEENERGYPROGRESS 1,625 2,618
TAMPAELECTRIC 157 934
FLORIDAPOWER&LIGHT 167 734
ORLANDO(OUC) 168 713
JACKSONVILLE(JEA) 172 679
Minimum 100k customers
WALTON EMC
SC ELECTRIC& GAS
DUKE ENERGY
PROGRESS
TAMPA ELECTRIC
FLORIDA POWER & LIGHT
ORLANDO UTILITIES
COMMISSION
JACKSONVILLE ELECTRIC
AUTHORITY2 0 1 8 - 2 0 2 2
4 YEAR INCREASEWATTS / CUSTOMER
1,454
567
1,194 777
993
545 507
9
Solar in the Southeast 2018 Annual Report
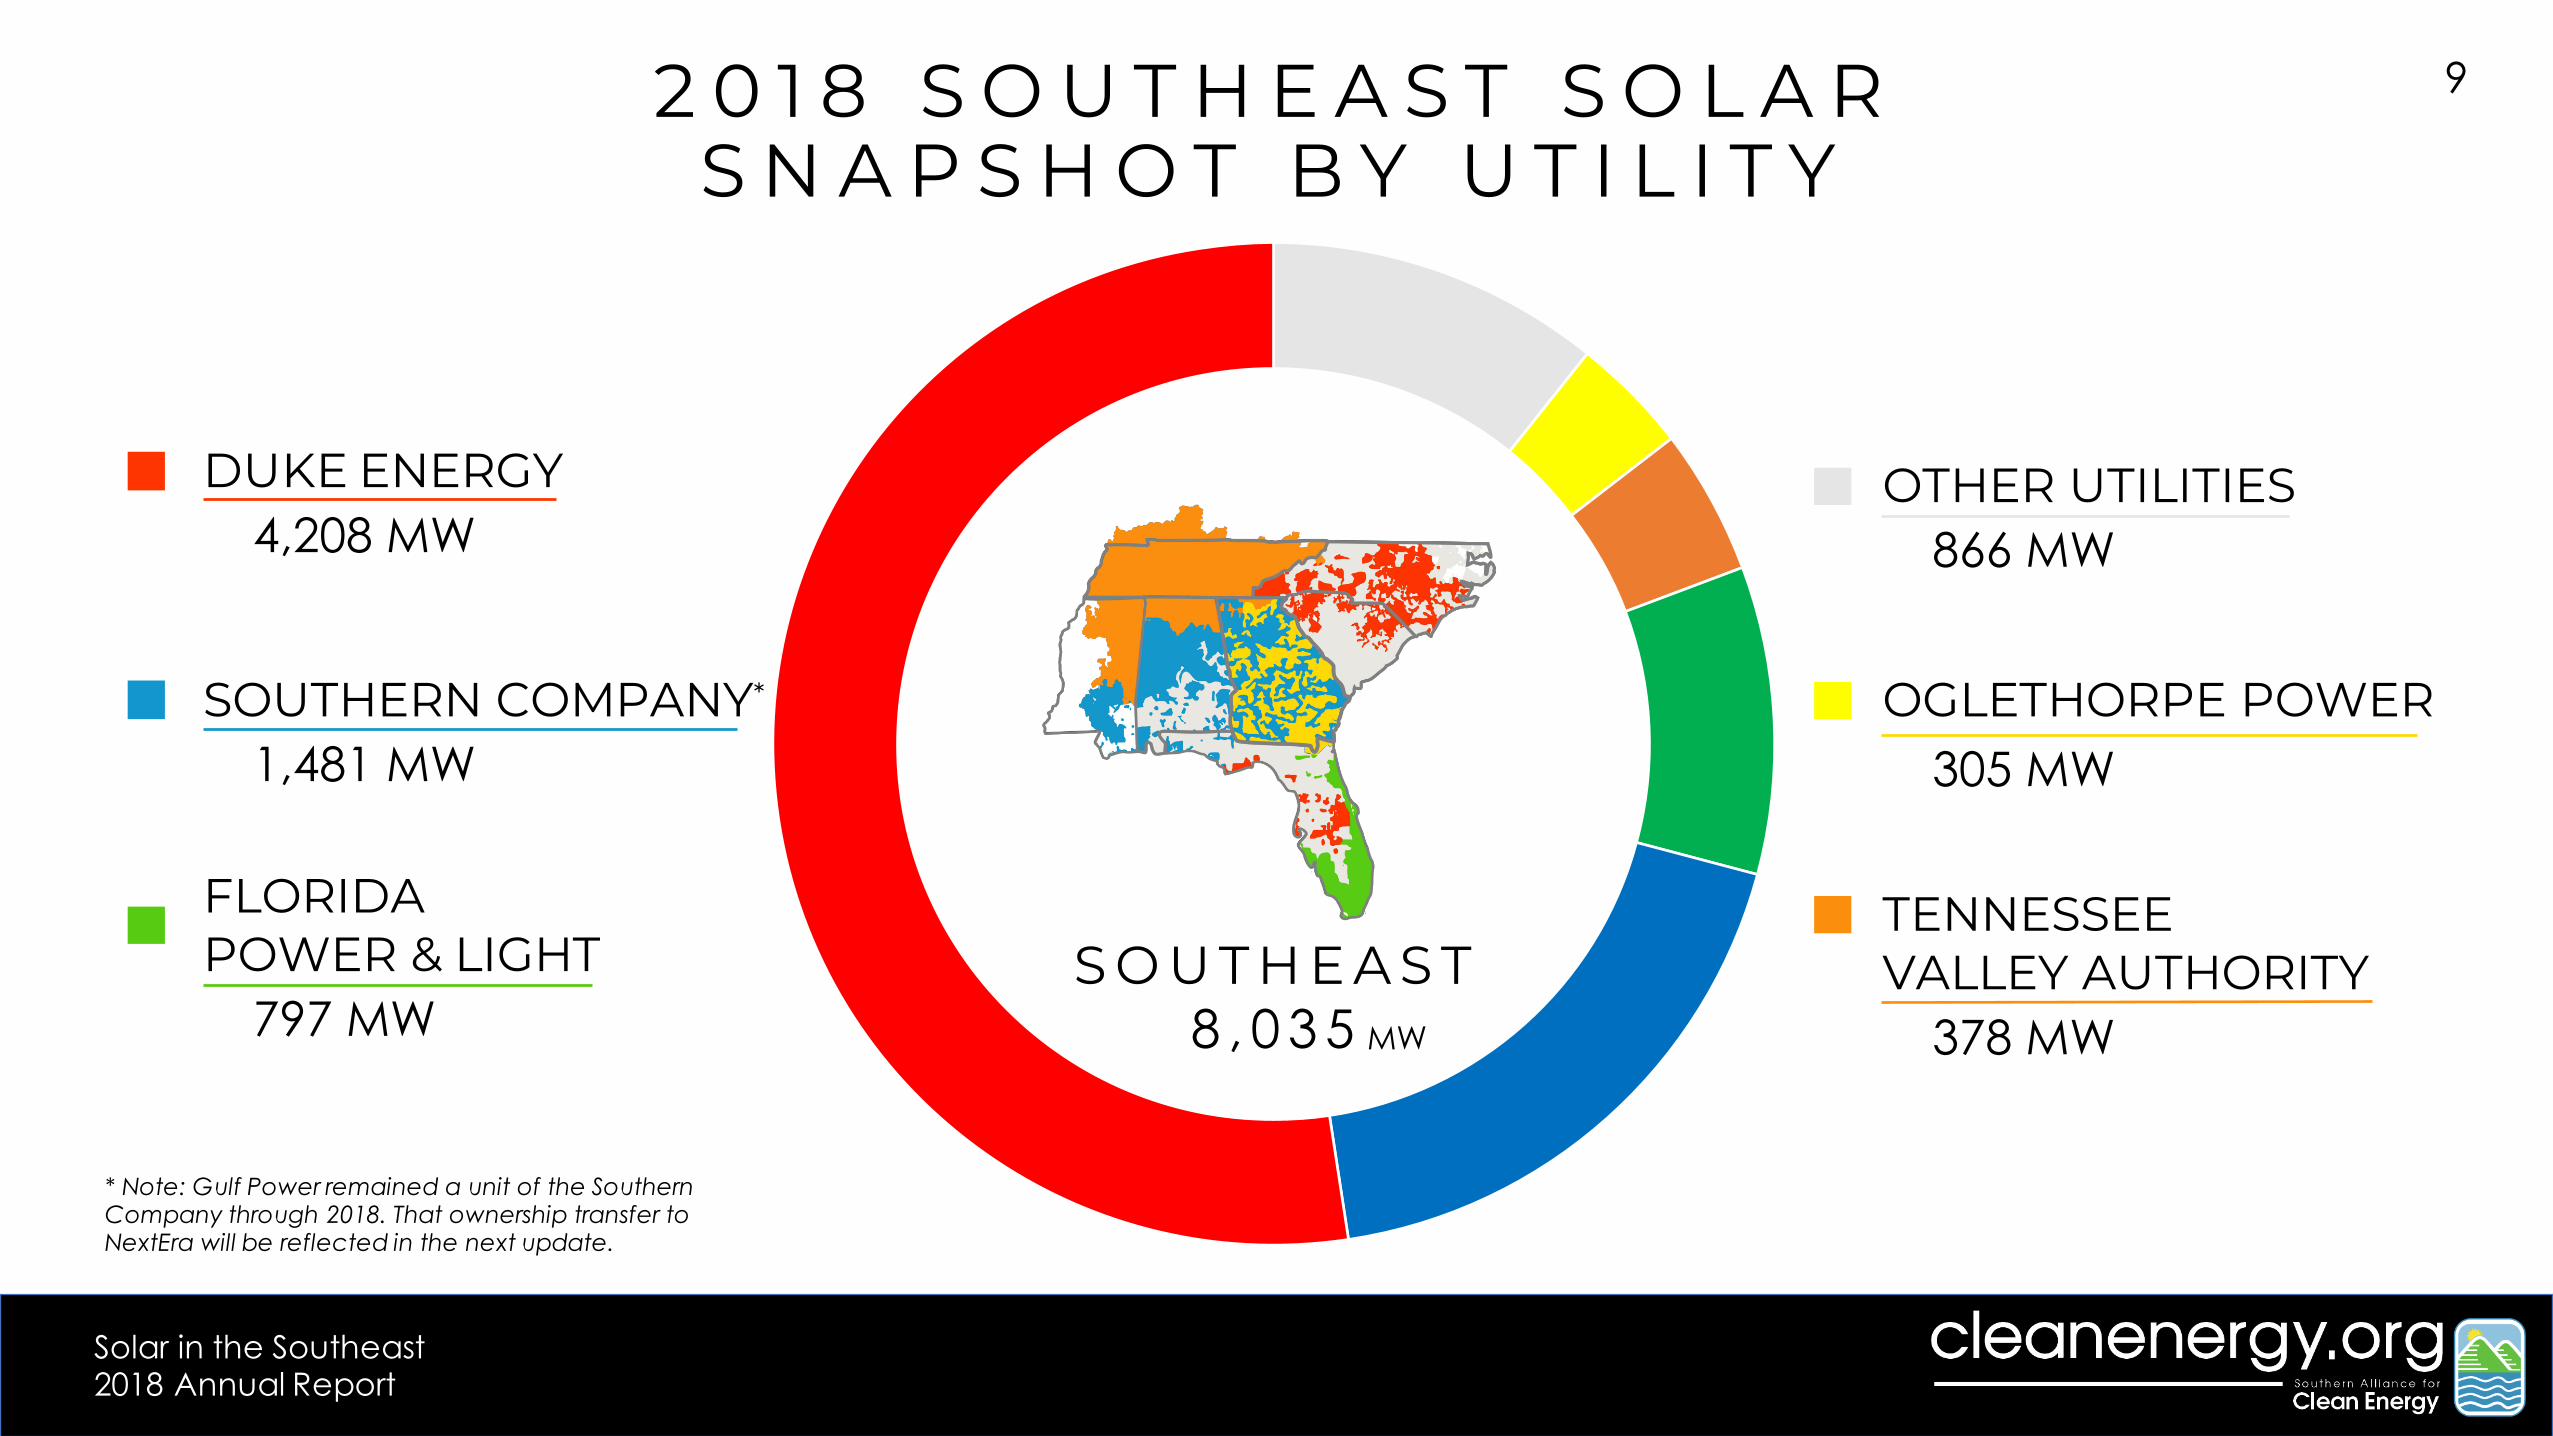
2 0 1 8 S O U T H E A S T S O L A R S N A P S H O T B Y U T I L I T Y
DUKE ENERGY
SOUTHERN COMPANY*
FLORIDAPOWER & LIGHT
4,208 MW
1,481 MW
797 MW
OTHER UTILITIES866 MW
S O U T H E A S T8 , 0 3 5
TENNESSEE VALLEY AUTHORITY
OGLETHORPE POWER
378 MW
305 MW
MW
* Note: Gulf Power remained a unit of the Southern Company through 2018. That ownership transfer to NextEra will be reflected in the next update.

10
Solar in the Southeast 2018 Annual Report
ALABAMA153 MW
2 0 1 8 S O U T H E A S T S O L A R S N A P S H O T B Y S T A T E
S O U T H E A S T8 , 0 3 5
NORTH CAROLINA
GEORGIA
FLORIDA
SOUTH CAROLINA
TENNESSEE
MISSISSIPPI
3,266 MW
1,419 MW
1,622 MW
1,116 MW
272 MW
187 MW
MW

11
Solar in the Southeast 2018 Annual Report
F O R E C A S T F O R S O U T H E A S T S T A T E S
North Carolina remains the southeast leader in solar capacity and among the highest in the country (currently number 2).1Florida utilities surpassed Georgia in installed capacity (MW) during 2018 and will outshine North Carolina within this forecast period (by 2022). The Georgia PSC has an opportunity to ensure a legacy of leadership by insisting on expansion of both utility-scale and distributed solar in Georgia Power’s 2019 IRP.
A comprehensive solar bill is currently pending in the South Carolina Senate (after passing unanimously in the House). Among other provisions, the Energy Freedom Act will extend net metering in the Palmetto State. Our forecast includes additional expansion of distributed solar in Florida, as well, with approval last year of solar leasing programs from major parties. Recent solar development in Alabama and Tennessee has been limited primarily to corporate purchases, rather than as an integrated resource serving all customers.1. Solar Energy Industries Association. (2019, March 21). Solar Spotlight: North Carolina.
Excludes PJM territory Excludes MISO territory
0
1,000
2,000
3,000
4,000
5,000
6,000
7,000
Inst
all
ed
an
d P
roje
cte
d C
ap
ac
ity
, M
W(a
c)
NORTH CAROLINA FLORIDA GEORGIA SOUTH CAROLINA ALABAMA TENNESSEE MISSISSIPPI
DISTRIBUTED SOLAR
UTILITY-SCALE SOLAR

12
Solar in the Southeast 2018 Annual Report
-
200
400
600
800
1,000
1,200
2011 2012 2013 2014 2015 2016 2017 2018 2019 2020 2021
Sola
r W
att
s p
er
Cu
sto
me
r (W
/C)
2022
N O R T H + S O U T H C A R O L I N A L E G I S L A T U R E S L E A D T H E W A Y
North Carolina’s solar markets continue to thrive because of the2017 Competitive Energy Solutions for North Carolina law (HB 589).That state will reach 6,000 MW by 2022.South Carolina’s Energy Freedom Act, presently pending in thestate Senate, is designed to sustain all segments of that vibrantsolar market.Florida is starting to live up to its moniker as the Sunshine State andwill surpass Georgia on watts per customer solar ratio by 2021.However, that will only only reflect parity with the region average.Tennessee, Alabama and Mississippi remain considerably off pacefrom the other states.
* This analysis excludes the portion of Kentucky served by TVA. Similarly, the PJM portion of North Carolina is excluded as is the MISO portion of Mississippi.
STATE 2017 W/C 2018 W/C 2022 W/C
NORTHCAROLINA 379 643 1,059
SOUTHCAROLINA 259 443 1,000
GEORGIA 235 280 527
SOUTHEAST 165 269 631
MISSISSIPPI 134 248 381
FLORIDA 78 157 626
TENNESSEE 51 81 240
ALABAMA 31 59 257
North Carolina
South Carolina
Southeast Average
Georgia
Florida
Mississippi
Alabama
Tennessee
2022 SOLAR GENERATIONNC ~7.2% of retail salesSC ~5.2% of retail sales

13
Solar in the Southeast 2018 Annual Report
S T A T E P R O F I L E S
A L A B A M A
F L O R I D A
G E O R G I A
M I S S I S S I P P I
N O R T H C A R O L I N A
S O U T H C A R O L I N A
T E N N E S S E E

14
Solar in the Southeast 2018 Annual Report
A L A B A M A
The anticipated expansion of solar for AlabamaPower through 2022 reflects authorization receivedfrom the Alabama Public Service Commission(APSC) in 2015 to develop or procure up to 500 MWof renewable energy. SACE has maintained thisprojection and expects to see it validated in thenext resource plan.PowerSouth has not, to SACE’s knowledge,engaged in any substantial solar development. Thesolar capacity attributed to PowerSouth is an artifactof allocating solar projects geographically when theutility buyer is unknown, along with small pockets ofdistributed generation solar.
L A R G E P R O J E C T S A N T I C I P A T E D I N N E X T F O U R Y E A R S
UTILITY 2018 2022SOUTHEAST AVERAGE 269 631
ALABAMA POWER 67 335TVA 83 263
STATE AVERAGE 59 257 POWERSOUTH 1.4 2.7
UTILITY 2018 2022ALABAMA POWER 4 8
TVA 14 26POWERSOUTH 0.5 1.0
UTILITY 2018 2022ALABAMA POWER 97 502
TVA 38 135POWERSOUTH 0 0
U TILITY -SCALE SOLAR, MW
DISTRIB U TED SOLAR, MW
SOLAR WATTS PER CUSTOMER
Alabama remains the southeastern state exhibiting thelowest solar watts per customer (W/C) ratio. 59 W/C is lessthan one-fourth of the regional average from 2018.Facebook and Google announced significant solarprojects with TVA (677 MW total) and 377 MW of thoseprojects will be located within Alabama. Due to thenature of the TVA system, the majority of its solar powerwill actually serve load in Tennessee rather thanAlabama.

15
Solar in the Southeast 2018 Annual Report
Florida utilities are on a path to grow from 1,622 MW to over 6,000 MW ofsolar by 2022. FPL recently announced a program that will double theannual pace of its solar expansion. SACE projects FPL to have 3,500 MW by2022, with a watts per customer (W/C) solar ratio considerably above theregional average and a 4-year increase that earns it SunRiser status.Florida is home to four designated SunRisers including Tampa Electricprojecting the highest W/C ratio for the state in 2022.
F L O R I D AB E C O M I N G T H E S U N S H I N E S T A T E
UTILITY 2018 2022
TAMPA ELECTRIC 157 934FLORIDA POWER & LIGHT 167 734
ORLANDO (OUC) 168 713 JACKSONVILLE (JEA) 172 679
DUKE ENERGY FLORIDA 188 676SOUTHEAST AVERAGE 269 631
STATE AVERAGE 157 626TALLAHASSEE 198 572GULF POWER 291 329
GAINESVILLE (GRU) 266 298LAKELAND 161 208 SEMINOLE 24 120
POWERSOUTH 21 64
U TI L I TY - S CA L ES O L A R, M W
UTILITY 2018 2022 2018 2022FLORIDA POWER & LIGHT 699 3,254 98 308
DUKE ENERGY FLORIDA 261 1,036 91 294
TAMPA ELECTRIC 95 623 21 99
JACKSONVILLE (JEA) 65 272 10 33
ORLANDO (OUC) 27 136 12 40
GULF POWER 120 120 9 27
TALLAHASSEE 20 60 3 10
SEMINOLE 2 42 15 49
LAKELAND 18 17 3 11
GAINESVILLE (GRU) 6 14 23 27
POWERSOUTH 0 0 2.5 8.0
SOLAR WATTS PER CUSTOMER
The pace of Distributed Solar will increase in part due to PublicService Commission approval of solar leasing designs from keycompanies: SunRun, Vivint and Tesla. Shared/community solaroptions are also likely to expand access to solar pending PSCapproval of petitions by Tampa Electric and FPL.
D I S TRI B U TEDS O L A R, M W

16
Solar in the Southeast 2018 Annual Report
Georgia’s 2018 watts per customer (W/C) solar ratio ishigher than the Southeast average – but will requireadditional ambition to avoid falling below average by2022.The Georgia Public Service Commission (PSC) has anopportunity to demand additional solar development inthe Georgia Power 2019 Integrated Resource Plan (IRP)and sustain Georgia’s solar leadership.
Georgia Power’s proposed 2019 IRP anticipates less solarthan approved in its 2016 IRP. Moreover, the plan isdesigned to offer that solar exclusively to corporatecustomers rather than as a truly integrated part of itsportfolio to serve customers.Oglethorpe’s increase is largely attributable to theWalton EMC projects for Facebook (3 projects, morethan 200 MW total) to serve a new Facebookdatacenter in Georgia. That project earned Walton EMCthe top rank on our SunRiser list – representing the highestincrease in W/C solar ratio over the next four years.
G E O R G I AO P P O R T U N I T Y T O S U S T A I N L E A D E R S H I P T R A J E C T O R Y
UTILITY 2018 2022
GEORGIA POWER 426 809SOUTHEAST AVERAGE 269 631
STATE AVERAGE 280 527OGLETHORPE 152 286
TVA 77 186 MEAG 13 17
UTILITY 2018 2022GEORGIA POWER 140 151
OGLETHORPE 15 21TVA 6 8
MEAG 4 6
UTILITY 2018 2022GEORGIA POWER 952 1,972
OGLETHORPE 291 595TVA 6 20
MEAG 0 0
U TILITY -SCALE SOLAR, MW
DISTRIB U TED SOLAR, MW
SOLAR WATTS PER CUSTOMER
17
Solar in the Southeast 2018 Annual Report
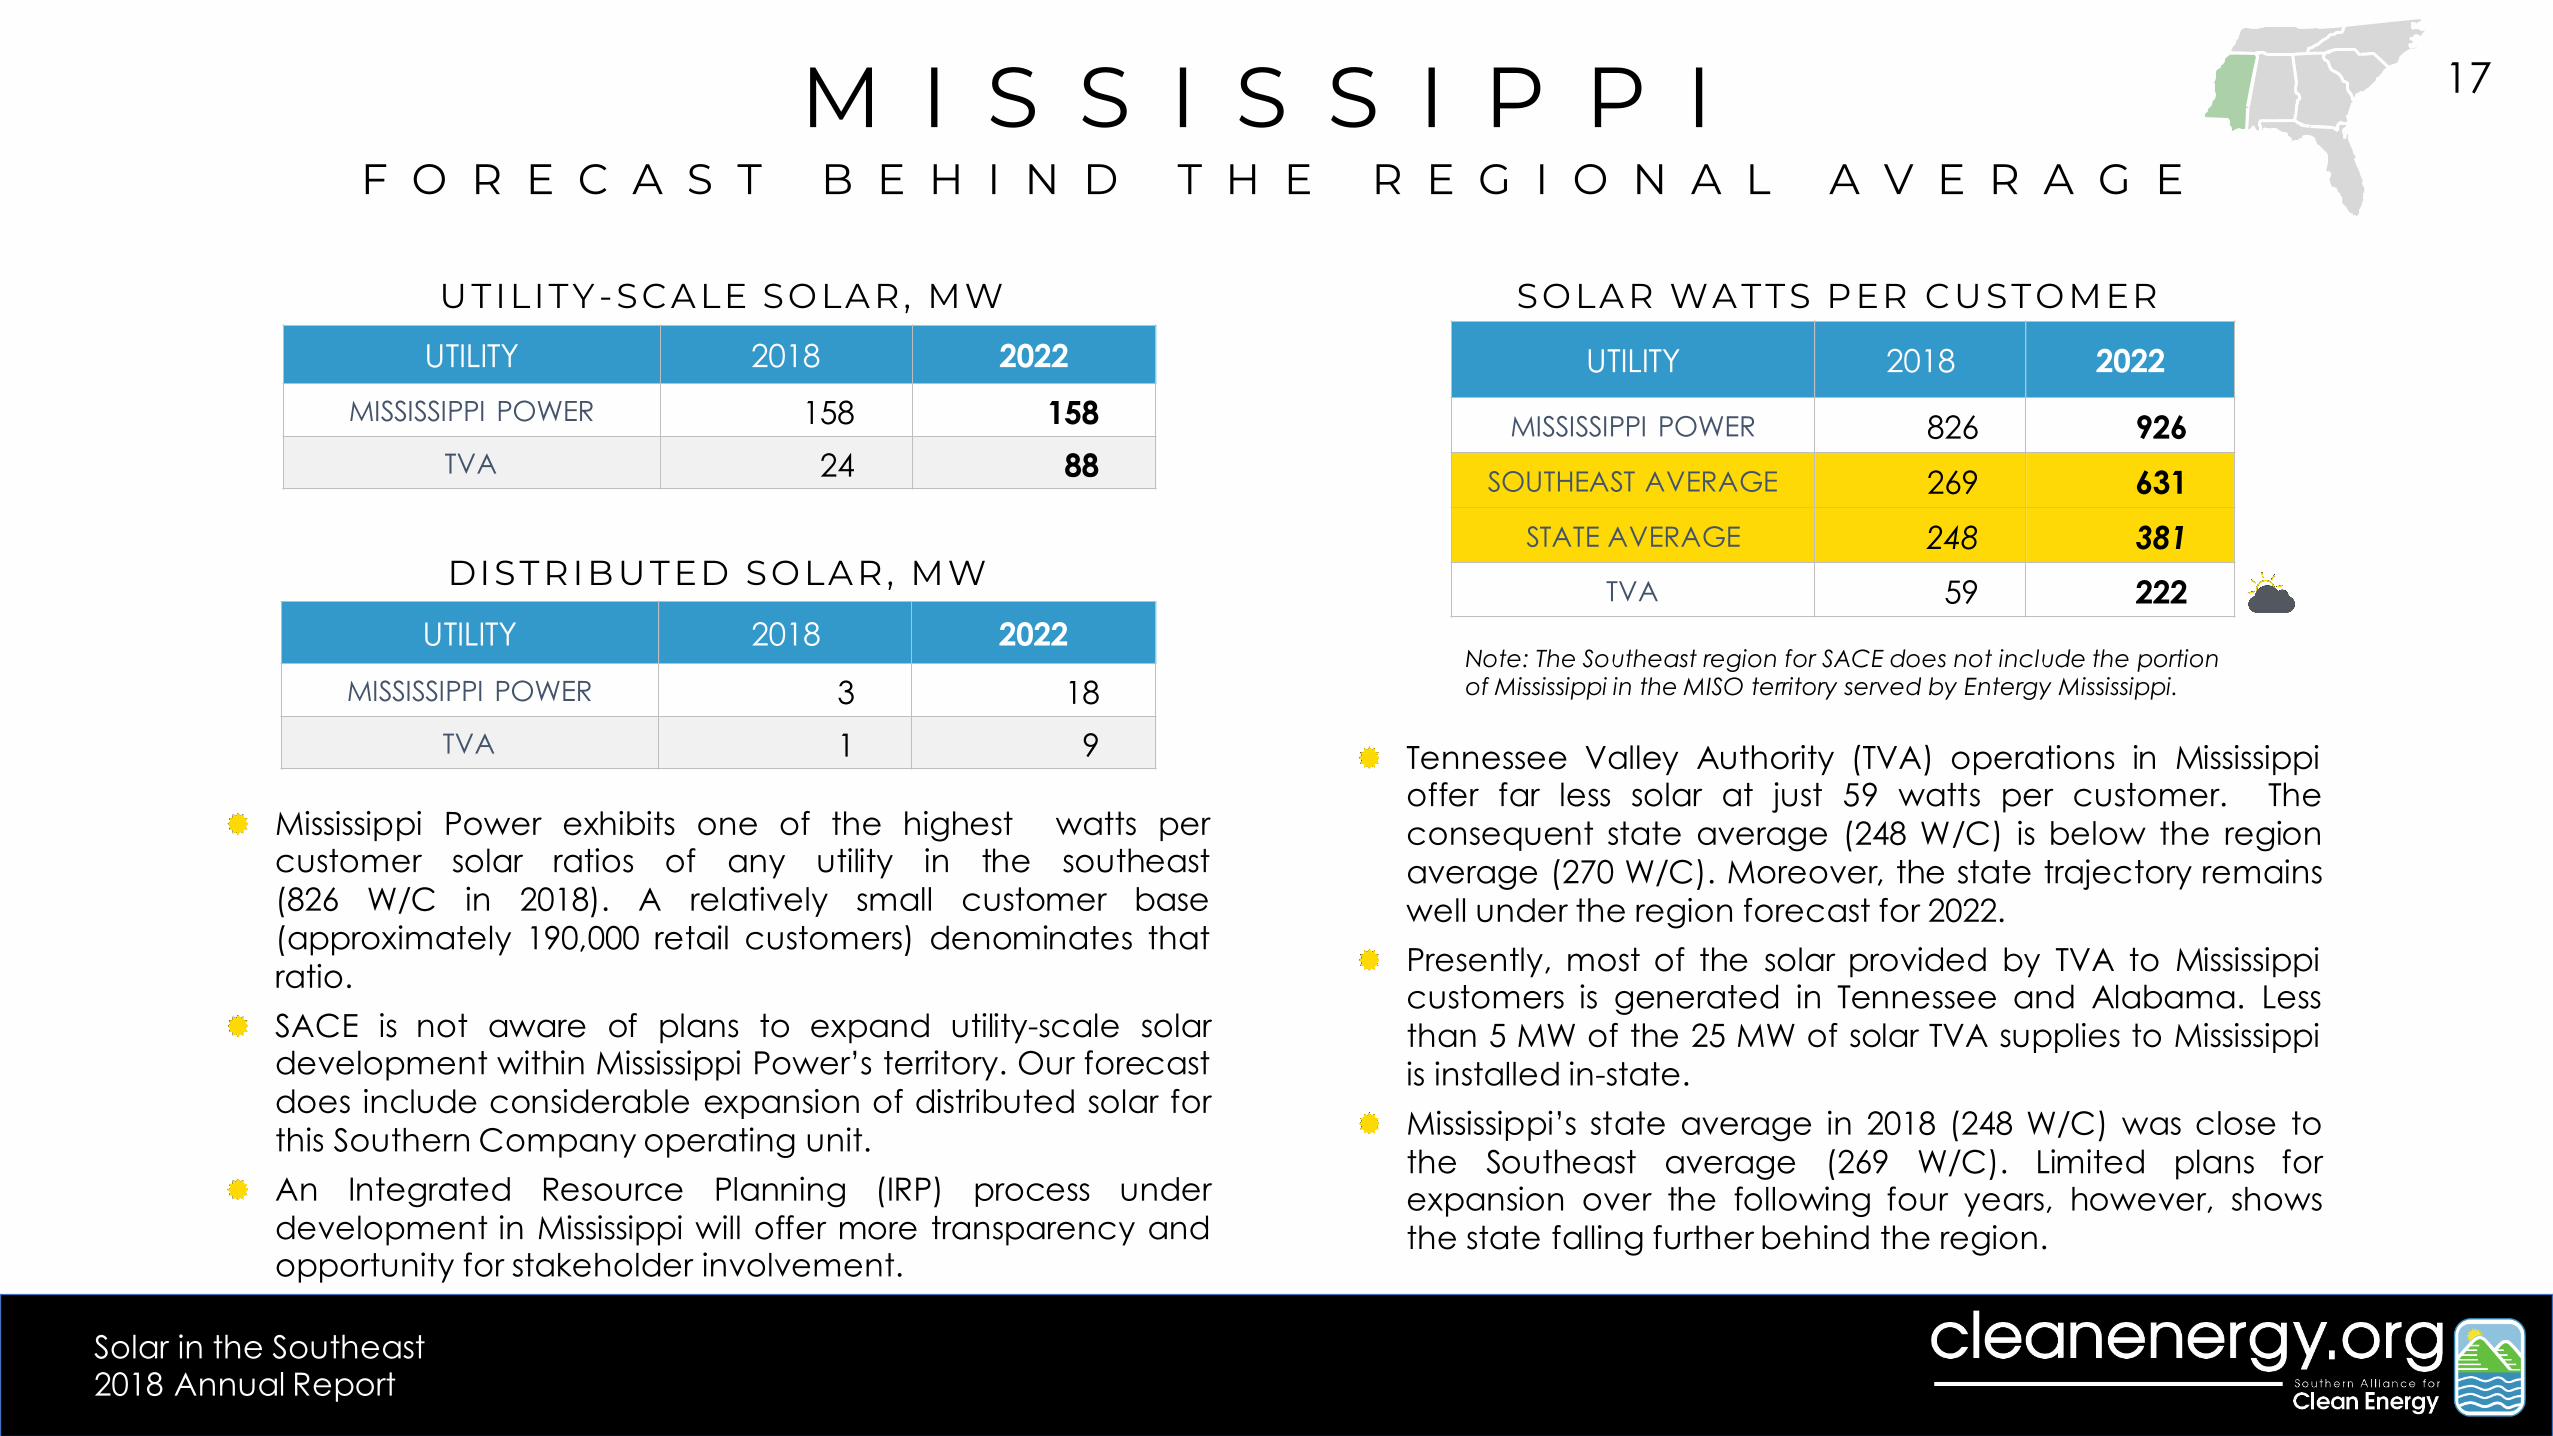
Mississippi Power exhibits one of the highest watts percustomer solar ratios of any utility in the southeast(826 W/C in 2018). A relatively small customer base(approximately 190,000 retail customers) denominates thatratio.SACE is not aware of plans to expand utility-scale solardevelopment within Mississippi Power’s territory. Our forecastdoes include considerable expansion of distributed solar forthis Southern Company operating unit.An Integrated Resource Planning (IRP) process underdevelopment in Mississippi will offer more transparency andopportunity for stakeholder involvement.
Tennessee Valley Authority (TVA) operations in Mississippioffer far less solar at just 59 watts per customer. Theconsequent state average (248 W/C) is below the regionaverage (270 W/C). Moreover, the state trajectory remainswell under the region forecast for 2022.Presently, most of the solar provided by TVA to Mississippicustomers is generated in Tennessee and Alabama. Lessthan 5 MW of the 25 MW of solar TVA supplies to Mississippiis installed in-state.Mississippi’s state average in 2018 (248 W/C) was close tothe Southeast average (269 W/C). Limited plans forexpansion over the following four years, however, showsthe state falling further behind the region.
M I S S I S S I P P IF O R E C A S T B E H I N D T H E R E G I O N A L A V E R A G E
UTILITY 2018 2022
MISSISSIPPI POWER 826 926SOUTHEAST AVERAGE 269 631
STATE AVERAGE 248 381TVA 59 222
Note: The Southeast region for SACE does not include the portion of Mississippi in the MISO territory served by Entergy Mississippi.
UTILITY 2018 2022MISSISSIPPI POWER 3 18
TVA 1 9
UTILITY 2018 2022MISSISSIPPI POWER 158 158
TVA 24 88
U TILITY -SCALE SOLAR, MW
DISTRIB U TED SOLAR, MW
SOLAR WATTS PER CUSTOMER

18
Solar in the Southeast 2018 Annual Report
N O R T H C A R O L I N A
North Carolina has the most solar PV capacity in the Southeast(and second-most in the United States).1 It is the only state in theSoutheast with a renewable portfolio standard, which initiated solardevelopment more than a decade ago.Favorable economics and a competitive bid process establishedby the North Carolina legislature2 combined to ensure the solargrowth in the state through 2022.
Duke Energy Progress demonstrates particular solar leadership.DEP consistently tops our ranking of largest utilities in theSoutheast. Despite having the highest base (from 2018), DEP stillqualifies as a SunRiser, among the highest increases over ourfour-year forecast period.In general, co-ops and munis have been slower to adopt solarthan investor-owned utilities. In this year’s report, we designateNC Electric Cooperatives as a SunBlocker – one of four largeutility systems forecast to have lower solar ratio in 2022 than thecurrent average for the region.Note: The Southeast region for SACE does not include the portion of
North Carolina in the PJM territory served by Dominion Energy.
S E T T I N G A G O O D E X A M P L E
UTILITY 2018 2022
DUKE ENERGY PROGRESS 1,561 2,516STATE AVERAGE 643 1,059
DUKE ENERGY CAROLINAS 481 856TVA 404 821
SOUTHEAST AVERAGE 269 631 NC EASTERN MUNICIPAL 256 262
NC ELECTRIC COOPERATIVES 45 71NC MUNICIPAL POWER 5 10
UTILITY 2018 2022 2018 2022DUKE ENERGY PROGRESS 2,072 3,304 75 140
DUKE ENERGY CAROLINAS 884 1,572 105 198NC EASTERN MUNICIPAL 63 63 1 3
NC ELECTRIC COOPERATIVES 31 43 17 33TVA 1 4 17 32
NC MUNICIPAL POWER 0 0 0.7 1.3
SOLAR WATTS PER CUSTOMERU TI L I TY - S CA L ES O L A R, M W
D I S TRI B U TEDS O L A R, M W
1. Solar Energy Industries Association. (2019, March 21). Solar Spotlight: North Carolina2. 2017 Competitive Energy Solutions for North Carolina law (HB 589).

19
Solar in the Southeast 2018 Annual Report
The watts per customer (W/C) solar ratios for Duke EnergyProgress (DEP) and Duke Energy Carolinas (DEC) are higher inSouth Carolina than its neighboring North Carolina utilities. DEPearned a return trip to SACE’s SunRiser list – showcasing theleadership of utilities with the highest forecast four-year increasein W/C solar ratio.SCE&G dramatically expanded its utility-scale solar capacity in2018 – joining DEP and DEC above the Southeast average solarratio in 2018 and with a four-year forecast that reinforced itsdesignation on SACE’s list of SunRisers.State-owned utility Santee Cooper serves approximately onemillion retail customers, yet fails to offer sufficient solar resourcesand remains on SACE’s list of SunBlockers for the second year.
South Carolina’s “Energy Freedom Act” (currently pending in thestate Senate, after passing the House unanimously) iscomprehensive solar legislation that will sustain this vibrantmarket. Targets set in South Carolina’s Act 236 from 2014 hadunderestimated the demand for solar in the state. Instead ofpropelling growth of the distributed solar market through 2021 asintended, investor-owned utilities began encountering statutorycaps three years early.
S O U T H C A R O L I N AS O L A R L E A D E R S H I P I N T H E P A L M E T T O S T A T E
UTILITY 2018 2022DUKE ENERGY PROGRESS 2,150 3,459
SCE&G 512 1,706DUKE ENERGY CAROLINAS 599 1,064
STATE AVERAGE 443 1,000 SOUTHEAST AVERAGE 269 631
SANTEE COOPER 22 42UTILITY 2018 2022SCE&G 110 230
DUKE ENERGY CAROLINAS 31 58
DUKE ENERGY PROGRESS 9 17
SANTEE COOPER 18 33
UTILITY 2018 2022SCE&G 263 1,058
DUKE ENERGY CAROLINAS 332 590DUKE ENERGY PROGRESS 350 557
SANTEE COOPER 4 8
U TILITY -SCALE SOLAR, MW
DISTRIB U TED SOLAR, MW
SOLAR WATTS PER CUSTOMER

20
Solar in the Southeast 2018 Annual Report
The Tennessee Valley Authority, TVA, is unlike most of the otherlarge utilities in the Southeast. They are a self-regulated monopolynot subject to federal or state regulatory oversight.TVA was an early leader in small-scale, distributed solar. Recently,however, it is aggressively using a self-regulated rate designprocess to undercut solar penetration and dis-incentivizedistributed solar throughout the Valley.Instead of “net metering” – a billing practice to support customer-owned solar that exists in 38 states1 – TVA implemented a “dualmeter” scheme where it buys all the power owners generate on-site, and requires those same customers to buy all the power theyconsume from the local power company (LPC) at retail rates.After decreasing the rate it pays for solar power produced bythese customer-generators in 2018, TVA has since announced it willsunset this Green Power Providers program at the end of 2019 withno current plan to replace it, further slowing solar developmentand planning ability.
The 6 largest Local Power Companies (LPCs) in Tennessee are included above.
TVA’s has released a draft Integrated Resource Plan (IRP).Unfortunately this plan continues to reflect limited solarambition throughout SACE’s four-year forecast period.Facebook and Google announced significant solarprojects with TVA (677 MW total) and 300 MW of thoseprojects will be located in Tennessee. This reflectsleadership by those corporations rather than signifyingevolved thinking by TVA management.
Kingsport, TN (served by AEP Appalachian Power) is not included in the Southeast region.
T E N N E S S E EF A L L I N G F U R T H E R B E H I N D U N D E R T V A L E A D E R S H I P
UTILITY 2018 2022
SOUTHEAST AVERAGE 269 631 MEMPHIS (MLGW) 84 251
CHATTANOOGA (EPB) 84 250 TVA (TN) AVERAGE 81 240
NASHVILLE (NES) 80 235MIDDLE TENNESSEE (EMC) 76 218
KNOXVILLE (KUB) 74 215VOLUNTEER ELECTRIC CO-OP 64 175
UTILITY 2018 2022TVA 171 616
U TILITY -SCALE SOLAR, MW
DISTRIB U TED SOLAR, MWUTILITY 2018 2022
TVA 101 185
SOLAR WATTS PER CUSTOMER

21
Solar in the Southeast 2018 Annual Report
D A T A S O U R C E S , M E T H O D S & A S S U M P T I O N S
Compiling data from publicly-available reports as well as proprietaryforecasts, SACE has curated a system of information about electricpower generation in the southeast United States. For the Solar in theSoutheast Annual Report, primary datasets derive from the EnergyInformation Administration (EIA) and the Federal Energy RegulatoryCommission – particularly, EIA 860 (Annual Electric Generator Data),EIA 861 (Annual Electric Power Industry Report), EIA 923 (AnnualElectric Utility Data) and FERC 714 (Annual Electric BalancingAuthority Area and Planning Area Report).Future projections are informed by additional datasets includingWood Mackenzie Power & Renewables (formerly GTM Research),the EIA Annual Energy Outlook, utility Integrated Resource Plans(IRPs), interconnection queues, identified projects as well as utilityannouncements of ongoing and future plans, along with informationgathered from solar developers and professional judgement of staffexperts.Solar data are reported as MW(ac) – alternating current. Whereapplicable, data identifiable as MW(dc) is derated to MW(ac)equivalent. AC reporting is becoming increasingly more common,particularly for utility-scale solar projects.
SACE tracks both capacity as well as generation, MW(ac) and MWh,respectively. Consequently, the capacity of solar projects thatbegin operation late in the year are only partially attributable in thefirst year. Tracking solar data in this manner enables a correlationbetween capacity and generation statistics.
In some cases, the utility that receives the generation from plannedor existing solar projects is not known. In such cases, the capacityand generation is allocated to utilities based on proximity and thedegree to which utilities needs are met by generation owned orcontracted for. The amount of solar capacity allocated to utilities inthis manner is a small fraction of all Southeastern generation, but itcan make up a substantial portion of the solar generation reportedfor utilities with small solar portfolios.SACE projects distributed generation solar (e.g., residential andcommercial rooftop solar) independently for large utility systems.Smaller municipal and cooperative systems are projected at anaggregate level based on the averages for those systems.State-level reports are aggregated using two, complementarymethods. Total solar capacity (MW) is reported in the state wherethe generation originates. Watts per customer calculations areallocated to the state where the load is served. SACE apportionsutility-scale solar generation to loads served across multi-state utilityservice territories. Smaller, distributed generation systems areassumed to serve their local load. This method establishes a closerelationship with the retail sales and customers served by therespective utilities. For example, a solar project in Alabamacontracted to the Tennessee Valley Authority (TVA) willproportionally serve customers in multiple states across TVA serviceterritory.
Southern Alliance for Clean EnergyP.O. Box 1842 | Knoxville, TN 37901 | 865.637.6055
SOLAR IN THE SOUTHEAST2018 Annual Report
BRYAN JACOBSolar Program [email protected]
JOHN D. WILSONDeputy Director for Regulatory [email protected]
C O N T A C T I N F O R M A T I O N
22
@c le an e n e rgyo rg

23
Solar in the Southeast 2018 Annual Report
A P P E N D I X A : S E R V I C E T E R R I T O R I E S O F F I V E S O U T H E A S T U T I L I T Y S Y S T E M S
S OU T H E R N COMP A N Y *
T E N N E S S E E V A LLE Y A U T H OR I T Y
D U K E E N E R GY COMP A N Y
F LOR I D A P OW E R & L I GH T
OGLE T H OR P E P OW E R COR P OR A T I ON
OT H E R S OU T H E A S T E R N U T I L I T I E S
N ON - S OU T H E A S T E R N BA LA N CI N G A R E A S
UTILITY SERVICE TERRITORIES
* Note: Gulf Power remained a unit of the Southern Company through 2018. That ownership transfer to NextEra will be reflected in the next update.

24
Solar in the Southeast 2018 Annual Report
A P P E N D I X B : S O U T H E A S T U T I L I T Y R A N K I N GTotal Solar (W/C) Utility-Scale Solar (W/C) Distributed Solar (W/C)
UTILITY Customers (2017) 2017 2018 2022 2017 2018 2022 2017 2018 2022All SEUtility Systems 29,735,793 165 269 631 141 236 560 23 33 71 AlabamaCooperatives 35,964 - 1 3 - - - - 1 3 BlackWarriorElectricMemberCorp 26,623 - 1 3 - - - - 1 3 TombigbeeElectricCooperative 9,341 - 1 3 - - - - 1 3 AlabamaMunicipals 70,205 - 0 0 - - - - 0 0 CityofAlexanderCity 6,144 - 0 0 - - - - 0 0 CityofDothan 30,581 - 0 0 - - - - 0 0 CityofOpelika 12,603 - 0 0 - - - - 0 0 SylacaugaUtilitiesBoard 6,144 - 0 0 - - - - 0 0 TroyUtilitiesDepartment 8,095 - 0 0 - - - - 0 0 CityofTuskegee 6,638 - 0 0 - - - - 0 0 DukeEnergy 5,891,193 404 692 1,257 371 641 1,143 33 51 115 DukeEnergyProgress 1,558,749 809 1,625 2,618 778 1,570 2,516 31 54 102 DukeEnergyCarolinas 2,557,117 407 508 903 372 457 808 35 51 96 DukeEnergyFlorida 1,775,327 45 188 676 12 139 527 33 48 150 FloridaCooperatives 1,025,456 16 24 163 1 3 98 15 21 65 CentralFlorida ElectricCooperative 33,538 11 23 109 - 2 44 11 21 64 ClayElectricCooperative 173,804 22 24 121 - 3 56 22 21 64 Florida KeysElectricCooperativeAssociation 32,792 12 21 211 - - 147 12 21 64 GladesElectricCooperative 16,370 11 24 125 - 3 60 11 21 64 LeeCounty ElectricCooperative 213,636 12 21 65 - - 1 12 21 64 PeaceRiverElectricCooperative 41,123 33 24 119 - 3 55 33 21 64 ReedyCreekImprovementDist 1,447 691 799 36,405 691 746 36,296 - 52 109 SumterElectricCooperative 200,526 10 24 113 - 3 49 10 21 64 SuwanneeValleyElectricCooperative 25,932 11 24 126 - 3 61 11 21 64 Talquin ElectricCooperative 53,832 13 24 118 - 3 54 13 21 64 Tri-County ElectricCooperative 18,212 6 24 116 - 3 52 6 21 64 WithlacoocheeRiverElectricCooperative 214,244 17 24 119 - 3 54 17 21 64

25
Solar in the Southeast 2018 Annual Report
A P P E N D I X B : S O U T H E A S T U T I L I T Y R A N K I N GTotal Solar (W/C) Utility-Scale Solar (W/C) Distributed Solar (W/C)
UTILITY Customers (2017) 2017 2018 2022 2017 2018 2022 2017 2018 2022FloridaMunicipals 1,445,737 71 140 509 37 97 402 34 44 107 CityofAlachua 4,506 209 291 2,102 58 238 1,993 151 52 109 CityofBartow 12,266 106 58 1,121 1 6 1,012 105 52 109 CityofClewiston 4,100 1 59 113 1 7 4 - 52 109 FortPierceUtilitiesAuthority 28,257 4 57 217 1 5 108 2 52 109 Gainesville RegionalUtilities 97,245 270 266 298 32 46 38 238 219 260 CityofGreenCoveSprings 4,192 28 60 113 2 8 4 26 52 109 HavanaPower&LightCompany 1,458 275 56 111 1 4 2 274 52 109 CityofHomestead 24,402 8 58 498 1 6 389 7 52 109 BeachesEnergyServices 34,795 19 58 409 1 5 300 17 52 109 JEA 464,116 53 172 672 36 148 598 16 24 74 CityofKeyWest 29,859 11 59 113 1 6 4 9 52 109 KissimmeeUtilityAuthority 71,770 11 54 503 0 2 394 11 52 109 CityofLakeWorth 27,105 1 56 458 1 4 349 - 52 109 CityofLakeland 129,112 110 161 208 101 138 126 9 23 82 CityofLeesburg 25,821 14 57 112 1 5 3 13 52 109 CityofNewSmyrnaBeach 27,644 8 56 111 1 4 2 7 52 109 CityofOcala 52,953 22 59 290 1 6 181 20 52 109 OrlandoUtilitiesCommission 237,158 76 168 713 40 115 550 36 53 163 CityofStarke 2,801 16 59 113 1 6 4 15 52 109 CityofTallahassee 115,556 100 198 572 88 172 491 11 25 82 CityofVeroBeach 35,560 11 52 110 - - 1 11 52 109 CityofWauchula 2,802 - - 1,751 - - 1,751 - - - CityofWinterPark 15,061 36 60 737 2 7 628 34 52 109 FloridaPower&Light 4,901,846 105 167 734 91 147 670 14 21 63 FloridaPublicUtilities Company 32,038 21 30 94 - - - 21 30 94

26
Solar in the Southeast 2018 Annual Report
Total Solar (W/C) Utility-Scale Solar (W/C) Distributed Solar (W/C)UTILITY Customers (2017) 2017 2018 2022 2017 2018 2022 2017 2018 2022GeorgiaMunicipals 289,230 32 32 36 21 19 19 12 13 17 CityofAdel 2,628 - 13 17 - - - - 13 17 AlbanyWaterGas&LightCommission 37,083 - 13 17 - - - - 13 17 CityofAcworth 6,520 4 13 17 - - - 4 13 17 CityofBuford 3,465 - 13 17 - - - - 13 17 CityofCairo 4,461 - 13 17 - - - - 13 17 CityofCalhoun 5,368 6 13 17 - - - 6 13 17 CityofCamilla 2,576 - 13 17 - - - - 13 17 CityofCartersville 7,508 240 13 17 - - - 240 13 17 CityofCollegePark 7,571 - 13 17 - - - - 13 17 CityofCovington 11,773 - 13 17 - - - - 13 17 Crisp County PowerCommission 11,948 3 13 17 - - - 3 13 17 DaltonUtilities 16,802 411 391 386 357 377 369 54 13 17 CityofDouglas 5,868 - 13 17 - - - - 13 17 CityofEastPoint 15,682 - 13 17 - - - - 13 17 CityofElberton 4,395 - 13 17 - - - - 13 17 FitzgeraldWaterLight&BondCommission 5,641 - 13 17 - - - - 13 17 FortValleyUtilityCommission 4,623 - 13 17 - - - - 13 17 CityofGriffin 15,019 - 13 17 - - - - 13 17 CityofLaGrange 13,145 - 13 17 - - - - 13 17 CityofLawrenceville 11,259 - 13 17 - - - - 13 17 CityofMarietta 41,413 13 13 17 - - - 13 13 17 CityofMonroe 6,286 - 13 17 - - - - 13 17 CityofMoultrie 6,627 - 13 17 - - - - 13 17 NewnanWaterSewer&LightCommission 10,023 - 13 17 - - - - 13 17 CityofNorcross 5,076 - 13 17 - - - - 13 17 CityofSylvania 2,515 - 13 17 - - - - 13 17 CityofThomaston 5,974 - 13 17 - - - - 13 17 CityofThomasville 15,620 2 13 17 - - - 2 13 17 CityofWashington 2,361 - 13 17 - - - - 13 17
A P P E N D I X B : S O U T H E A S T U T I L I T Y R A N K I N G

27
Solar in the Southeast 2018 Annual Report
Total Solar (W/C) Utility-Scale Solar (W/C) Distributed Solar (W/C)UTILITY Customers (2017) 2017 2018 2022 2017 2018 2022 2017 2018 2022MississippiCooperatives 116,444 10 13 95 - - - 10 13 95 PearlRiverValleyElectricPowerAssociation 49,167 16 13 95 - - - 16 13 95 Southern PineElectricPowerAssociation 67,277 6 13 95 - - - 6 13 95 NorthCarolinaCooperatives 1,048,712 29 45 71 16 29 40 13 16 31 AlbemarleElectricMemberCorp 12,818 11 32 52 7 16 21 3 16 31 BlueRidgeElectricMemberCorp 75,859 23 29 51 6 13 20 17 16 31 CapeHatterasElectricMemberCorp 7,731 12 32 55 7 16 24 5 16 31 Carteret-CravenElectricMemberCorp 40,110 6 30 51 6 14 21 - 16 31 CentralElectricMembership Corp 22,619 8 33 56 8 17 26 - 16 31 Edgecombe-MartinCountyElectricMemberCorp 11,305 9 34 59 9 18 28 - 16 31 FourCounty ElectricMemberCorp 33,091 15 42 69 12 26 39 3 16 31 FrenchBroadElectricMemberCorp 36,970 28 29 50 6 13 20 22 16 31 HalifaxElectricMemberCorp 11,736 14 244 481 6 228 451 9 16 31 HaywoodElectricMemberCorp 26,701 17 26 46 5 10 15 13 16 31 Jones-Onslow ElectricMemberCorp 74,639 11 31 53 7 15 23 4 16 31 LumbeeRiverElectricMemberCorp 60,825 20 35 60 9 20 30 11 16 31 PeeDeeElectricMemberCorp 21,037 22 33 57 8 17 26 14 16 31 Pitt&GreeneElectricMemberCorp 8,719 10 37 62 10 21 31 - 16 31 Piedmont ElectricMemberCorp 31,663 67 30 52 6 14 21 60 16 31 Randolph ElectricMemberCorp 31,845 42 31 53 7 15 22 36 16 31 RoanokeElectricMemberCorp 14,294 8 34 58 8 18 27 - 16 31 RutherfordElectricMemberCorp 69,490 17 32 56 8 17 25 9 16 31 SouthRiverElectricMemberCorp 44,258 17 33 57 8 17 26 9 16 31 Surry-Yadkin ElectricMemberCorp 27,017 17 29 50 6 13 19 11 16 31 Tri-County ElectricMemberCorp 24,886 250 320 346 250 304 315 - 16 31 Tideland ElectricMemberCorp 22,899 7 31 53 7 15 22 - 16 31 Union ElectricMembershipCorp 75,609 34 32 55 7 16 24 27 16 31 WakeElectricMembership Corp 43,323 17 32 55 7 16 24 9 16 31 EnergyUnited ElectricMemberCorp 128,256 17 27 47 4 11 17 13 16 31 BrunswickElectricMemberCorp 91,012 20 30 52 6 14 21 13 16 31
A P P E N D I X B : S O U T H E A S T U T I L I T Y R A N K I N G

28
Solar in the Southeast 2018 Annual Report
Total Solar (W/C) Utility-Scale Solar (W/C) Distributed Solar (W/C)UTILITY Customers (2017) 2017 2018 2022 2017 2018 2022 2017 2018 2022NorthCarolinaMunicipals 539,850 67 122 127 63 116 116 4 5 10 CityofAlbemarle 12,124 - 5 10 - - - - 5 10 TownofApex 18,403 63 135 141 57 130 131 6 5 10 TownofAyden 4,071 83 195 201 83 190 191 - 5 10 TownofClayton 6,448 55 131 137 55 126 127 - 5 10 CityofConcord 30,131 - 5 10 - - - - 5 10 CityofElizabethCity 12,603 81 190 196 81 185 186 - 5 10 CityofFayettevillePublicWorks Commission 81,831 - 5 10 - - - - 5 10 TownofForestCity 4,189 - 5 10 - - - - 5 10 TownofEdenton 4,133 79 185 191 79 180 181 - 5 10 CityofGastonia 27,577 34 5 10 - - - 34 5 10 GreenvilleUtilitiesCommission 66,501 87 200 206 86 195 196 1 5 10 TownofHighPoint 42,244 2 5 10 - - - 2 5 10 TownofHuntersville 5,674 - 5 10 - - - - 5 10 CityofKingsMountain 4,886 - 5 10 - - - - 5 10 CityofKinston 11,604 129 300 306 129 294 296 - 5 10 CityofLaurinburg 5,611 81 190 196 81 185 186 - 5 10 CityofLexington 18,692 4 5 10 - - - 4 5 10 CityofLumberton 11,560 80 187 193 80 181 182 - 5 10 CityofMonroe 10,879 - 5 10 - - - - 5 10 CityofMorganton 8,326 96 5 10 - - - 96 5 10 CityofNewBern 22,519 65 154 160 65 149 150 - 5 10 NewRiverLight&Power 8,116 - 5 10 - - - - 5 10 CityofNewton 4,542 - 5 10 - - - - 5 10 TownofPineville 3,409 - 5 10 - - - - 5 10 CityofRockyMount 27,831 82 193 199 82 188 189 - 5 10
A P P E N D I X B : S O U T H E A S T U T I L I T Y R A N K I N G

29
Solar in the Southeast 2018 Annual Report Continuedonnextpage
Total Solar (W/C) Utility-Scale Solar (W/C) Distributed Solar (W/C)UTILITY Customers (2017) 2017 2018 2022 2017 2018 2022 2017 2018 2022
North Carolina Municipals (continued)
CityofShelby 8,251 - 5 10 - - - - 5 10 TownofSmithfield 4,466 126 292 298 126 286 288 - 5 10 CityofStatesville 13,381 16 5 10 - - - 16 5 10 TownofTarboro 5,776 133 308 314 133 302 304 - 5 10 TownofWakeForest 6,083 86 202 208 86 196 198 - 5 10 CityofWashington 13,752 68 159 165 68 154 155 - 5 10 CityofWilson 34,237 117 273 279 117 267 269 - 5 10 OglethorpePower 1,900,723 124 152 286 118 144 276 6 7 10 AltamahaElectricMemberCorp 20,630 41 76 123 40 69 114 0 7 10 Amicalola ElectricMemberCorp 48,382 39 61 98 31 54 88 8 7 10 Canoochee ElectricMemberCorp 21,447 45 77 125 41 70 115 4 7 10 CarrollElectricMemberCorp 50,774 45 82 132 43 74 122 2 7 10 CentralGeorgiaElectricMemberCorp 56,234 47 84 135 44 76 126 3 7 10 CoastalElectricMemberCorp 18,771 56 101 164 55 94 154 1 7 10 Cobb ElectricMembership Corp 206,122 587 588 591 582 581 581 5 7 10 Coweta-FayetteElectricMemberCorp 79,382 42 77 124 41 70 115 2 7 10 ExcelsiorElectricMemberCorp 22,900 39 68 110 35 61 100 3 7 10 FlintElectricMembership Corp 85,299 244 268 304 241 261 294 3 7 10 GreyStone PowerCorporation 130,295 40 76 123 39 69 113 1 7 10 GradyElectricMembership Corp 19,767 36 63 100 32 55 91 3 7 10 HabershamElectricMembership Corp 34,504 39 59 94 30 51 84 9 7 10 HartElectricMemberCorp 36,002 39 64 103 33 57 93 6 7 10 IrwinElectricMembership Corp 12,413 43 65 104 34 58 95 9 7 10 Jackson ElectricMemberCorp 225,087 16 38 58 5 31 49 11 7 10 Jefferson ElectricMemberCorp 34,114 35 67 108 35 60 98 0 7 10
A P P E N D I X B : S O U T H E A S T U T I L I T Y R A N K I N G
30
Solar in the Southeast 2018 Annual Report Continuedonnextpage
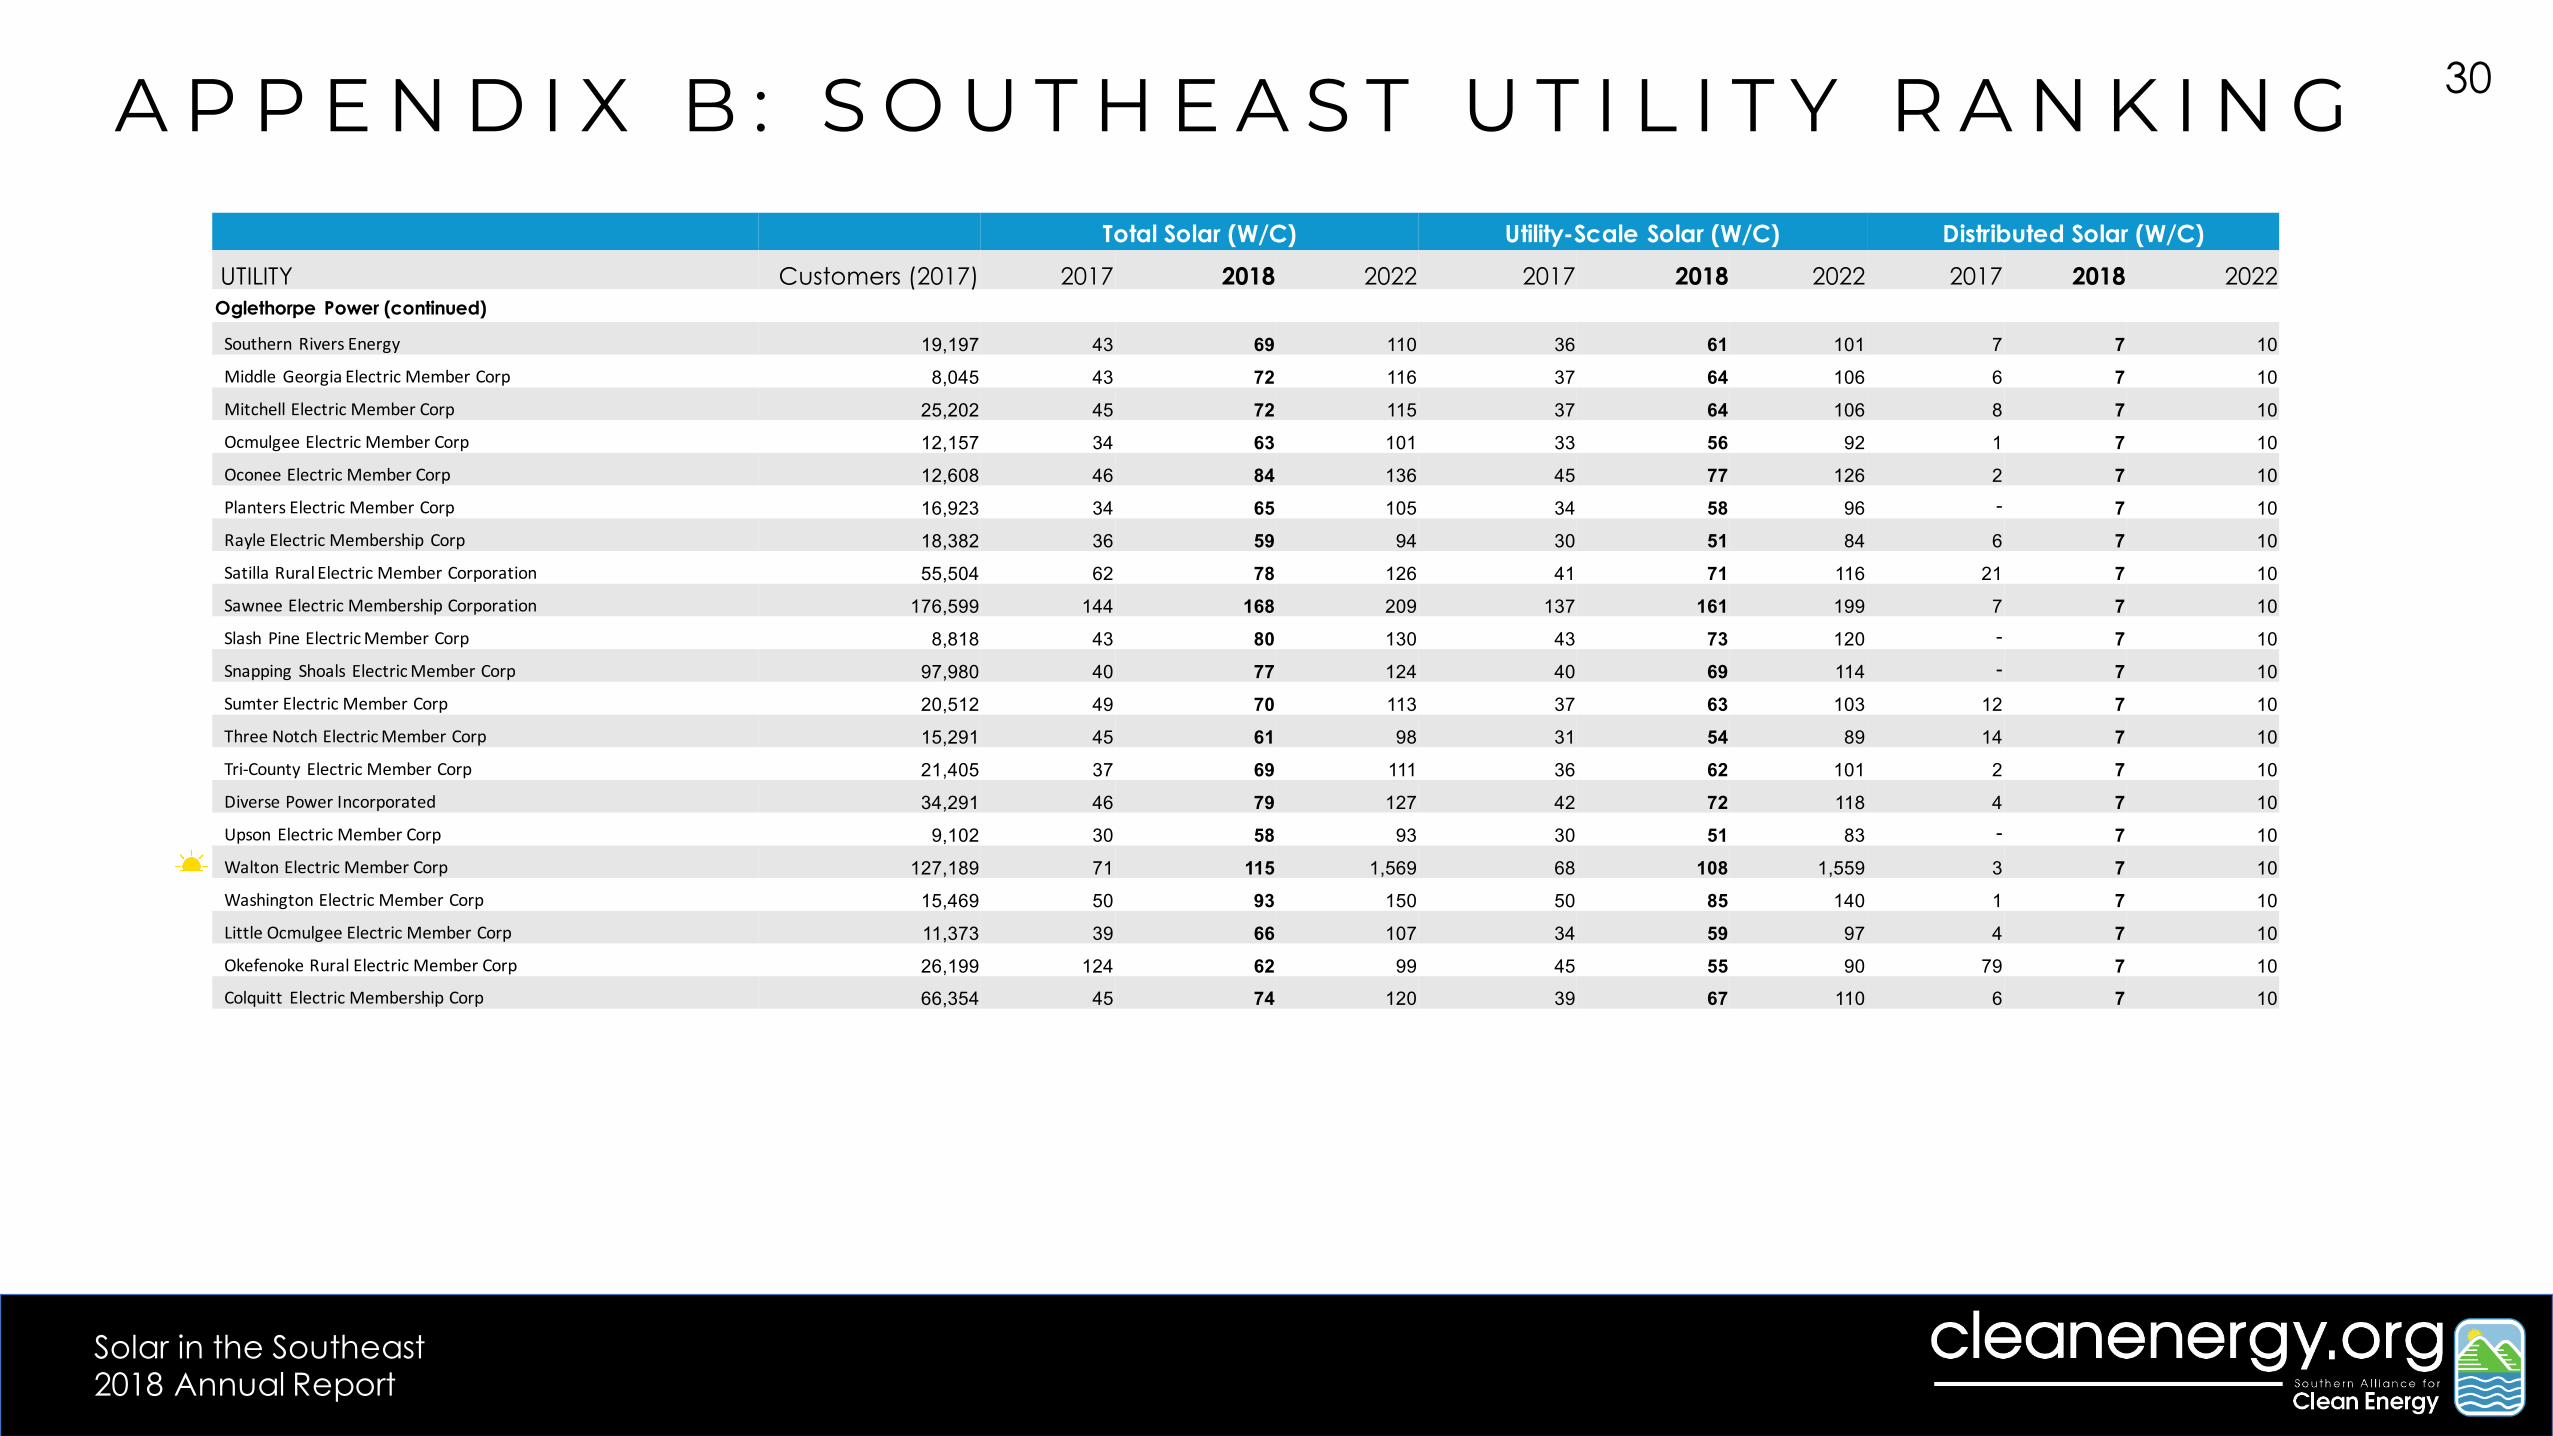
Total Solar (W/C) Utility-Scale Solar (W/C) Distributed Solar (W/C)UTILITY Customers (2017) 2017 2018 2022 2017 2018 2022 2017 2018 2022
Oglethorpe Power (continued)
SouthernRiversEnergy 19,197 43 69 110 36 61 101 7 7 10 MiddleGeorgiaElectricMemberCorp 8,045 43 72 116 37 64 106 6 7 10 MitchellElectricMemberCorp 25,202 45 72 115 37 64 106 8 7 10 OcmulgeeElectricMemberCorp 12,157 34 63 101 33 56 92 1 7 10 OconeeElectricMemberCorp 12,608 46 84 136 45 77 126 2 7 10 PlantersElectricMemberCorp 16,923 34 65 105 34 58 96 - 7 10 Rayle ElectricMembership Corp 18,382 36 59 94 30 51 84 6 7 10 SatillaRuralElectricMemberCorporation 55,504 62 78 126 41 71 116 21 7 10 Sawnee ElectricMembershipCorporation 176,599 144 168 209 137 161 199 7 7 10 Slash PineElectricMemberCorp 8,818 43 80 130 43 73 120 - 7 10 Snapping Shoals ElectricMemberCorp 97,980 40 77 124 40 69 114 - 7 10 SumterElectricMemberCorp 20,512 49 70 113 37 63 103 12 7 10 ThreeNotchElectricMemberCorp 15,291 45 61 98 31 54 89 14 7 10 Tri-County ElectricMemberCorp 21,405 37 69 111 36 62 101 2 7 10 DiversePowerIncorporated 34,291 46 79 127 42 72 118 4 7 10 Upson ElectricMemberCorp 9,102 30 58 93 30 51 83 - 7 10 WaltonElectricMemberCorp 127,189 71 115 1,569 68 108 1,559 3 7 10 WashingtonElectricMemberCorp 15,469 50 93 150 50 85 140 1 7 10 LittleOcmulgeeElectricMemberCorp 11,373 39 66 107 34 59 97 4 7 10 Okefenoke RuralElectricMemberCorp 26,199 124 62 99 45 55 90 79 7 10 Colquitt ElectricMembershipCorp 66,354 45 74 120 39 67 110 6 7 10
A P P E N D I X B : S O U T H E A S T U T I L I T Y R A N K I N G

31
Solar in the Southeast 2018 Annual Report Continuedonnextpage
Total Solar (W/C) Utility-Scale Solar (W/C) Distributed Solar (W/C)UTILITY Customers (2017) 2017 2018 2022 2017 2018 2022 2017 2018 2022PowerSouth 437,390 2 6 18 - - - 2 6 18 CityofAndalusia 4,594 - 0 0 - - - - 0 0 BaldwinCounty ElectricMemberCorp 74,865 - 1 3 - - - - 1 3 CentralAlabamaElectricCooperative 43,150 0 1 3 - - - 0 1 3 Choctawhatche ElectricCooperative 50,180 9 21 64 - - - 9 21 64 CoosaValleyElectricCooperative 16,690 - 1 3 - - - - 1 3 Covington ElectricCooperative 23,123 1 1 3 - - - 1 1 3 DixieElectricCooperative 23,769 - 1 3 - - - - 1 3 EscambiaRiverElectricCooperative 11,012 12 21 64 - - - 12 21 64 GulfCoastElectricCooperative 20,710 6 21 64 - - - 6 21 64 PeaRiverElectricCooperative 18,783 - 1 3 - - - - 1 3 SouthAlabamaElectricCooperative 16,478 - 1 3 - - - - 1 3 Southern PineElectricCooperative 21,490 0 1 3 - - - 0 1 3 TallapoosaRiverElectricCooperative 26,860 2 1 3 - - - 2 1 3 WestFlorida ElectricCooperativeAssociation 28,494 5 21 64 - - - 5 21 64 WiregrassElectricCooperative 24,330 - 1 3 - - - - 1 3 PioneerElectricCooperative 12,854 1 1 3 - - - 1 1 3 Clarke-Washington ElectricMemberCorp 20,008 - 1 3 - - - - 1 3
A P P E N D I X B : S O U T H E A S T U T I L I T Y R A N K I N G
32
Solar in the Southeast 2018 Annual Report
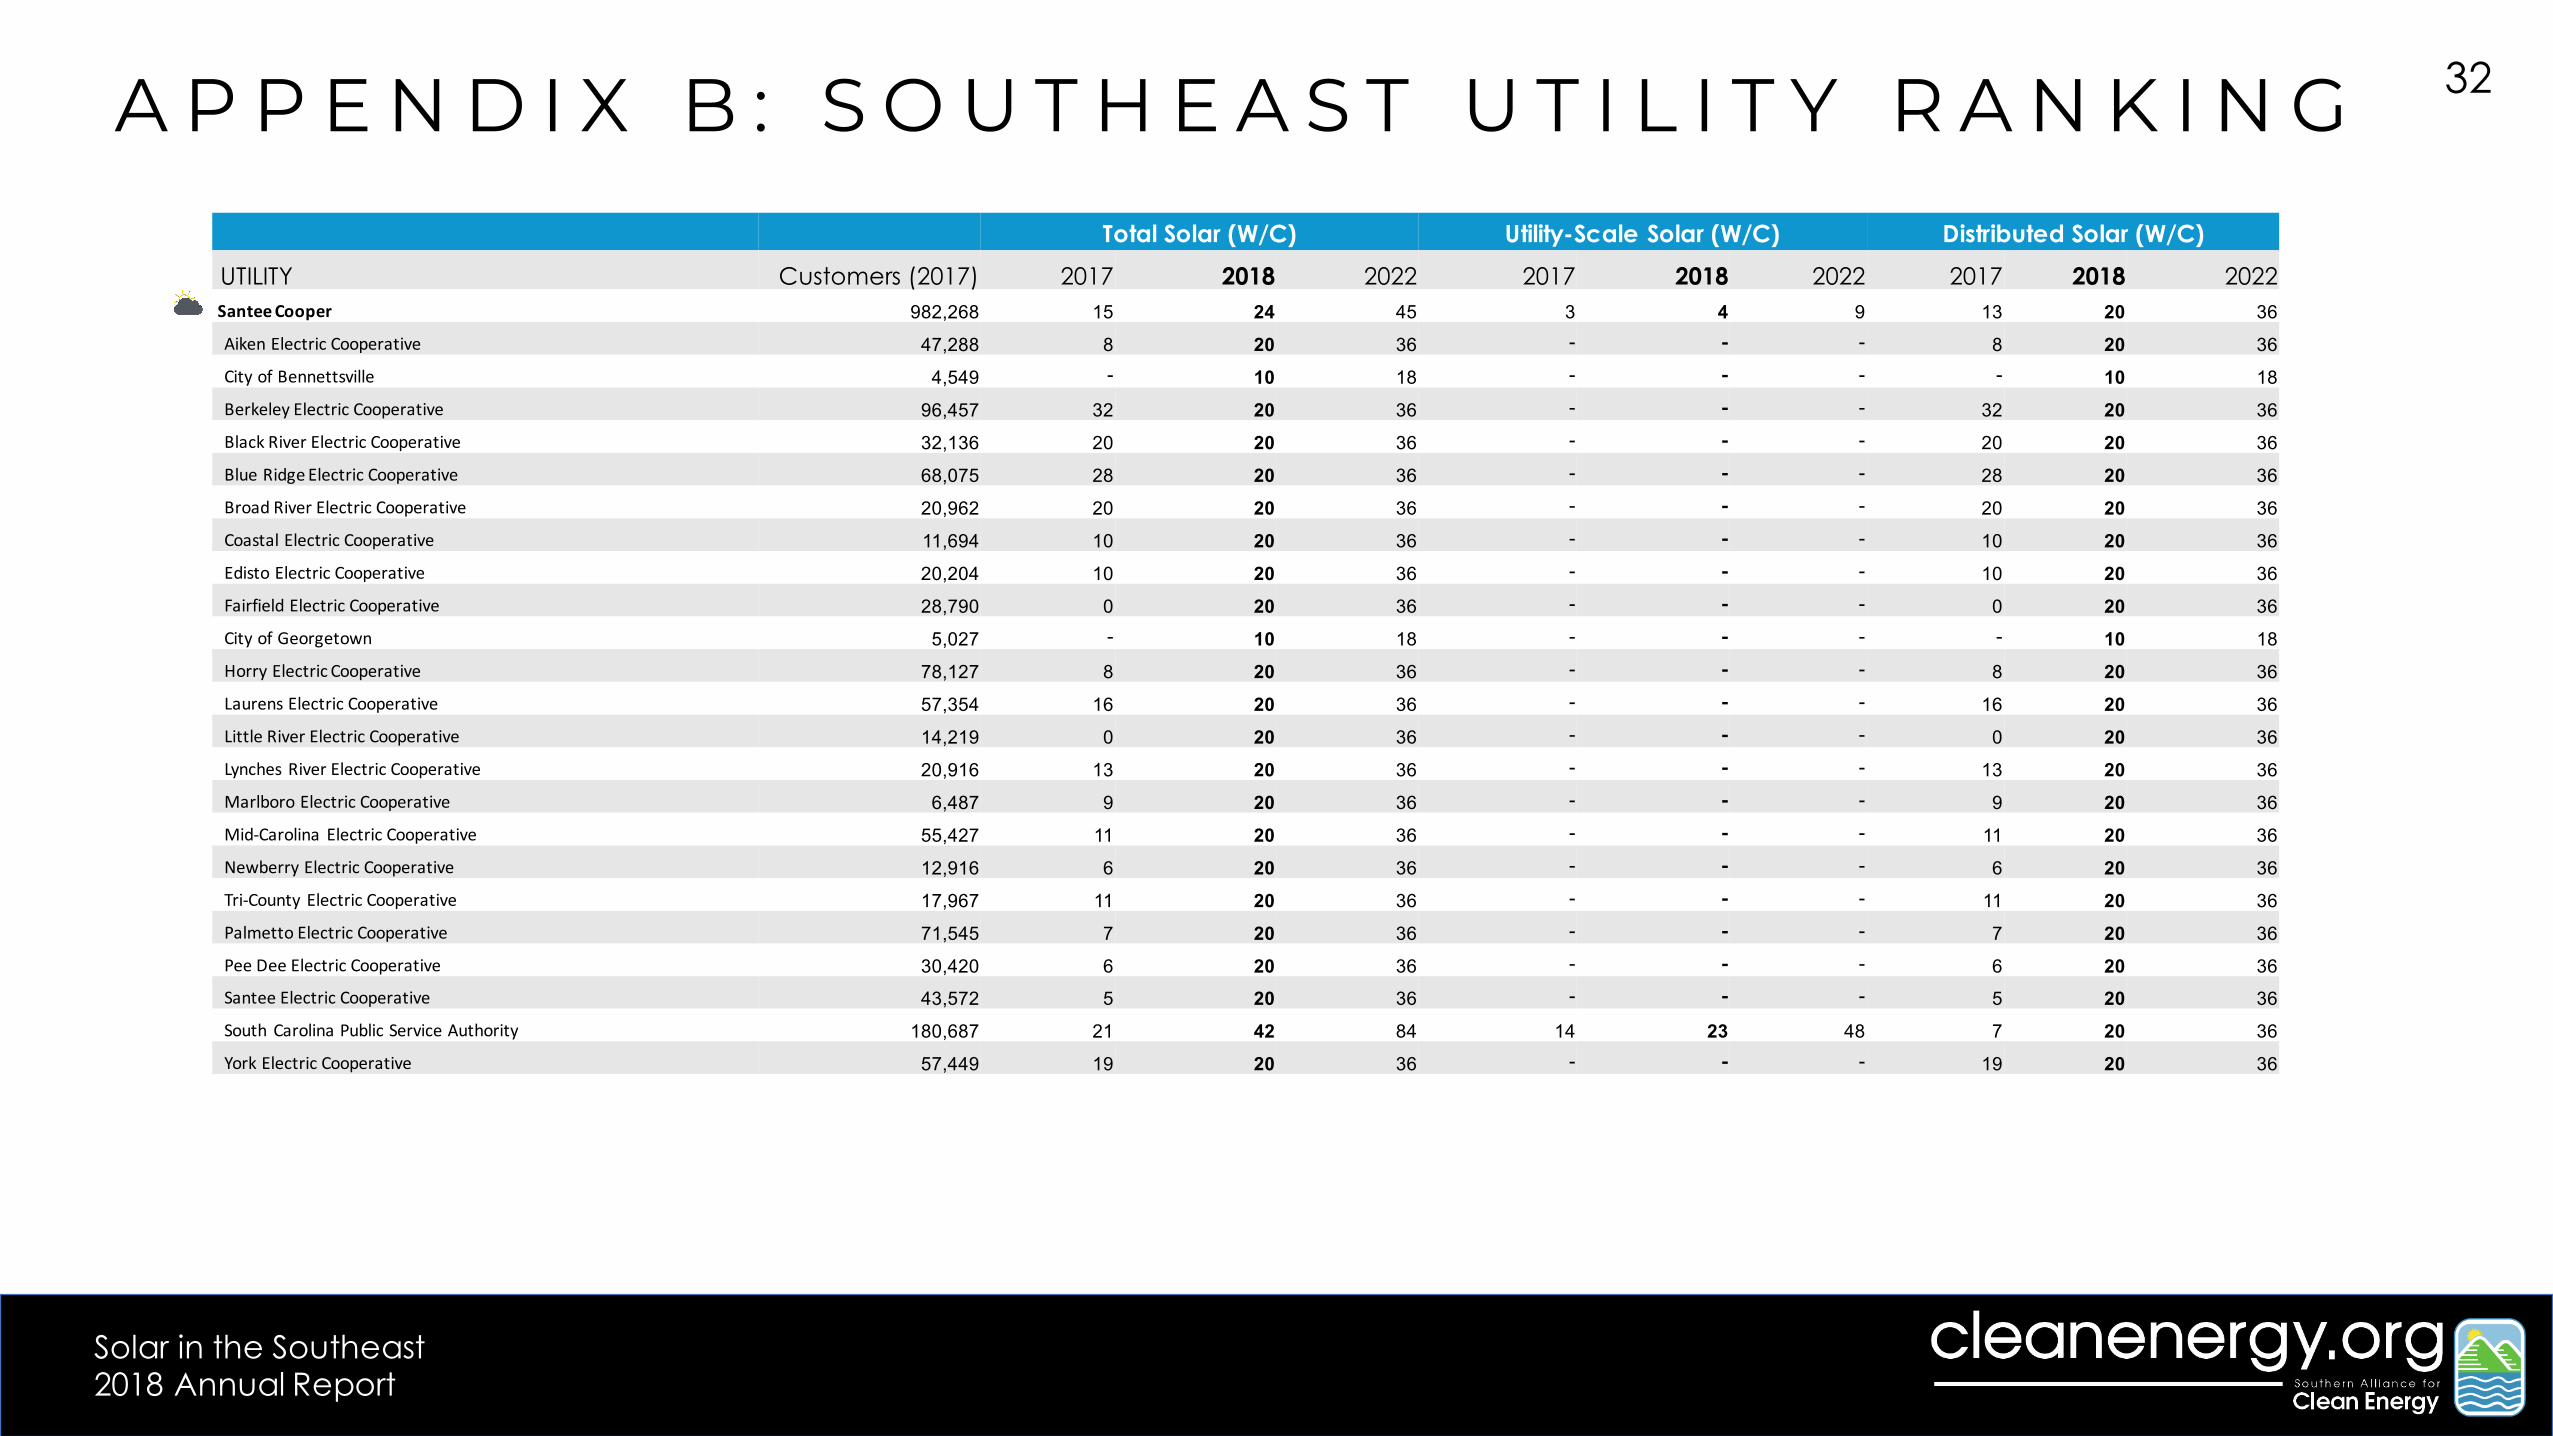
Total Solar (W/C) Utility-Scale Solar (W/C) Distributed Solar (W/C)UTILITY Customers (2017) 2017 2018 2022 2017 2018 2022 2017 2018 2022SanteeCooper 982,268 15 24 45 3 4 9 13 20 36 AikenElectricCooperative 47,288 8 20 36 - - - 8 20 36 CityofBennettsville 4,549 - 10 18 - - - - 10 18 BerkeleyElectricCooperative 96,457 32 20 36 - - - 32 20 36 BlackRiverElectricCooperative 32,136 20 20 36 - - - 20 20 36 BlueRidgeElectricCooperative 68,075 28 20 36 - - - 28 20 36 BroadRiverElectricCooperative 20,962 20 20 36 - - - 20 20 36 CoastalElectricCooperative 11,694 10 20 36 - - - 10 20 36 EdistoElectricCooperative 20,204 10 20 36 - - - 10 20 36 FairfieldElectricCooperative 28,790 0 20 36 - - - 0 20 36 CityofGeorgetown 5,027 - 10 18 - - - - 10 18 HorryElectricCooperative 78,127 8 20 36 - - - 8 20 36 LaurensElectricCooperative 57,354 16 20 36 - - - 16 20 36 LittleRiverElectricCooperative 14,219 0 20 36 - - - 0 20 36 LynchesRiverElectricCooperative 20,916 13 20 36 - - - 13 20 36 MarlboroElectricCooperative 6,487 9 20 36 - - - 9 20 36 Mid-Carolina ElectricCooperative 55,427 11 20 36 - - - 11 20 36 NewberryElectricCooperative 12,916 6 20 36 - - - 6 20 36 Tri-County ElectricCooperative 17,967 11 20 36 - - - 11 20 36 PalmettoElectricCooperative 71,545 7 20 36 - - - 7 20 36 PeeDeeElectricCooperative 30,420 6 20 36 - - - 6 20 36 SanteeElectricCooperative 43,572 5 20 36 - - - 5 20 36 SouthCarolinaPublicServiceAuthority 180,687 21 42 84 14 23 48 7 20 36 YorkElectricCooperative 57,449 19 20 36 - - - 19 20 36
A P P E N D I X B : S O U T H E A S T U T I L I T Y R A N K I N G

33
Solar in the Southeast 2018 Annual Report
Total Solar (W/C) Utility-Scale Solar (W/C) Distributed Solar (W/C)UTILITY Customers (2017) 2017 2018 2022 2017 2018 2022 2017 2018 2022SCE&G 715,592 241 512 1,706 157 361 1,402 84 151 304 SouthCarolinaMunicipals 168,115 7 10 75 - - 57 7 10 18 CityofCamden 10,892 0 10 18 - - - 0 10 18 ClintonCombinedUtilitySystem 4,021 - 10 18 - - - - 10 18 EasleyCombinedUtilitySystem 14,530 12 10 18 - - - 12 10 18 CityofGaffney 7,430 2 10 18 - - - 2 10 18 GreenwoodCommission ofPublicWorks 13,972 - 10 18 - - - - 10 18 GreerCommission ofPublicWorks 25,073 12 10 18 - - - 12 10 18 LockhartPower 6,183 - 10 1,563 - - 1,545 - 10 18 CityofNewberry 4,965 - 10 18 - - - - 10 18 CityofOrangeburg 24,165 - 10 18 - - - - 10 18 CityofRockHill 36,369 17 10 18 - - - 17 10 18 CityofSeneca 8,296 - 10 18 - - - - 10 18 CityofUnion 6,856 3 10 18 - - - 3 10 18 CityofLaurens 5,363 - 10 18 - - - - 10 18 SouthernCompany 4,623,158 233 314 618 203 281 575 30 33 43 AlabamaPowerCo 1,475,042 34 67 335 33 64 330 1 3 5 GeorgiaPowerCo 2,501,473 353 426 809 301 371 752 52 54 58 GulfPowerCo* 459,049 144 291 329 131 271 269 13 19 60 Mississippi PowerCo 187,594 432 821 924 420 808 829 12 13 95 TampaElectric 744,691 49 157 934 29 128 806 20 29 128
A P P E N D I X B : S O U T H E A S T U T I L I T Y R A N K I N G
* Note: Gulf Power remained a unit of the Southern Company through 2018. That ownership transfer to NextEra will be reflected in the next update.

34
Solar in the Southeast 2018 Annual Report
Total Solar (W/C) Utility-Scale Solar (W/C) Distributed Solar (W/C)UTILITY Customers (2017) 2017 2018 2022 2017 2018 2022 2017 2018 2022TVA 4,767,181 54 84 251 34 54 193 20 31 57 AberdeenElectricDepartment 3,258 68 108 410 66 104 373 2 5 36 AlbertvilleMunicipalUtilities Board 10,183 63 125 406 62 98 353 1 27 53 AlcornCounty ElectricPowerAssociation 18,775 37 56 209 34 53 192 4 2 17 CityofAmory 4,010 35 61 238 35 56 202 - 5 36 CityofAlcoaUtilities 28,981 32 65 182 22 35 127 10 30 55 Appalachian ElectricCooperative 46,292 29 64 177 21 34 121 8 31 57 ArabElectricCooperative 15,474 40 46 145 21 34 121 19 12 24 CityofAthensElectricDepartment 45,917 33 69 203 26 42 150 7 27 53 AthensUtilityBoard 13,206 95 112 350 52 82 296 43 30 55 BentonCountyElectricSystem 10,403 22 61 169 20 32 114 2 30 55 BentonElectricSystem 2,523 49 84 239 29 47 169 20 38 69 CityofBessemerUtilities 11,152 30 73 218 29 46 165 1 27 53 BlueRidgeMountainElectricMemberCorp 52,028 305 177 362 14 21 77 291 156 285 BolivarEnergyAuthority 11,060 26 64 178 22 34 124 4 30 55 BowlingGreenMunicipalUtilities 29,729 32 88 251 32 50 181 1 38 69 BristolTennesseeEssentialServices 33,580 45 74 214 28 44 160 17 30 55 BrownsvilleUtilityDepartment 5,382 41 95 289 41 65 235 - 30 55 CentralElectricPowerAssociation 36,382 29 42 159 25 40 143 4 2 17 CaneyForkElectricCooperative 32,332 100 63 171 20 32 114 80 31 57 CarrollCounty ElectricDepartment 15,563 43 76 220 29 46 166 14 30 55 ElectricPowerBoardofChattanooga 169,615 67 84 250 36 54 195 31 30 55 CherokeeElectricCooperative 23,669 22 47 149 22 35 125 - 12 24 ChickamaugaElectricSystem 975 26 81 212 26 42 159 - 39 52 CDELightband 69,157 26 66 185 23 36 130 3 30 55 ClevelandUtilities 31,481 51 86 256 35 56 202 16 30 55
A P P E N D I X B : S O U T H E A S T U T I L I T Y R A N K I N G

35
Solar in the Southeast 2018 Annual Report
Total Solar (W/C) Utility-Scale Solar (W/C) Distributed Solar (W/C)UTILITY Customers (2017) 2017 2018 2022 2017 2018 2022 2017 2018 2022TVA (continued)
ClintonUtilitiesBoard 29,859 31 74 213 28 44 158 3 30 55 Columbia Power&WaterSystems 27,560 30 68 193 24 38 139 6 30 55 Columbus Light&Water 12,918 31 54 212 31 49 176 - 5 36 Cookeville ElectricDepartment 17,745 48 82 244 33 53 189 15 30 55 Covington ElectricSystem 4,711 54 115 360 54 85 306 - 30 55 CullmanPowerBoard 8,666 38 81 245 34 53 193 5 27 53 Cullman ElectricCooperative 43,229 55 53 169 26 41 146 29 12 24 Cumberland ElectricMemberCorp 94,555 42 77 221 29 46 164 13 31 57 CityofDaytonElectricDepartment 10,584 31 74 215 28 45 161 3 30 55 DecaturUtilities 26,595 57 103 324 48 75 271 9 27 53 Dickson ElectricDepartment 34,796 48 71 205 26 42 150 22 30 55 DuckRiverElectricMemberCorp 74,369 37 72 203 26 41 146 11 31 57 DyersburgElectricSystem 11,861 36 87 260 36 57 205 - 30 55 EastMississippi ElectricPowerAssociation 12,803 20 33 126 19 30 109 1 2 17 CityofElizabethtonElectricDepartment 26,412 27 62 171 21 32 117 6 30 55 ErwinUtilities 8,940 28 70 199 25 40 144 3 30 55 EtowahUtilities 5,117 55 108 338 50 79 283 6 30 55 FayettevillePublicUtilities 18,455 333 70 201 26 41 146 307 30 55 FlorenceUtilities 49,358 29 68 200 26 41 148 3 27 53 FortLoudoun ElectricCooperative 32,116 34 62 170 20 31 113 14 31 57 FortPayneImprovementAuthority 8,490 58 89 274 39 62 222 19 27 53 4-County ElectricPowerAssociation 48,243 28 39 149 23 37 132 4 2 17 Franklin ElectricCooperative 7,759 30 59 193 30 47 170 - 12 24 Franklin ElectricPowerBoard 4,989 41 103 303 41 65 233 - 38 69 Fulton ElectricSystem 1,628 49 91 264 33 53 194 17 38 69
A P P E N D I X B : S O U T H E A S T U T I L I T Y R A N K I N G

36
Solar in the Southeast 2018 Annual Report
Total Solar (W/C) Utility-Scale Solar (W/C) Distributed Solar (W/C)UTILITY Customers (2017) 2017 2018 2022 2017 2018 2022 2017 2018 2022TVA (continued)
GallatinDepartmentofElectricity 18,594 55 104 321 47 74 266 8 30 55 Gibson ElectricMembersCorp 34,571 54 70 198 25 39 141 29 31 57 GlasgowElectricPowerBoard 7,427 123 102 299 40 64 230 82 38 69 GreenevilleLight&PowerSystem 38,231 45 81 240 33 51 185 13 30 55 ElectricBoardofGuntersville 6,440 62 89 275 39 62 222 23 27 53 HarrimanUtiliyBoard 10,971 28 62 170 20 32 116 8 30 55 HartselleUtilities 5,535 28 71 211 28 44 158 - 27 53 HickmanElectricSystem 1,099 51 62 166 14 25 97 37 38 69 HollySpringsUtilityDepartment 11,623 22 39 159 22 34 123 - 5 36 HolstonElectricCooperative 30,500 68 75 214 28 44 157 40 31 57 Hopkinsville ElectricSystem 12,980 32 84 235 29 46 166 3 38 69 HumboldtUtilities 4,425 94 86 256 35 56 202 58 30 55 HuntsvilleUtilities 182,443 36 74 222 30 47 169 6 27 53 Jackson EnergyAuthority 36,031 86 108 338 50 79 283 37 30 55 Jellico Electric&WaterSystem 2,328 97 61 168 33 31 113 64 30 55 JoeWheelerElectricMemberCorp 43,227 49 77 255 41 64 232 8 12 24 BrightRidge 78,102 38 70 198 25 40 143 13 30 55 KnoxvilleUtilitiesBoard 201,857 43 74 214 28 44 160 15 30 55 LaFolletteUtilitiesBoard 22,101 45 60 164 19 30 109 26 30 55 LawrenceburgElectricSystem 20,257 36 69 196 25 39 142 12 30 55 LenoirCityUtilitiesBoard 64,400 50 72 207 27 42 152 23 30 55 LewisburgElectricSystem 6,168 77 121 383 58 91 328 19 30 55 LexingtonElectricSystem 22,507 25 62 171 20 32 117 5 30 55 LoudonUtilitiesBoard 11,945 86 117 369 55 87 315 31 30 55 Louisville Utilities 3,472 54 63 248 37 59 212 17 5 36
A P P E N D I X B : S O U T H E A S T U T I L I T Y R A N K I N G

37
Solar in the Southeast 2018 Annual Report
Total Solar (W/C) Utility-Scale Solar (W/C) Distributed Solar (W/C)UTILITY Customers (2017) 2017 2018 2022 2017 2018 2022 2017 2018 2022TVA (continued)
CityofMaconElectricDepartment 1,205 20 37 161 20 33 125 - 5 36 Marshall-DeKalbElectricCooperative 19,681 35 48 153 23 36 129 13 12 24 CityofMaryvilleElectricDepartment 21,313 45 90 272 38 61 218 6 30 55 MayfieldElectric&WaterSystem 5,424 32 81 227 28 44 157 5 38 69 McMinnville ElectricSystem 8,006 32 71 202 26 41 147 6 30 55 Memphis LightGasandWater 414,315 46 84 251 35 55 197 11 30 55 MeriwetherLewisElectricCooperative 34,140 52 89 267 37 58 210 15 31 57 Middle TennesseeElectricMemberCorp 219,233 51 76 218 28 45 161 23 31 57 MilanDepartmentofPublicUtilities 8,162 45 69 195 25 39 141 20 30 55 MorristownUtilitySystems 14,790 72 134 430 66 104 376 6 30 55 MountainElectricCooperative 33,970 22 255 542 20 31 112 2 224 430 MountPleasantPowerSystem 3,973 35 82 244 33 53 190 2 30 55 Murfreesboro ElectricDepartment 61,686 35 77 225 30 47 171 6 30 55 MurrayElectricSystem 8,018 53 98 288 38 61 218 15 38 69 MuscleShoals ElectricBoard 8,032 41 92 285 41 64 232 1 27 53 Nashville ElectricService 394,705 47 80 235 32 50 181 16 30 55 NatchezTraceElectricPowerAssociation 15,853 28 37 141 22 35 125 6 2 17 NewAlbanyLightGas&Water 10,709 39 57 223 33 52 187 6 5 36 NewbernElectricWater&Gas 1,809 63 130 417 63 100 363 - 30 55 NewportUtilities 21,648 66 73 210 27 43 156 39 30 55 NorthAlabamaElectricCooperative 18,196 28 47 149 22 35 125 6 12 24 NorthGeorgiaElectricMemberCorp 99,731 59 79 196 25 40 143 34 39 52 NorthcentralMississippi ElectricPowerAssociatio 30,976 37 58 217 35 56 200 2 2 17 OakRidgeElectricDepartment 16,232 59 82 244 33 53 190 26 30 55 CityofOkolonaElectricDepartment 5,253 19 35 146 19 30 110 - 5 36 CityofOxfordElectricDepartment 9,472 26 45 181 26 40 145 1 5 36
A P P E N D I X B : S O U T H E A S T U T I L I T Y R A N K I N G

38
Solar in the Southeast 2018 Annual Report
Total Solar (W/C) Utility-Scale Solar (W/C) Distributed Solar (W/C)UTILITY Customers (2017) 2017 2018 2022 2017 2018 2022 2017 2018 2022TVA (continued)
ParisBoardofPublicUtilities 21,289 43 66 186 23 37 132 20 30 55 PennyrileRuralElectricCooperative 43,606 57 84 236 29 46 166 28 38 69 Philadelphia Utilities 3,848 34 58 229 34 53 193 - 5 36 Pickwick ElectricCooperative 20,624 20 61 164 19 30 107 1 31 57 PlateauElectricCooperative 17,044 22 61 165 19 30 109 3 31 57 PontotocElectricPowerAssociation 19,150 24 40 152 24 38 136 - 2 17 PowellValleyElectricCooperative 23,613 18 60 162 18 29 105 - 31 57 PrentissCounty ElectricPowerAssociation 13,810 27 45 169 27 42 153 0 2 17 Pulaski ElectricSystem 14,395 182 83 246 34 53 192 148 30 55 RockwoodElectricUtility 14,624 37 65 181 22 35 127 14 30 55 Russellville ElectricBoard 5,028 30 75 223 30 47 170 - 27 53 Russellville ElectricPlantBoard 4,068 35 91 261 34 53 192 2 38 69 SandMountainElectricCooperative 31,324 27 45 142 21 33 119 6 12 24 ScottsboroElectricPowerBoard 8,253 41 92 287 41 65 234 - 27 53 SequacheeValleyElectricCooperative 35,319 52 69 194 24 38 137 28 31 57 SevierCounty ElectricSystem 54,128 35 74 213 28 44 159 8 30 55 SheffieldUtilities 18,892 44 92 285 41 65 232 4 27 53 Shelbyville PowerSystem 10,268 44 91 276 39 62 222 5 30 55 Smithville ElectricSystem 2,708 60 111 349 51 81 294 9 30 55 SouthwestTennessee ElectricMemberCorp 49,996 30 63 171 20 32 114 10 31 57 SpartaElectric&PublicWorks 2,988 49 98 302 43 68 247 6 30 55 Springfield Electric 8,233 48 94 285 40 64 230 8 30 55 StarkvilleElectricDepartment 13,545 56 58 226 33 53 190 23 5 36 SweetwaterUtilitiesBoard 9,022 56 74 213 28 44 158 29 30 55
A P P E N D I X B : S O U T H E A S T U T I L I T Y R A N K I N G

39
Solar in the Southeast 2018 Annual Report
Total Solar (W/C) Utility-Scale Solar (W/C) Distributed Solar (W/C)UTILITY Customers (2017) 2017 2018 2022 2017 2018 2022 2017 2018 2022TVA (continued)
TallahatchieValleyElectricPowerAssociation 27,564 27 42 161 25 40 144 1 2 17 TarrantElectricDepartment 2,762 42 65 189 23 38 137 18 27 53 TennesseeValleyElectricCooperative 19,504 25 64 176 21 33 119 4 31 57 TippahElectricPowerAssociation 13,642 26 44 166 26 41 149 0 2 17 TishomingoCounty ElectricPowerAssociation 13,413 22 37 142 22 35 126 - 2 17 TombigbeeElectricPowerAssociation 43,474 28 46 173 28 44 157 1 2 17 TrentonLight&WaterDepartment 2,435 29 76 224 29 47 170 - 30 55 Tri-StateElectricMemberCorp 18,958 24 89 197 16 25 90 8 65 107 Tri-County ElectricMemberCorp 52,080 28 75 208 25 40 145 3 34 63 TullahomaUtilitiesAuthority 10,771 36 75 218 29 45 164 7 30 55 CityofTupeloWater&LightDepartment 15,408 47 73 283 43 69 247 3 5 36 Tuscumbia ElectricityDepartment 4,806 22 61 174 21 33 121 1 27 53 UnionCityElectricSystem 6,412 50 105 324 47 75 270 2 30 55 UpperCumberland ElectricMemberCorp 49,594 29 66 181 22 35 124 7 31 57 VolunteerElectricCooperative 115,465 47 64 175 21 33 118 26 31 57 WarrenRuralElectricCooperativeCorp 64,895 88 91 259 33 53 190 55 38 69 CityofWaterValleyElectricDepartment 2,014 36 62 244 36 57 207 - 5 36 Weakley CountyMunicipalElectricSystem 20,392 29 67 190 24 38 135 6 30 55 WestKentuckyRuralElectricCooperative 38,622 92 68 177 19 30 107 73 38 69 CityofWestPointElectricSystem 3,894 22 40 162 22 35 126 - 5 36 WinchesterUtilities 5,930 42 80 235 32 50 180 10 30 55 RipleyPower&Light 6,671 30 78 228 30 48 173 - 30 55 ChickasawElectricCooperative 19,790 32 73 208 27 42 151 6 31 57 ForkedDeerElectricCooperative 9,890 20 60 161 18 29 104 2 31 57 NorthEastMississippi ElectricPowerAssociation 25,846 28 44 168 27 42 151 1 2 17 MonroeCounty ElectricPowerAssociation 11,218 22 33 129 20 31 112 2 2 17 HFCRECC(MergedintoGibson EMC) 3,422 69 74 199 23 36 129 46 38 69 CityofCourtland 790 26 69 213 26 42 161 - 27 53 MurphyElectricPowerBoard 5,029 51 426 898 29 45 164 22 380 735
A P P E N D I X B : S O U T H E A S T U T I L I T Y R A N K I N G