Embed Size (px)
Citation preview
BUSINESS CONSULTANTS
DEEP TECHNOLOGISTS
Solar in the Midwest Utility Opportunities to Effect Positive Customer Experience Modelling Interconnection Process Frameworks May 28, 2015
© 2015 West Monroe Partners | Reproduction and distribution without West Monroe Partners prior consent is prohibited.
An overview of the Grow Solar Partnership’s Published Report: Current State Findings of Solar Enrollment Processes at Midwest Utilities
How updated utility processes can lead to positive customer experiences
Solar enrollment processes & supporting technologies
A preview upcoming challenges and opportunities in distributed energy like community solar
Agenda
2
© 2015 West Monroe Partners | Reproduction and distribution without West Monroe Partners prior consent is prohibited.
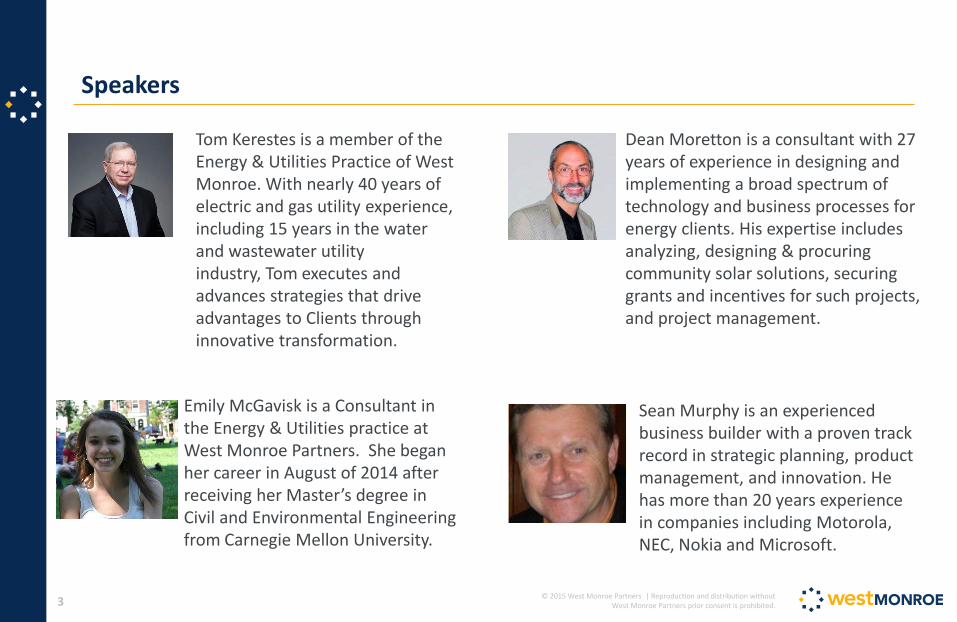
Emily McGavisk is a Consultant in the Energy & Utilities practice at West Monroe Partners. She began her career in August of 2014 after receiving her Master’s degree in Civil and Environmental Engineering from Carnegie Mellon University.
Speakers
3
Tom Kerestes is a member of the Energy & Utilities Practice of West Monroe. With nearly 40 years of electric and gas utility experience, including 15 years in the water and wastewater utility industry, Tom executes and advances strategies that drive advantages to Clients through innovative transformation.
Dean Moretton is a consultant with 27 years of experience in designing and implementing a broad spectrum of technology and business processes for energy clients. His expertise includes analyzing, designing & procuring community solar solutions, securing grants and incentives for such projects, and project management.
Sean Murphy is an experienced business builder with a proven track record in strategic planning, product management, and innovation. He has more than 20 years experience in companies including Motorola, NEC, Nokia and Microsoft.
An Overview of the Grow Solar Partnership’s Published Report
4
Current State Findings of Solar Enrollment Processes at Midwest Utilities
A. Permit process
B. Interconnection application
C. Transparency
D. Inspections
Question: What do you feel is the biggest process challenge related to rooftop solar deployment?
5
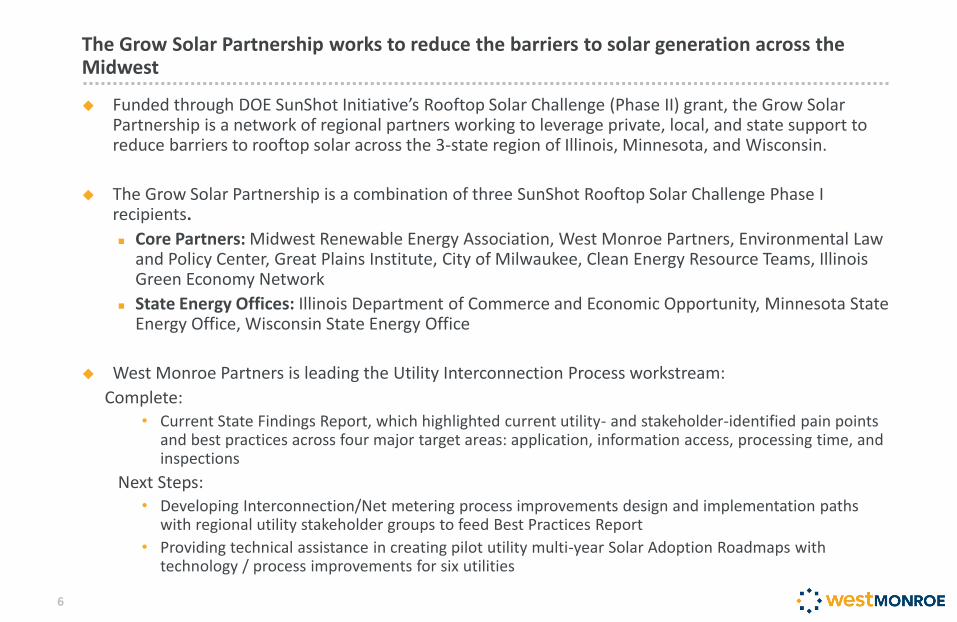
Funded through DOE SunShot Initiative’s Rooftop Solar Challenge (Phase II) grant, the Grow Solar Partnership is a network of regional partners working to leverage private, local, and state support to reduce barriers to rooftop solar across the 3-state region of Illinois, Minnesota, and Wisconsin.
The Grow Solar Partnership is a combination of three SunShot Rooftop Solar Challenge Phase I recipients.
Core Partners: Midwest Renewable Energy Association, West Monroe Partners, Environmental Law and Policy Center, Great Plains Institute, City of Milwaukee, Clean Energy Resource Teams, Illinois Green Economy Network
State Energy Offices: Illinois Department of Commerce and Economic Opportunity, Minnesota State Energy Office, Wisconsin State Energy Office
West Monroe Partners is leading the Utility Interconnection Process workstream:
Complete: • Current State Findings Report, which highlighted current utility- and stakeholder-identified pain points
and best practices across four major target areas: application, information access, processing time, and inspections
Next Steps: • Developing Interconnection/Net metering process improvements design and implementation paths
with regional utility stakeholder groups to feed Best Practices Report
• Providing technical assistance in creating pilot utility multi-year Solar Adoption Roadmaps with technology / process improvements for six utilities
The Grow Solar Partnership works to reduce the barriers to solar generation across the Midwest
6
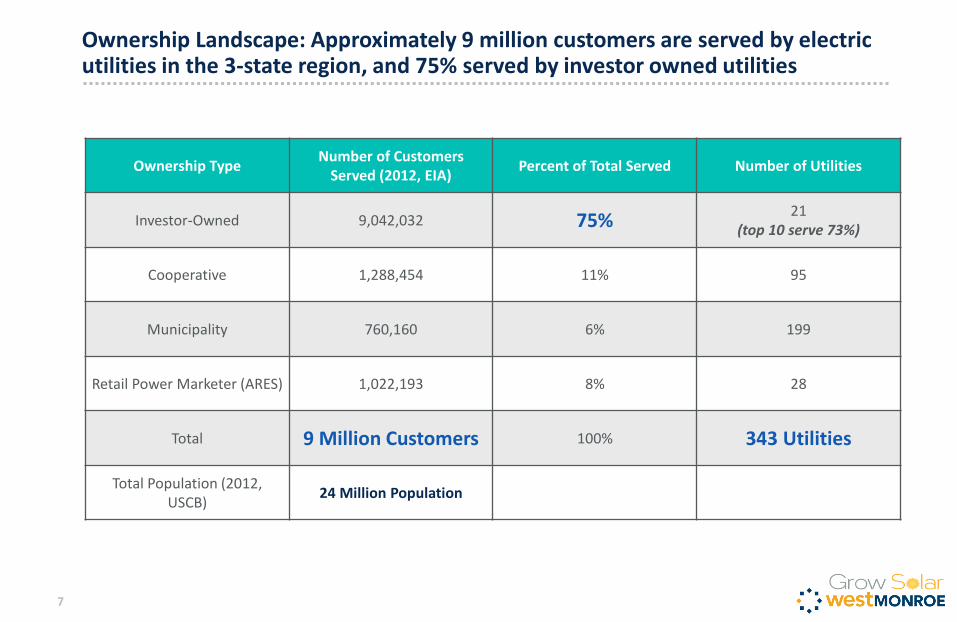
Ownership Landscape: Approximately 9 million customers are served by electric utilities in the 3-state region, and 75% served by investor owned utilities
7
Ownership Type Number of Customers
Served (2012, EIA) Percent of Total Served Number of Utilities
Investor-Owned 9,042,032 75% 21
(top 10 serve 73%)
Cooperative 1,288,454 11% 95
Municipality 760,160 6% 199
Retail Power Marketer (ARES) 1,022,193 8% 28
Total 9 Million Customers 100% 343 Utilities
Total Population (2012, USCB)
24 Million Population
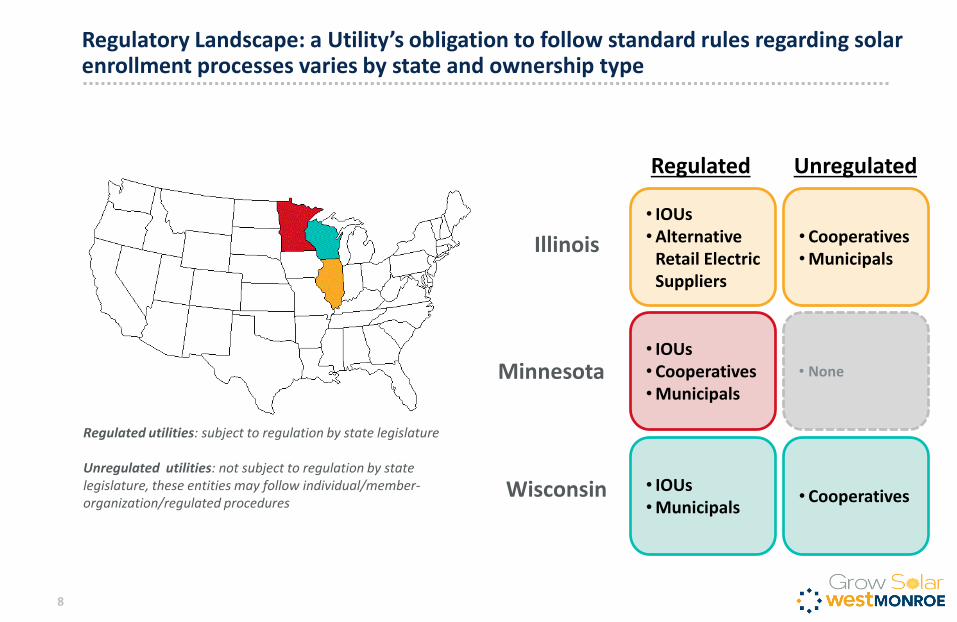
Regulatory Landscape: a Utility’s obligation to follow standard rules regarding solar enrollment processes varies by state and ownership type
8
Illinois
Wisconsin
Minnesota
Regulated utilities: subject to regulation by state legislature Unregulated utilities: not subject to regulation by state legislature, these entities may follow individual/member-organization/regulated procedures
• IOUs •Alternative
Retail Electric Suppliers
• IOUs • Cooperatives •Municipals
• IOUs •Municipals
• Cooperatives •Municipals
• None
• Cooperatives
Regulated Unregulated
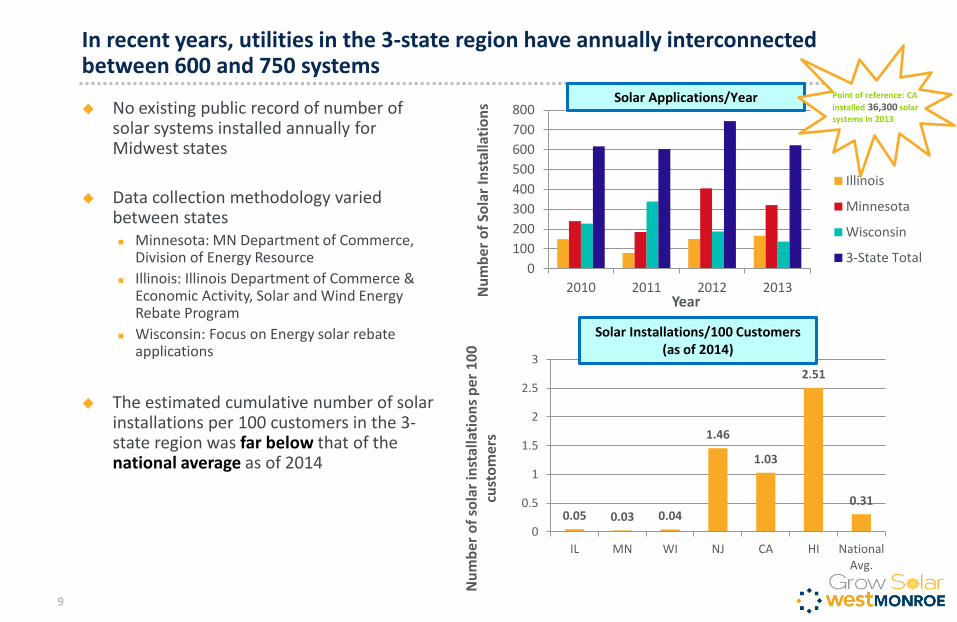
In recent years, utilities in the 3-state region have annually interconnected between 600 and 750 systems
9
0
100
200
300
400
500
600
700
800
2010 2011 2012 2013
Illinois
Minnesota
Wisconsin
3-State Total
Nu
mb
er o
f So
lar
Inst
alla
tio
ns
Year
Nu
mb
er o
f so
lar
inst
alla
tio
ns
per
10
0
cust
om
ers
No existing public record of number of solar systems installed annually for Midwest states
Data collection methodology varied between states Minnesota: MN Department of Commerce,
Division of Energy Resource
Illinois: Illinois Department of Commerce & Economic Activity, Solar and Wind Energy Rebate Program
Wisconsin: Focus on Energy solar rebate applications
The estimated cumulative number of solar
installations per 100 customers in the 3-state region was far below that of the national average as of 2014
Solar Applications/Year Point of reference: CA
installed 36,300 solar
systems in 2013
0.05 0.03 0.04
1.46
1.03
2.51
0.31
0
0.5
1
1.5
2
2.5
3
IL MN WI NJ CA HI NationalAvg.
Solar Installations/100 Customers (as of 2014)
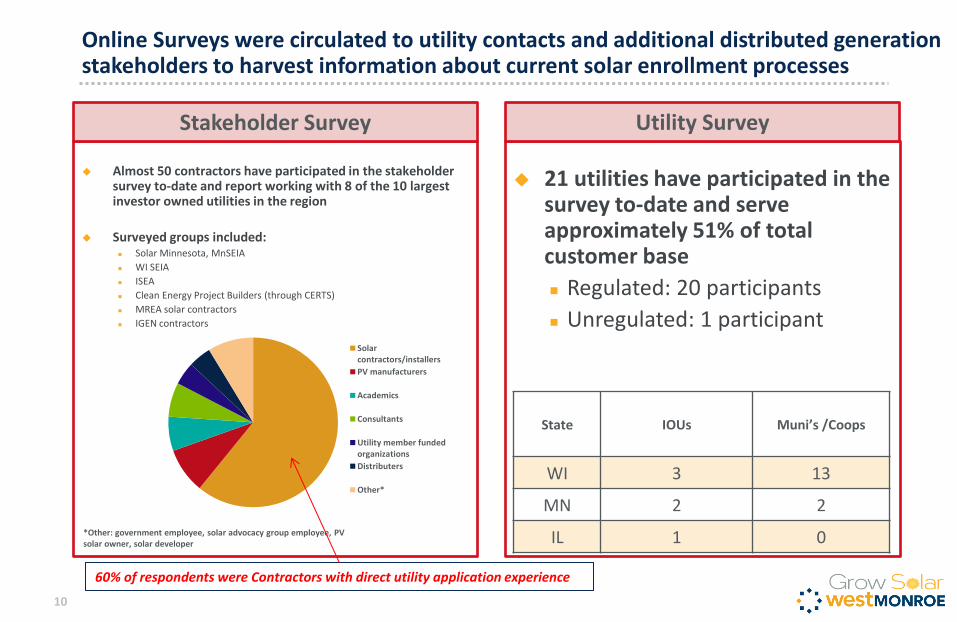
Almost 50 contractors have participated in the stakeholder survey to-date and report working with 8 of the 10 largest investor owned utilities in the region
Surveyed groups included: Solar Minnesota, MnSEIA
WI SEIA
ISEA
Clean Energy Project Builders (through CERTS)
MREA solar contractors
IGEN contractors
21 utilities have participated in the survey to-date and serve approximately 51% of total customer base
Regulated: 20 participants
Unregulated: 1 participant
Online Surveys were circulated to utility contacts and additional distributed generation stakeholders to harvest information about current solar enrollment processes
10
Stakeholder Survey Utility Survey
State IOUs Muni’s /Coops
WI 3 13
MN 2 2
IL 1 0
Solarcontractors/installers
PV manufacturers
Academics
Consultants
Utility member fundedorganizations
Distributers
Other*
*Other: government employee, solar advocacy group employee, PV solar owner, solar developer
60% of respondents were Contractors with direct utility application experience
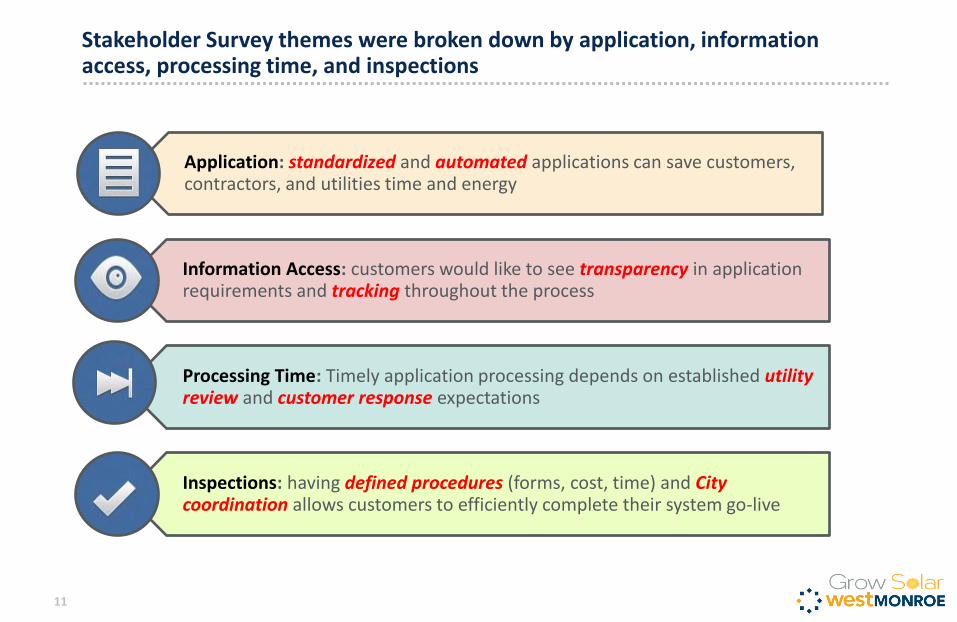
Application: standardized and automated applications can save customers, contractors, and utilities time and energy
Information Access: customers would like to see transparency in application requirements and tracking throughout the process
Processing Time: Timely application processing depends on established utility review and customer response expectations
Inspections: having defined procedures (forms, cost, time) and City coordination allows customers to efficiently complete their system go-live
Stakeholder Survey themes were broken down by application, information access, processing time, and inspections
11
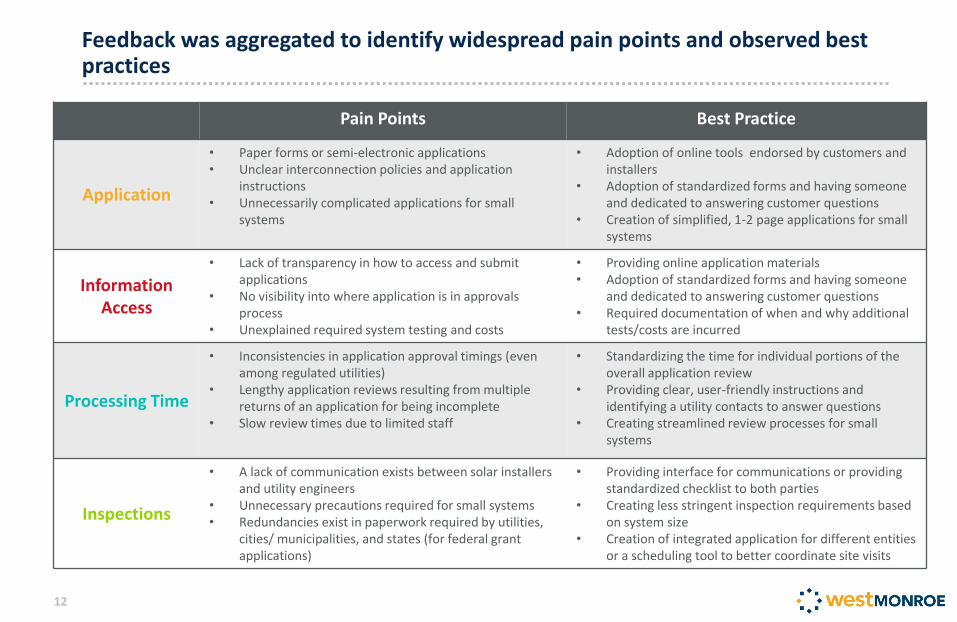
Feedback was aggregated to identify widespread pain points and observed best practices
12
Pain Points Best Practice
Application
• Paper forms or semi-electronic applications • Unclear interconnection policies and application
instructions • Unnecessarily complicated applications for small
systems
• Adoption of online tools endorsed by customers and installers
• Adoption of standardized forms and having someone and dedicated to answering customer questions
• Creation of simplified, 1-2 page applications for small systems
Information Access
• Lack of transparency in how to access and submit applications
• No visibility into where application is in approvals process
• Unexplained required system testing and costs
• Providing online application materials • Adoption of standardized forms and having someone
and dedicated to answering customer questions • Required documentation of when and why additional
tests/costs are incurred
Processing Time
• Inconsistencies in application approval timings (even among regulated utilities)
• Lengthy application reviews resulting from multiple returns of an application for being incomplete
• Slow review times due to limited staff
• Standardizing the time for individual portions of the overall application review
• Providing clear, user-friendly instructions and identifying a utility contacts to answer questions
• Creating streamlined review processes for small systems
Inspections
• A lack of communication exists between solar installers and utility engineers
• Unnecessary precautions required for small systems • Redundancies exist in paperwork required by utilities,
cities/ municipalities, and states (for federal grant applications)
• Providing interface for communications or providing standardized checklist to both parties
• Creating less stringent inspection requirements based on system size
• Creation of integrated application for different entities or a scheduling tool to better coordinate site visits
How updated utility processes can lead to positive customer experiences
13
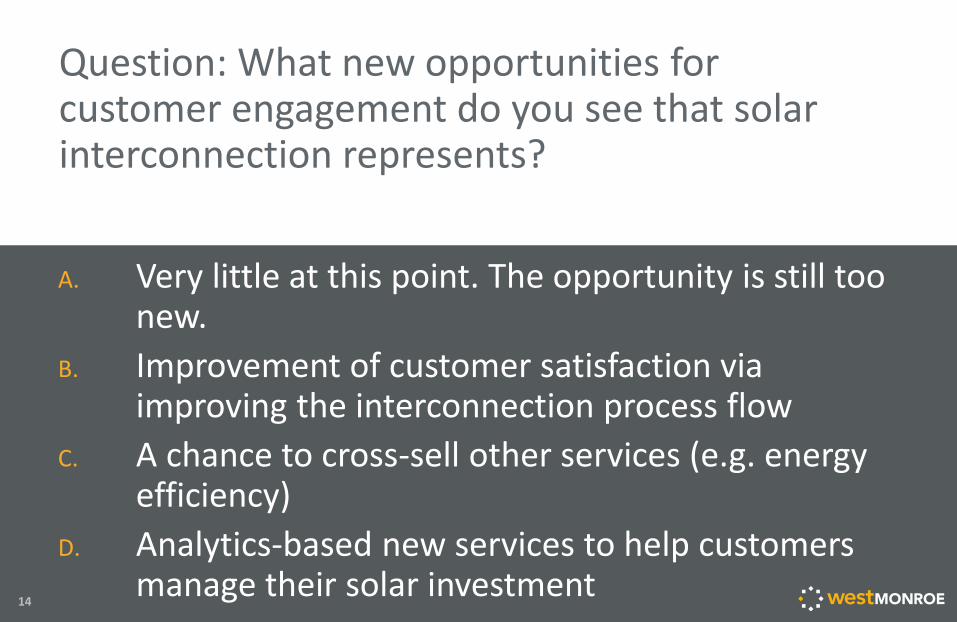
A. Very little at this point. The opportunity is still too new.
B. Improvement of customer satisfaction via improving the interconnection process flow
C. A chance to cross-sell other services (e.g. energy efficiency)
D. Analytics-based new services to help customers manage their solar investment
Question: What new opportunities for customer engagement do you see that solar interconnection represents?
14
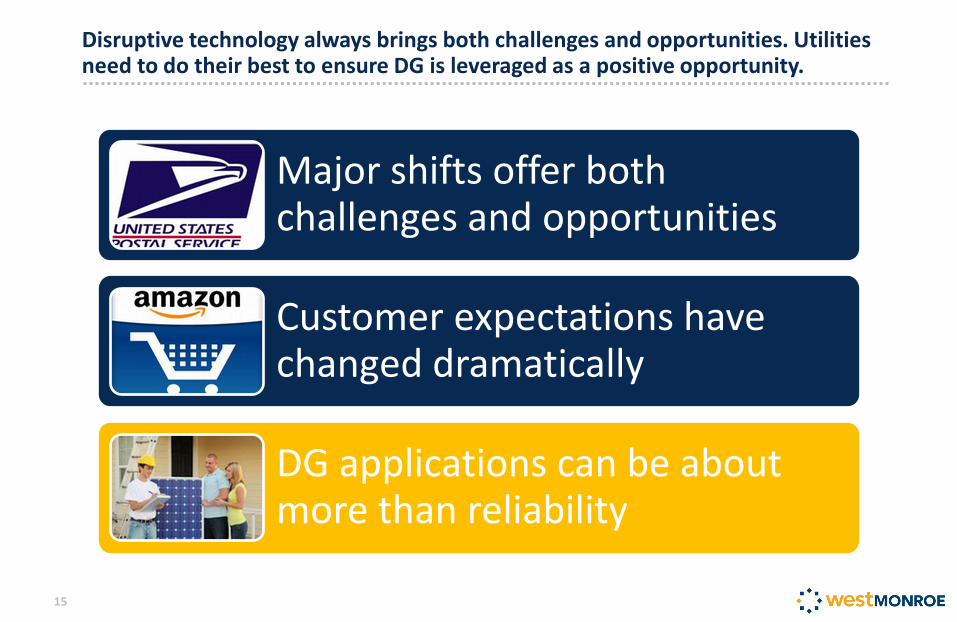
Disruptive technology always brings both challenges and opportunities. Utilities need to do their best to ensure DG is leveraged as a positive opportunity.
15
Major shifts offer both challenges and opportunities
Customer expectations have changed dramatically
DG applications can be about more than reliability
Call Center
Internet
Social Networks
Interactive TV
Customer Interactions
Inte
ractive TV Fie
ld S
erv
ice
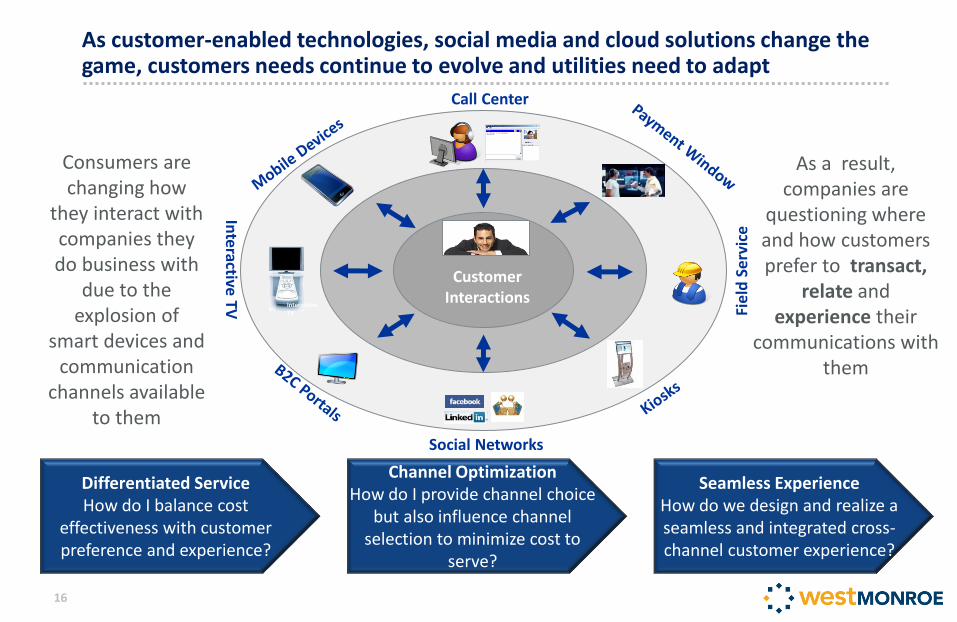
Differentiated Service How do I balance cost
effectiveness with customer preference and experience?
Channel Optimization How do I provide channel choice
but also influence channel selection to minimize cost to
serve?
Seamless Experience How do we design and realize a seamless and integrated cross-channel customer experience?
Consumers are changing how
they interact with companies they do business with
due to the explosion of
smart devices and communication
channels available to them
As a result, companies are
questioning where and how customers prefer to transact,
relate and experience their
communications with them
As customer-enabled technologies, social media and cloud solutions change the game, customers needs continue to evolve and utilities need to adapt
16
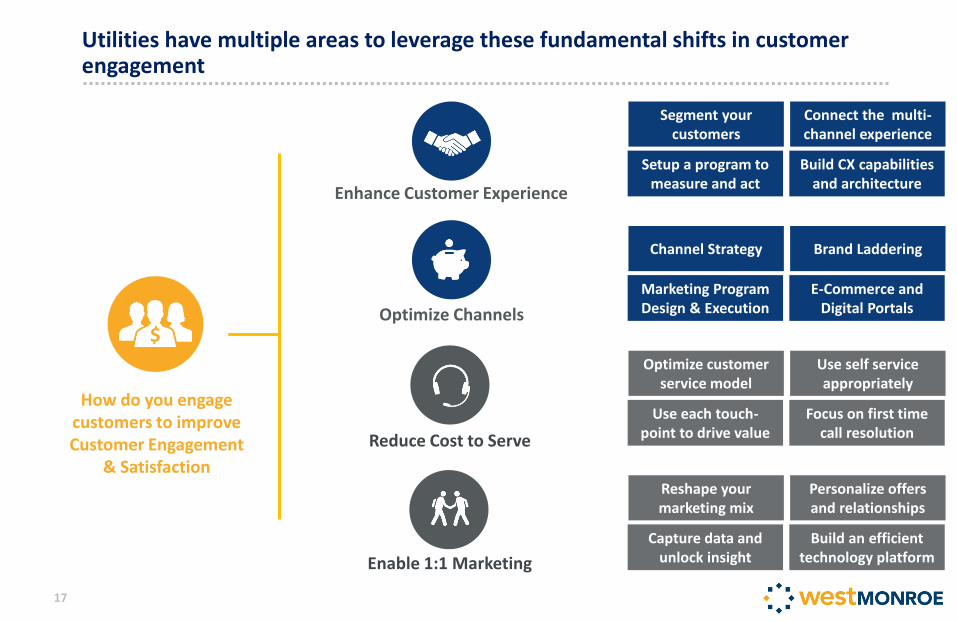
Utilities have multiple areas to leverage these fundamental shifts in customer engagement
17
$
How do you engage customers to improve Customer Engagement
& Satisfaction
Enhance Customer Experience
Optimize Channels
Reduce Cost to Serve
Channel Strategy
Marketing Program Design & Execution
Enable 1:1 Marketing
Brand Laddering
E-Commerce and Digital Portals
Segment your customers
Setup a program to measure and act
Connect the multi-channel experience
Build CX capabilities and architecture
Reshape your marketing mix
Capture data and unlock insight
Personalize offers and relationships
Build an efficient technology platform
Optimize customer service model
Use each touch-point to drive value
Use self service appropriately
Focus on first time call resolution
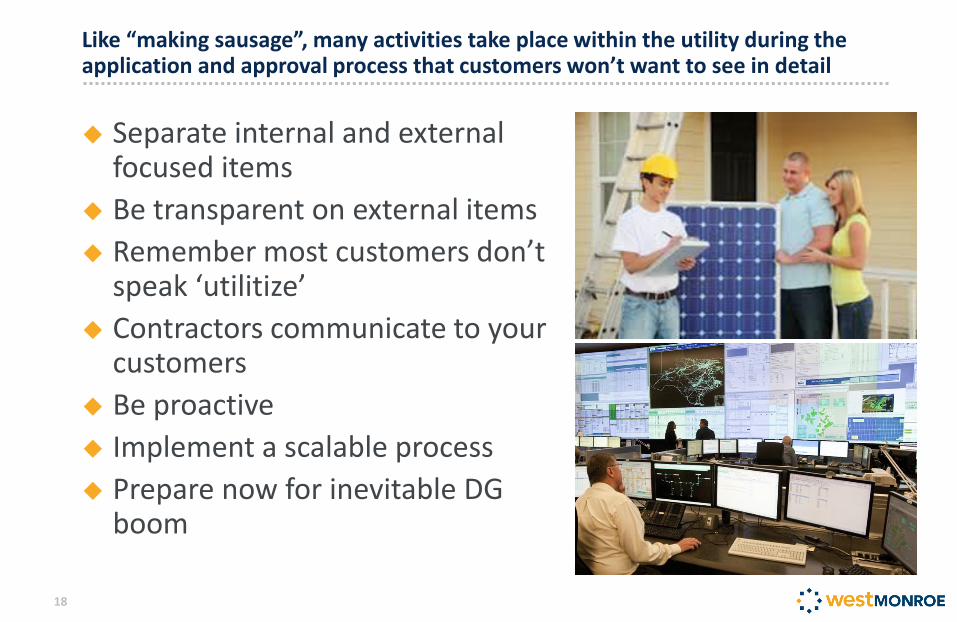
Separate internal and external focused items
Be transparent on external items
Remember most customers don’t speak ‘utilitize’
Contractors communicate to your customers
Be proactive
Implement a scalable process
Prepare now for inevitable DG boom
Like “making sausage”, many activities take place within the utility during the application and approval process that customers won’t want to see in detail
18
Highlight and promote customer benefits
Leverage interval data to offer proactive analysis and diagnostics Shows the utility is “trying to help”
Can also lead to word of mouth awareness on both the value of DG and the customer’s experience with the utility
“Close the Loop” and actively seek input and feedback from your customers.
Once the installation is complete, the utility still has the opportunity to be “more than another monthly bill”
19
These are opportunities to stay engaged with the customer while providing information they find valuable.
Solar enrollment processes and supporting technologies
20
A. Paper and telephone
B. Paper and email
C. Online form and email
D. Online form and account status
Question: What is the current solar interconnection application process approach?
21
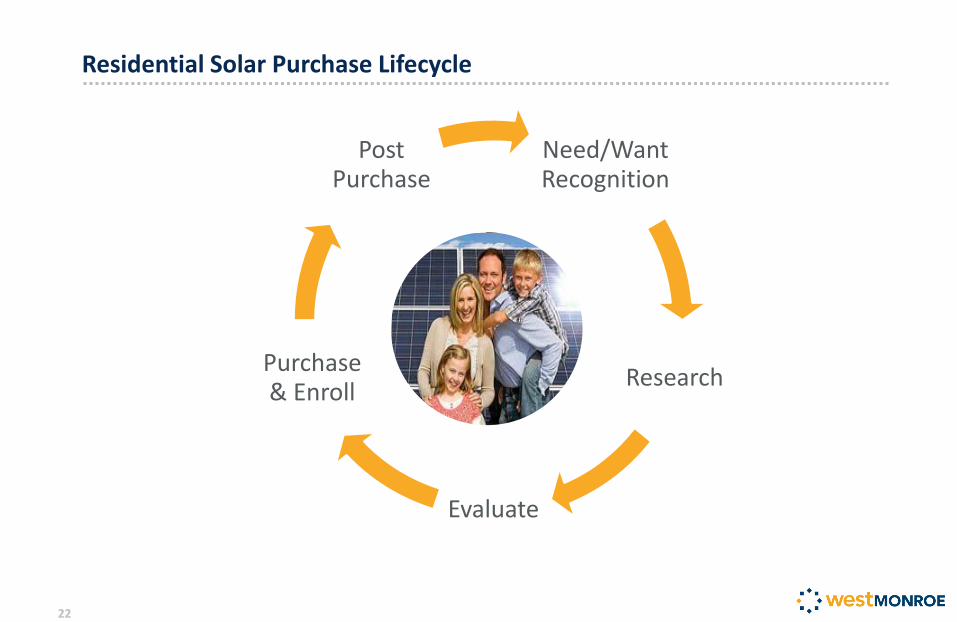
Need/Want Recognition
Research
Evaluate
Purchase & Enroll
Post Purchase
Residential Solar Purchase Lifecycle
22
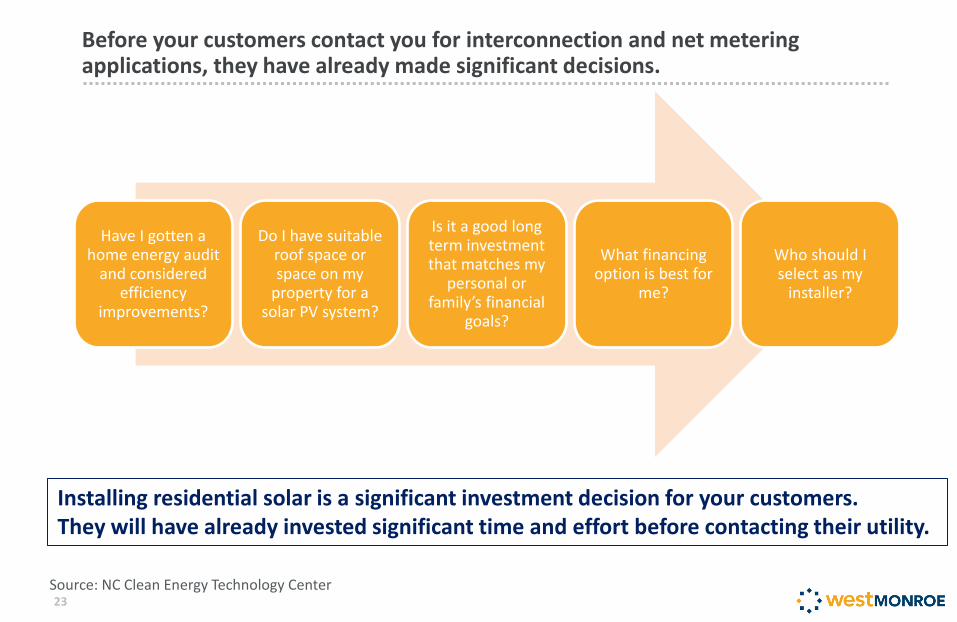
Have I gotten a home energy audit
and considered efficiency
improvements?
Do I have suitable roof space or space on my
property for a solar PV system?
Is it a good long term investment that matches my
personal or family’s financial
goals?
What financing option is best for
me?
Who should I select as my
installer?
Before your customers contact you for interconnection and net metering applications, they have already made significant decisions.
23 Source: NC Clean Energy Technology Center
Installing residential solar is a significant investment decision for your customers. They will have already invested significant time and effort before contacting their utility.
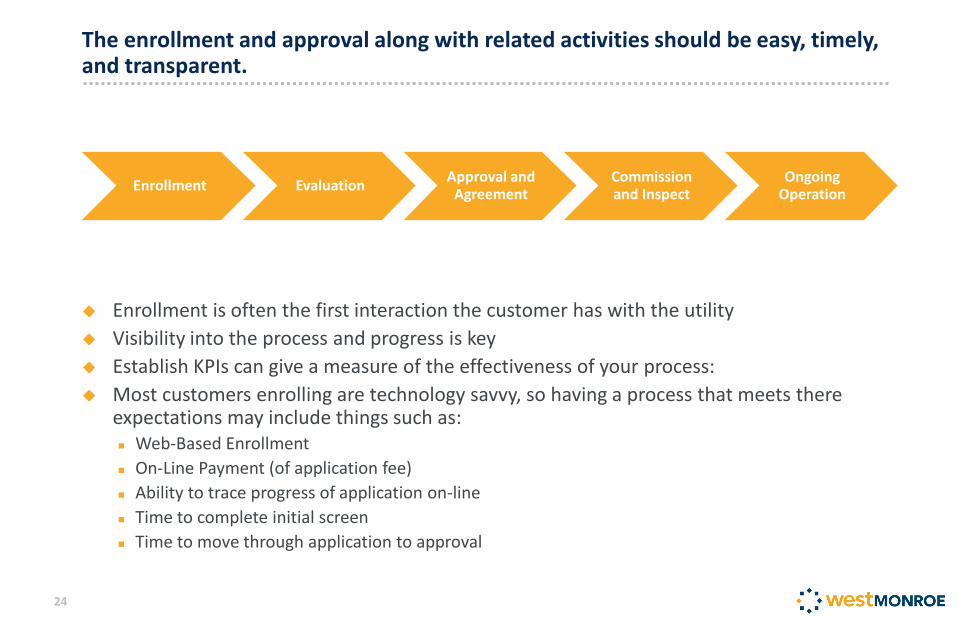
Enrollment Evaluation Approval and
Agreement Commission and Inspect
Ongoing Operation
Enrollment is often the first interaction the customer has with the utility
Visibility into the process and progress is key
Establish KPIs can give a measure of the effectiveness of your process:
Most customers enrolling are technology savvy, so having a process that meets there expectations may include things such as: Web-Based Enrollment
On-Line Payment (of application fee)
Ability to trace progress of application on-line
Time to complete initial screen
Time to move through application to approval
The enrollment and approval along with related activities should be easy, timely, and transparent.
24
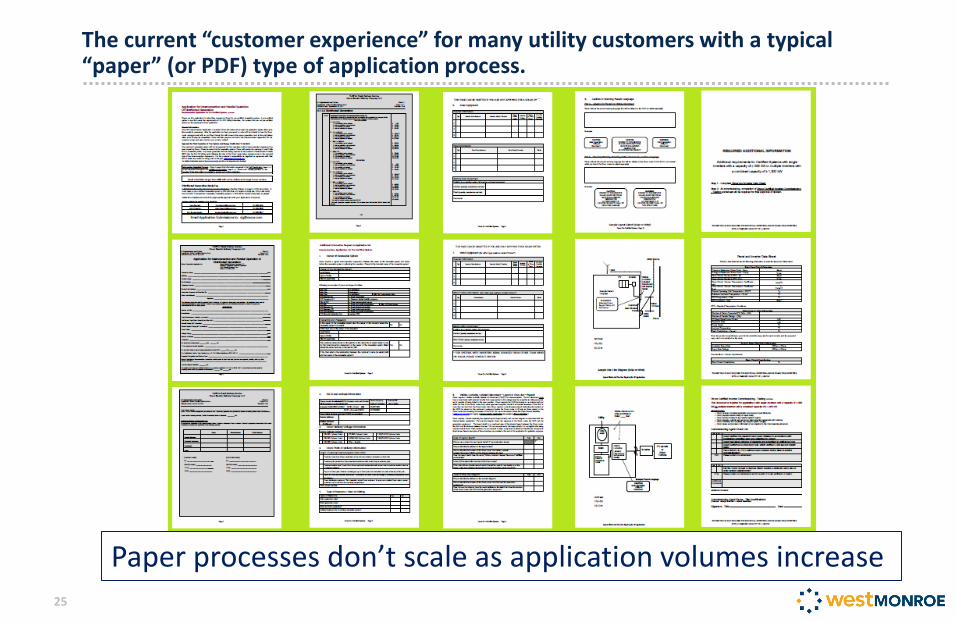
The current “customer experience” for many utility customers with a typical “paper” (or PDF) type of application process.
25
Paper processes don’t scale as application volumes increase
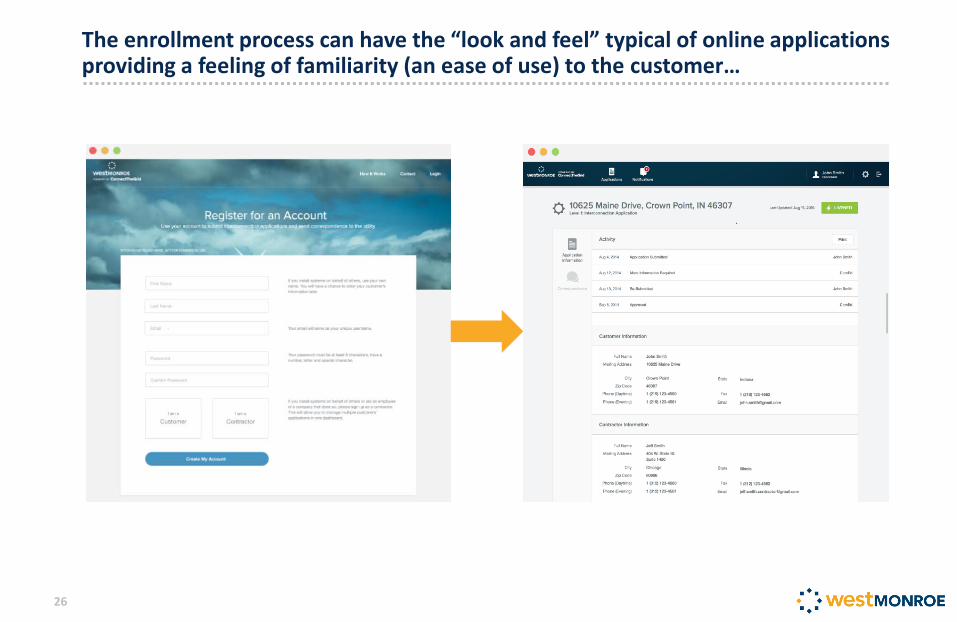
The enrollment process can have the “look and feel” typical of online applications providing a feeling of familiarity (an ease of use) to the customer…
26
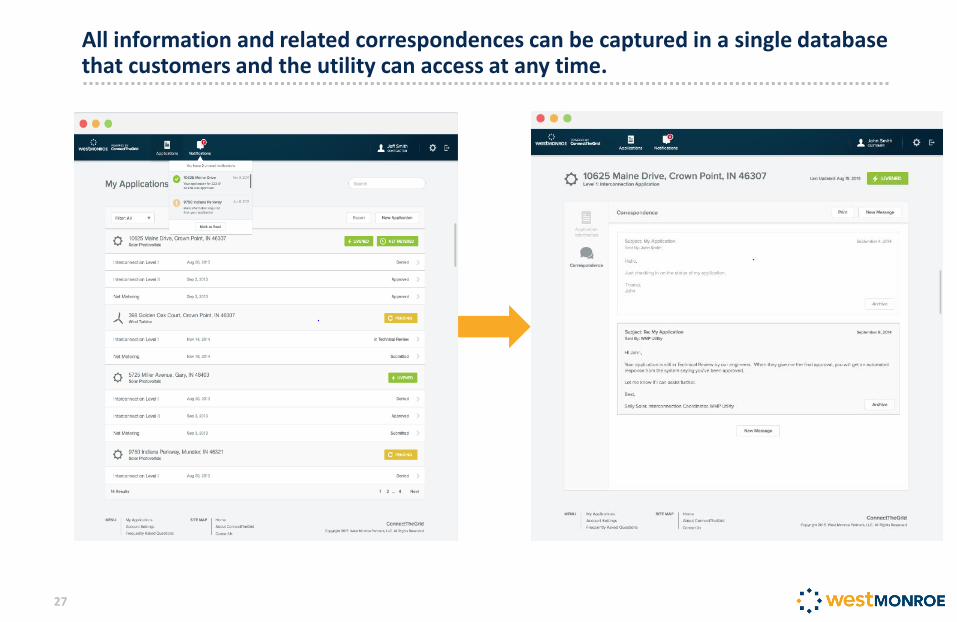
All information and related correspondences can be captured in a single database that customers and the utility can access at any time.
27
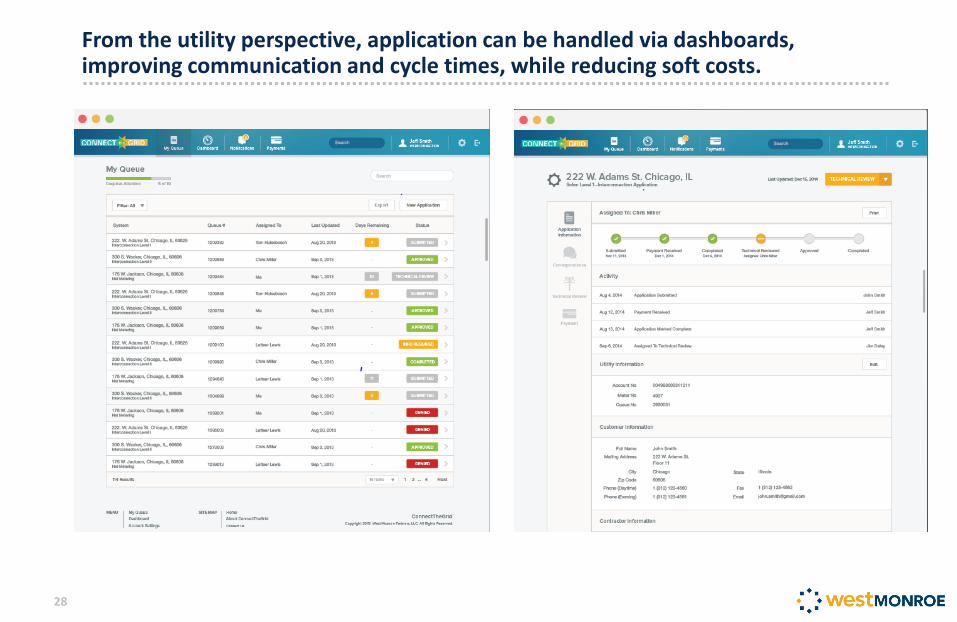
From the utility perspective, application can be handled via dashboards, improving communication and cycle times, while reducing soft costs.
28
A preview upcoming challenges and opportunities in distributed energy like community solar
29
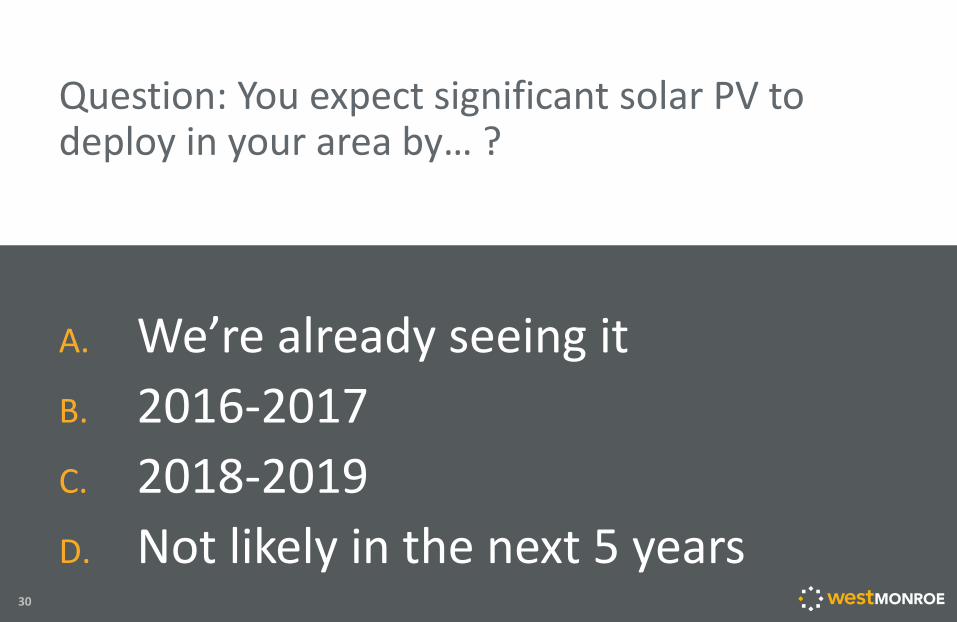
A. We’re already seeing it
B. 2016-2017
C. 2018-2019
D. Not likely in the next 5 years
Question: You expect significant solar PV to deploy in your area by… ?
30
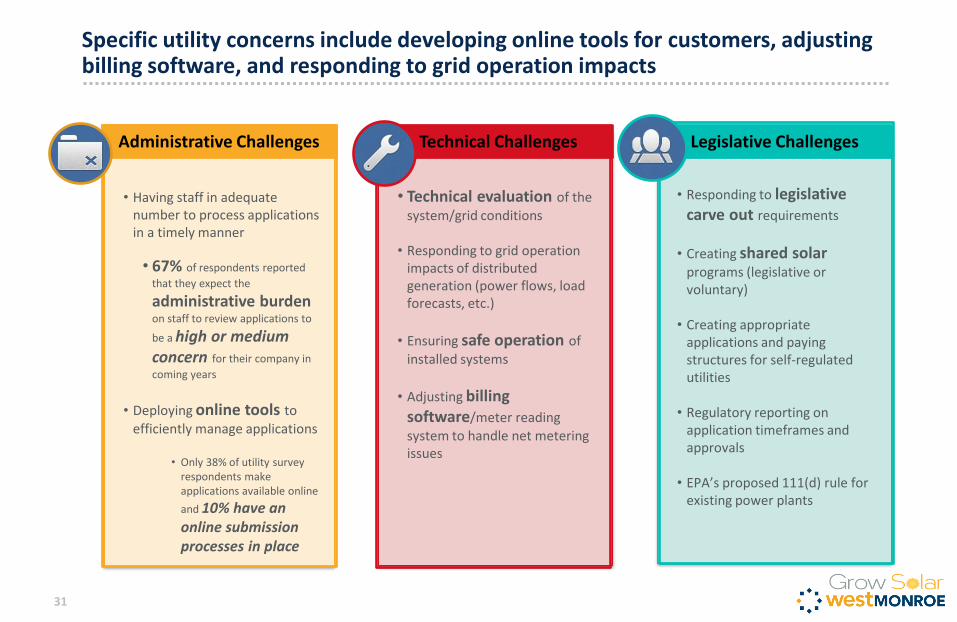
Specific utility concerns include developing online tools for customers, adjusting billing software, and responding to grid operation impacts
31
• Having staff in adequate
number to process applications in a timely manner
• 67% of respondents reported
that they expect the
administrative burden on staff to review applications to
be a high or medium concern for their company in
coming years
• Deploying online tools to
efficiently manage applications
• Only 38% of utility survey respondents make applications available online
and 10% have an online submission processes in place
• Technical evaluation of the
system/grid conditions
• Responding to grid operation impacts of distributed generation (power flows, load forecasts, etc.)
• Ensuring safe operation of installed systems
• Adjusting billing software/meter reading system to handle net metering issues
Technical Challenges
• Responding to legislative carve out requirements
• Creating shared solar programs (legislative or voluntary)
• Creating appropriate
applications and paying structures for self-regulated utilities
• Regulatory reporting on application timeframes and approvals
• EPA’s proposed 111(d) rule for existing power plants
Legislative Challenges Administrative Challenges
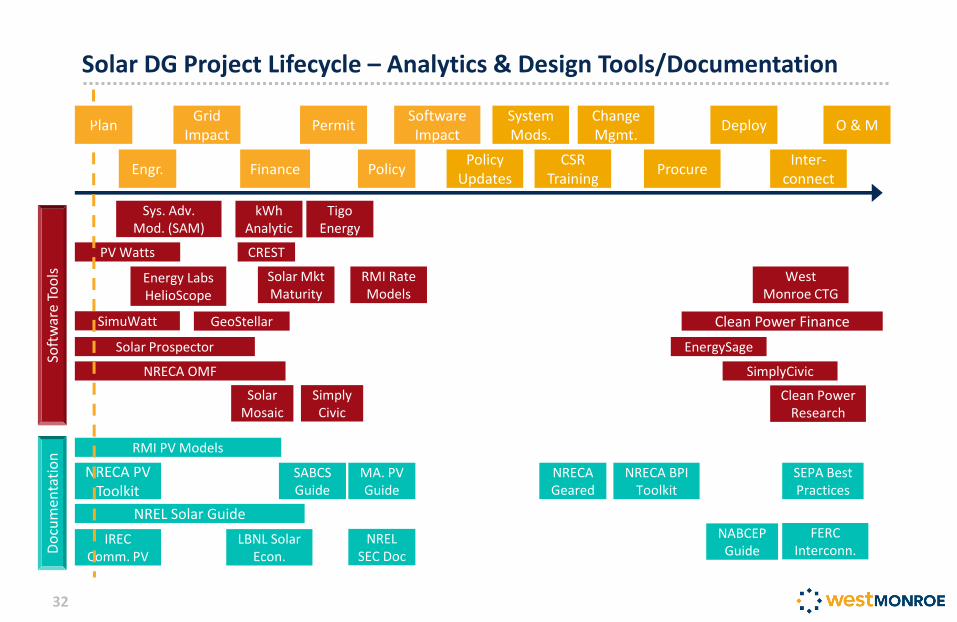
Solar DG Project Lifecycle – Analytics & Design Tools/Documentation
32
Engr. Policy
Deploy O & M
Soft
war
e To
ols
D
ocu
men
tati
on
PV Watts CREST
Energy Labs HelioScope
GeoStellar
SimplyCivic
Solar Prospector
Tigo Energy
Solar Mkt Maturity
Clean Power Finance SimuWatt
Solar Mosaic
NRECA PV Toolkit
NREL Solar Guide
IREC Comm. PV
LBNL Solar Econ.
RMI PV Models
Plan
Finance
Permit Grid
Impact Software Impact
Policy Updates
System Mods.
CSR Training
Procure
Change Mgmt.
Sys. Adv. Mod. (SAM)
NRECA OMF
Simply Civic
Inter-connect
RMI Rate Models
kWh Analytic
EnergySage
MA. PV Guide
NRECA Geared
NRECA BPI Toolkit
SEPA Best Practices
West Monroe CTG
Clean Power Research
NREL SEC Doc
FERC Interconn.
SABCS Guide
NABCEP Guide
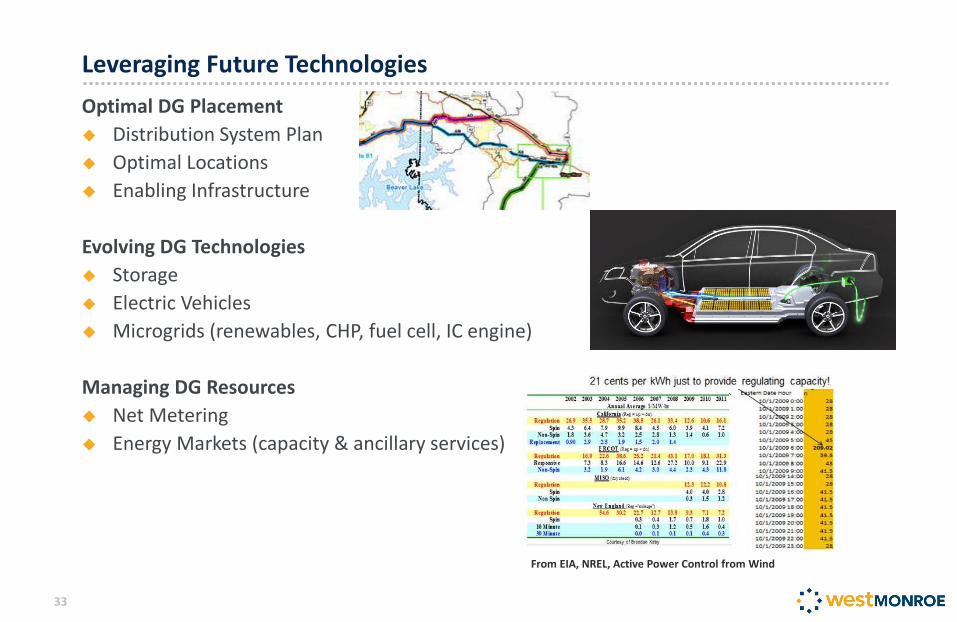
Optimal DG Placement
Distribution System Plan
Optimal Locations
Enabling Infrastructure
Evolving DG Technologies
Storage
Electric Vehicles
Microgrids (renewables, CHP, fuel cell, IC engine)
Managing DG Resources
Net Metering
Energy Markets (capacity & ancillary services)
Leveraging Future Technologies
33
From EIA, NREL, Active Power Control from Wind
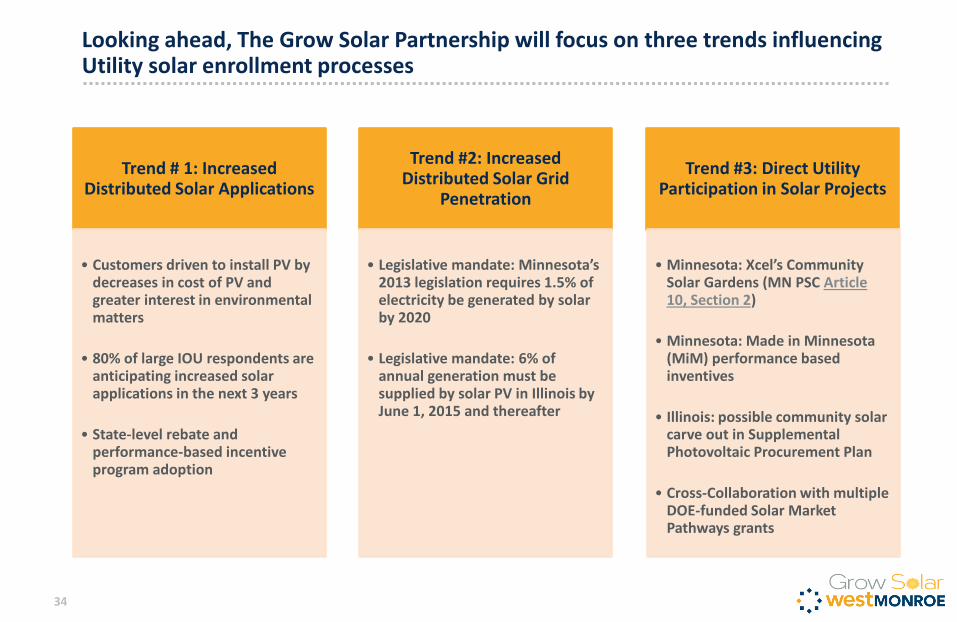
Trend # 1: Increased Distributed Solar Applications
• Customers driven to install PV by decreases in cost of PV and greater interest in environmental matters
• 80% of large IOU respondents are anticipating increased solar applications in the next 3 years
• State-level rebate and performance-based incentive program adoption
Trend #2: Increased Distributed Solar Grid
Penetration
• Legislative mandate: Minnesota’s 2013 legislation requires 1.5% of electricity be generated by solar by 2020
• Legislative mandate: 6% of annual generation must be supplied by solar PV in Illinois by June 1, 2015 and thereafter
Trend #3: Direct Utility Participation in Solar Projects
• Minnesota: Xcel’s Community Solar Gardens (MN PSC Article 10, Section 2)
• Minnesota: Made in Minnesota (MiM) performance based inventives
• Illinois: possible community solar carve out in Supplemental Photovoltaic Procurement Plan
• Cross-Collaboration with multiple DOE-funded Solar Market Pathways grants
Looking ahead, The Grow Solar Partnership will focus on three trends influencing Utility solar enrollment processes
34
Questions?
35